1
Instruction Manual
3390
POWER ANALYZER
December 2010 Revised edition 1 3390A981-01 10-12H
i
Contents
Contents
1
Introduction.................................................................................1
Confirming Package Contents....................................................1
2
Safety Notes...............................................................................3
Usage Notes...............................................................................5
Chapter 1
Overview ___________________________________ 9
3
4
1.1
Product Overview ................................................................ 9
1.2
Features ............................................................................ 10
1.3
Operating Overview ..........................................................12
5
Chapter 2
Names and Functions of Parts,
Basic Operations & Screens__________________ 13
6
2.1
Names and Functions of Parts .......................................... 13
2.2
Basic Operations ............................................................... 16
2.3
Display Items and Screen Types ...................................... 17
2.3.1
2.3.2
2.3.3
7
Common Display Items ..........................................................17
Measurement Screen .............................................................18
Screen Types .........................................................................19
8
Chapter 3
Measurement Preparations___________________ 23
9
3.1
Operations in general ........................................................ 23
3.2
Initial Instrument Preparations .......................................... 24
3.3
Pre-Operation Inspection .................................................. 26
3.4
Connecting the Power Cord ..............................................27
3.5
Grounding the Instrument's Functional Earth
(when measuring in noisy environments) ......................... 27
3.6
Connecting the Voltage Measurement Cables ................. 28
3.7
Connecting the Current Sensors ....................................... 28
3.8
Turning the Power On and Off .......................................... 29
3.9
Selecting the Wiring Mode ................................................30
3.10 Attaching to the Lines to be Measured and Zero Adjustment 34
3.11 Verifying Correct Wiring (Connection Check) ................... 36
10
11
12
付
録
索
引
ii
Contents
Chapter 4
Viewing Measurement Values _________________ 37
4.1
Measurement Value Display Procedure ........................... 37
4.2
Viewing Power Measurements, and Changing the
Measurement Configuration ............................................. 41
4.2.1
4.2.2
4.2.3
4.2.4
4.2.5
4.2.6
4.2.7
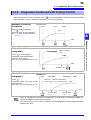
4.3
Integration Value Observation .......................................... 53
4.3.1
4.3.2
4.3.3
4.3.4
4.4
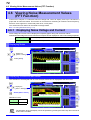
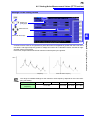
Displaying Noise Voltage and Current ................................... 72
Setting the Sampling Frequency and Points .......................... 73
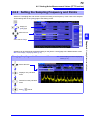
Setting the Minimum Noise Frequency .................................. 74
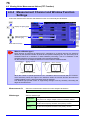
Measurement Channel and Window Function Settings ......... 76
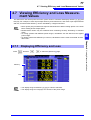
Viewing Efficiency and Loss Measurement Values .......... 77
4.7.1
4.7.2
4.7.3
4.8
Displaying Waveforms ........................................................... 69
Resizing Waveforms .............................................................. 71
Viewing Noise Measurement Values (FFT Function) ....... 72
4.6.1
4.6.2
4.6.3
4.6.4
4.7
Displaying the Harmonic Bar Graph ...................................... 62
Displaying the Harmonic List ................................................. 64
Displaying Harmonic Vectors ................................................. 65
Selecting the Harmonic Sync Source .................................... 67
Selecting the THD Calculation Method .................................. 68
Viewing Waveforms .......................................................... 69
4.5.1
4.5.2
4.6
Displaying Integration Values ................................................ 53
Setting the Integration Mode .................................................. 56
Manual Integration Method .................................................... 57
Integration Combined with Timing Control ............................. 59
Viewing Harmonic Measurement Values .......................... 62
4.4.1
4.4.2
4.4.3
4.4.4
4.4.5
4.5
Displaying Power Measurements .......................................... 41
Selecting Ranges ................................................................... 43
Selecting the Sync Source ..................................................... 47
Frequency Measurement Settings ......................................... 49
Selecting the Rectification Method ......................................... 50
Setting Scaling (when using VT(PT) or CT) ........................... 51
Setting the Low-Pass Filter .................................................... 52
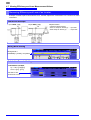
Displaying Efficiency and Loss .............................................. 77
Selecting the Calculation Formula ......................................... 78
Measurement Examples ........................................................ 79
Viewing Motor Measurement Values
(With Hioki 9791 or 9793 installed) ................................... 82
4.8.1
4.8.2
Motor Input Settings ............................................................... 84
Measuring Motor Electrical Angle .......................................... 89
iii
Contents
Chapter 5
Operating Functions ________________________ 91
5.1
Timing Control Functions .................................................. 91
5.2
Averaging Function ...........................................................93
5.3
Data Hold and Peak Hold Functions .................................94
5.3.1
5.3.2
Data Hold Function .................................................................94
Peak Hold Function ................................................................95
5.4
X-Y Plot Function .............................................................. 97
5.5
Δ-YConversion Function ................................................... 98
Chapter 6
Changing System Settings ___________________ 99
6.1
Initializing the Instrument (System Reset) ......................101
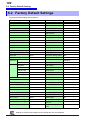
6.2
Factory Default Settings .................................................. 102
Chapter 7
Data Saving and File Operations _____________ 103
7.1
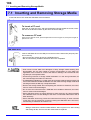
Inserting and Removing Storage Media .......................... 104
7.2
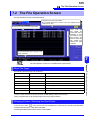
The File Operation Screen ..............................................105
7.3
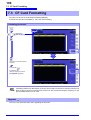
CF Card Formatting ........................................................106
7.4
Saving Operations ..........................................................107
7.5
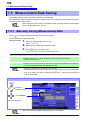
Measurement Data Saving .............................................108
7.5.1
7.5.2
7.5.3
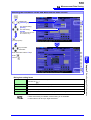
Manually Saving Measurement Data ....................................108
Auto-Saving Measurement Data ..........................................110
Selecting Measurement Items to Save .................................112
7.6
Saving Waveform Data ................................................... 114
7.7
Saving Screen Capture Images ...................................... 114
7.8
Saving Setting Configurations ......................................... 115
7.9
Reloading Setting Configurations ................................... 116
7.10 File and Folder Operations .............................................117
7.10.1
7.10.2
7.10.3
7.10.4
11
12
13
3
4
4
5
5
6
6
7
7
8
9
10
11
Creating Folders ...................................................................117
Copying Files and Folders ....................................................118
Deleting Files and Folders ....................................................120
Renaming Files and Folders .................................................121
付
録
索
引
iv
Contents
Chapter 8
Connecting External Devices ________________ 123
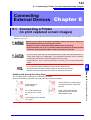
8.1
Connecting a Printer (to print captured screen images) . 123
8.1.1
8.1.2
8.1.3
Printer Preparation and Connection ..................................... 124
Settings to Use Printer ......................................................... 125
Printing Screen Captures ..................................................... 126
8.2
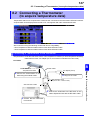
Connecting a Thermometer (to acquire temperature data) 127
8.3
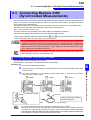
Connecting Multiple 3390 (Synchronized Measurements) 129
8.4
Using Analog and Waveform D/A Output Options
(must be factory installed before shipping) ..................... 132
8.4.1
8.4.2
8.4.3
8.4.4
8.5
Connecting Application-Specific Devices to the Instrument . 132
Output Item Selection .......................................................... 134
Output Level ........................................................................ 136
D/A Output Examples .......................................................... 137
Using the Motor Testing Option (when specified before
factory shipping, for motor analysis) ............................... 138
Chapter 9
Operation with a Computer __________________ 141
9.1
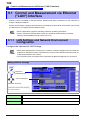
Control and Measurement via Ethernet ("LAN") Interface 142
9.1.1
9.1.2
9.2
Remote Control of the Instrument by Internet Browser .. 146
9.2.1
9.2.2
9.3
LAN Settings and Network Environment Configuration ....... 142
Instrument Connection ......................................................... 144
Connecting to the Instrument ............................................... 146
Operating Procedure ........................................................... 147
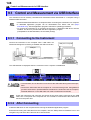
Control and Measurement via USB Interface ................. 148
9.3.1
9.3.2
Connecting to the Instrument ............................................... 148
After Connecting .................................................................. 148
Chapter 10
Specifications _____________________________ 149
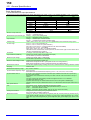
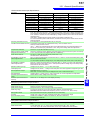
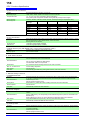
10.1 General Specifications .................................................... 149
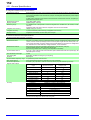
10.2 Functions Specifications ................................................. 156
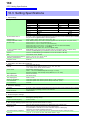
10.3 Setting Specifications ..................................................... 160
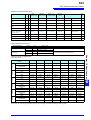
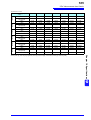
10.4 Measurement Item Details .............................................. 162
10.5 Calculation Formula Specifications ................................. 166
v
Contents
Chapter11
Maintenace and Service ____________________ 175
11.1 Cleaning .......................................................................... 175
11.2 Trouble Shooting ............................................................. 175
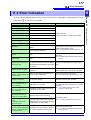
11.3 Error Indication ................................................................ 177
11.4 Disposing of the Instrument ............................................181
11
12
13
3
Appendix__________________________________A1
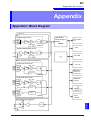
Appendix1Block Diagram ............................................................. A1
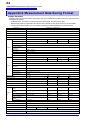
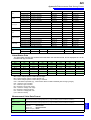
Appendix2Measurement Data Saving Format.............................. A2
4
4
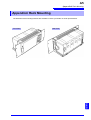
Appendix3Physical Illustration...................................................... A4
Appendix4Rack Mounting............................................................. A5
Index ______________________________________ i
5
5
6
6
7
7
8
9
10
11
Appendix
Index
vi
Contents
1
Introduction
Introduction
Thank you for purchasing the HIOKI "3390 POWER ANALYZER". To obtain maximum performance from
the product, please read this manual first, and keep it handy for future reference.
In this document, the "instrument" means the Model 3390 Power Analyzer.To measure current, the power
analyzer requires clamp-on current probes or AC/DC current probes (Options, (p. 2), afterwards referred
to generically as “current sensors”). See your current sensor’s instruction manual for details.
Registered trademarks
• CompactFlash is a registered trademark of Sandisk Corporation (USA).Windows is a registered trademark of Microsoft Corporation in the United States and/or other countries.
• Sun, Sun Microsystems, Java, and any logos containing Sun or Java are trademarks or registered
trademarks of Sun Microsystems, Inc. in the United States and other countries.
• Adobe and Reader are either registered trademarks or trademarks of Adobe Systems Incorporated in
the United States and/or other countries.
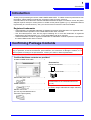
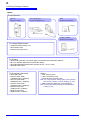
Confirming Package Contents
When you receive the instrument, inspect it carefully to ensure that no damage occurred during shipping. In particular, check the accessories, panel switches, and connectors. If damage is evident, or if it
fails to operate according to the specifications, contact your dealer or Hioki representative.
Confirm that these contents are provided.
3390 POWER ANALYZER ....................... 1
Accessories
Instruction Manual ...................................... 1
Measurement Guide................................... 1
Grounded power cord ................................ 1
USB Cable ................................................. 1
Please attach to the instrument before use.
(p. 24)
Input Cable Labels ..................................... 2
(to identify voltage cable leads and input channels)
D-Sub Connector ....................................... 1
(for use only with Model 9792 or
9793 D/A output options)
2
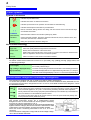
Confirming Package Contents
Option
Current Sensors
9272-10
Clamp On Sensor
9277, 9278, 9279
Universal Clamp On CT
9709
AC/DC Current Sensor
CT6862, CT6863
AC/DC Current Sensor
For Voltage Measurement
• L9438-50 Voltage Cord (p. 24)
• 9243 Grabber Clip
• 9448 Concent Input Cord
For Printing
•
•
•
•
9670 Printer (includes one thermal paper roll, Sanei Electric Model BL-80RS II)
9671 AC Adapter (Sanei Electric Model BL-100W)
9237 RECORDING PAPER (thermal paper 80 mm × 25 m, 4 rolls)
9638 RS-232C Cable
For Computer Connection
Others
• 9642 LAN Cable
• 9726 PC Card 128M
(128MB CFCard + Adapter)
• 9727 PC Card 256M
(256MB CFCard + Adapter)
• 9728 PC Card 512M
(512MB CFCard + Adapter)
• 9729 PC Card 1GB
(1GB CFCard + Adapter)
• 9830 PC Card 2GB
(2GB CFCard + Adapter)
• 9794 Carrying Case
• L9217 Connection Cord
(for Model 9791 and the 9793)
See "8.5 Using the Motor Testing Option (when specified
before factory shipping, for motor analysis)" (p. 138)
• 9683 Connection Cable (for synchronization)
See "Connecting Multiple 3390 (Synchronized Measurements)" (p. 129)
3
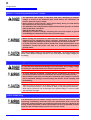
Safety Notes
Safety Notes
This instrument is designed to comply with IEC 61010 Safety Standards, and has
been thoroughly tested for safety prior to shipment. However, mishandling during use could result in injury or death, as well as damage to the instrument. However, using the instrument in a way not described in this manual may negate the
provided safety features.
Be certain that you understand the instructions and precautions in the manual
before use. We disclaim any responsibility for accidents or injuries not resulting
directly from instrument defects.
This manual contains information and warnings essential for safe operation of the product and for maintaining it in safe operating condition. Before using the product, be sure to carefully read the following
safety notes.
Safety Symbols
In the manual, the
symbol indicates particularly important information that the user should
read before using the product.
The
symbol printed on the product indicates that the user should refer to a corresponding
topic in the manual (marked with the symbol) before using the relevant function.
Indicates a grounding terminal.
Indicates the ON side of the power switch.
Indicates the OFF side of the power switch.
The following symbols in this manual indicate the relative importance of cautions and warnings.
Indicates that incorrect operation presents a significant hazard that could result in serious injury
or death to the user.
Indicates that incorrect operation presents a significant hazard that could result in serious injury
or death to the user.
Indicates that incorrect operation presents a possibility of injury to the user or damage to the
product.
Advisory items related to performance or correct operation of the product.
Symbols for Various Standards
WEEE marking:
This symbol indicates that the electrical and electronic appliance is put on the EU market after August
13, 2005, and producers of the Member States are required to display it on the appliance under Article
11.2 of Directive 2002/96/EC (WEEE).
This symbol indicates that the product conforms to safety regulations set out by the EC Directive.
This symbol indicates applicability to the Electrical Appliance and Material Safety law (Japan only).
4
Safety Notes
Other Symbols
Symbols in this manual
Indicates the prohibited action.
(p. )
Indicates the location of reference information.
Indicates quick references for operation and remedies for troubleshooting.
*
Indicates that descriptive information is provided below.
[
Menus, commands, dialogs, buttons in a dialog, and other names on the screen and the keys
are indicated in brackets.
]
CURSOR
(Bold character)
Bold characters within the text indicate operating key labels.
Windows
Unless otherwise specified, “Windows” represents Windows 95, 98, Me, Widows NT4.0, Windows 2000, Windows XP, or Windows Vista.
Dialog
Dialog box represents a Windows dialog box.
Mouse action terminology
Click:
Press and quickly release the left button of the mouse.
Right-click:
Press and quickly release the right button of the mouse.
Double click:
Quickly click the left button of the mouse twice.
Drag:
While holding down the left button of the mouse, move the mouse and then release the left
button to deposit the chosen item in the desired position.
Activate:
Click on a window on the screen to activate that window.
Accuracy
We define measurement tolerances in terms of f.s. (full scale), rdg. (reading) and dgt. (digit) values, with
the following meanings:
f.s. (maximum display value or
scale length):
The maximum displayable value or scale length. This is usually the name of
the currently selected range.
rdg. (reading or displayed value):
The value currently being measured and indicated on the measuring instrument.
dgt. (resolution):
The smallest displayable unit on a digital measuring instrument, i.e., the input
value that causes the digital display to show a "1" as the least-significant digit.
Measurement categories (Overvoltage categories)
This instrument complies with CAT II (1000 V)/ III (600 V) safety requirements.
To ensure safe operation of measurement instruments, IEC 61010 establishes safety standards for various electrical environments, categorized as CAT I to CAT IV, and called measurement categories. These
are defined as follows.
CAT Ⅰ :
Secondary electrical circuits connected to an AC electrical outlet through a transformer or similar device.
CAT Ⅱ :
Primary electrical circuits in equipment connected to an AC electrical outlet by a power cord (portable
tools, household appliances, etc.) CAT II covers directly measuring electrical outlet receptacles.
CAT Ⅲ :
Primary electrical circuits of heavy equipment (fixed installations) connected directly to the distribution
panel, and feeders from the distribution panel to outlets.
CAT Ⅳ :
The circuit from the service drop to the service entrance, and to the power meter and primary overcurrent protection device (distribution panel).
Higher-numbered categories correspond to electrical environments
with greater momentary energy. So a measurement device
designed for CAT III environments can endure greater momentary
energy than a device designed for CAT II.
Using a measurement instrument in an environment designated with a
higher-numbered category than that for which the instrument is rated
could result in a severe accident, and must be carefully avoided.
Never use a CAT I measuring instrument in CAT II, III, or IV environments.
The measurement categories comply with the Overvoltage Categories of the IEC60664 Standards.
5
Usage Notes
Usage Notes
Follow these precautions to ensure safe operation and to obtain the full benefits of the various functions.
Before Use
Before using the instrument the first time, verify that it operates normally to ensure that the no damage
occurred during storage or shipping. If you find any damage, contact your dealer or Hioki representative.
Before using the instrument, make sure that the insulation on the voltage cords
is undamaged and that no bare conductors are improperly exposed. Using the
instrument in such conditions could cause an electric shock, so contact your
dealer or Hioki representative for replacements.
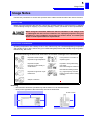
Instrument Installation
Operating temperature and humidity to RH or less, Indoors only (non-condensatingStoring temperature
and humidity to RH or less, Indoors only (non-condensatingTemperature and humidity range for guaranteed accuracy, RH or less
Avoid the following locations that could cause an accident or damage to the instrument.
Exposed to direct sunlight
Exposed to high temperature
In the presence of corrosive or
explosive gases
Exposed to liquids
Exposed to high humidity or
condensation
Exposed to strong electromagnetic fields
Near electromagnetic radiators
Exposed to high levels of particulate dust
Near induction heating systems
(e.g., high-frequency induction
heating systems and IH cooking
utensils)
Subject to vibration
Installing
• The instrument should be operated only with the bottom or rear side downwards.
• Vents (on the right side of the instrument) must not be obstructed.
50 mm or more
50 mm or more
6
Usage Notes
Shipping precautions
Hioki disclaims responsibility for any direct or indirect damages that may occur when this instrument has
been combined with other devices by a systems integrator prior to sale, or when it is resold.
Handling the Instrument
To avoid electric shock, do not remove the instrument's case. The internal components of the instrument carry high voltages and may become very hot during
operation.
• If the instrument exhibits abnormal operation or display during use, review the information in Troubleshooting section "11.2 Trouble Shooting" (p. 175) and Error Indications section "11.3 Error Indication" (p. 177) before contacting your dealer or
Hioki representative.
• To avoid damage to the instrument, protect it from physical shock when transporting
and handling. Be especially careful to avoid physical shock from dropping.
• To avoid damage to the instrument, protect it from physical shock when transporting
and handling. Be especially careful to avoid physical shock from dropping.
• To move the instrument, first disconnect all cables, remove any CF card and USB
memory, and carry it by the handle.
• Do not apply heavy downward pressure with the stand extended. The stand could
be damaged.
See "Using the Handle as a Stand" (p. 13)
7
Usage Notes
Handling the cords and current sensors
Connect the current sensors or voltage cords to the instrument first, and then to
the active lines to be measured. Observe the following to avoid electric shock
and short circuits.
• Do not allow the voltage cord clips to touch two wires at the same time. Never
touch the edge of the metal clips.
• When the current sensor is opened, do not allow the metal part of the clamp to
touch any exposed metal, or to short between two lines, and do not use over
bare conductors.
• To avoid short circuits and potentially life-threatening hazards, never attach the
current sensor to a circuit that operates at more than the maximum rated voltage to earth (See your current sensor's instruction manual for its maximum ratings.) Current sensor and voltage cables should only be connected to the
secondary side of a breaker, so the breaker can prevent an accident if a short
circuit occurs. Connections should never be made to the primary side of a
breaker, because unrestricted current flow could cause a serious accident if a
short circuit occurs.
• Connect only those voltage cables necessary for measurement.
In order to use the 9709 AC/DC Current Sensor, the line to be measured must be
temporarily disconnected.
To avoid shock and short circuits,turn off the power to lines to be measured
before making connections to terminals to be measured and turning on the
instrument.
• To avoid electric shock and short-circuit accidents, use only the specified voltage
cord to connect the instrument input terminals to the circuit to be tested.
• For safety reasons, when taking measurements, only use the optional voltage cord.
• Avoid stepping on or pinching cables, which could damage the cable insulation.
• To avoid breaking the cables, do not bend or pull them.
• To prevent an electric shock accident, confirm that the white or red portion (insulation layer) inside the cable is not exposed. If a color inside the cable is exposed, do
not use the cable.
• To avoid damaging the power cord, grasp the plug, not the cord, when unplugging it
from the power outlet.
• Keep the cables well away from heat sources, as bare conductors could be exposed
if the insulation melts.
• Be careful to avoid dropping the current sensors or otherwise subjecting them to
mechanical shock, which could damage the mating surfaces of the core and
adversely affect measurement.
• Be careful when handling the cords, since the conductor being measured may
become very hot.
• When disconnecting the connector, be sure to release the lock before pulling off the
connector. Forcibly pulling the connector without releasing the lock, or pulling on the
cable, can damage the connector.
• To prevent damage to the instrument and current sensors, never connect or disconnect a sensor while the power is on, or while the sensor is clamped around a conductor.
8
Usage Notes
Before Connecting Measurement Cables
• The maximum input voltage is 1500 VDC, 1500 Vrms. Attempting to measure
voltage in excess of the maximum input could destroy the instrument and
result in personal injury or death.
• Never exceed a current sensor’s input current rating. Doing so could destroy
the instrument and cause personal injury.
• The maximum rated voltage between input terminals and the ground is as follows;
(CAT II) 1000 VDC, 1000 Vrms
(CAT III) 600 VDC, 600 Vrms
Attempting to measure voltages exceeding this level with respect to ground
could damage the instrument and result in personal injury.
• Before turning the instrument on, make sure the source voltage matches that
indicated on the instrument's power connector. Connection to an improper
supply voltage may damage the product and present an electrical hazard.
• To avoid electrical accidents and to maintain the safety specifications of this
instrument, connect the power cord only to a 3-contact (two-conductor +
ground) outlet.
The power supply voltage for this product is switchable. To avoid electrical accidents, check that the voltage selector is set correctly for the supply voltage you
are using.
Before Connecting to the Lines to be Measured
To avoid electrical hazards and damage to the instrument, do not apply voltage/
exceeding the rated maximum to the external input terminals.
• To avoid electrical accidents, confirm that all connections are secure. The
increased resistance of loose connections can lead to overheating and fire.
• Ensure that the input does not exceed the maximum input voltage or current to
avoid instrument damage, short-circuiting and electric shock resulting from
heat building.
• When the power is turned off, do not apply voltage or current to the voltage input terminals, current input terminals, or current sensors. Doing so may damage the instrument.
• Note that the instrument may be damaged if the applied voltage or current exceeds
the measurement range.
While Measuring
If an abnormality such as smoke, strange sound or offensive smell occurs, stop
measuring immediately, disconnect from the measurement lines, turn off the
instrument, unplug the power cord from the outlet, and undo any changes to the
wiring. Contact your dealer or Hioki representative as soon as possible. Continuing to use the instrument may result in fire or electric shock.
9
1.1 Product Overview
Chapter 1
1.1 Product Overview
The HIOKI 3390 Power Analyzer is a high-precision, broad-range instrument for measuring electrical
power from DC to inverter frequencies. Four input channels are provided to support single- and threephase inverter motor system measurements.
For developing and evaluating high efficiency inverter motors
• High precision and stability ensure highly reproducible power measurements
• Electrical phase angle measurements necessary for motor analysis
• Measure motor efficiency by connecting with a high precision torque meter or encoder.
For developing and evaluating alternative energy sources such as solar,
wind power, and fuel cells
• Simultaneously measure AC and DC power.
• Separately measure power input, sold, consumed, and regenerated using the DC mode and the current and integrated power (electrical energy) in RMS mode.
• Save long-term measurement data to high-capacity storage media.
For inverter motor maintenance
• Easily measure inverter secondary power on site.
• Simultaneously measure primary and secondary inverter power.
• Measure inverter noise.
Chapter 1 Overview
Overview
1
10
1.2 Features
Supports multiple power system configurations
• Four isolated voltage and current input channels are provided to support simultaneous multisystem measurements such as inverter primary and secondary power.
• Measure power system wiring configurations from single-phase to three-phase, four-wire.
• Broad frequency range (0.5 Hz to 5 kHz fundamental) supports DC to inverter frequencies.
High accuracy over a broad range
• Basic accuracy is ±0.05% rdg. ±0.05% f.s. at DC and from 0.5 Hz to 150 kHz.
• Precise measurements over a broad range of inverter carrier frequencies: ±0.2% rdg. ±0.1% f.s.
at 10 kHz, and ±1.5% rdg. ±0.5% f.s. at 100 kHz.
Provides both fast data processing and high accuracy
• While maintaining high accuracy, power measurements and harmonic analysis updates every
50 ms.
• During low-frequency measurements, data is automatically updated in sync with frequency, so
no refresh (data update rate) switching is needed when changing from low to high rotation
rates.
Extensive data analysis functions are included as standard features
• Simultaneously measure RMS, mean, AC and DC components, and fundamental waveforms.
• Perform harmonic analysis up to the 100th order and inverter noise (FFT) analysis up to 100
kHz.
• Display high-speed waveforms sampled at up to 500 kS/s.
• Perform multifaceted analysis with X-Y graph functions.
Simultaneous analysis of all parameters
• Simultaneously analyzes harmonics and noise while performing integration and displaying
waveforms.
Supports measurements with both easy-to-use clamp probes and highprecision penetrating probes
• Select from various AC and AC/DC clamp-on current probes with ranges from 20 to 500 A.
• Measure high currents with high precision using clamp-on current sensor probes.
• Clamp-on current probes eliminate the need for problematic direct contact with wiring.
• In-phase effects on inverter measurements are greatly reduced by isolating current sensors
from the measurement objects.
Single-unit instrument ideal for portable as well as rack-mount
applications
• Small and light weight (4.8 kg), with a convenient carrying handle (p. 13).
• Rack mountable in 170 mm (EIA 4U) vertical space (p. 179).
11
1.2 Features
Variety of interfaces are equipped in standard
• Includes 100 Mbps Ethernet and USB 2.0 High Speed communications interfaces.
• Provides a dedicated front-panel USB port and CF card slot for removable storage devices.
• Supports high-capacity media for high-speed data storage.
PC application program provides remote control and data acquisition (p. 141)
• With the instrument connected to a computer by Ethernet or USB cable, use the PC application
program to acquire data on the computer and control the instrument remotely. Download the PC
application program from Hioki's website. (http://www.hioki.com)
• Even without the PC application program, the same operations can be performed using a
browser to access the HTTP server function.
Wiring confirmation function avoids wiring mistakes (p. 36)
• The vector display avoids wiring mistakes by confirming even complicated three-phase wiring.
Multi-instrument synchronization capability supports additional
measuremnet channels (p. 129)
• Measure with up to four instruments simultaneously.
• Slave instruments measure and record data in synchronization with the master instrument.
• Using the PC application program, synchronously acquire and record data on up to four instruments.
Prepared for motor evaluation options (p. 138)
• Motor power can be determined by measuring torque meter output and rotation rate.
• Supports both analog DC and frequency-output-type torque measurement inputs.
• Supports both analog DC and rotation pulse outputs for measurement inputs.
• Supports encoder Z-phase signals for phase measurements with standard encoder pulses.
D/A output option for waveform output (p. 132)
• Outputs up to 16 analog measurement parameters on 16 D/A output channels.
• Voltage and current waveforms sampled at 500 kHz in the waveform output mode provide
safely isolated voltage and current waveforms for other waveform measuring instruments.
Easy-to-see color LCD (p. 13)
• Includes a 9-inch color TFT LCD.
• Easily view waveforms and graphs on the wide-screen 800 × 480 dot display.
Radiation thermometer connection support (p. 127)
• Connect to the RS-232C interface for simultaneous temperature recording.
Printer connection support (p. 123)
• Connect an optional printer to print screen captures on site.
Chapter 1 Overview
• Supports high-speed data communication systems.
1
12
1.3 Operating Overview
Be sure to read "Usage Notes" (p. 5) before measuring.
Follow the procedures below to perform measurements. Data saving and analysis on the computer can
be performed as necessary.
Initial Instrument Preparations
See 3.2 ( p.24)
Pre-Operation Inspection
See 3.3 ( p.26)
Always perform these checks before connecting, and when turning the power on.
Installing the Instrument
See "Instrument Installation" (p. 5)
Connecting Cables and Probes, and
Turning Power On
See 3.4 ( p.27) to 3.8 ( p.29)
Connecting and Checking Connections
to Measurement Objects
For high-precision measurements, allow at least
30 minutes warm-up after power-on before executing zero adjustment.
Always execute zero adjustment before connecting to measurement objects.
See 3.9 ( p.30) to 3.11 ( p.36)
Viewing Measurement Values
See Chapter 4 ( p.37)
Press the
with the
key, and select display contents
,
and F keys.
See "2.2 Basic Operations" (p. 16)
Saving
Manual saving
Press the
Save in realtimecontrol
.
After pressing
saving
starts at the specified start
See Chapter 7 ( p.103) time.
Stops automatically at the
specified stop time.
Press the
key to force
stop.
Analyzing Saved Data on a Computer
See Chapter 9 ( p.141)
Turning Power Off
See 3.8 ( p.29)
Save timer control
Save interval control
Press
to save for
a specified time span.
Press
to start.
Save the specified time span.
Stops automatically
when the specified time
has elapsed.
Press the
key to
force stop.
Press
to stop.
When the timer and real-time
control are set, stops at the
specified time.
Connect the instrument to a computer with the supplied USB cable or an Ethernet cable and use the
dedicated PC application program to transfer data to
the computer for analysis. This also enables remote
operation and control of the instrument.
13
2.1 Names and Functions of Parts
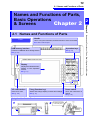
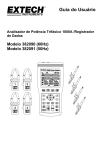
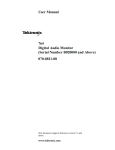
2.1 Names and Functions of Parts
Front
Handle
Use to carry the instrument, and fold it down to serve as a stand.
See Latter of this chapter
USB memory interface
Operation keys
Connect a USB flash drive storage device.
See (p. 14)
See (p. 103)
Display
Displays the Measurement,
Setting, or File Operation
screen.
See (p. 17)
CF card interface
F key (Function key)
Power switch
Insert a CF card.
Select and change display contents and settings.
See (p. 104)
See (p. 16)
Turns the instrument on
and off.
See (p. 29)
Using the Handle as a Stand
1
Press
2
Press
Rotate the handle
to the click point.
Keep on
pressing
Chapter 2 Names and Functions of Parts, Basic Operations & Screens
Names and Functions of Parts,
Basic Operations
2
Chapter 2
& Screens
14
2.1 Names and Functions of Parts
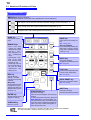
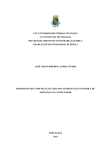
Operation keys
MENU keys (Screen selection)
Press a key to select a screen (the lit key indicates the current selection).
Displays the Measurement screen for viewing measurement values. Voltage and current ranges can be selected, and low-pass filter settings can be changed.(p. 19)
Displays the Setting screen for setting measurement criteria, wiring mode (phase systems), wiring check and system environment configuration.(p. 20)
Displays the File Operation screen for performing file operations on data saved to
storage media, and selecting data file formats.(p. 21)
PAGE key
Changes the screen
page.
SAVE key
RANGE keys
(Screen Capture)
Saves data to the storage media.
See 7.5.2 (p.110)
• The U + and – keys
change the voltage
measurement range,
and the I + and –
keys change the current measurement
range.
• Pressing the + and –
keys at the same
time activates Auto
Ranging (p. 44).
• These keys also set
the low-pass filter (p.
52) and the lower
measurement
limit
setting (p. 49).
Press SAVE while holding the
SHIFT key to capture a screen
image to the specified storage
media. (p. 114)
HOLD key
(Lit when running)
Toggles the peak-hold function.
See 5.3 (p.94)
0 ADJ key
Performs zero adjustment and
current sensor degaussing.
See 3.10 (p.34)
ESC key
Cancels the last
change to a setting,
and returns it to its original state.
DATA RESET key
Resets the integration values.
See 4.3.1 (p.53)
(Key-lock)
Hold for three seconds
to toggle the key lock.
The key lock state is indicated at the top of the
screen.(p. 17)
ENTER key
Accepts selections and
changes to settings.
CURSOR key
Move the cursors.
SHIFT key
START/STOP key
(Lit when running)
(Lit when running)
Activates alternate key functions.
Starts and stops integration and saving operations.
To restart integration and saving: Press the
DATA RESET key to reset integration values, then press this key. (Press the START/
STOP key without resetting the integrated
value if you wish to add the integration result to the previous one.)
• When the key lock function is enabled, all other key operations are disabled.
• The key lock state is retained even when power is off.
15
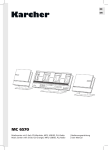
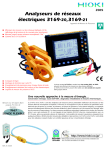
2.1 Names and Functions of Parts
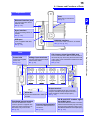
Right side
Vent
Keep clear of obstructions.
See (p. 5)
Ethernet interface jack
Sync interface
For synchronizing cables, as
needed.
See (p. 129)
USB port
RS-232C interface
For the supplied USB cable,
as needed.
See (p. 148)
For RS-232C cable connection, as needed.
See (p. 123), (p. 127)
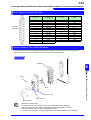
Rear
CH A torque signal input BNC jack
Power inlet
Voltage input terminals
Connect the supplied
power cord.
See (p. 27)
Connect Hioki-specified voltage
measurement cables.
See (p. 28)
Connect the Hioki L9217 BNC connection cable to
this terminal (only when using the 9791 Motor Evaluation option or the 9793 Motor Evaluation and D/A
Output option).
See (p. 138)
Output terminal
Serial No.
This is the instrument’s serial
number.
Connect the supplied D-sub plug (only when
using the 9792 D/A Output option or the 9793
Motor Evaluation and D/A Output option).
See (p. 132)
CH B and CH Z rotation signal
input BNC jacks
Functional ground terminal
Connect this terminal to a clean
common ground to suppress electrical noise when measuring in an
electrically noisy environment.
See (p. 27)
Current input terminals
Connect an Hioki-specified current sensor.
See (p. 28)
Connect the Hioki L9217 BNC connection
cable to these terminals (only when using
the 9791 Motor Evaluation option or the
9793 Motor Evaluation and D/A output option).
See (p. 138)
2
Chapter 2 Names and Functions of Parts, Basic Operations & Screens
For LAN connection with an
Ethernet cable.
See (p. 144)
16
2.2 Basic Operations
2.2 Basic Operations
To select a display screen
Press
,
sponding screen.
, or
To select the displayed screen page
to display the corre-
Press the
keys to change.
See (p. 19), (p. 21)
See (p. 19) to (p. 21)
Help comment
To select and change display contents and settings
Describes the object at the current
cursor position (only on Setting and
File Operations screens).
Press one of the F keys to select and change display contents and settings. The displayed function labels depend on
the currently displayed screen.
Special Setting Items
Next
This appears when more than six setting
items are available. Press F6 to display the
function labels of the additional items.
All CH Set
Select to apply the same setting to all channels.
Using [All CH Set]
(For example, to enable auto-ranging on all channels.)
CH1
CH2
1 Set any channel to
[AUTO].
CH3
CH4
3 All channels are set to
[AUTO].
2 Select [All CH Set]
17
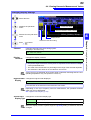
2.3 Display Items and Screen Types
2.3 Display Items and Screen Types
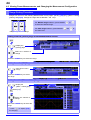
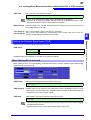
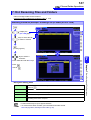
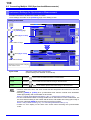
2.3.1 Common Display Items
2
These items are displayed on every screen.
Displayed Page
5 Operating State Indicators 2 Key-Lock Indicator 4 Real-Time Clock
3 Interface Indicators
1
Storage Media Indicators
Level indicators for the CF card and USB memory
stick. The used storage space is indicated in yellow, and it turns to red when the media is 95% full.
2
Key-Lock Indicator
Lights to indicate Key Lock is active
(keys are locked), after holding the
key for three seconds.
3
Interface Indicators
Lights when the instrument is connected to a computer by USB cable
(and the computer is on).
Lights when the instrument is connected to a LAN.
Indicates a printer is connected to the
RS-232 interface.
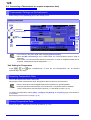
Indicates a thermometer is connected
to the RS-232 interface.
Red: Temperature data has not been
acquired.
Blue: Temperature data has been
acquired.
4
1 Media-Busy Indicator
Real-time clock
Displays the current date and time.
To set the Clock: (p. 101)
5 Operating State Indicators
Lights during integration and recording.
Indicates integration is in progress.
Indicates integration is stopped.
Indicates Data Hold is active.
Indicates Peak Hold is active.
Chapter 2 Names and Functions of Parts, Basic Operations & Screens
Displayed Screen
18
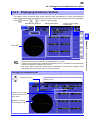
2.3 Display Items and Screen Types
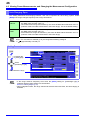
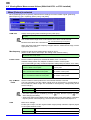
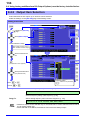
2.3.2 Measurement Screen
These display items appear only on the Measurement screen.
sync
9 Δ-Y Conversion 8 Harmonic
7 Sync source
source
2 Wiring mode
4 low-pass filter
measure6 lower
ment limit
3 Voltage range 3 Current range 5 Average
1 Peak Over display indicators
Sync Unlocked
Current peak overrange
Voltage peakoverrange
1 Peak Over display indicators
These indicators appear in red at the bottom of
each channel page tab (CH1 to CH4). These indicate (from the left) when voltage and current peaks
ranges are exceeded (p. 40), and when synchronization is unlocked (p. 48).
Indicates the averaging setting state (p. 93).
The setting is made on the Setting screen.
6 Lower measurement limit
Displays the lower measurement limit setting (p. 49).
2 Wiring mode
Indicates the selected wiring mode (p. 30). The wiring mode (phase system selection) must be set to
match actual measurement connections.
3 Voltage range/Current range
• Indicate the voltage and current range settings.
• The settings are made by the RANGE keys (p. 44).
• When the range has been set manually, [MANU]
appears.
• When the auto-ranging is enabled, [AUTO]
appears (p. 43).
4 Low-pass filter
key while pressing an
LPF key (one of the left-most
keys).
or
To change the setting, hold the
key while
pressing a LOW FREQ key (one of the right-most
or
7
RANGE keys).
Sync source
Indicates the synchronization source signal that
determines the period (between zero crossings)
used as the basis for all calculations.(p. 47) The setting is made on the Input Settings page of the Settings screen.
8 Harmonic sync source
Indicates the synchronization signal source used for
harmonic measurements.(p. 67) The setting is made
on the Input Settings page of the Settings screen.
Indicates the low-pass filter setting (p. 52).
To change, hold the
5 Average
RANGE
9 Δ-Y Conversion
Indicates whether D-Y conversion is enabled or disabled (ON/OFF).(p. 98) The setting is made on the
Input Settings page of the Settings screen.
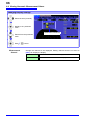
19
2.3 Display Items and Screen Types
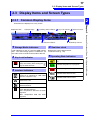
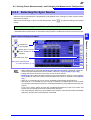
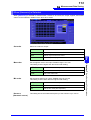
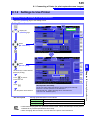
2.3.3 Screen Types
Measurement Screen (Press the
Press the
This screen displays measurement values.
key to display)
2
keys to change the screen page as follows.
[CH1 to CH4]
This page displays measured voltage, current, and
power on channels 1 to 4 as numerical values
and as vectors.
This page displays measured power, voltage and current
values, integration values, and provides access to
harmonic graphs and lists for each channel.
[Motor]
[Wave + Noise]
Appears only when
the Model 9791 Motor Testing option or
the 9793 Motor Testing & D/A Output option is installed.
This page displays measured values for the
motor analysis options.
This page displays voltage, current, and noise
waveforms. The waveforms can be saved.
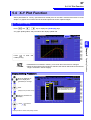
[XY Graph]
[Select]
This page displays an X-Y graph of measurement
parameters selected for horizontal and vertical
axes.
Select any parameter on this page for display.
[Efficiency]
This page displays the numerical values of efficiency
and loss determined by calculation formulas.
Chapter 2 Names and Functions of Parts, Basic Operations & Screens
[Vector]
20
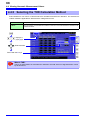
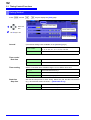
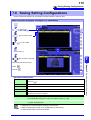
2.3 Display Items and Screen Types
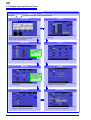
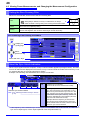
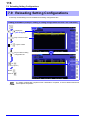
Setting Screen (Press the
Press the
key to display)
Use this screen to view and change settings for measurement criteria,
wiring mode, wiring check and system environment configuration.
keys to change the screen page as follows.
[Wiring]
[Input]
Select the appropriate wiring mode (phase system configurations) and execute quick setup on this page. Wiring diagrams for each mode depict the appropriate
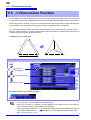
measurement cable connections.
[D/A Out]
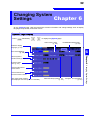
Make detailed measurement criteria settings on
this page.
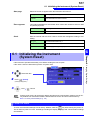
[Calc]
9792 D/A Output option or the 9793 Motor Testing & D/A
Output option is installed.
Make D/A output-related settings on this page.
[Motor]
Make calculation-related settings on this page.
[Time]
Appears only when
the Model 9791 Motor Testing option or
the 9793 Motor Testing & D/A Output option is installed.
Make motor measurement-related settings
on this page.
[System]
Configure system environment settings and
perform system reset on this page.
Set measurement timers and the number of parameters to save on this page.
[Interface]
Make settings related to synchronization, data
saving and interfaces on this page.
21
2.3 Display Items and Screen Types
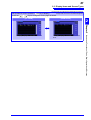
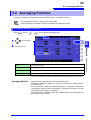
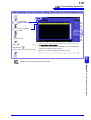
File Operations Screen (Press the
Press the
key to display)
Use this screen to configure saving of data files to removable
storage media, and to save and reload settings files.
keys to change the screen page as follows.
[CF card]
This page displays data files on a USB flash
drive.
2
Chapter 2 Names and Functions of Parts, Basic Operations & Screens
This page displays data files on a CF card.
[USB drive]
22
2.3 Display Items and Screen Types
23
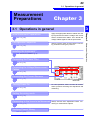
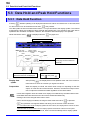
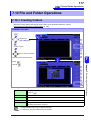
3.1 Operations in general
Measurement
Preparations
Chapter 3
3
3.1 Operations in general
See 3.2 ( p.24)
Pre-Operation Inspection
See 3.3 ( p.26)
Apply the appropriate adhesive labels near the
input jacks and around the voltage and current
sensor measurement cables. Then bundle the
voltage cables together with the spiral tubes.
Always perform these checks before connecting, and when turning the power on.
Installing the Instrument
See "Instrument Installation" (p. 5)
Connecting the Power Cord
See 3.4 ( p.27)
Connecting the Voltage Measurement
Cables
See 3.6 ( p.28)
Connecting the Current Sensors
See 3.7 ( p.28)
Back side
Turning Power On
See 3.8 ( p.29)
For best precision, allow at least 30 minutes
warm-up before executing zero adjustment and
measuring.
Setting the wiring mode
See 3.9 ( p.30)
Connecting to the Lines to be Measured
See 3.10 ( p.34)
Verifying Correct Wiring
See 3.11 ( p.36)
Always execute zero adjustment before connecting to measurement objects.
Chapter 3 Measurement Preparations
Initial Instrument Preparations
24
3.2 Initial Instrument Preparations
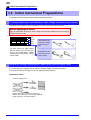
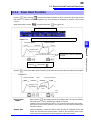
3.2 Initial Instrument Preparations
Perform the following before starting measurement the first time.
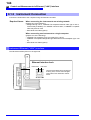
Put the provided input cord labels for each voltage cord and current sensor
The labels are provided to clearly indicate which cable connects to each input jack.
Before applying the labels
Wipe any dust from the surface of the voltage measurement cables and current sensors,
and ensure that it is dry.
Red
Yellow
Blue
Gray
Measurement Cable Labels
For each input jack, apply labels
with the same color near the jack
and to its corresponding voltage
measurement cable lead or clamp
sensor cable.
Apply labels to both
ends of the voltage
measurement cables
Apply labels to both
ends of the current
sensor cables.
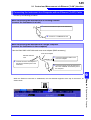
Bundle the voltage measurement cable leads with the spiral tubes
Five spiral tubes are supplied with the Model L9438-50 voltage measurement cables.
Use the spiral tubes as needed to wrap red and black leads together.
Preparation items
L9438-50 Voltage Cord
Alligator Clips (two, one each red and black)
Banana Plug Leads (two, one each red and black)
Spiral Tubes (five, for cable bundling)
25
3.2 Initial Instrument Preparations
Procedure
two cable leads (one each red and black) side-by-side.
1. Hold
Start bundling from one end of the leads.
tubes should be applied with suitable spacing.
Spiral tube
Red
Black
3
Chapter 3 Measurement Preparations
2. Wrap the two leads together with the spiral tube. The five supplied spiral
Wind the spiral tube around the leads.
26
3.3 Pre-Operation Inspection
3.3 Pre-Operation Inspection
Before using the instrument the first time, verify that it operates normally to ensure that the no damage
occurred during storage or shipping. If you find any damage, contact your dealer or Hioki representative.
1
Pre-connection inspection
Inspect the voltage measurement cables
Metal Exposed
Does any cable insulation appear damaged,
or is bare metal exposed?
Do not use if damage is present, as
you could receive an electric shock.
Contact your dealer or Hioki representative if you find any damage.
No Metal Exposed
Inspect the current sensors
Yes
Is a clamp cracked or damaged?
No
Inspect the instrument
Yes
Contact your dealer or Hioki representative if you find any damage.
Is damage to the instrument evident?
No
2 Power-on confirmation
Does the self-test (model and version) display
appear?
No
(The version number may be changed to the latest version number.)
Initial Screen
HIOKI 3390 POWER ANALYZER 1.00
The power cord may be damaged, or
the instrument may have internal
damage.
Please contact your dealer or Hioki
representative.
Yes
When the self-test finishes, does the [Wiring]
page of the Setting or Measurement screen
An error is displayed
The instrument may be
damaged internally.
Please contact your dealer
or Hioki representative.
Inspection complete
Yes
27
3.4 Connecting the Power Cord
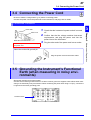
3.4 Connecting the Power Cord
Be sure to read the "Usage Notes" (p. 5) before connecting power.
Connect the power cord to the power inlet on the instrument, and plug it into an outlet.
Connection Procedure
Power Inlet
off.
2. Confirm that the line voltage matches instrument
Back side of the instrument
Turn off the power before disconnecting
the power cord.
requirements, and plug the power cord into the
power inlet on the instrument.
3. Plug the other end of the power cord into an outlet.
About the outlet with ground pin
Plug the power cord into the mains outlet.
3.5 Grounding the Instrument's Functional
Earth (when measuring in noisy environments)
Ground the instrument's functional earth.
Connect the functional ground terminal to a clean common ground to suppress noise effects when measuring in an electrically noisy environment. When measuring AC power lines using a VT (PT), connect the
PT ground to the same grounding point.
Functional earth
3
Chapter 3 Measurement Preparations
Power cord
1. Check that the instrument’s power switch is turned
28
3.6 Connecting the Voltage Measurement Cables
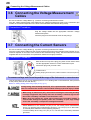
3.6 Connecting the Voltage Measurement
Cables
Be sure to read the “Usage Notes” (p. 7) before connecting measurement cables.
Plug the voltage measurement cable leads into the voltage measurement jacks on the instrument (the
number of connections depends on the lines to be measured and selected wiring mode).
Connection Procedure
Plug the voltage cables into the appropriate channels’ voltage
measurement jacks.
Insert the plugs into the terminals as far as they will go.
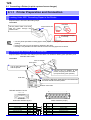
3.7 Connecting the Current Sensors
Be sure to read the "Usage Notes" (p. 5) before connecting measurement cables.
Plug the current sensor cables into the current measurement jacks on the instrument (the number of connections depends on the lines to be measured and selected wiring mode). See the instruction manual
supplied with the current sensor for specification details and usage procedures.
Connection Procedure
With the arrow on top of the plug, plug each current sensor cable
into the appropriate channel’s current measurement jack.
Insert each plug until you hear it lock.
To disconnect:
Holding the plug around its arrow, slide it forward to unlock, then pull out.
To measure voltage and current beyond the range of the instrument or current sensor
Use an external VT (PT) or CT. By specifying the VT or CT winding ratio on the instrument, the input level
at the primary side can be read directly.
See"4.2.6 Setting Scaling (when using VT(PT) or CT)" (p. 51)
During wiring, avoid touching the VT(PT), CT or input terminals. Exposed live contacts can cause electric shock or other accident resulting in personal injury or death.
• When using an external VT (PT), avoid short-circuiting the secondary winding.
If voltage is applied to the primary when the secondary is shorted, high current
flow in the secondary could burn it out and cause a fire.
• When using an external CT, avoid open-circuiting the secondary winding. If
current flows through the primary when the secondary is open, high voltage
across the secondary could present a dangerous hazard.
• Phase difference in an external VT (PT) or CT can cause power measurement
errors. For optimum power measurement accuracy, use a VT (PT) or CT that exhibits minimal phase difference at the operating frequency.
• To ensure safety when using a VT (PT) or CT, one side of the secondary should be
grounded.
29
3.8 Turning the Power On and Off
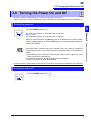
3.8 Turning the Power On and Off
Be sure to read the “Usage Notes” (p. 7) before turning the instrument on.
Connect the power cord and voltage and current measurement cables before turning the instrument on.
Turning the power on
3
Turn the POWER switch on ().
See 3.3 ( p.26)
The instrument performs a 10-second power-on self test.
When the self test finishes, the [Wiring] page of the Setting screen appears (initial
screen). If [Start page] is set to [Last Screen] (p. 101), the last displayed Measurement screen appears.
If the self-test fails, operation stops at the self-test screen. If the fault recurs after turning the power off and on, the instrument may be damaged. Perform the following procedure:
1. Stop measuring, disconnect the measurement cables from the object being measured, and turn the instrument off.
2. Disconnect the power cord and all cables from the instrument.
3. Contact your dealer or Hioki representative.
For best precision, allow at least 30 minutes warm-up before executing zero adjustment and measuring.
Turning the power off
Turn the POWER switch off (
).
Chapter 3 Measurement Preparations
The instrument performs a 10-second power-on self test.
30
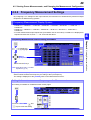
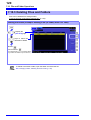
3.9 Selecting the Wiring Mode
3.9 Selecting the Wiring Mode
Select the wiring mode to match the phase system(s) to be measured. Eight wiring modes are available.
To open the [Wiring] page
Press the
key and select the [Wiring] page with the
.
To select the wiring mode
1
Press the
key to select
[Select] (or press the
key)
to display the pull-down menu.
2
3
1
Select the wiring mode
2
To accept the selection:
Press
(or the
key)
To cancel the selection:
Press
(or the
3
key)
Accepting the selection displays the wiring
diagram of the selected wiring mode.(p. 31)
• To measure multiphase power, use the same type of current sensor on each phase
line. For example, to measure 3-phase 4-wire power, use the same model current
sensors on channels 1 to 3.
• When using a current sensor with switchable sensor rating (such as Model 927210), set the sensor rating to match the rating of the line.
• When the selected wiring mode uses multiple channels, channel-specific settings
(such as voltage range) are linked to the first channel’s settings.
31
3.9 Selecting the Wiring Mode
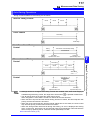
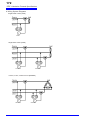
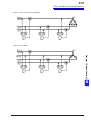
Wiring configuration diagram
Wiring Mode 1. Single-phase, 2-wire (1P2W) × 4
Wiring configuration diagram
Wiring Mode 2. Single-phase, 3-wire (1P3W) + single-phase, 2-wire (1P2W) × 2
Wiring Mode 3. 3-phase, 3-wire (3P3W2M) + single-phase, 2-wire (1P2W) × 2
Chapter 3 Measurement Preparations
See
Pages 172 and 173 for additional wiring diagrams.
3
32
3.9 Selecting the Wiring Mode
Wiring Mode 4. Single-phase, 3-wire (1P3W) × 2
Wiring Mode 5. 3-phase, 3-wire (3P3W2M) + single-phase, 3-wire (1P3W)
Wiring Mode 6. 3-phase, 3-wire (3P3W2M) × 2
33
3.9 Selecting the Wiring Mode
Wiring Mode 7. 3-phase, 3-wire (3P3W3M) + single-phase, 2-wire (1P2W)
3
Chapter 3 Measurement Preparations
Wiring Mode 8. 3-phase, 4-wire (3P4W3M) + single-phase, 2-wire (1P2W)
34
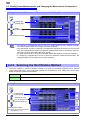
3.10 Attaching to the Lines to be Measured and Zero Adjustment
3.10 Attaching to the Lines to be Measured
and Zero Adjustment
Be sure to read the “"Usage Notes" (p. 5) before attaching to the lines.
Always perform zero adjustment before attaching to the lines.
Then attach the voltage measurement clips and current sensors to the measurement lines according to
the on-screen wiring diagrams. For proper accuracy, attach to the lines exactly as shown.*
* The diagram appears when the wiring mode is selected.(p. 30)
Although the instrument can measure multiple lines at the same time, to avoid
electric shock and short-circuit accidents, do not attach any unnecessary
cables.
The phases are named A, B, and C on the wiring diagram display. Substitute with
equivalent names such as R,S, and T or U,V, and W, as appropriate.
Zero Adjustment and Degaussing (DMAG)
To obtain the specified accuracy, after 30 minutes warm-up, perform zero-adjustment on both voltage
and current measurement channels.
When using an AC/DC current sensor, perform degaussing (DMAG) along with zero adjustment.
1. Press the
key.
2. Press the key.
[Execute Zero Adjust.] is displayed.
3. Press the key.(
to cancel.)
[Executing zero adjustment] is displayed for 30
seconds, until finished.
• Perform zero adjustment only after plugging the current sensor into the instrument (proper adjustment requires that the current sensor be connected).
• Perform zero adjustment before attaching to the lines to be measured (proper
adjustment requires the absence of any input voltage or current).
• For optimum measurement accuracy, zero adjustment should be performed
within the specified ambient temperature range.
• The operating keys are disabled during zero adjustment.
• When using a motor evaluation option, zero adjustment is not applicable for
analog DC input on channels A and B. Perform the special zero adjustment
from the Motor screen.
See"4.8 Viewing Motor Measurement Values (With Hioki 9791 or 9793 installed)" (p. 82)
Attach voltage measurement cables to measurement lines
Example: Secondary side of breaker
Securely clip the leads to metal parts such as load-side screw terminals or
bus bars.
L9438-50 Voltage Cord
35
3.10 Attaching to the Lines to be Measured and Zero Adjustment
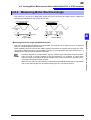
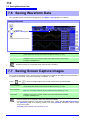
Attach current sensors to measurement lines
(Example: 9272-10)
Be sure to attach each clamp around only one conductor.
Correct measurement cannot be obtained if a clamp is attached around more than one conductor.
Shield
3
OK
Line
Make certain that the current flow direction
arrow points toward the load.
Source
side
Current Flow
Direction Arrow
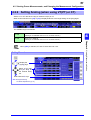
Easy set
If measurement line power is off, turn it on before performing quick setup.
1
2
Select [Easy Set] with the
key.
A confirmation dialog box appears.
To execute: Press
To cancel: press
.
1
What settings are affected by quick setup?
For accurate measurements, settings such as range and sync source must be properly configured. Executing quick setup automatically configures the following settings to the Hioki-recommended values for the selected wiring mode (phase system): voltage and current ranges, sync
source, lower measurement frequency limit, integration mode, harmonic sync source and rectification system.
Execute quick setup when using the instrument the first time, and when changing to a different
line configuration.
Chapter 3 Measurement Preparations
Load side
36
3.11 Verifying Correct Wiring (Connection Check)
3.11 Verifying Correct Wiring
(Connection Check)
Correct attachment to the lines is necessary for accurate measurements.
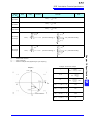
Refer to the measured values and vector displays to verify that the measurement cables are correctly attached.
For 1P2W systems
Verify that an appropriate
measurement value is displayed.
For systems other than 1P2W
• Verify that an appropriate measurement
value is displayed.
• Verify that the vectors
are displayed with the
appropriate range.
Measured voltage value
Measured current value
Measured active power value
Voltage
Vector line range
Current
Colors match the corresponding lines in the wiring diagram.
In this case
If the measured voltage value is
too high or too low
If the measured current value is
not correct
If the measured active power
value is negative
Check
• Are the cables securely plugged into the voltage measurement jacks on
the instrument? (p. 28)
• Are the voltage measurement cables properly attached to the lines? (p. 34)
• Are the cables securely plugged into the current measurement jacks on
the instrument? (p. 28)
• Are the current sensors properly attached to the lines? (p. 35)
• Are the current sensors appropriate for the line current to be measured?
• If using the 9272-10 Clamp Sensor, is the sensor range set correctly?
• Are the voltage measurement cables properly attached to the lines? (p. 34)
• Is the arrow marker on the current sensors pointing toward the load? (p. 35)
Voltage vectors:
• Are the cables securely plugged into voltage measurement jacks on the
instrument?(p. 28)
• Are the voltage measurement cable clips properly attached to the lines? (p. 34)
If vectors are too short, or
unequal
Current vectors:
• Are the cables securely plugged into the current measurement jacks on
the instrument? (p. 28)
• Are the current sensors properly attached to the lines? (p. 35)
• Are the current sensors appropriate for the line current to be measured?
• If using the 9272-10 Clamp Sensor, is the sensor range set correctly?
Voltage vectors:
If vector direction (phase) or
color is incorrect
• Check that the voltage measurement clips are attached to the lines
according to the wiring diagram.
Current vectors:
• Check that the current sensors are attached to the lines according to the
wiring diagram.
• The display range of the vector diagrams assumes inductive loads (such as with a motor).
The vectors may appear out of range when measuring near-zero power factor, or capacitive loads.
• When measuring multiple 1P3W or 3-phase lines at the same time, vectors are not displayed correctly when the harmonic sync source frequency is different from that of the lines to be measured.
• When measuring 3P3W2M systems, the active power (P) measured on each channel may
be negative.
37
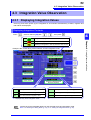
4.1 Measurement Value Display Procedure
Viewing
Measurement
Values
Chapter 4
4.1 Measurement Value Display Procedure
The following procedure displays measurement values.
Display the
[CH] page
Use the F keys to select
display contents
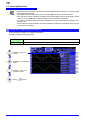
See Displays the Harmonic Graph or Harmonic List.
"4.4 Viewing Harmonic Measurement Values" (p. 62)
The above screen is specific to the wiring mode (here showing four 1P2W systems)
he number of measurement items displayed depends on the selected wiring mode.
See Section "3.9 Selecting the Wiring Mode" (p. 30) to set the wiring mode.
Chapter 4 Viewing Measurement Values
Display Procedure (the following shows 1P2W wiring mode)
4
38
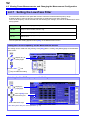
4.1 Measurement Value Display Procedure
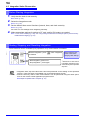
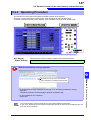
Selecting Measured Items for Display
From all measured items, select those you want to display on one screen.
Press
to display the [Select] page.
First press an F key to select the number of items to be displayed.
Four-Item Display
Eight-Item Display
Sixteen-Item Display
Thirtytwo-Item Display
39
4.1 Measurement Value Display Procedure
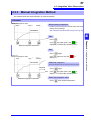
Display Item Selection Procedure
Display the
[Select] page
4
Move the cursor
to the item to change
Accept
(the pull-down menu
appears)
Select the item to
display
Enter
Press
Cancel
when finished making changes.
Chapter 4 Viewing Measurement Values
(a blinking cursor appears)
40
4.1 Measurement Value Display Procedure
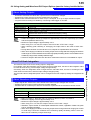
About Valid and Displayable Ranges
The valid measurement range (the range of guaranteed accuracy) is 1% to 110% of the full-scale range
(except that valid voltage is limited to 1000 V in the 1500 V scale).
The display range of this unit is between the zero surpress level to 120% of the measurement range.
The following display indicates over-range measurement.
See Zero surpress level: OFF, 0.1%f.s., 0.5%f.s. (initial setting) (p. 101)
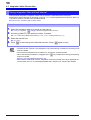
About Peak Over Indicators
Peak Over indicators light when an input voltage or current waveform peak value exceeds three times the
full-scale range (except the 1500 V range, when the voltage exceeds ±2000 V, see the figure below). The
indicators are shown on all screens, so that Peak Over can be seen even on channels not currently
selected.
Example. The following display indicates that the CH 1 voltage and CH 3 current are at Peak Over levels.
Peak Over current
Peak Over voltage
(red indicators)
41
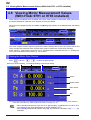
4.2 Viewing Power Measurements, and Changing the Measurement Configuration
4.2 Viewing Power Measurements, and
Changing the Measurement Configuration
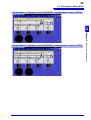
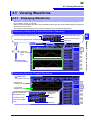
4.2.1 Displaying Power Measurements
When viewing power measurements, [Power], [Voltage], and [Current] are displayed so that measured
values can be confirmed. Press
to display the Measurement screen, and select the desired [CH]
page with the
keys. Power measurements can be displayed in a list, and detailed voltage
and current values can be displayed.
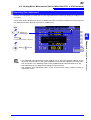
Displaying Power
. (The screen shows values for Wiring mode 1, four 1P2W systems.)
RMS Voltage
RMS Current
Active Power
Power Factor
Apparent Power
Reactive Power
Power Phase Angle
Frequency
• Average rectified RMS converted value is displayed for Urms or Irms according to the rectification setting.
See"4.2.5 Selecting the Rectification Method" (p. 50)
• Polarity of power factor (λ), Reactive power (Q), and power phase angle (φ) shows the LEAD
or LAG. "No polarity sign" means "LAG" and "-" means "LEAD".
• The polarity of power factor, reactive power and power phase angle may not be stable when
the voltage and current has big level difference or power phase angle is around zero.
• Each channel value of effective power (P), Reactive power (Q), Apparent power (S) and
power factor (λ) is meaningless in the 3P3W2M wiring. Use only the sum values (P12, P34,
etc.)
Chapter 4 Viewing Measurement Values
Press
4
42
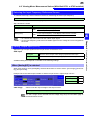
4.2 Viewing Power Measurements, and Changing the Measurement Configuration
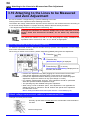
Displaying Voltage
Press
. (The screen shows values for Wiring mode 1, four 1P2W systems.)
RMS Voltage
Voltage Waveform Peak+
Voltage Waveform PeakRectified Mean Value of
RMS Conversion
Simple Averaged Voltage
Fundamental Voltage
Content
AC Voltage Content
THD Voltage Percentage
Frequency
When the Wiring mode is 3P3W3M or 3P4W, voltage unbalance Uunb [%] is displayed.
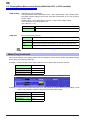
Displaying Current
Press
. (The screen shows values for Wiring mode 1, four 1P2W systems.)
RMS Current
Current Waveform Peak+
Current Waveform PeakRectified Mean Value of
RMS Conversion
Simple Averaged Current
Fundamental Current Content
AC Current Content
THD Current Percentage
Frequency
When the Wiring mode is 3P3W3M or 3P4W, current unbalance Iunb [%] is displayed.
43
4.2 Viewing Power Measurements, and Changing the Measurement Configuration
4.2.2 Selecting Ranges
Measurement ranges are selected as described below.
• If the maximum voltage or current rating is exceeded, immediately stop measuring, shut off power to the measurement lines, and disconnect from the measurement object.
• Continuing to measure when maximum ratings are exceeded may damage the
instrument and result in injury or death.
Types of Range Setting
Measurement ranges can be selected in two ways:
Manual range setting
Auto-Ranging
Select the range manually
(Press RANGE
or
to select the desired range.)
Each voltage and current range is set automatically according to the measurement inputs
for each wiring system. (Press RANGE
and
at the same time.)
Range Display
The active range selection is displayed at the locations on the Measurement screen shown below (except
on the [Efficiency], [XY Graph], and [Motor] pages). Manual range selections are indicated by [Manu],
and Auto-ranging selections by [Auto].
Voltage Range
Current Range
4
Chapter 4 Viewing Measurement Values
• The maximum input voltage is +/-2000V DC, 1500Vrms AC. Do not use the voltage exceeding it to avoid damaging the unit or injury.
• Never exceed the maximum rated input current to the current sensor, as damage to the instrument or injury or death can result.
44
4.2 Viewing Power Measurements, and Changing the Measurement Configuration
Range Setting Procedure
Ranges can be set on the following Measurement screen pages: [Vector], [CH] (any), [Wave + Noise],
[Select], and [Input]. Change the range with the RANGE and keys.
For Manual range selection, press RANGE
to select the desired range.
For Auto range selection, press RANGE
the same time.
Voltage Range
Current Range
Setting from the [Vector] Page of the Measurement Screen
Display the
[Vector] page
Select the channel to
change
Press the RANGE keys to select the range
Setting from the [CH] Pages of the Measurement Screen
Select the channel to
change
Press the RANGE keys to select
the range
Setting from the [Wave + Noise] Page of the Measurement Screen
Display the
[Wave + Noise] page
Select [U/I]*
Select the channel to
change
Press the RANGE keys to select the
range
* Press
for changing.
to display [CH]
or
and
at
45
4.2 Viewing Power Measurements, and Changing the Measurement Configuration
Setting from the [Select] Page of the Measurement Screen
Display the
[Select] page
Select the channel
to change
4
Setting from the [Input] Page of the Setting Screen
Display the
[Input] page
Select the channel
to change
Press the RANGE keys to select
the range
(Changes the selected [U range] or
[I range])
To change the [U range] or [I range], select it with the
cursor and press
range.
,
, or
to change the
See About [All CH Set] "2.2 Basic Operations" (p. 16)
When measuring multiple channels with a Wiring mode other than 1P2W, all channels are
forced to the same range. In this case, the range of each channel is set to match the channel
set to the lowest range.
Chapter 4 Viewing Measurement Values
Press the RANGE keys to select the range
46
4.2 Viewing Power Measurements, and Changing the Measurement Configuration
Auto-Ranging Span
This setting determines auto-ranging behavior, and can be specified for each wiring system. Select
[Wide] if the range changes frequently due to large fluctuations.
Narrow
• The measurement range increments by one when a Peak Over state occurs or when
any RMS value exceeds 105% f.s.
• The measurement range decrements by one when all RMS values fall below 40% f.s.
(unless a Peak Over state would result in the lower range). This is the default setting.
Wide
• The measurement range increments by one when a Peak Over state occurs or when
any RMS value exceeds 110% f.s.
• he measurement range decrements by two when all RMS values fall below 10% f.s.
(unless a Peak Over state would result in the lower range).
When Δ-Y conversion is enabled (p. 98), the range-decrementing voltage is
1
⁄ 3 (approximately 0.57735) f.s.
Setting Procedure
Display the
[Calc] page
Select
[AutoRange type]
Select with the F keys
• If the range switches frequently even when the [Wide] setting for [AutoRange type] is
selected, Manual range setting is recommended.
See"4.2.2 Selecting Ranges" (p. 43)
• When integration starts, the range selected at that time becomes fixed, and auto-ranging is
disabled.
47
4.2 Viewing Power Measurements, and Changing the Measurement Configuration
4.2.3 Selecting the Sync Source
Select the source to determine the fundamental cycle (between zero crossings) on which various calculations are to be based.
Select from the following 11 items for each Wiring mode. Press
screen.
to make the setting on the Setting
U1 to U4 (Default setting), I1 to I4, DC50 ms, DC100 ms, Ext*
The selected synchronization source is displayed as [Sync] on the Measurement screen.
* Selectable when a Model 9791 or 9793 Motor Testing Option is installed and CH B is set for pulse input.
Sync Source Setting Procedure
Select [Sync source]
for the channel to be
changed.
Select with the F keys
See [All CH Set] and [Next].
"2.2 Basic Operations" (p. 16)
• When measuring AC input with [DC50 ms] and [DC100 ms] settings, displayed values fluctuate and proper measurement is not possible. Select any of [U1] to [U4] or [I1] to [I4].
• Voltage and current share the same sync source on each channel.
• [DC50 ms] is the fastest calculation interval for DC measurements. However, if input interference (50/60-Hz power line noise) causes measurement values to fluctuate, select [DC100
ms].
• When U or I is selected as a sync source, amplitude should remain at least 30% f.s.
• Also when U or I is selected as a sync source, if a frequency is applied above 5 kHz or below
the minimum measurement frequency, the displayed frequency may differ from the input frequency.
For the sync source, select an input with a fundamental frequency of 0.5 Hz to 5 kHz, and
specify the corresponding minimum measurement frequency.
• The measurement values may get unstable at the frequency around the lowest measurable
frequency, because the synchronization is unlocked.
Chapter 4 Viewing Measurement Values
Display the
[Input] page
4
48
4.2 Viewing Power Measurements, and Changing the Measurement Configuration
Setting the Zero-Crossing Filter
When U or I is selected, set the level of the zero-crossing filter.
(Ex.)
Set to display waveforms from “0”.
OFF
0
When [OFF] is selected, accuracy is undetermined, so always
select the Weak or Strong setting when viewing measurement values.
Weak
This is the normal (default) setting.
Strong
Select this setting if synchronization is lost because the input fundamental and the carrier frequency
are too close together, such as when measuring an inverter secondary.
Zero-Crossing Filter Setting Procedure
Display the
[Calc] page
Select
[ZeroCross filt]
Select with the F keys
About the Sync Unlock Indicators
When a sync signal cannot be acquired,* its Sync Unlock indicator appears (see figure below). The indictors for all channels are displayed on all screens, so sync unlock events are visible even when they occur
on channels that are not currently selected for display.
Example. The following case indicates that CH 2 sync is unlocked.
Harmonic sync source unlocked
See "4.4.4 Selecting the Harmonic Sync Source"
(p. 67)
Red
Indicates sync is unlocked.
The channel cannot be measured accurately.
Yellow
“ULK” lights yellow when the frequency of any
sync source channel is at or below 99% (or at or
above 101%) of the harmonic sync source. In this
case, the harmonics of each measured value, the
fundamental content (Ufnd and Ifnd), and the total
harmonic ripple distortion percentages (Uthd and
Ithd) cannot be measured correctly.
Example. When the frequency of the harmonic
sync source is 50 Hz and the frequency of the sync
source channel is 49.5 Hz or less, or 50.5 Hz or more.
Harmonic sync source unlocked
* If the frequency of the selected sync source (input) is not between 0.5 Hz and 5 kHz, or if there is no
sync source input signal, or if the input amplitude is too low (below 30% f.s.)
49
4.2 Viewing Power Measurements, and Changing the Measurement Configuration
4.2.4 Frequency Measurement Settings
By configuring U or I settings for each input channel, the instrument can simultaneously measure multiple
frequencies in different wiring systems.
Frequency Measurement Display System
• 0.5000 Hz → 9.9999 Hz → 10.000 Hz → 99.999 Hz → 100.00Hz → 999.99 Hz → 1.0000 kHz →
5.0000 kHz
• 0.5000 Hz ← 9.8999 Hz ← 9.900 Hz ← 98.999 Hz ← 99.00 Hz ← 989.99 Hz ← 0.9900 kHz ←
5.0000 kHz
• For other measurement input frequencies (not between 0.5 Hz and 5 kHz): “0.0000 Hz” is displayed for
frequencies below 0.5 Hz, and “------ Hz” for 5 kHz and above.
4
Frequency Measurement Source Setting Procedure
Select
[Freq measure]
Select with the F keys
See About [All CH Set]. "2.2 Basic
Operations" (p. 16)
Specify the lowest (limit) measurement frequency for frequency measurements.
Set the lowest measurement frequency according to the input frequency.
The setting is displayed as the [Lowest] value on the Measurement screen.
Setting the lowest measurement frequency on the Measurement screen
This setting is available on all Measurement screen pages.
Press the LOW FREQ
and
keys to make the setting
Chapter 4 Viewing Measurement Values
Display the
[Input] page
50
4.2 Viewing Power Measurements, and Changing the Measurement Configuration
Setting the Lowest Measurement Frequency on the Setting Screen
Display the
[Input] page
Select
[Lowest freq]
Select with the F keys
• The frequency measurement range is 0.5 Hz to 5 kHz (within the sync frequency range).
Input frequencies outside of this range cannot be measured.
• The guaranteed accuracy of frequency measurement stipulates sine wave input of at least
30% of the measurement range of the frequency measurement source. Frequency measurement may not be possible with other input signals.
• For input signals of 45 Hz and below, the data update rate depends on the input frequency.
• If a frequency is applied above 5 kHz or below the minimum measurement frequency, the
displayed frequency may differ from the input frequency.
4.2.5 Selecting the Rectification Method
Select the voltage or current rectification method to be used for calculating apparent power, reactive
power, and power factor. Two rectification methods are selectable for each voltage and current input.
Make this selection before measurement.
RMS
True root mean square value (default setting)
MEAN
Rectified mean value of RMS conversion
[MEAN] and [RMS] settings for each range are made on the [CH] pages.
Setting Procedure
Display the
[Input] page
Select a [U rect]
and [I rect] for the
channel being set.
Select with the F keys
See About [All CH Set]. "2.2 Basic
Operations" (p. 16)
51
4.2 Viewing Power Measurements, and Changing the Measurement Configuration
4.2.6 Setting Scaling (when using VT(PT) or CT)
Set the VT or CT ratio when using an external VT(PT) or CT.
When a ratio has been set, [VT] or [CT] is displayed above each range setting on the [CH] pages.
The settable range is as follows.
OFF/ 0.01 to 9999.99
(Setting is not available when VT × CT exceeds 1.0E+06.)
CT rate
OFF/ 0.01 to 9999.99
(Setting is not available when VT × CT exceeds 1.0E+06.)
When [OFF] is selected, VT and CT ratios are both 1.00.
Setting Procedure
Display the
[Input] page
Select a [VT rate]
and [CT rate] for
the channel being
set.
Select with the F keys
See About [All CH Set].
"2.2 Basic Operations" (p. 16)
4
Chapter 4 Viewing Measurement Values
VT rate
52
4.2 Viewing Power Measurements, and Changing the Measurement Configuration
4.2.7 Setting the Low-Pass Filter
The instrument includes a low-pass filter function to limit the measurement frequency range.
Enable the filter to remove harmonic components or extraneous noise when measuring.
Filter cut-off frequency can be selected from the following four settings, and can be set differently for each
wiring system.
OFF
Specified accuracy applies only at 150 kHz and below.
100 kHz
Specified accuracy applies only at 20 kHz and below.
except 10 kHz to 20 kHz, add ±1% rdg.
5 kHz
Specified accuracy applies only at 500 kHz and below.
500 Hz
Specified accuracy applies only at 60 kHz and below.
add ±0.1% f.s.
The low-pass filter setting appears below [LPF] on the Measurement screen.
Setting the Cut-Off Frequency on the Measurement Screen
The setting can be made from the [Vector], each [CH], [Wave + Noise], and [Select] page on the Measurement screen.
Display any of
these pages
Press the LPF
and
keys to make the setting
Selecting the Cut-Off Frequency on the Setting screen.
Display the
[Input] page
Select a [LPF] for the
channel being set.
Select with the F keys
See About [All CH Set]."2.2 Basic Operations" (p. 16)
53
4.3 Integration Value Observation
4.3 Integration Value Observation
4.3.1 Displaying Integration Values
Current (I) and active power (P) are integrated on all channels simultaneously. Positive, negative and
total values are displayed.
Displaying Integration Contents
Press
, select a channel [CH] with
, then press
.
Integration in progress
Waiting for integration to start by real-time clock control
Example. With 1P2W Wiring mode selected, and DC integration mode
Integration Time Items
RMS Voltage
RMS Current
Current Integration Values
Active Power
Active Power Integration Values
Power Factor
Frequency Measurement
Source Frequency
Ih2+
CH 2 positive current integration value*
WP2+
CH 2 positive active power integration value
Ih2-
CH 2 negative current integration value*
WP2-
CH 2 negative active power integration value
Ih2
CH 2 total current integration value
WP2
CH 2 total active power integration value
* Displayed only for DC integration mode
Items that can be integrated depend on the selected wiring and integration mode.
See "3.9 Selecting the Wiring Mode" (p. 30), "4.3.2 Setting the Integration Mode" (p. 56)
Chapter 4 Viewing Measurement Values
Integration stopped
4
54
4.3 Integration Value Observation
Before Starting Integration
1. Verify that the clock is set correctly.
See "Clock" (p. 101)
2. Select the integration mode.
See 4.3.2 ( p.56)
3. Set the desired time control functions (interval, timer, and clock controls).
See 4.3.4 ( p.59)
Set "OFF" for time settings when integrating manually.
4. Make appropriate settings for saving to CF card, and for D/A output, as needed.
See "7.3 CF Card Formatting" (p. 106), "8.4 Using Analog and Waveform D/A Output Options (must be factory
installed before shipping)" (p. 132)
Starting, Stopping, and Resetting Integration
These functions can be controlled by key operations or by communication commands.
Resets integration: press
is finished
Start integration: press once
Stop integration:* press again
when integration
Always reset the integration values when
changing other settings.
* When timer or clock control
is enabled, integration stops
automatically at the specified
stop time.
• Integration start, stop and value reset cannot be performed on the Setting or File Operation
screens. These functions are available only on the Measurement screen.
• Remote control by USB or LAN communications can be performed using the same operations on the remote control application program screen.
See"Chapter 9 Operation with a Computer" (p. 141)
55
4.3 Integration Value Observation
• Maximum integration time is 9999 hours, 59 minutes and 59 seconds, after which integration
automatically stops.
• Integration start, stop and reset by the operating keys and external control act on all integration items simultaneously.
• The following physical quantities can be measured by integration for each wiring system and
DC integration mode.
Mode Name
Physical Quantities
1P2WvDC Mode
Ih+, AIh-, Ih, WP+, WP-, WP
1P2W
Ih, WP+, WP-, WP
1P3W, 3P3W
(using CH 1 and CH 2)
Ih1, Ih2, WP12+, WP12-, WP12
3P3W3M, 3P4W
(using CH 1, CH 2 and CH 3)
Ih1, Ih2, Ih3, WP123+, WP123-, WP123
4
Chapter 4 Viewing Measurement Values
• Calculation results for each channel are integrated at 20 times per second, so integration values may differ for measurement devices with different response or sampling rates, and for
different calculation methods.
• When auto-ranging is enabled for any item, the actual measurement range becomes fixed at
its current setting the moment integration starts, so set the range beforehand to avoid overrange input.
• For current integration, the DC mode integrates instantaneous current, and the RMS mode
integrates RMS current.
• For power integration, the DC mode integrates instantaneous power, and the RMS mode
integrates active power.
• When integration is enabled (including “Wait” for clock control), settings cannot be changed
other than switching screens and the Data and Peak Hold functions.
• When Data or Peak Hold is active, integration continues internally even when displayed values are fixed. Even so, it is the displayed data that is output to CF card and D/A outputs.
• Integration display values are unaffected by the Peak Hold state.
• System reset stops integration and resets integration values settings to factory defaults."6.1
Initializing the Instrument (System Reset)" (p. 101)
• If a power outage occurs during integration, integration restarts when power is restored.
56
4.3 Integration Value Observation
4.3.2 Setting the Integration Mode
Select the integration mode for each channel.
Two choices are available for each wiring system.
DC Integration
Mode
Integrates instantaneous current and power values for each polarity during every sampling
interval (at 500 kHz sampling frequency)
Only selectable for 1P2W wiring with AC/DC current sensors (Models CT6862, CT6863, 9709,
9277, 9278, and 9279)
Integration is performed simultaneously on three current values (Ih+, Ih-, and Ih) and three
active power values (WP+, WP+, and WP)
RMS Integration
Mode
Integrates RMS current and active power during every measurement interval (50 ms).
Each polarity is integrated only for active power.
Setting Procedure
Display the
[Input] page
Select the channel
to change
Select with the F keys
See About [All CH Set]. "2.2 Basic Operations" (p. 16)
Display of THD (total harmonic distortion) or RF (ripple factor) of the measurement value is
determined according to the integration mode setting.
When the RMS integration mode is selected, THD is displayed, and when the DC mode is
selected, RF is displayed.
57
4.3 Integration Value Observation
4.3.3 Manual Integration Method
This method starts and stops integration by manual operation.
Procedure
Displayed Integration Value
Start
Stop
Before starting integration
Reset
Disable (set to [OFF]) the interval, timer and clock
timing control settings.
See "Integration Combined with Timing Control" (p. 59)
Held Constant
4
Start
Time Press
.
Manual Integration Operations
Stop
Press
(The
light turns off, and
displayed.)
Displayed Integration Value
Start
Stop
again.
Resume
is
Additional integration
Held Constant
(resumes integration with the values acquired previously)
Additional
Press
Time
Additional Integration Operation
again.
(The
key lights green, and
is
displayed to indicate the operating state.)
Reset the integration value
Press
when finished integration.
Chapter 4 Viewing Measurement Values
(The
key lights green, and
is
displayed to indicate the operating state.)
58
4.3 Integration Value Observation
Saving Integration Data at Each Interval
During manual integration, integration values can be saved in combination with interval time.
Measurement items selected as described in section "7.5.3 Selecting Measurement Items to Save" (p.
112) can be saved to CF card at the specified interval.
See Can be set in "Interface" page of setting screen.
Procedure
1. Select the integration data to be saved at each interval.
See 7.5.3 ( p.112) (Press
[Integ] to select the integration items to save.)
2. Set saving (ON/OFF), and specify the folder, if needed.
See "7.5.2 Auto-Saving Measurement Data" (p. 110), "7.10.1 Creating Folders" (p. 117)
3. Select the interval time.
See 5.1 ( p.91)
4. Press
to start saving at the selected intervals. (Press
again to stop.)
• The data at each interval is not displayed if only interval timing is enabled. Auto-saving must
also be enabled.
• The maximum integration time is 9999 hours, 59 minutes, and 59 seconds.
• When auto-saving is enabled, it is toggled by the
when not needed.
key. Disable auto-saving (set to [OFF])
See"7.5.2 Auto-Saving Measurement Data" (p. 110)
• When Data or Peak Hold is active, integration continues internally even when displayed values are fixed. Even so, it is the displayed data that is output to CF card and D/A outputs.
59
4.3 Integration Value Observation
4.3.4 Integration Combined with Timing Control
After specifying timer and clock settings, press
to cause integration to start and stop at the specified
times. Integration can be controlled by the following three timing methods.
Manually Controlled
Integration
Press
to start integration.
Press
again to stop integration.
Integrated value
Start
Stop
Reset
Keep
See "4.3.3 Manual Integration Method"
(p. 57)
4
Time
Integrated value
Start
開始 Timer Setting Value
Press
to start integration.
Integration stops automatically
when the timer expires.
Stop
停止
Chapter 4 Viewing Measurement Values
Timer-Controlled
Integration
Reset
リセット
Keep
See "Timer-Controlled Integration" (p. 60)
Time
Automatic stop
Clock-Controlled
Integration
Integrated value
Press
.
Integration starts and stops at the
specified times.
Start
Start Time
Wait Time
Stop Time
Reset
Clock-Controlled Time
Keep
See "Clock-Controlled Integration" (p. 61)
Time
Automatic Start
Automatic Stop
When an interval time is enabled, activating Data or Peak Hold by pressing the HOLD key
causes the display to update at each interval.
Also, when timer or clock control is enabled, the final measurement data is displayed at the
specified stop time.
60
4.3 Integration Value Observation
Timer-Controlled Integration
Integration is performed for the specified duration, and stops when the timer expires. Calculation results
are held constant when the timer stops.
If auto-saving is enabled, integration values are saved to CF card when integration starts and stops. If an
interval time is also specified, total integration values up to that point are saved at each interval.
See "7.5.2 Auto-Saving Measurement Data" (p. 110)
Setting Procedure
Display the
[Time] page
Select [Timer mode]
to enable (set to [ON])
Select a [Timer setting]
digit
Use the F keys to set the timer
lights green
Press
to start integration, which stops
automatically after the set time elapses.
To interrupt integration:
Press
again.
• Integration stops when the timer expires (or the clock stop time occurs). When this occurs
before the end of an interval, the last interval is ignored.
• Setting range is 10 seconds (“0 hour 0 min 10 sec”) to “9999 hour, 59 min 59 sec”.
• If clock timing control is set longer than the timer setting, integration starts at the clock start
time and stops when the timer has expired (the clock stop time is ignored).
• Pressing
before the timer expires during timer controlled integration stops integration
and retains the integration values. In this instance, pressing
and continues for the set timer duration (additional integration).
again resumes integration
61
4.3 Integration Value Observation
Clock-Controlled Integration
After pressing
, the instrument waits until the specified clock start time. Integration then begins and
continues until the specified clock stop time.
If auto-saving is enabled, integration values are saved to CF card at the specified start and stop times. If
an interval time is also specified, total integration values up to that point are saved after each interval.
Setting Procedure
4
Display the
[Time] page
to enable (set to [ON])
Select a [Start time] and
[Stop time] digit
Use the F keys to set the timer
During wait: blinks green
At the start time: lights green
(automatically starts and stops
at the specified clock times)
To abort automatic control (while waiting):
Press
again.
• Clock control settings are in 1-minute units.
• Clock setting years are AD (Christian Era), and 24-hour time (e.g., December 6th 2009,
10:16 PM appears as 2009-12-06 22:16)
• If a specified clock time has already passed, clock control is considered to be disabled
(OFF).
• When integration is interrupted during clock timing control, clock control is disabled (OFF).
• If clock timing control is set longer than the timer setting, integration starts at the clock start
time and stops when the timer has expired (the clock stop time is ignored).
• Integration stops after 9999 hours, 59 minutes, and 59 seconds if the time between clock
start and stop times is set longer than that.
• Setting time upper limits are as follows:
Start Time
2077-12-31 23:59
Stop Time
2079-12-31 23:59
Chapter 4 Viewing Measurement Values
Select [Real time]
62
4.4 Viewing Harmonic Measurement Values
4.4 Viewing Harmonic Measurement Values
4.4.1 Displaying the Harmonic Bar Graph
The results of harmonic analysis of voltage, current and active power on the same channel can be displayed as a bar graph. Numerical data for the cursor-selected order is also displayed.
Press
Press
to display the Measurement screen.
to select the desired [CH] page, and press
.
Harmonic Sync Source Frequency
Harmonic
Voltage
Amplitude
Content (%)
Phase Angle
Harmonic
Current
Harmonic
Active
Power
Changing the Displayed Order
Change the selected order.
These selections correspond to the orders on the
Harmonic List screen.
The green bar indicates the selected order.
Shows the measured values of the
cursor-selected order.
63
4.4 Viewing Harmonic Measurement Values
Changing Display Settings
Select the item
Displays the pull-down
menu
Vertical axis display
Maximum harmonic order to display
MEAS_HARM_CH.bmp
Selects from the pull-down
menu
Displayed item
Enter
Channel
Cancel
Changes channels in the same wiring system.
(Example) In the 3P4W wiring
CH1, CH2, CH3, CH123
Display
Contents
Changes the display contents
Amplitude, Content, Phase angle
• The phase angle of harmonic active power is equivalent to the harmonic voltagecurrent phase difference.
• The scale of the vertical axis is a percentage of the range of the selected amplitude.
• This selection is the same as on the Harmonic List screen.
A gray bar may be displayed when phase angle is selected, indicating that the corresponding amplitude is very low (less than 0.01% f.s.).
Highest Order Changes the highest order displayed
Display
100th order, 50h order, 25th order
This selection is the same as on the Harmonic List screen.
Depending on the sync frequency used for measurement, the specified maximum
order may not be displayable.
See "Highest order analysis" (p. 152)
Vertical Axis Changes the vertical axis display type.
Display Type
Linear
Linear display
Log
Logarithmic display (allows easier viewing of small values)
When the display content is phase angle, the [Linear] setting is fixed and cannot be
changed.
Chapter 4 Viewing Measurement Values
Channels in the same wiring
4
64
4.4 Viewing Harmonic Measurement Values
4.4.2 Displaying the Harmonic List
The results of harmonic analysis of voltage, current and active power on the same channel can be
displayed as a list. Numerical data for the cursor-selected order is also displayed.
Press
to display the Measurement screen.
Press
to select the desired [CH] page, and press
.
Displayed
Item
Display
Contents
Highest
Displayed
Order
Changing Display Settings
See P.63 for the procedures to change the display settings.
Displayed
Item
Changes item (physical quantity) to be displayed.
(Example) In the 3P4W wiring
U1, I1, P1, U2, I2, P2, U3, I3, P3, P123
Display
Contents
Changes the highest order displayed
Amplitude, content (%) and phase angle
• The phase angle of harmonic active power is equivalent to the harmonic voltagecurrent phase difference.
• This selection is the same as on the Harmonic Bar Graph screen.
Highest
Displayed
Order
Changes the highest order displayed
100th order, 50h order, 25th order
This selection is the same as on the Harmonic Bar Graph screen.
Depending on the sync frequency used for measurement, the specified maximum
order may not be displayable.
See "Highest order analysis" (p. 152)
65
4.4 Viewing Harmonic Measurement Values
4.4.3 Displaying Harmonic Vectors
The voltage, current, and phase angle of each harmonic order are displayed in a vector plot showing the
phase relationship between voltage and current. Numerical values for the selected order are also displayed.
Press
and then
to select the [Vector] page.
Measurement Channel
Measurement Data
Change vector display
magnification
4
• Voltage and current for all channels are displayed on one screen.
• Voltage-current phase angles are determined relative to the (0°) standard of the fundamental
waveform used as the harmonic sync source.
• The phase angle of harmonic active power is equivalent to the harmonic voltage-current
phase difference of the same order on the same channel.
Changing the Displayed Order
Changes the order.
Changes to the measurement values of the
cursor order.
Displays the vectors
for the selected order.
This selection is the same as on the Harmonic Bar
Graph screen.
Chapter 4 Viewing Measurement Values
Vector Plot
66
4.4 Viewing Harmonic Measurement Values
Changing Display Settings
Select the item (channel)
Displays the pull-down
menu
Measurement Channel
Selects from the pull-down
menu
Enter
Measurement
Channel
Cancel
Change the channels to be displayed. Setting channels that are not used to
[OFF] can simplify the display.
ON
Vector and numerical values are displayed
OFF
Vector and numerical values are not displayed
67
4.4 Viewing Harmonic Measurement Values
4.4.4 Selecting the Harmonic Sync Source
The [Harm sync src] has to be selected for harmonic analysis. Available selections depend on the input
source.
• Using a measurement voltage or current input as the sync source
U1 to U4, I1 to I4
The frequency of the measurement voltage or current waveform is sampled for harmonic analysis synchronization.
For all channels, the (0°) reference point for all phase angle measurements is the fundamental waveform of the harmonic sync source.
• Using the instrument's internal fixed clock as the sync source
Waveforms are sampled in synchronization with the 50 ms timing used by the instrument for data
update and for harmonic analysis. Use this source when no input is stable enough for synchronization.
When DC100 ms is selected, 50 Hz is measured as the fifth-order harmonic, and 60 Hz as the sixthorder harmonic.
• Using
an external signal as the sync source
Ext
This setting is available only when a Model 9791 Motor Testing Option or 9793 Motor Testing and D/A
Output Option is installed and CH B is set for pulse input. Waveforms are sampled in synchronization
with the rising edges of the pulses input on CH B to perform harmonic analysis.
See"4.8.1 Motor Input Settings" (p. 84)
Display the
[Input] page
Select the item
Select with the F keys
See About [Next].
"2.2 Basic Operations" (p. 16)
• The same harmonic sync source is shared by all channels. Harmonic analysis cannot be performed correctly on channels with input frequency different from the selected harmonic sync
source.
• The harmonic sync source selected here is also used as the sync source for waveform displays.
• Correct analysis is not possible in the following situations:
1. If the sync source signal is very distorted
2. If the sync source signal frequency is below the lower limit of the valid range
3. If the sync source frequency is unstable
Chapter 4 Viewing Measurement Values
DC50 ms, DC100 ms
4
68
4.4 Viewing Harmonic Measurement Values
4.4.5 Selecting the THD Calculation Method
Select whether to use THD-F or THD-R method to calculated total harmonic distortion. The selected calculation method is applicable to both harmonic voltage and current.
THD-F
The percentage of total harmonics relative to the fundamental waveform
THD-R
The percentage of total harmonics relative to the sum of the total harmonics and the fundamental waveform
Display the
[Input] page
Select the item
Select with the F keys
What is THD?
THD is an abbreviation for total harmonic distortion: the total amount of signal distortion cause
by all harmonics.
69
4.5 Viewing Waveforms
4.5 Viewing Waveforms
4.5.1 Displaying Waveforms
Waveforms of voltage and current measured on up to four channels can be displayed separately according to voltage, current, or channel.
Waveforms are sampled at 500 kS/s, with the displayed time span per screen determined by the timing of
the harmonic sync source.
The waveform span displayed on one screen is determined by the [Time scale] setting.
Displaying Voltage and Current Waveforms Separately
Positive Peak Value (pk+)
Waveform color appears when enabled (ON).
Negative Peak Value (pk-)
RMS (rms)
Display the
[Wave + Noise]
page
Displays four overlapping voltage waveforms
Select [U/I]
(Current/Voltage)
Displays four overlapping current waveforms
Displaying Separate Channel Waveforms
Select [CH]
(Separate Channel)
Voltage Scale
(Positive-only display)
Current Scale
(Negative-only display)
Waveform Display Enable/Disable (p. 70)
Waveform color appears when enabled
(ON).
Positive Peak
Value (pk+)
Negative Peak
Value (pk-)
RMS (rms)
4
Chapter 4 Viewing Measurement Values
Waveform Display Enable/Disable (p. 70)
70
4.5 Viewing Waveforms
• Waveforms and numerical measurement values displayed at the right are not synchronized
with measurement timing.
• Displayed waveform values are not the calculated RMS and peak numerical values.
• The vertical axis of the waveform is displayed as a percentage of the full-scale range of each
channel, so the amplitudes of different channels are not directly comparable.
• To display waveforms starting from zero amplitude, see "Zero-Crossing Filter Setting Procedure" (p. 48).
• The waveform and noise display cannot be updated by pressing the HOLD key when the unit
is under HOLD condition.
Hiding and Displaying Waveforms
Select whether to display or not display waveforms.
Available settings are [U/I] and [CH].
ON
Display waveforms
OFF
Do not display waveforms
Select the channel to
change
Displays the pull-down
menu
Selects from the
pull-down menu
Enter
Cancel
71
4.5 Viewing Waveforms
4.5.2 Resizing Waveforms
Waveforms can be reduced and enlarged for convenient viewing, and to confirm details. Make this setting
using the cursor keys on the [Wave + Noise] page.
See "4.5.1 Displaying Waveforms" (p. 69)
Changing Vertical Axis Magnification
Voltage and current waveforms can be vertically resized (magnification is the same for all channels).
1 Press
2
2
Select U (voltage)
or I (current)
for resizing
1
4
Select the desired magnification from 1/4× to 100×
Chapter 4 Viewing Measurement Values
3
or
Displays the pulldown menu
Selects from the
pull-down menu
Cancel
Enter
Changing Horizontal Axis Magnification (Timebase)
Select [Time scale]
Displays the pull-down
menu
Selects from the
pull-down menu
See Chart in below.
Enter
Cancel
• The waveform sampling rate is fixed at 500 kS/s.
• Available timebase selections depend on the selected number of noise analysis points, as follows.
Selected No. of
Points
1000
5000
10000
50000
Timebase Selections
0.2 ms/div
1 ms/div
2 ms/div
10 ms/div
0.4 ms/div
2 ms/div
4 ms/div
20 ms/div
1 ms/div
5 ms/div
10 ms/div
50 ms/div
2 ms/div
10 ms/div
20 ms/div
100 ms/div
4 ms/div
20 ms/div
40 ms/div
200 ms/div
10 ms/div
50 ms/div
100 ms/div
500 ms/div
72
4.6 Viewing Noise Measurement Values (FFT Function)
4.6 Viewing Noise Measurement Values
(FFT Function)
Perform FFT analysis on a selected channel's voltage and current to display noise up to 100 kHz as a
graph and as numerical values. This function is convenient for monitoring an inverter's carrier frequency,
harmonic noise ingress on commercial power lines, or DC power.
The numerical noise values can be saved to storage media.
See "7.6 Saving Waveform Data" (p. 114)
4.6.1 Displaying Noise Voltage and Current
Noise voltage and current can be displayed in separate graphs along with numerical values.
Numerical noise voltage and current values at ten frequencies are displayed in order of decreasing amplitude.
Horizontal Axis
Linear frequency scale
Vertical Axis
Logarithmic noise amplitude scale
Displaying Noise
Noise Voltage Numerical Value
Display the
[Wave + Noise] page
Select [Noise]
Noise Voltage Graph
Noise Current Graph
Noise Current Numerical Value
Displaying Waveforms and Noise
The waveform to be analyzed and it's noise analysis results can be displayed at the same time.
Noise Voltage Numerical Value
Display the
[Wave + Noise] page
Select [Wave + Noise]
Voltage and Current Waveforms
Waveform Colors
Voltage
Yellow
Current
Red
Voltage and Current Noise Graphs
Noise Current Numerical Value
The waveform and noise display cannot be updated by pressing the HOLD key when the unit is
under HOLD condition.
73
4.6 Viewing Noise Measurement Values (FFT Function)
4.6.2 Setting the Sampling Frequency and Points
Set the FFT sampling rate and number of points according to the frequency of the noise to be analyzed.
These settings are on the [Calc] page of the Setting screen.
Display the
[Calc] page
Select the item
4
Select with the F keys
See How to display: "Displaying Noise" (p. 72)
Changing Sampling on the Measurement Screen
Select the item
Displays the pull-down
menu
Selects from the pull-down
menu
Enter
Cancel
See Screen display procedure:"Displaying
Noise" (p. 72)
Chapter 4 Viewing Measurement Values
Sampling can be selected at the [Noise] setting on the [Wave + Noise] page of the Measurement screen.
74
4.6 Viewing Noise Measurement Values (FFT Function)
The highest frequency that can be analyzed depends on the sampling setting as follows.
Sampling Rate
500 kS/s
250 kS/s
100 kS/s
50 kS/s
25 kS/s
10 kS/s
Highest Frequency
100 kHz
50 kHz
20 kHz
10 kHz
5 kHz
2 kHz
Also, the frequency resolution of noise analysis depends on the sampling rate setting and the number of
points.
Sampling Rate
Points
1000
5000
10000
50000
500 kS/s
250 kS/s
100 kS/s
50 kS/s
25 kS/s
10 kS/s
500 Hz
100 Hz
50 Hz
10 Hz
250 Hz
50 Hz
25 Hz
5 Hz
100 Hz
20 Hz
10 Hz
2 Hz
50 Hz
10 Hz
5 Hz
1 Hz
25 Hz
5 Hz
2.5 Hz
0.5 Hz
10 Hz
2 Hz
1 Hz
0.2 Hz
• The instrument‘s internal anti-aliasing filter is set automatically according to the sampling setting, so that aliasing effects are suppressed even at slow sampling rates.
• Changing the sampling rate does not affect power measurements or the measurement frequency range of harmonic measurements.
• Noise analysis display updating is not linked to other measurement data such as power or
harmonics.
Data saving is not synchronized with saving of power or harmonic data.
• The number of points determines the amount of time required for analysis, so larger numbers
of points result in slower update times. Updating 1,000 points takes approximately 400 ms,
5,000 points approximately 1 s, 10,000 points approximately 2 s, and 50,000 points approximately 15 s.
• To analyze noise frequency details, select fast sampling or a large number of points (e.g., to
analyze the difference between 50 and 60 Hz, select a frequency resolution of 10 Hz or less).
• The sampling rate setting is linked to the waveform timebase display setting.
4.6.3 Setting the Minimum Noise Frequency
Set the minimum acquisition frequency for numerical noise values according to the noise frequency to be
analyzed. The lower limit can be set from 0 Hz to 10 kHz in 1-kHz steps. The setting applies to both
[Noise] and [Wave + Noise]. Make this setting on the [Calc] page of the Setting screen.
Setting on the Measurement Screen
Select [Lowest Noise]
Enter
Select the numerical
value
Enter
Cancel
See Screen display procedure:"4.6.1 Displaying Noise
Voltage and Current" (p. 72)
75
4.6 Viewing Noise Measurement Values (FFT Function)
Settings on the Setting Screen
Display the
[Calc] page
Select the item
4
Select with the F keys
Level
Frequency
Minimum Noise Frequency
The range of available settings for the minimum noise frequency depends on the noise sampling rate setting.
Noise Sampling Rate
Minimum Noise
Frequency
500 kS/s
250 kS/s
0 to 10 kHz
100 kS/s
50 kS/s
25 kS/s
10 kS/s
0 to 9 kHz
0 to 4 kHz
0 to 1 kHz
Chapter 4 Viewing Measurement Values
A numerical noise value is recognized as a peak value when its amplitude is greater than the levels of the
next lower- and higher-frequency points in voltage and current FFT calculation results, and the ten highest peak values are acquired.
In this case, frequencies below the set minimum noise frequency are ignored.
76
4.6 Viewing Noise Measurement Values (FFT Function)
4.6.4 Measurement Channel and Window Function
Settings
Select the measurement channels and Window function for noise analysis calculations.
Display the [Calc] page
Select [Analysis CH] or
[Window type]
Select with the F keys
What is a Window type?
Noise analysis is performed by applying FFT calculations to a specific interval of a waveform
defined by the specified number of points at the specified sampling rate. The processing of an
extracted interval of a waveform is called "Window processing." The FFT calculation of the
specified waveform interval is supposed to be repeated periodically.
On this instrument, the displayed waveform is shown with the defined window.
Time Waveform
Set No. of Points
Time Waveform
Original Time Waveform
Set No. of Points
Supposed Waveform for FFT
When the number of points specified for FFT calculation does not coincide with the measurement waveform period, the edges of the waveform within the window become discontinuous
(called "leakage errors"), and non-existent noise is detected.
The Window type provide means of suppressing leakage errors by smoothly connecting the
edges of the waveforms.
Measurement Ch
Select the measurement channel for noise analysis calculations.
CH1, CH2, CH3, CH4
Window type
Select a Window type.
Rectangular
This type of window function is effective when the measurement waveform period is an integer multiple of the FFT calculation interval.
Hann
This type of window function is effective when the rectangular window is
not, and when frequency resolution is the primary concern.
Flat-Top
This type of window function is effective when the rectangular window is
not, and when amplitude resolution is the primary concern.
77
4.7 Viewing Efficiency and Loss Measurement Values
4.7 Viewing Efficiency and Loss Measurement Values
This instrument uses active power and motor power values to calculate and display efficiency (η [%]) and
loss [W]. For example, inverter input-output efficiency and internal loss, and motor input-output efficient
and loss, as well as total efficiency, can be calculated by a single instrument.
• Motor power (Pm) measurement requires the Model 9791 Motor Testing Option or the 9793
Motor Testing & D/A Output Option.
• Measurement values may be scattered when measuring severely fluctuating or transient
loads.
• On wiring systems with different power ranges, calculations use the data from the highest
power range.
• On wiring system with different sync sources, calculations use the most recent data at calculation time.
Press
and then
to select the [Efficiency] page.
Efficiency
Loss
• The display range for Efficiency (η [%]) is 0.00% to 200.00%.
• The display range for Loss [W] is 0 to ±120% of the power range.
Chapter 4 Viewing Measurement Values
4.7.1 Displaying Efficiency and Loss
4
78
4.7 Viewing Efficiency and Loss Measurement Values
4.7.2 Selecting the Calculation Formula
Up to three formulas (η1 to η3, and Loss1 to Loss3) can be selected for Efficiency (η) and Loss calculations. Select the calculation items from all Pin and Pout active power values to be applied to the following
formulas.
η = 100 × |Pout|/|Pin|
Loss = |Pin| - |Pout|
Display the
[Calc] page
Select the item
Select with the F keys
[Pm] can be selected when the Model 9791 or 9793 Motor Testing Option is installed, and with
the following settings.
CH A units
mN• m, N• m, kN• m
CH B units
r/min
79
4.7 Viewing Efficiency and Loss Measurement Values
4.7.3 Measurement Examples
Here is an efficiency and loss measurement example.
Before measuring, perform the preparations in "Chapter 3 Measurement Preparations" (p. 23)), and
make the appropriate connections and settings.
Measuring Efficiency and Loss of a Switching Power Supply
Example. The input and output sides of the switching power supply are connected to CH 1 and CH 2 of
the instrument, respectively.
Connection Example
input side
output side
Wiring Mode Setting
Wiring Mode 1
[1P2W] × 4 systems
Calculation Formula Setting
Calculation Formula
η1 = 100 × |P2|/|P1|
Loss1 = |P1| - |P2|
Set Pin1 to P1,
and Pout1 to P2
• L9438-50 Voltage Cord(2)
• 9272-10 Clamp On Sensor(1) ...... input side
• 9277 Universal Clamp On CT (1) . output side
4
Chapter 4 Viewing Measurement Values
Switching
Power Supply
Required items:
80
4.7 Viewing Efficiency and Loss Measurement Values
Measuring Efficiency and Loss of an Inverter
Example. Inverter input is connected to CH 3, and the outputs are connected to CH 1 and CH 2 of the
instrument.
Connection Example
output side
input side
Required items:
• L9438-50 Voltage Cord(2)
• 9272-10 Clamp On Sensor(1).......input side
• 9278 Clamp On Sensor (2)...........output side
Inverter
Wiring Mode Setting
Wiring Mode 3
[3P3W2M] + [1P2W] × 2 systems
Calculation Formula Setting
Calculation Formula
η1 = 100 × |P12|/|P3|
Loss1 = |P3| - |P12|
Set Pin1 to P3,
and Pout1 to P12
81
4.7 Viewing Efficiency and Loss Measurement Values
Measuring Efficiency and Loss of an Inverter and Motor
Example. Inverter inputs are connected to CH 1 and CH 2, inverter outputs to CH 3 and CH 4 of the
instrument, analog output from the tachometer to rotation signal input CH B, and analog output from the
torque meter to torque signal input CH A.
See How to connect torque meter or tachometer: 8.5 ( p.138)
Connection Example
Required items:(Requires Model 9791 Motor Testing Option or 9793 Motor Testing & D/A Output Option)
•
•
•
•
•
•
L9438-50 Voltage Cord(4)
9272-10 Clamp On Sensor(2)........input side
9709 AC/DC Current Sensor (2) ....output side
Tachometer(1)......With pulse output capability
Torque Meter(1)
L9217 Connection Cord(2)
4
output side
input side
Motor
Torque
Meter
Tachometer
Model 9791 or 9793
Wiring Mode Setting
Wiring Mode 6
[3P3W2M] × 2 systems
Calculation Formula Setting
Calculation Formula
Inverter
Motor
Total
η1 = 100 × |P34|/|P12|, Loss1 = |P12| - |P34|
η2 = 100 × |Pm|/|P34|, Loss2 = |P34| - |Pm|
η3 = 100 × |Pm|/|P12|, Loss3 = |P12| - |Pm|
Set Pin1 to P12,
and Pout1 to P34
Set Pin2 to P34,
and Pout2 to Pm
Set Pin3 to P12,
and Pout3 to Pm
The torque meter and tachometer should have the fastest possible output response time.
Chapter 4 Viewing Measurement Values
Inverter
82
4.8 Viewing Motor Measurement Values (With Hioki 9791 or 9793 installed)
4.8 Viewing Motor Measurement Values
(With Hioki 9791 or 9793 installed)
Motor analysis is available when the Model 9791 Motor Testing Option or 9793 Motor Testing & D/A Output Option (afterwards called the motor analysis function) is installed.
When the motor analysis function is installed, the [Motor] page appears on the Measurement and Setting
screens.
The motor analysis function acquires signals from rotation-sensing devices such as a torque sensor and
rotary encoder and measures motor analysis items (torque, rotation rate, motor power and slip).
Motor efficiency, total efficiency and loss can be calculated when combined with the"4.7 Viewing Efficiency and Loss Measurement Values" (p. 77) functions.
Setting the Motor Sync Source
Press
and then
to select the [Motor] page.
Motor Sync Source Setting CH A Range Setting CH B Range Setting
Torque
Rotation Rate
Motor Power
Slip
See Motor measurements can be displayed simultaneously with motor input voltage and current, power measurements and motor efficiency. "Selecting Measured Items for Display" (p. 38)
• When [CH A] measurement units are set to [V] and [Hz], or [CH B] units are set to other
than [r/min], motor power [Pm] display is always disabled (“OFF”).
• When [CH B] measurement units are set to [V], slip cannot be calculated, and [- - - - - -] is
displayed.
83
4.8 Viewing Motor Measurement Values (With Hioki 9791 or 9793 installed)
Executing Zero Adjustment
Execute zero adjustment to compensate for input signal bias before measuring analog DC voltage on CH
A or CH B.
If a non-zero value is displayed for torque or rotation rate when no torque or rotation is occurring, execute
zero adjustment before applying any torque or rotation input.
Display the
[Motor] page
Select
4
(a confirmation dialog box appears)
Cancel
• This particular zero adjustment function applies only to the motor analysis options, so the
other input channels (CH 1 to CH 4) are unaffected. To execute zero adjustment on those channels, see section "3.10 Attaching to the Lines to be Measured and Zero Adjustment" (p. 34).
• Zero adjustment is only applicable to analog DC input channels.
• The maximum zero adjustment span is ±10% of the full-scale range, outside of which no
adjustment occurs.
Chapter 4 Viewing Measurement Values
Enter
84
4.8 Viewing Motor Measurement Values (With Hioki 9791 or 9793 installed)
4.8.1 Motor Input Settings
Set to suit the motor to be measured, or the connected torque sensor or tachometer.
See "8.5 Using the Motor Testing Option (when specified before factory shipping, for motor analysis)" (p. 138)
Basic Operating Procedure
Motor Sync Source
Low-Pass Filter
Input Frequency Source
Display the [Motor]
page
Torque input setting
Select the item
Revolution signal input setting
Select with the F keys
Selecting the Motor Sync Source
Select the source of the signal that determines the period to serve as the basis for motor analysis calculations. Motor analysis items are measured according to the period of the source selected here.
U1, U4, I1, I4, DC50 ms (Default setting), DC100 ms, Ext
See "4.2.3 Selecting the Sync Source" (p. 47)
The selected motor sync source is displayed as [Sync] on the Motor screen.
• All motor analysis items depend on the same sync source.
• When measuring motor efficiency in combination with the functions of section "4.7 Viewing
Efficiency and Loss Measurement Values" (p. 77), select the same sync source as that of the
motor voltage and current input channels. Optimum measurement accuracy is possible when
the calculation periods are the same.
• [Ext] is only selectable when CH B is set for pulse input.
Low-Pass Filter (LPF) Settings
When CH A or CH B is set for Analog DC input, enable the filter to suppress harmonic noise.
Measurements should normally be made with the filter disabled (OFF), but it should be enabled (ON)
when measurement values are destabilized by the effects of external electrical noise.
ON, OFF (Default setting)
• The LPF setting is the same for CH A and CH B. Independent setting is not available.
• When CH A is set for frequency input and CH B is set for pulse input, the LPF setting has no
effect.
85
4.8 Viewing Motor Measurement Values (With Hioki 9791 or 9793 installed)
Selecting the Input Frequency Reference Source
To calculate motor slip, select a reference source for measuring the motor input frequency.
f1, f2, f3, f4
See "4.2.4 Frequency Measurement Settings" (p. 49)
Slip Calculation Formula
CH B Measurement Units
Calculation Formula
When [Hz]
Input Frequency - CH B Display Value
100 ×
Input Frequency
2 × 60 × Input Frequency - CH B Display Value× Set No. of Poles
When [r/min]
100 ×
2 × 60 ×Input Frequency
Setting Torque Input (CH A)
Select the type of input signal from the torque sensor connected to CH A.
CHA input
AnalogDC
When the sensor outputs a DC voltage proportional to the torque
Freq
When the sensor outputs a frequency proportional to the torque
Available setting items depend on the state of the following settings.
When [AnalogDC] is selected
When [CHA input] is set to [AnalogDC], set these three items to suit the sensor: [CHA range], [CHA scaling], and [CHA unit].
Example. When the rated torque is 500N• m and the torque sensor’s output range is ±10 V.
CHA range
CHA range
10 V
CHA scaling
50
CHA unit
N•m
Select to suit the output voltage of the torque sensor.
1 V Range, 5 V Range, 10 V Range,
The CH A range can be selected with the voltage range keys from the Motor page of
the Measurement screen.
4
Chapter 4 Viewing Measurement Values
• To calculate slip, set CH B to suit the rotation input signal.
• As the input frequency, select the most stable signal from the voltage and current supplied to
the motor.
86
4.8 Viewing Motor Measurement Values (With Hioki 9791 or 9793 installed)
CHA scaling
CHA unit
Settable from 0.01 to 9999.99.
The measurement value displayed for CH A = CH A input voltage × CH A scaling value.
Set [CHA unit] according to the torque value that corresponds to one volt of torque
sensor output.
(Scaling value = max. rated torque of sensor ÷ output scale voltage value)
In this example, the scaling value is 50.
(50 = 500 N• m ÷ 10)
+1, -1
10 V
Digit←, Digit→
50
Set to suit the torque sensor.
V
Select to display raw input voltage.
mN• m
Select this for torque sensors rated at 1 mN• m to 999 mN• m per volt output.
N• m
Select this for torque sensors rated at 1 N• m to 999 N• m per volt output.
kN• m
Select this for torque sensors rated at 1 kN• m to 999 kN• m per volt output.
When CH A units are set to [V], motor power [Pm] is not displayed.
When [Freq] is selected
When [CHA input] is set to [Freq], make these four settings to suit the sensor: [CHA unit], [Rated torque],
[Freq range fc], and [Freq range fd].
Example 1. Using a torque sensor rated at 500 N• m for an output span of 60 kHz ±20 kHz
CHA unit
N• m
Rated torque
500
Freq range fc
60 kHz
Freq range fd
20 kHz
Example 2. Using a torque sensor rated at 2 kN• m, with maximum positive rated torque providing 15 kHz
output, and maximum negative rated torque providing 5 kHz output
CHA unit
kN• m
Rated torque
2
Freq range fc
10 kHz
Freq range fd
5 kHz
87
4.8 Viewing Motor Measurement Values (With Hioki 9791 or 9793 installed)
CHA unit
Set to suit the connected torque sensor.
Hz, mN• m, N• m, kN• m
• When CH A units are set to [Hz], motor power [Pm] is not displayed.
• Select fc+fd for frequencies below 100 kHz, and fc-fd for frequencies above 1 kHz.
Setting beyond the numerical value limits is not possible.
Rated torque
Enter an integer from 1 to 999. Set the maximum rated torque of the torque sensor in
the corresponding CH A units.
Freq range fc Set a value between 1 kHz to 100 kHz in 1 kHz steps.
Freq range fd Set fc to the center frequency corresponding to zero torque, and set fd to the frequency corresponding to maximum rated torque.
Select the type of rotation signal to be applied to CH B
CHB input
Analog DC
For DC voltage proportional to the rotation rate
Pulse
For pulse signals proportional to the rotation rate
Available setting items depend on the state of the following settings.
When [Analog DC] is selected
When [CHB input] is set to [AnalogDC], set these three items to suit the rotation signal: [CHB range],
[CHB scaling], and [CHB unit].
CHB range
Select to suit the applied rotation signal voltage input.
1 V, 5 V, 10 V
CHB scaling
Settable from 0.01 to 9999.99. The measurement value displayed for CH B = CH B
input voltage × CH B scaling value. Set [CH B Units] according to the rotation rate that
corresponds to one volt of rotation signal.
CHB unit
Always select r/min when measuring motor power (Pm).
V, Hz, r/min
• The CH B range can be selected with the current range keys from the Motor page of
the Measurement screen.
• Set the number of motor poles when measuring the slip.(p. 88)
Chapter 4 Viewing Measurement Values
Setting the Rotation Signal Input (CH B)
4
88
4.8 Viewing Motor Measurement Values (With Hioki 9791 or 9793 installed)
When [Pulses] is selected
When [CHB input] is set to [Pulses], make these five settings to suit the rotation signal: [CHB unit],
[Max frequency], [No. of pulses], [Motor poles], and [CHZ].
CHB unit
Always select [r/min] when measuring motor power (Pm).
Hz, r/min
The measurement range when CH B units are set to Hz is 0.5 Hz to 5 kHz.
No. of Poles×Pulse Input Frequency
Measurement values are calculated as
2 ×Pulse Count Setting
When the pulse signal input frequency is higher than the measurement range, set the
appropriate pulse count.
Max frequency Determine the full-scale measurement value for CH B.
(When CH B is set for D/A Output, this setting is the full-scale value.)
100 Hz, 500 Hz, 1 kHz, 5 kHz
Pulse Count
No. of Motor
Poles
Set the number of pulses per mechanical rotation, from 1 to 60,000.
Available setting values are multiples of half the number of motor poles.
(For a incremental type rotary encoder that provides 1000 pulses per rotation, set to 1000.)
+1/2 the number of motor poles,
-1/2 the number of motor poles
Increment or decrement by 1/2 the number
of motor poles.
+1/2 × 10 times the number of motor poles,
-1/2 × 10 times the number of motor poles
Increment or decrement by 1/2 × 10 times
the number of motor poles.
+1/2 × 100 times the number of motor poles,
-1/2 × 100 times the number of motor poles
Increment or decrement by 1/2 × 100 times
the number of motor poles.
Set the number of motor poles as an even number between 2 and 98.
(The slip calculation and the rotation signal input as the frequency corresponding to
the mechanical rotation angle are converted to the frequency corresponding to the
electrical angle.)
+2, -2
Increment or decrement by 2.
+10, -10
Increment or decrement by 10.
• The motor pole setting is enabled by pressing
(Set). Be sure to press
(Set)
after changing the setting.
• When using pulse synchronization with an electrical angle (motor input voltage, or the same
frequency as the current frequency), set the number of motor poles at CH B input to 2.
CHZ
Make CH Z settings.
Enable (set to ON) to use the original rotation angle (usually called the Z phase) signal
to reset pulse division to zero.
ON
Use CH Z.
OFF
Ignore CH Z (no connection to CH Z jack)
89
4.8 Viewing Motor Measurement Values (With Hioki 9791 or 9793 installed)
4.8.2 Measuring Motor Electrical Angle
If the [Harm sync src] is set to [Ext] when pulses are input to CH B for the rotation signal, voltage and
current phase shift based on the pulses can be seen.
Fundamental Frequency(U1)
Calculation Range
Fundamental Frequency(U1)
Calculation Range
Phase difference
External Sync Signal
Reference
Reference
External Sync Signal
Reference
Reference
Single Pulses
Multiple Pulses
• Use of the original signal (Z phase) is recommended. The original (CH Z) signal serves as a reference
pulse for consistent phase measurements.
• When multiple pulses are used as the rotation signal input without the original (CH Z) signal, the reference pulse is determined upon synchronization, so upon resynchronization after sync unlock occurs, a
different pulse may become the reference standard.
• Harmonic analysis by synchronization with the rotation signal input pulse requires that the
pulse count be an integer multiple of the input frequency. For example, a 4-pole motor
requires a pulse count that is an integer multiple of two, and a 6-pole motor requires a pulse
count that is an integer multiple of three.
• When a motor with wye internal wiring is measured as a 3P3W3M wiring system, the voltage
and current phase angles can be measured using the Δ-Y conversion function.
Chapter 4 Viewing Measurement Values
Measuring Electrical Angle with Multiple Pulses
4
90
4.8 Viewing Motor Measurement Values (With Hioki 9791 or 9793 installed)
Phase Zero Adjustment (PHASE ADJ)
Press
and then
to correct (zero) any phase difference between the rotation signal input pulse
and U1 fundamental content.
• Phase zero adjustment is available only when CH B is set for pulse input and [Harm sync
src] is set to [Ext]. Otherwise, performing this key operation has no effect.
• When harmonic synchronization is unlocked, this key operation has no effect.
• Press
and then
to clear the correction value.
Electrical Angle Measurement Example
1. Without providing current to a motor, rotate it from the load side while measuring the voltage induced
at its input terminals.
2. Perform phase zero adjustment.
(Zero out any phase difference between the fundamental waveform of the induced voltage input as
U1 and the pulse signal.)
3. Without providing current to a motor, rotate it from the load side while measuring the voltage induced
at its input terminals.
Apply current to rotate the motor.
(The voltage-current phase angle measured by the instrument is the electrical angle based on the
induced voltage phase.)
Phase difference is affected by the rotation input signal pulse waveform and the instrument’s
internal circuit delay, which cause measurement errors when measuring frequencies much different from that at which phase zero adjustment was performed.
91
5.1 Timing Control Functions
Operating
Functions
Chapter 5
5.1 Timing Control Functions
Three types of timing controls are available: interval, count-down timer, and real-time clock settings. Timing control can be applied to CF card saving and integration operations.
See"4.3 Integration Value Observation" (p. 53), "7.5.2 Auto-Saving Measurement Data" (p. 110)
Controls repeating operations at a specific interval.
Timer timing control
Controls operation for a specific count-down time. Combine with interval timing to
specify the duration of interval timing operation.
Real-time clock timing
control
Controls operation between specific real-time start and stop times. Combined with
interval timing to specify when interval timing operation begins and ends.
Before starting integration and saving using timing control functions
• Before using automatic saving or integration, ensure that the real-time clock is correctly set (p. 101).
• The timing control cannot be set to CF card saving and integration independently.
• Integration is always active, so when a timing control function is active,
When timing control has stopped, press
to reset integration and clear the
• Even when a timing control function is enabled, you must press
appears on the display.
indicator.
to begin operation.
About interval timing control
• If the timer or clock control is not active, integration automatically stops at 9999 hours, 59 minutes, and
59 seconds. In this case, press
to reset the integration value and restart integration.
• Interval timing is not available when the interval time setting is longer than the timer or clock (start/stop)
settings.
• When the ending time of the timer or clock settings is different from the ending time of the last interval,
the timer or clock setting has priority.
• When changing the interval setting, the number of recordable data items (p. 112) also changes (longer
intervals allow more data items to be recorded).
About timer timing control
• When clock control settings define a time span longer than the timer setting, integration starts at the
specified clock start time, and stops when the timer setting has elapsed (any clock control stop time is
ignored).
• During integration and before the timer stops, pressing
interrupts integration but retains the
integration value. In this case, pressing
again resumes integration until the timer stops
("additional integration").
About clock timing control
• When clock control is enabled for a time span longer than the timer setting, integration begins at the
specified clock start time, and stops when the timer setting has elapsed (any clock control stop time is
ignored).
• When the set time has elapsed, real-time control is considered disabled [OFF].
• When integration is interrupted during the clock control period, clock control is disabled [OFF].
See the graph in "4.3.4 Integration Combined with Timing Control" (p. 59) for integration operations.
5
Chapter 5 Operating Functions
Interval timing control
92
5.1 Timing Control Functions
Setting Method
Press
1
and the
keys to display the [Time] page.
Interval control setting
Select the
item
Timer control setting
2
Use F keys to set.
Clock control settings
Interval
Timer mode/
Real time
Timer setting
Start time
Stop time
(The interval setting is also available on the [Interface] page.)
Time↑/ Time↓
Select an interval time from 50, 100, 200, or 500 ms; or 1, 5,
10, 15, or 30 s; or 1, 5, 10, 15, 30, or 60 min.
OFF
Interval time control is disabled.
ON
Timer control / clock control is enabled.
OFF
Timer control / clock control is disabled.
Set the count-down timer. Settable range is 10 s to 9999 h 59 m 59 s.
+1↑/ -1↓
Increments/decrements by 1.
+10↑/ -10↓
Increments/decrements by 10.
Digit←/ Digit→
Moves to the [hour] digits.
Set start and stop times for clock timing. Select the year and the 24-hour time
(e.g., 16 December, 2009 10:16 PM → [2009/12/06 22:16])
+1↑/ -1↓
Increments/decrements by 1.
+10↑/ -10↓
Increments/decrements by 10.
93
5.2 Averaging Function
5.2 Averaging Function
Performs averaging on all instantaneous measurement values, including harmonics.
• Peak, integration, and FFT peak values are excluded.
• When averaging is enabled, averaging is applied to all data being saved.
Averaging Setting Procedure
Press
1
keys to display the [Calc] page.
Select the item
5
Use F keys to set.
OFF
Averaging is disabled.
FAST
Averaging is enabled. Response time* is 0.2 s.
MID
Averaging is enabled. Response time is 1.0 s.
SLOW
Averaging is enabled. Response time is 5.0 s.
* Period to be within the accuracy when the input changes from 0% to 100%f.s.
Averaging Method
• Index averaging (applicable to 50 ms data update rate)
• Averaging is applied to voltage (U), current (I), and power (P), before performing calculations.
• For the harmonics, RMS values and percentage are calculated in average to
instantaneous values, and the phase angle is calculated in average of real part
and imaginary part after FFT calculation.
• Phase differences, distortion ratios and unbalance ratios are calculated from
the data averaged as above.
Chapter 5 Operating Functions
2
and the
94
5.3 Data Hold and Peak Hold Functions
5.3 Data Hold and Peak Hold Functions
5.3.1 Data Hold Function
Pressing
disables updating of all displayed measurement values and waveforms. In this state, data
on other screens can be viewed as it was when
was pressed.
The data update of internal measurement values is not synchronized to the display update. The internal
measurement values are updated in 50ms (internal data update rate). The waveform and noise data is
updated at the calculation completion. However, the waveform and noise display is not updated.
While data hold is active,
is displayed and the
key lights red.
Indicates Data Hold is active
Display update
Displayed value
Data Hold acti- and Data Hold ac- Data Hold actitivated
vated
vated
Update
Data Hold
Displayed
value
Data Hold
Update
Measurements, calculations and
averaging continue unaffected
internally.
Internal
measurement value
Time
Each time this key is pressed, the values
measured at that time are displayed.
To cancel Data Hold:
Press
, then press
.
Display data
update
After pressing
Output data
When the display is HOLD, the HOLD value is keep on outputting for the D/A
output, CF card save and communication. However, the waveform output continues to output the instantaneous data regardless to the HOLD status.
, the display data is next updated at the end of the measure-
ment interval or when an external sync signal is received.
• Clock and integration times and Peak Over display are unaffected by the Data Hold function.
• Data Hold and Peak Hold functions cannot be activated simultaneously.
• Settings cannot be changed while Hold is active.
• When AUTO ranging is enabled, the range is fixed at that used when
•
is pressed.
key operation is recognized before and during use of the timer control functions.
When an interval time is set: the display updates at each interval, and display data is held for the duration of the interval.
When the timer or clock control is set: the display updates and holds the values at the stop time.
• When auto-saving at a specified interval, data is saved immediately before display update.
95
5.3 Data Hold and Peak Hold Functions
5.3.2 Peak Hold Function
Pressing
after pressing
activates the Peak Hold state, in which only those items that exceed
their previous maximum values are updated. This is convenient, for example, to measure motor inrush
current.
When Peak Hold is active,
is displayed and the
key lights red.
Indicates Peak Hold is active
Displayed value
The display updates only when the previous maximum is exceeded.
Peak Hold activated
Update
5
Peak Hold canceled
Peak Hold
Update
Internal measurement value
Time
Measurement continues unaffected
internally
To activate and cancel Peak Hold:
Pressing
after pressing
.
Pressing
when Peak Hold is active resets the peak values and resumes with new peaks from that point.
Displayed value
Peak Hold activated
Update
Reset
Peak Hold
Displayed value
Peak Hold canceled
Peak Hold
Update
Internal
measurement
value
Time
Display data
update
After pressing
, the display data is next updated at the end of the measure-
ment interval or when an external sync signal is received.
(Updating of internal measurement values is not synchronized with display data update,
but at the 50-ms internal data update rate, and waveform and noise data are updated when
calculation finishes.)
Output data
When the display is HOLD, the HOLD value is keep on outputting for the D/A
output, CF card save and communication. However, the waveform output continues to output the instantaneous data regardless to the HOLD status.
Chapter 5 Operating Functions
Displayed value
96
5.3 Data Hold and Peak Hold Functions
• Waveform displays and integration values are unaffected by Peak Hold.
• When averaging is enabled, the maximum value is recognized only after measured values
have been averaged.
• Data Hold and Peak Hold functions cannot be activated simultaneously.
• The display shows [- - - - - -] for over-range values. In this case, temporarily cancel Peak
Hold and switch to the appropriate range.
• Maximum values for Peak Hold are absolute values, so if -60 W is measured after +50 W, the
absolute value of -60 W is larger, and the display shows [-60W].
• Settings cannot be changed while Peak Hold is active.
• When auto-saving at a specified interval, data is saved immediately before the display update.
Using Peak Hold with Timing Control Functions
When the interval timer is used, the maximum value within each interval is displayed.
Display Value
Peak Hold
activated
Peak Hold
canceled
Interval
Time
Interval
Time
Interval
Time
Update
Displayed
value
Internal
measurement
value
Time
Starting Interval
Ending Interval
When the timer or clock control is enabled, the maximum value between starting and stopping times is
displayed (and held).
Display Value
Peak Hold
canceled
Peak Hold
activated
Maximum measurement
value acquired
Timer Stop
Update
Display Value
Internal
measurement
value
Time
Timer Stop
Timer Start
• The Peak Hold function can be enabled either before or during timing control operation. However, when timing control is active, the maximum value is obtained only after the time the
Peak Hold function is enabled.
• The time of maximum input occurrence is not displayed.
• See "5.1 Timing Control Functions" (p. 91) for details about settings for the interval, timer
and clock timing controls.
97
5.4 X-Y Plot Function
5.4 X-Y Plot Function
Select parameters for x and y (horizontal and vertical) axes in the basic measurement items to create
simple X-Y graphs. Plot screens can be saved and printed as screen capture images.
XY Graph Display
Press
and
key to display the [XY Graph] page
X-Y graph plotting starts, and proceeds at the display update rate.
5
• Plotted data is not stored in memory, so it is lost when the screen is changed.
• When the items with AUTO ranging is selected, the data is cleared when the internal
range is switched in AUTO ranging.
Display Setting Procedure
Move the highlight cursor the display item
(parameter) to change.
Enter
Display item (Parameter)
(Displays the pull-down menu)
One x-axis parameter and two
y-axis parameters can be set.
Select a parameter for
display.
Enter
Cancel
Displayed data is cleared, and plotting restarts.
Chapter 5 Operating Functions
Press
to clear and
restart plotting.
98
5.5 Δ-YConversion Function
5.5 Δ-YConversion Function
For 3P3W3M wiring systems (wiring mode 7 on p.33), Δ (Delta) wiring configuration values are converted to
Y (Wye) wiring values ('star' configuration) so that measured values are equivalent to those of 3P4W lines.
When this function is enabled, even when a motor has internal Wye wiring and the central (neutral) point
is inaccessible, it can be measured using phase voltage to emulate the Wye configuration.
Δ-Y conversion analyzes voltage waveforms after performing vector conversion using a virtual neutral.
Although voltage waveforms, voltage measurement values, and harmonic voltages are all input as line
voltages, they are calculated as phase voltages.
Illustration of Δ-Y conversion
A
A
U1
U3
U1
U3
U2
C
B
C
B
U2
Setting Procedure
Display the
[Input] page
Select [Δ -Yconvert]
Use F keys to select
The Measurement screen appears as follows.
• Δ-Y conversion is only selectable for 3P3W3M wiring.
• When Δ-Y conversion is enabled, the vector diagram on the Wiring screen is the same as
that for 3P4W (instead of the 3P3W3M vector diagram).
• When auto-ranging voltage and Δ-Y conversion are enabled, the range-switching level for the next
lower range is calculated to be 1 ⁄ 3 times (approx. 0.57735 times) the full-scale range value.
See "Auto-Ranging Span" (p. 46)
99
Changing System
Chapter 6
Settings
On the [System] page, view the instrument's version information and change settings such as display
language, beep sounds, and screen colors.
[System] Page Display
Press
followed by
to display the [System] page.
Select screen colors.
(p. 100)
Enable/disable beep sounds.
(p. 100)
Select the display
language. (p. 100)
6
Set LCD backlighting.
(p. 100)
Execute system
reset. (p. 101)
View the instrument's
serial number.
View the instrument's
firmware version number.
View option serial numbers.
(Not displayed when the option is not installed.)
Select the startup (initial) screen.
(p. 101)
Configure zero suppression.
(p. 101)
Chapter 6 Changing System Settings
Set the system's
real-time clock.(p. 101)
100
Setting Item Descriptions
Use the
keys to select an item, and the F keys to change its setting.
Language
Color
Select the language for the display.
Japanese
Japanese
English
English
Chinese
Chinese
Select the screen color scheme.
Color1
Dark green
Color2
Light blue
Color3
Black (with white text)
Color4
Dark blue
Mono
Beep
LCD back light
Monochrome (with black text)
This setting is ideal for screen captures and printing.
Set to enable or disable key-press beep sounds.
ON
Beeps are enabled.
OFF
Beeps are disabled.
The backlight can be set to turn off after a period of key inactivity.
The screen reappears upon pressing any key.
ON
The screen backlight remains on.
1min/5min/10min/
30min/60min
The screen blanks after the selected period of inactivity.
101
6.1 Initializing the Instrument (System Reset)
Start page
Select the screen to appear when the instrument is turned on.
Zero suppress
Clock
Wiring
Initially display the wiring screen.
Last scr
Initially displays the Measurement screen that was displayed
when the instrument was turned off.
This setting establishes a level below which values are treated as zero for data
acquisition purposes.
OFF
Zero suppression is disabled.
0.1%f.s./0.5%f.s.
Measured values below the selected level are treated as zero.
Sets the internal real-time clock. Data is saved and managed according to this
setting.
+1↑/-1↓
Increments/decrements by 1.
+10↑/-10↓
Increments/decrements by 10.
Set
Press to apply setting changes (resets seconds to 00).
If the instrument operates abnormally, see “Before sending the unit to repair”.
If the cause cannot be determined, perform a system reset.
1
2
3
Select the item
Press
[Reset].
(A dialog box appears.)
Enter
Cancel
System reset returns all except the display language and communication settings to their factory defaults. All measurement data is erased from the screen and from internal memory.
See "6.2 Factory Default Settings" (p. 102)
Power-On Reset
To return all instrument settings to their factory defaults, hold the
key while turning the power on.
This is called a 'power-on reset'. All settings including the display language and communication settings
are initialized.
Chapter 6 Changing System Settings
6.1 Initializing the Instrument
(System Reset)
6
102
6.2 Factory Default Settings
6.2 Factory Default Settings
The factory default settings are as follows.3
Setting Item
Default Setting
Setting Item
Default Setting
Wiring
Mode 1 (1P2W x 4)
Folder
HI3390
Sync source
U1, U2, U3, U4
RS connection*
OFF
U range
600 V
RS com speed*
38400bps
U rect
RMS
IP address*
192.168.1.1
VT rate
OFF
Subnet mask*
255.255.255.0
I range
Sensor Rating
DefaultGateway*
0.0.0.0
I rect
RMS
Language*
Japanese
CT rate
OFF
Color
Color1
LPF (Input)
OFF
Beep
ON
Integ mode
RMS
LCD back light
ON
Freq measure
U
Start page
Wiring
Lowest freq
10 Hz
Zero suppress
0.5%f.s.
Harm sync src
U1
Motor Sync
DC 50 ms
THD calc
THD-F
LPF (Motor Testing Option) OFF
Δ-Y convert
OFF
Freq source
f1
Efficiency Pin1 to Pin3
P1
CHA input
AnalogDC
Pout1 to Pout3
P1
CHA range
5V
Sampling
250 kS/s
CHA scaling
1.0
Points
10000
CHA unit
N• m
Lowest noise
1 kHz
Rated torque
1
Analysis CH
CH1
Freq range fc
60 kHz
Window type
Rect
Freq range fd
30 kHz
Averaging
OFF
CHB input
Pulses
ZeroCross filt
Weak
CHB range
5V
AutoRange type
Narrow
CHB scaling
1.0
Interval
1min
CHB unit
r/min
Timer mode
OFF
Max frequency
5 kHz
Timer setting
1min
No. of pulses
2
Real time
OFF
Motor poles
4
Sync control
Master
CHZ
OFF
Sync event
HOLD
Wave output
ON
Media (Manual saving)
CF Card
Freq f.s.
5 kHz
Folder (Manual saving)
HI3390
Integ f.s.
1/1
Noise
OFF
Output items CH1 to Urms1
CH16
* Items not initialized by System Reset (initialized only by Power-On Reset, p.101).
Auto save
Settings for measurement display and recording data are also initialized.
103
Data Saving and
File Operations
Chapter 7
The instrument supports saving of setting configurations, measurement data, waveform data, and screen
images to CF card or USB flash drive (only setting configurations can be reloaded).
USB Flash Drive
Connector
Electrical specification
Power supply
No. of ports
Compatible USB device
USB type A
USB2.0
500 mA maximum
1
USB Mass Storage Class
7
CF Card
Max. supported capacity
Data format
TYPE1 × 1
CompactFlash memory
card
(at least 32 MB)
Up to 2 GB
MS-DOS(FAT16/ FAT32)
format
•: supported ×: not supported
Storable Content
CF card
USB
flash
drive
Manual save measurement data
•
•
Auto-save measurement data
•
×
(p. 110)
Save waveforms
•
•
(p. 114)
See
(p. 108)
Save screen image
•
•
(p. 114)
Save setting configuration
•
•
(p. 115)
Load setting configuration
•
•
(p. 115)
Copy files and folders
•
•
(p. 118)
Important
• Use only PC Cards sold by Hioki.
Compatibility and performance are not guaranteed for PC cards made by other manufacturers. You may be unable to read from or
save data to such cards.
Hioki options
PC cards (CF card + adapter)
9726 PC CARD 128M
9727 PC CARD 256M
9728 PC CARD 512M
9729 PC CARD 1G
9830 PC CARD 2G
(adapter is not used with this Analyzer)
• Format new CF cards before use.
See"7.3 CF Card Formatting" (p. 106)
Chapter 7 Data Saving and File Operations
Slot
Supported card
9
8
104
7.1 Inserting and Removing Storage Media
7.1 Inserting and Removing Storage Media
Insert and remove CF cards and USB flash drives as follows.
CF card
To insert a CF card
Open the CF card slot cover, and with the mark pointing toward the screen, insert
the card in the direction shown by the arrow as far as it will go.
To remove a CF card
Open the CF card slot cover, press the eject button so that it pops out, then press it again to
eject the CF card.
USB flash drive
Insert a USB flash drive in the USB port on the front of the instrument (and just pull it
out to remove).
• Do not insert any device other than a USB flash drive.
• Not all commercially available USB flash drives are compatible.
• Hioki cannot recover data from damaged or faulty storage media resulting from
•
•
•
•
•
•
abnormalities. We are also unable to provide compensation for such data loss,
regardless of the contents or cause of the failure or damage. We recommend making backups of all important data.
Avoid forcing insertion of storage media backwards or in the wrong orientation, as
this could damage the media or instrument.
The Media-Busy indicators (p. 17) light green when storage media is being accessed. Do
not turn the instrument off while an indicator is lit. Also avoid removing storage media while
it is being accessed, as that may corrupt stored data.
Remove the storage media when transporting the instrument. Otherwise, the instrument or media could be damaged.
Do not move the instrument with a USB flash drive installed. Otherwise, the instrument or media could be damaged.
Some USB flash drives are easily affected by static electricity. Be careful handling
the USB flash drive to avoid damage to the drive or instrument malfunctions due to
static electricity.
Some USB flash drives may prevent the instrument from turning on when inserted.
In this case, turn the instrument on before inserting the USB flash drive. We recommend testing a USB flash drive before use.
Storage media have a limited usable lifetime. After long-term use, data reading
and writing will fail, at which time the media must be replaced.
105
7.2 The File Operation Screen
7.2 The File Operation Screen
The File Operation screen is described below.
Indicates the current root position.
This example shows the contents of the root (highest level)
folder of a CF card.
Shows the list of files on the storage media.
When more files
and folders are
present than can be
displayed at once,
the up/down cursor
keys scroll the list,
with the current display position indicated by the white
scroll bar.
Shows information about storage media
being accessed.
7
About File Types
The following file data types may be stored.
Name
Type (file extension)
Description
M3390nnn.CSV
CSV
Manually saved measurement data
MMDDnnkk.CSV
CSV
Auto-saved measurement data
W3390nnn.CSV
CSV
Waveform data
H3390nnn.BMP
BMP
Screen capture image data
xxxxxxxx.SET
SET
Setting configuration data
xxxxxxxx
Folder →
Folder (no extension)
xxxxxxxx
???
Files cannot be used and saved on this unit.
• In this table, 'nnn' and 'nn' indicate a serial number (000 to 999 or 00 to 99) within the same folder, and 'kk' is a serial
number of a split file when the file size exceeds 100 MB. MMDD indicate month and day.
• Setting configuration files can be optionally assigned names (up to eight characters)
Changing Folders, Selecting the Root Folder
• From the root, press
or the right cursor key to display the contents of the currently selected folder.
• Press the left cursor key to return to the root folder.
• Folders within folders other than the root are not accessible.
Chapter 7 Data Saving and File Operations
The File Operation screen is not available during auto-saving.
9
8
106
7.3 CF Card Formatting
7.3 CF Card Formatting
Format a CF card if it is not already formatted (initialized).
Insert the CF card to be formatted (p. 104), and start formatting.
Formatting procedure
Display the
[CF cord] page
(The format confirmation dialog
appears.)
To execute:
To cancel:
(When formatting is finished,
[Completed !] appears)
Formatting erases any data stored on the CF card so that it cannot be recovered. Execute only
after confirming that no important files will be lost. We recommend keeping a backup of any
precious data stored on a CF card.
Upgrade
This key is not used other than when upgrading the firmware.
107
7.4 Saving Operations
7.4 Saving Operations
Manual Saving (p. 108)
Save destination CF card
USB flash drive
Saving method
Press
Storage media root folder
M3390000.CSV
HI3390
(or any other folder)
Files are named M3390000 to
M3390999.
.
M3390001.CSV
Up to 1,000 files
M3390000.CSV
When 1,000 files have
been created, a new folder is created.
• When the storage media is full, saving stops.
A new file is created when any
of the following
are changed:
Save
destination
folder
Wiring mode
Measurement
objects to be
saved
Auto-saving (p. 110)
CF card root
11190000.CSV
Save destination CF card
Saving method
HI3390
(or any other folder)
Automatically,
according to timing
control settings
Files are named MMDD0000 to
MMDD9900.
• When an auto-saved file exceeds 100 MB, a new file is
created and saving continues.
• Up to 100 files per day can also be saved to the root folder.
• When the storage media is full, saving stops.
11190100.CSV
Up to 100 files per day (the file name
is changed each day, so continuous
saving is supported)
11190000.CSV
When saving more than 100
files in a day, a new folder is created.
Waveform Data Saving (p. 114)
Save destination CF card
USB flash drive
Saving method
Storage media root folder
Files are named W3390000 to
W3390999.
W3390001.CSV
Up to 1,000 files
W3390000.CSV
When 1,000 files have
been created, a new folder is created.
• When the storage media is full, saving stops.
9
8
Screen Capture Image Saving (p. 114)
Save destination CF card
USB flash drive
Saving method
Storage media root folder
H3390000.BMP
HI3390
(or any other folder)
Display the screen to
Files are named H3390000 to
H3390999.
save, and press
and
.
H3390001.BMP
Up to 1,000 files
W3390000.CSV
When 1,000 files have
been created, a new folder is created.
• When the storage media is full, saving stops.
Saving Setting Configurations (p. 115)
Save destination CF card
USB flash drive
Saving method
Storage media root folder
Move to a folder on
the File Operations
screen, and press
.
7
Chapter 7 Data Saving and File Operations
Press
on the
[Wave + Noise] page
of the Setting screen
W3390000.CSV
HI3390
(or any other folder)
SETTING1.SET
HI3390
(or any other folder)
The user-specified file name may
be up to 8 characters.
SETTING2.SET
until the storage media is full
• Files can also be saved to the root folder.
• When the storage media is full, saving stops.
The maximum number of files to save in the root for manual save, waveform and screen copy
is 512 files in FAT16 format and 1000 files in FAT32 format.
108
7.5 Measurement Data Saving
7.5 Measurement Data Saving
Measurement data can be saved either manually or automatically.
All measurement values including harmonics and peak values of FFT functions can be selected for saving.
Files are saved in CSV format.
Both manual and auto-saving are disabled while accessing storage media (MediaBusy indicator lights green, (p. 17)).
7.5.1 Manually Saving Measurement Data
Press
to save values measured at the time the key is pressed.
Specify the items to save beforehand.
Saving Procedure
1. Select the measurement items to save.
2. Select the save destination media and folder.
3. Press when you want to save.
(Refer to 7.5.3 (p.112))
(The specified folder is automatically created and data saved.)
Save destination:
CF card or USB flash drive
File names:
Auto-generated, with CSV extensions
M3390nnn.CSV ('nnn' is a serial number from 000 to 999 in the same folder)
Example: M3390000.CSV
Remarks:
A new file is created the first time, after which data is added to the same file.
However, when the save destination, wiring mode, or measurement items to save is changed,
a new file is created and subsequent data saved to that.
• Saved CSV files are only intended to be reloaded.
• The displayed data and saved data may not be equivalent due to the timing difference when saving the data by pressing the
save the same data.
key. Use the HOLD function to
Selecting the Save Destination
Display the
[Interface] page
Select [Media]
Select with the F keys
When auto-saving is enabled, manual saving is not available.
109
7.5 Measurement Data Saving
Selecting the Destination Folder and Measurement Items to Save
Display the
[Interface] page
For manual saving:
[Folder]
For auto-saving:
[Folder]
(Can be set when the auto
save mode is ON.)
(A dialog appears)
keys to select
characters
Enter characters with the F keys
Enter:
7
Cancel:
Input
Enters the character at the cursor position.
(The same as
Chapter 7 Data Saving and File Operations
9
8
Dialog box setting items
.)
BS
Deletes the character before the cursor position.
Del
Deletes the character at the cursor position.
Pos←/Pos→
Moves the cursor position.
OK
Accepts the entered file name. After accepting, closes the dialog.
• When auto-saving is enabled, manual saving is not available.
• Folder names can be up to eight characters.
110
7.5 Measurement Data Saving
7.5.2 Auto-Saving Measurement Data
Each measurement value can be automatically saved at the specified time.
Items that have been specified beforehand are saved.
Saving Procedure
1. Select the measurement items to be saved.
2. Enable auto-saving and select the destination folder (as necessary).
(See 7.5.3 (p.112))
(See Setting Auto-Saving below, and "Selecting the Destination Folder and Measurement Items to
Save" (p. 109).)
3. Set the save time.
4. Press to start auto-saving (and press
(See 5.1 (p.91))
again to stop).
(The specified folder is automatically created, and data saved therein.)
Save destination:
CF card
File names:
Automatically generated from the starting date, with CSV extension.
MMDDnnkk.CSV (MM: year, DD: day, nn: serial number from 00 to 99 in same folder, kk: consecutive number of file division when file size exceeds 100 MB)
Example: 11040000.CSV (for the first file saved on November 4)
• Interval-saved CSV files are only for reloading.
• While auto-saving is enabled, manual saving, waveform saving and screen capture are
not available.
• If the auto save is started while saving in manual, waveform, or screen copy, the several data may be missed.
Setting Auto-Saving
Display the
[Interface] page
Select
[Auto save mode]
The data save destination can be
specified only when auto-saving
is enabled.
• The maximum number of data points that can be recorded (p. 112) depends in the
interval time (longer intervals allow recording more data points).
• When auto-saving is disabled ([OFF]), the [Folder] cannot be set.
• Folder names can be up to eight characters.
Remaining available recording time
When [Auto save mode] is enabled, the remaining available recording time on the selected
media is displayed. The displayed remaining time is an approximation calculated from the storage media capacity, number of recording items, and interval time.
111
7.5 Measurement Data Saving
Auto-Saving Operations
Timing controls available for auto-saving are as follows.
Interval Timing Control
Save
Save
Interval
Timer Control
Save
Save
Interval
Interval
Save
Save
Timer Setting
Auto Stop
Save
Real-Time Clock Timing
Control
Waiting
Save
Time Between Clock Start/Stop Settings
Auto Start
Specified Start Time
Timer + Interval Timing
Control
Save
Save
Auto Stop
Specified Stop Time
Save
Save
Save
Timer Setting
Interval
Interval
Interval
Auto Stop
Save
Clock + Interval Timing
Control
Save
Save
Save
Time Between
Clock Start/Stop
Settings
Waiting
Interval
Auto Start
Specified Start Time
Interval
Interval
Auto Stop
Specified Stop Time
• Settings cannot be changed while timing controls are enabled. Also, when auto-ranging is
enabled along with timing control, the range that is active when
is pressed remains fixed.
• The all data is saved in the same file under timing control.
When integration is reset, data is saved to a new file at the next start time.
• When the timer stop time and the interval ending time do not match, the timer stop time has
priority, and the last interval is truncated.
• When the clock control stop time and the interval ending time do not match, the clock control
stop time has priority, and the last interval is truncated.
• When the storage media becomes full during auto-saving, an error is displayed and saving
stops. In that case, auto-saving can be resumed (using an automatically named file with the
same name) by replacing the CF card with another (formatted) CF card.
Chapter 7 Data Saving and File Operations
Interval
See To OFF the interval. (p. 92)
7
9
8
112
7.5 Measurement Data Saving
7.5.3 Selecting Measurement Items to Save
The items to be saved to storage media can be selected.
The number of items that can be recorded depends on the interval timing setting.
Interval
Maximum
recordable items
50ms
100ms
200ms
500ms
1s
Other
130
260
520
1300
2600
5000
Setting Procedure
Display the
[Interface] page
Select
[Items to save]
Select measurement contents
with the F keys.
Press
to select Noise
peak, Temp, ChA, ChB, Pm,
and Slip.
Select the items to be
saved.
No. of items to record
Indicates the number of data
items enabled (set to “ON”)
Set by F keys*
(Press
to toggle off/on.)
Maximum recording quantity
determined by the interval setting
Press
(or
) to return to the
previous page.
"O" indicates ON, blank indicates
OFF, and "-" indicates not selectable.
*: Setting Contents
OFF
Saving disabled
ON
Saving enabled
All CH set
Sets all channels ON or OFF
(not displayed when [Other] is selected).
See "Using [All CH Set]" (p. 16)
All OFF
Sets all selected items OFF.
All ON
Sets all selected items ON.
113
7.5 Measurement Data Saving
When [Harmonic] is Selected
When [Harmonic] is selected for measurement contents to be saved, the output, highest, and lowest
orders can be selected in addition to the items to be saved.
Out order
Min order
Harm src
(Harmonic source)
All
Selects all harmonic orders.
Odd
Selects only odd harmonic orders.
Even
Selects only even harmonic orders.
Return
Returns to previous page.
Set the highest order to be output. Settable range is 0 to 100.
This setting must be higher than the lowest order setting.
+1↑/-1↓
Increment or decrement by 1.
+10↑/-10↓
Increment or decrement by 10.
100th
Sets to the 100th order.
Set the lowest order to be output. Settable range is 0 to 100.
This setting must be lower than the highest order setting.
+1↑/-1↓
Increment or decrement by 1.
+10↑/-10↓
Increment or decrement by 10.
0th
Sets the zero order (DC component).
This setting stores the measured frequency of the harmonic sync source.
7
Chapter 7 Data Saving and File Operations
Max order
Select the orders for output.
9
8
114
7.6 Saving Waveform Data
7.6 Saving Waveform Data
This operation saves the waveform displayed on the [Wave + Noise] page as a CSV file.
Setting Procedure
Display the
[Wave + Noise] page
(saves the waveform at this moment)
Save destination:
CF card, USB flash drive
(Save destination setting is the same as for Manual saving, (p. 108))
File names:
Auto generated, with CSV extension
W3390nnn.CSV ("nnn" is serial number 000 to 999 within the same folder)
Example: W3390000.CSV
Waveform saving is not possible when auto-saving is enabled.
7.7 Saving Screen Capture Images
The currently displayed screen can be saved as a 256-color bmp bitmap file (BMP file name extension).
If a printer is connected, monochrome printing is available. (p. 123)
Press
and
to save a bitmap image of the current screen to the specified media.
Save destination:
CF card, USB flash drive
(Save destination setting is the same as for Manual saving, (p. 108))
RS Connection:
Printer
See "8.1 Connecting a Printer (to print captured screen images)" (p. 123)
File names:
Auto generated, with CSV extension
H3390nnn.CSV ("nnn" is serial number 000 to 999 within the same folder)
Example: H3390000.CSV
• Screen capture is not available when auto-saving is enabled.
• To save screen images to a CF card or USB flash drive, confirm that the [RS connection] on
the [Interface] page of the Setting screen is not set to [Printer]. Otherwise, data is output
only to the printer.
See"Making Printer Settings on the Instrument" (p. 125)
115
7.8 Saving Setting Configurations
7.8 Saving Setting Configurations
Various instrument settings can be saved to storage media as "settings" files.
Save Procedure (Example: saving to a CF card folder)
Display the
[CF card] page
keys to select a folder
or
to open a folder
(A dialog appears.)
7
keys to select a character
Enter characters with the F keys.
Cancel:
9
8
Dialog Box Setting Items
Input
Enter the character at the cursor position.
(Same as
Chapter 7 Data Saving and File Operations
Enter:
)
BS
Deletes the character to the left.
Del
Deletes the character at the cursor position.
Pos ←/Pos→
Moves the cursor position.
OK
Accepts the entered file name.
The dialog closes when accepted.
Save destination:
CF card, USB flash drive
(Save destination setting is the same as for Manual saving, (p. 108))
File names:
User-named (up to eight characters), file name extension is SET
Example: SETTING1.SET
• Language and communications settings are not saved.
• Setting configuration saving is not available during auto-saving.
• Folders within folders cannot be selected.
116
7.9 Reloading Setting Configurations
7.9 Reloading Setting Configurations
Previously saved settings can be reloaded from setting configuration files.
Loading Procedure (Example: loading a setting configuration file from a CF card folder)
Display the
[CF card] page
keys to select a folder
or
to open a folder
keys to select a setting
configuration file
(or
(A dialog appears.)
Enter:
Cancel:
.
.
FILE_LOAD_SET2.BMP
If a setting configuration requires some combination of options, it will not load unless those
same options are present.
117
7.10 File and Folder Operations
7.10 File and Folder Operations
7.10.1 Creating Folders
Both auto-saving and manual saving require that a save destination folder be created.
Insert storage media before creating folders. (p. 104)
Creation Procedure
Display the
[CF card] page
(A dialog appears.)
keys to select a character
7
Enter characters with the F keys.
Enter:
.
Chapter 7 Data Saving and File Operations
Cancel:
.
9
8
Dialog Box Setting Items
Input
Enter the character at the cursor position.
(Same as
)
BS
Deletes the character to the left.
Del
Deletes the character at the cursor position.
Pos ←/Pos→
Moves the cursor position.
OK
Accepts the entered file name.
The dialog closes when accepted.
• Folder names may be up to eight characters.
• Folders can only be created in the root folder.
118
7.10 File and Folder Operations
7.10.2 Copying Files and Folders
Files can be copied between a CF card and USB flash drive.
Insert the CF card and USB flash drive before copying. (p. 104)
File Copying Procedure
(Example: copying the root files from a CF card to a folder on a USB flash drive)
Display the
[CF card] page
keys to select the file
(The USB flash drive root folder
contents appear in the dialog)
Press
to accept
keys to select the
folder to copy
or
Copy:
to open a folder
(or
)
If a duplicate file name exists:
Cancel Copy:
(or
)
(A dialog appears when copying is finished.)
A dialog appears to confirm overwriting.
To overwrite:
To cancel copying:
Cannot overwrite the files saved in manual or auto saving
(read only file.)
• Files can be copied from folders on the source storage media.
• Files and folders can be copied to the root folder on the destination storage media.
• If a duplicate file exists at the destination, an error is displayed. Change the folder name and
try again.
See"7.10.4 Renaming Files and Folders" (p. 121)
119
7.10 File and Folder Operations
Folder Copying Procedure (Example: copying a folder from a CF card to a USB flash drive)
Display the
[CF card] page
keys to select the
folder
(A dialog appears.)
Copy:
If a duplicate folder exists :
Cancel Copy:
If a duplicate folder exists at the destination, an error is displayed.
Change the folder name and try again.
See "7.10.4 Renaming Files and Folders" (p. 121)
(A dialog appears when copying is finished.)
Folders can only be copied to the root folder.
7
Chapter 7 Data Saving and File Operations
9
8
120
7.10 File and Folder Operations
7.10.3 Deleting Files and Folders
Files can be deleted from storage media.
Insert the storage media before deleting files. (p. 104)
Deleting Procedure (Example: deleting a file (or folder) from a CF card)
Display the
[CF card] page
keys to select the
file/folder to delete
Delete:
Cancel Deletion:
(The selected file or folder is deleted. Deleting a folder also deletes any files within it.)
To delete a file within a folder, open the folder and select the file.
See "Changing Folders, Selecting the Root Folder" (p. 105)
121
7.10 File and Folder Operations
7.10.4 Renaming Files and Folders
Files on storage media can be renamed.
Insert the storage media before renaming a file. (p. 104)
Renaming Procedure (Example: renaming a file (or folder) on a CF card)
Display the
[CF card] page
keys to select the file
or folder to rename
(A dialog appears)
keys to select a
character
7
Enter characters with the F keys.
Cancel:
Chapter 7 Data Saving and File Operations
Enter:
9
8
Dialog Box Setting Items
Input
Enter the character at the cursor position.
(Same as
)
BS
Deletes the character to the left.
Del
Deletes the character at the cursor position.
Pos ←/Pos→
Moves the cursor position.
OK
Accepts the entered file name.
The dialog closes when accepted.
• Folder names may be up to eight characters.
• To rename a file within a folder, open the folder and select the file.
See"Changing Folders, Selecting the Root Folder" (p. 105)
122
7.10 File and Folder Operations
123
8.1 Connecting a Printer (to print captured screen images)
Connecting
External Devices Chapter 8
8.1 Connecting a Printer
(to print captured screen images)
Connect the Hioki 9670 Printer to the instrument's RS-232C interface to print captured screen images.
SeePrinter option (p. 2)
Because electric shock and instrument damage hazards are present, always follow the steps below when connecting the printer.
• Always turn off the instrument and the printer before connecting.
• A serious hazard can occur if a wire becomes dislocated and contacts another
conductor during operation. Make certain connections are secure.
• To use a cable other than the Hioki 9638 RS-232C Cable, the instrument-side connector body must be a molded type. The instrument's structure does not support
metal plugs (with angled, instead of straight connector body).
• Avoid printing in hot or humid environments, as printer life could be greatly shortened.
Handling and Storing Recording Paper
The recording paper is thermally and chemically sensitized.
Observe the following precautions to avoid paper discoloration and fading.
Avoid exposure to
direct sunlight.
Avoid exposure to volatile organic
solvents like alcohol, ethers and
ketones.
Do not store thermal paper above 40°C or 90%
RH.
Avoid contact with adhesive
tapes like soft vinyl chloride
and cellophane tape.
Avoid stacking with wet Diazo
copy paper.
8
Chapter 8 Connecting External Devices
• The instrument is able to initialize the 9670 Printer automatically.
• The instrument's RS-232C interface supports only Hioki 9670 Printer.
• See the manuals provided with the printer for operating instructions.
124
8.1 Connecting a Printer (to print captured screen images)
8.1.1 Printer Preparation and Connection
Loading Hioki 9237 Recording Paper in the Printer
Required items: Hioki 9237 Recording Paper
Procedure
Note the proper paper
orientation!
Lift the printer head cover and
load the paper through the
insertion slot.
Paper insertion slot
OK
Cut the paper straight
horizontally.
• Use only Hioki-specified recording paper. Other papers may degrade performance or prevent
printing.
• Paper jams may occur if the paper is skewed in the roller.
• Printing is not possible if the front and back of the recording paper are reversed.
Connecting the Printer to the Instrument
Required items: Hioki 9671 AC Adapter (for Hioki 9670; not needed for battery pack operation), and
9638 RS-232C Cable
Procedure
9671 AC Adapter
9670 Printer
3 Turn on the instrument
and the printer.
1 Connect the AC adapter to the
printer, and plug it into an outlet.
(except for battery pack operation)
2 Connect the RS-232C cable between the instrument's
Hioki 3390
RS-232C interface and the printer.
9638 RS-232C Cable
RS232C Interface Pin-Out
13 . . . . . . . . . . . . . . . . . . . . . . . . .1
1 2 3 4 5
25 . . . . . . . . . . . . . . . . . . . . 14
6 7 8 9
Instrument Interface (9-pin)
Circuit
Signal
Receive data
Transmit data
Common ground for signal return
Request to send
Clear to send
RxD
TxD
GND
RTS
CTS
Printer Interface (25-pin)
Pin
No.
2
3
5
7
8
Pin
No.
2
3
7
4
5
Signal
Circuit
TxD
RxD
GND
RTS
CTS
Transmit data
Receive data
Common ground for signal return
Request to send
Clear to send
125
8.1 Connecting a Printer (to print captured screen images)
8.1.2 Settings to Use Printer
Making Printer Settings on the Instrument
Select the [Interface] page of the Setting screen.
Setting Procedure
Printer mark
Display the
[Interface] page
Select
[RS connection]
Select
[RS com speed]
8
Press
to perform.
Printer auto set
Press
.
About printer auto-setup
Turn the printer off and back on.
RS com speed
Printer auto-setup makes the following printer settings automatically:
Baud rate : RS-232 speed set on the instrument.
International char : Display language set on the instrument.
Auto Powr Off : Disabled (OFF)
Printing speed indications are as follows.
9600bps
19200bps
38400bps
Slow printing
Medium-speed printing
Fast printing
• Printer auto-setup supports only printer baud rates of 9600, 19200, and 38400 bps. Set the printer's
baud rate to any of these speeds before auto-setup.
• When changing "RS connection", turn off and on the power of the instrument.
Chapter 8 Connecting External Devices
Use the F keys to select RS-232
speed (for printing).
126
8.1 Connecting a Printer (to print captured screen images)
Model 9670 Printer Settings
See the instruction manual supplied with the printer for details.
• Following are setting examples for the printer to be used with the instrument.
BL-80RS II/RSII [VX.XX] XXXX/XX/XX
SANEI ELECTRIC INC.
*********
Data input = Serial
International char = U.S.A
Print mode = Graphic
Character set = 24Dot ANK Gothic type
Select switch = Available (ON)
Baud rate = 19200bps
Bit length = 8 bit
Parity= Non
Data control = SBUSY
Paper selection = Normal paper
Upright/inverted = Upright printing
Auto Power Off = Invalidity (OFF)
Battery mode= Invalidity (OFF)
Interface = RS232C
shr=0119 temp=026 shvp=718
• Factory default settings include Japanese (language), 9600 bps (baud rate), and auto power
off (after 90 minutes).
• When executing printer auto-setup (p. 125), the language, baud rate and auto power off settings are automatically made from the instrument.
• Be aware that changing other settings may prevent printing screen captures.
8.1.3 Printing Screen Captures
To capture and print an image of the screen:
Procedure
3
1. Display the screen to be printed.
2. Press (blue key)
3. Press .
An image of the screen (as it appears when the key is pressed) is printed out.
2
• Screen capture images can be saved as image files to a CF card or USB flash drive (p. 114),
instead of sending to the printer. To do this, set the [RS connection] (p. 125) to any setting
other than Printer.
• Screen capture is disabled during printing. Wait for printing to finish before capturing another
screen.
• Do not change the settings of [RS connection] and "RS com speed" as well as do not execute "Printer auto set" while printing.
127
8.2 Connecting a Thermometer (to acquire temperature data)
8.2 Connecting a Thermometer
(to acquire temperature data)
Temperature data can be acquired from a thermometer connected to the instrument’s RS-232C interface.
Acquired data can be displayed and saved to CF card together with other measurement data.
We recommend using the following models with known compatibility:
• 3444 Temperature HiTester+3909 Interface Pack+9637 RS-232C Cable
• 3445 Temperature HiTester+3909 Interface Pack+9637 RS-232C Cable
Connecting a Thermometer to the Instrument
Required items: Hioki 9637 RS-232C Cable, 3444 Temperature HiTester (or 3445 Temperature HiTester),
3909 Interface Pack, AC Adapter (AC10, accessories for Models 3444 and 3445)
Procedure
2 Connect the thermometer to the
3909 using the modular cable.
8
Modular Cable
AC Adapter (AC10)
4 Plug into an outlet.
3909 Interface Pack
(Expansion Box + Modular Cable)
9637 RS-232C Cable
3 Connect the instrument to the RS-232C on the
3909’s Expansion Box with the RS-232C cable.
1 Confirm that the instrument
is turned off.
Chapter 8 Connecting External Devices
3444/3445
Temperature HiTester
128
8.2 Connecting a Thermometer (to acquire temperature data)
Thermometer Settings on the Instrument
Make settings on the [Interface] page of the Setting screen.
Setting Procedure
Display the
[Interface] page
Select
[RS connection]
• Turn off and on the power again after changing [RS connection].
• When the [RS connection] is set to Thermometer, the communications speed is fixed at
2400 bps.
• When there is no communication with the thermometer, or when no temperature data can be
acquired, measurement data is displayed as “------”.
Unit Setting for Temperature
Press
,
and
keys simultaneously, so that the unit fortemperature can be selected
between deg.C and deg.F.
Acquiring Temperature Data
Turn on the thermometer and the instrument.
When thermometer measurement starts, temperature data is acquire by the instrument.
• See the instruction manual supplied with the thermometer for operating details.
• During temperature measurement, the Hold function on the thermometer is disabled.
Use the instrument’s Hold functions instead."5.3.1 Data Hold Function" (p. 94)
To display the temperature, select [OPT.] - [Temp] as the [Select] on the [Select] page of the Measurement screen.
See"Selecting Measured Items for Display" (p. 38)
Saving Temperature Data
Refer to "Chapter 7 Data Saving and File Operations" (p. 103).
129
8.3 Connecting Multiple 3390 (Synchronized Measurements)
8.3 Connecting Multiple 3390
(Synchronized Measurements)
Up to four 3390 can be connected with optional Hioki 9683 Connection Cable (for synchronous measurements).
When so connected, one 3390 operates as master over the others set as slaves, providing multi-instrument synchronous measurements.
The maximum delay of synchronization is 5μs/connection and is 5μs+50ms for synchronization event.
The timing control functions can be applied to synchronous measurements.
See"5.1 Timing Control Functions" (p. 91)
The slave 3390s are synchronized by the master 3390 for the following operations.
•Clock and data update timing (slaves match clock and data update timing)
• Timing control, integration start/stop and data reset (the
and
•Events (select from data hold, data saving, or screen capture)
keys on the master also control the slaves)
• To avoid damaging the instrument, do not insert or remove connectors while the power is on.
• Establish a one-point common earth ground point for all instruments in the measurement
system. Different grounding points could allow dangerous potential differences between the
GND terminals of the master and slaves. If sync cables are connected under such conditions, malfunctions or damage could occur.
Display the MEAS screen on both master and slave units, when executing time control, integration start/stop, data reset, and HOLDing event.
Connecting Multiple 3390 with Sync Cables
This description uses an example of three 3390.
Required items: Three 3390s, two Model 9683 Connection Cables
Procedure
1. Verify that all 3390s are turned off.
2. As shown below, connect the sync cables between the OUT and IN terminals of the master
3. Turn each instrument on in the following order: master, slave 1, slave 2 (turn the instruments off in the reverse order).
Master
Slave 1
Sync interface OUT jack
Slave 2
IN
Ferrite core
OUT
IN jack
See (p. 131) for sync cable connectors and pin-outs.
9683 Connection Cable (for synchronization)
• As a single measurement system, settings are made only on the master.
• During synchronous control, the 9683 Connection Cable conduct control signals. Never disconnect a sync cable during synchronous control, as the control signals would be interrupted.
• The IN and OUT ends of the 9683 Connection Cable are different. Do not apply excessive insertion force.
• Turning slaves on first may result in synchronization errors.
Chapter 8 Connecting External Devices
and each slave.
8
130
8.3 Connecting Multiple 3390 (Synchronized Measurements)
Instrument Settings for Synchronous Measurement
Set each instrument to be either the master or a slave.
These settings are made on the [Interface] page of the Setting screen.
Setting Procedure
Display the
[Interface] page
Select [Sync control]
Select with the F keys
Select [Sync event]
Select with the F keys
Reboot the instrument when changing
from master to slave.
Sync event
Select the events to be synchronized
(master settings are reflected on the slaves)
HOLD
Pressing
on the master activates Data Hold on all instruments.
SAVE
Pressing
on the master executes manual saving on all instruments.
COPY
Pressing
+
on the master captures the screen image on all instruments.
• The RTC clock time, timer, and clock control start and stop times cannot be set on the slave
instruments.
• Selecting [SAVE] or [COPY] as a synchronized event sets the manual save destination
folder appropriately and records data on each 3390.
See"7.5.1 Manually Saving Measurement Data" (p. 108), "7.7 Saving Screen Capture Images" (p. 114)
• To save measurement data to storage media with an interval time control combination, set
the same interval setting on the master and all slaves, and enable auto-saving (set to ON). In
this case, selecting [SAVE] as a synchronous event has no effect.
See"5.1 Timing Control Functions" (p. 91), "7.5.2 Auto-Saving Measurement Data" (p. 110)
• Confirm no error display on the slave unit's screen when executing the synchronization
event.
131
8.3 Connecting Multiple 3390 (Synchronized Measurements)
Sync Cable Pin-Outs
Sync Output (OUT): 8-pin mini-DIN plug pin
configuration
Sync Input (IN): 9-pin mini-DIN plug pin
configuration
+5 V
+5 V
Output
Terminal
120 Ω
+5 V
10 kΩ
Input Terminal
100 pF
10 kΩ
GND
GND
Pin No.
I/O
Function
Pin No.
I/O
Function
1
O
Data Reset 0 for data reset
1
I
Data Reset 0 for data reset
2
O
Start/Stop Integration
0: Start, 1: Stop
2
I
Start/Stop Integration
0: Start, 1: Stop
3
O
1-s clock
3
I
1-s clock
4
O
Event 0 for valid event
4
I
Event 0 for valid event
5
I
Master/Slave setting
5
O
Master/Slave setting
6
-
Unused
6
-
Unused
7
I/O
GND
7
I/O
8
I/O
GND
GND
8
Chapter 8 Connecting External Devices
132
8.4 Using Analog and Waveform D/A Output Options (must be factory installed before
8.4 Using Analog and Waveform D/A Output
Options (must be factory installed
before shipping)
The instrument can provide analog (p. 135)or waveform output (p. 135) using one of the following D/A
output options (specified before factory shipping).
• 9792 D/A Output Option
• 9793 Motor Testing & D/A Output Option
Both output options provide 16 output channels selectable from the basic measurement items.
To avoid electric shock and short circuits, turn the instrument and measurement
line power off before connecting or disconnecting D/A outputs.
• To avoid damage to the instrument, do not short-circuit or apply voltage between outputs.
• The outputs are not isolated from one another.
8.4.1 Connecting Application-Specific Devices to the
Instrument
Use a mating D-sub connector to connect the D/A outputs to the desired device (oscilloscope, data
logger/recorder).
To be safe, always turn off the instrument and devices before making connections. Turn the instrument
and devices on after confirming the connections.
Output Circuit
+12 V
Output
Terminal
GND
100 Ω
-12 V
The impedance of each output is approximately 100 Ω, so the inputs of the recording, DMM or
other device to be connected should be high impedance (at least 1 MΩ).
See "Chapter 10 Specifications" (p. 149)
133
8.4 Using Analog and Waveform D/A Output Options (must be factory installed before
D/A Output Connector Pin-Out
Output
( ) waveform output
content
Pin No.
Output
1
GND
14
GND
2
D/A1 (U1)
15
D/A9
3
D/A2 (I1)
16
D/A10
4
D/A3 (U2)
17
D/A11
5
D/A4 (I2)
18
D/A12
6
D/A5 (U3)
19
D/A13
7
D/A6 (I3)
20
D/A14
8
D/A7 (U4)
21
D/A15
9
D/A8 (I4)
22
D/A16
10
GND
23
GND
11
GND
24
GND
12
GND
25
GND
13
GND
Pin No.
Instrument
Rear Panel
How to connect D/A output terminals
User the supplied connector (DB-25P-NR, D819678-2R Japan Aviation Electronics Industry,Ltd) or
equivalent connector to connect to the external control and output terminals.
Rear panel
Soldering
8
Cord
Connector cover
Cable fixture
Shielded cable
•
•
•
•
•
Solder the cord securely.
Fix the connector and connector cover by the supplied screws (M2.6x6).
Hold the connector cover when connecting or disconnecting the connector.
Use the shielded cable for output and external control.
Connect to the connector cover or cable fixture if the cable's shield is not grounded.
Chapter 8 Connecting External Devices
Screw
134
8.4 Using Analog and Waveform D/A Output Options (must be factory installed before
8.4.2 Output Item Selection
Select the items for D/A output. Up to 16 items can be selected.
Make the settings on the [D/A Out] page of the Setting screen.
Setting Procedure
Display the [D/A Out]
page
Select [Wave output]
Select with the F keys
ON: Enable waveform output
OFF: Disable waveform output
Select a channel to be
set.
(the pull-down menu appears)
Main parameter
Sub parameter
Select parameter items
(sub parameter last)
Pull-Down Menu
Enter:
Select the sub parameter.
or
Cancel:
or
Freq f.s.
Set this to output frequency in the analog output.
100 Hz, 500 Hz, 1 kHz, 5 kHz
When a motor analysis option is installed, this is the same as the maximum motor measurement frequency setting. ("Max frequency" (p. 88))
Integ f.s.
Set for analog outputs. ("About Full-Scale Integration" (p. 135))
1/10, 1/2, 1/1, 5, 10, 50, 100, 500, 1000, 5000, 10000
• Waveform output can be selected only for channels D/A1 to D/A8. Channels D/A9 to D/A16
are for analog output only.
• Items selected on the MEAS, SYSTEM or FILE screen are always output.
135
8.4 Using Analog and Waveform D/A Output Options (must be factory installed before
About Analog Outputs
•
•
•
•
Instrument measurement values are output as level-converted DC voltages.
Voltage and current (sensor) inputs are isolated from the outputs.
Select a basic measurement item for each of up to 16 outputs, or for up to eight waveform outputs.
Long-term trend recording is available by connecting a data logger or recorder.
Specifications
Output voltage
±5 V DC (approx. ±12 V max. See "Output Level" (p. 136) for the output ratings of each item)
Output impedance
100 Ω ±5 Ω
Output update rate
50 ms (depending on data update rate of selected item)
Full-scale frequency
100 Hz, 500 Hz, 1 kHz, 5 kHz
(same as the maximum motor measurement frequency setting)
Full-scale integration
(1/10, 1/2, 1/1, 5, 10, 50, 100, 500, 1000, 5000, 10000) × range
• Positive and negative over-range voltages are approximately +6 and -6 V, respectively. (For voltage
•
•
•
•
•
•
and current peaks are about 5.3 V.)
Maximum output voltage is approximately ±12 V.
When using VT or CT ratio, the output is ±5 V DC at the "VT/CT ratio × range".
When HOLDing, peak HOLDing or averaging, the output value is the result of these functions.
During data hold when an interval time is set, outputs are updated after each interval.
When auto-ranging is enabled, the analog output levels change with auto-ranging. Be careful to
avoid range conversion mistakes when measuring rapidly fluctuating values. Such mistakes can be
avoided by using a fixed, manually selected range.
Harmonic analysis data other than the basic measurement items is not available for output.
About Full-Scale Integration
About Waveform Outputs
• Output signals are waveforms of the instantaneous values of input voltages and currents.
• Voltage inputs and current sensor inputs are mutually isolated.
• Combine with an oscilloscope to observe waveforms of phenomena such as device inrush current.
Specifications
Output voltage
±2 V Crest Factor 2.5 or higher
Output impedance
100 Ω ±5 Ω
Output update rate
500 kHz
•
•
•
•
•
D/A1: U1, D/A2: I1, D/A3: U2, D/A4: I2, D/A5: U3, D/A6: I3, D/A7: U4, D/A8: I4
Waveform clipping occurs at approximately ±7 V.
Maximum output voltage is approximately ±12 V.
When using VT or CT ratio, the output is ±2V at "VT/CT ratio × range".
Waveform output consists of uninterrupted instantaneous values, regardless of data hold, peak
hold, or averaging operations.
• When auto-ranging is enabled, the analog output levels change with auto-ranging. Be careful
to avoid range conversion mistakes when measuring rapidly fluctuating values. Such mistakes can be avoided by using a fixed range.
8
Chapter 8 Connecting External Devices
The full-scale value is set for the analog output in integration.
For example, when the integration value is less than the full scale value, the time for the integration value
to reach full-scale is long, so D/A output voltage changes slowly.
Conversely, when the integration value is larger than the full-scale value, the time to reaching the fullscale value becomes short, and D/A output voltage changes quickly.
The full scale value of integrated power can be changed for the D/A output by setting the integration full
scale.
136
8.4 Using Analog and Waveform D/A Output Options (must be factory installed before
8.4.3 Output Level
Full-scale D/A output span is ±5 V DC. This corresponds to the full-scale measurement input spans as
follows.
Selected Output Item
Full Scale
Voltage and current of each channel, Sum of voltage and current Measurement range (with polarity)
(dc, pk+ and pk- for each U1 to U4, I1 to I4, U12, U34, U123, I12, D/A output value
I34, or I123)
-100%f.s. to 0 to +100%f.s. → -5 V to 0 to +5 V
Motor analysis options, temperature (chA, Pm, Temp)
Voltage and current of each channel, Sum of voltage and current Measurement range (with polarity)
(rms, mn, ac and fnd of each U1 to U4, I1 to I4, U12, U34, U123, D/A output value
U12, I34 or I123)
0 to +100%f.s. → 0 to +5 V
Motor analysis options (chB)
Active, reactive, and apparent power on each channel
(P1 to P4, Q1 to Q4, S1 to S4)
Apparent power has no polarity
(voltage range) × (current range)
For example, measuring in the 300 V and 10 A ranges supports 3
kW full-scale active power measurements.
Active power D/A output value
-3 kW to 0 to +3 kW → -5 V to 0 to +5 V
Apparent power D/A output value
0 to +3 kVA → 0 to +5 V
Sum of active power, reactive power and apparent power in the
1P3W, 3P3W2M or 3P3W3M measurement.
(P12, P34, Q12, Q34, S12, S34, P123, Q123, S123)
Apparent power has no polarity
(voltage range) × (current range) ×2
For example, measuring in the 300 V and 10 A ranges supports 6
kW full-scale active power measurement.
Active power D/A output value
-6 kW to 0 to +6 kW → -5 V to 0 to +5 V
Apparent power D/A output value
0 to +6 kVA → 0 to +5 V
Sum of active power, reactive power and apparent power in the
3P4W measurement.
(P123, Q123, S123)
Power factor has no polarity
(voltage range) × (current range)×3
For example, measuring in the 300 V and 10 A ranges supports 9
kW full-scale active power measurement.
Active power D/A output value
-9 kW to 0 to +9 kW → -5 V to 0 to +5 V
Apparent power D/A output value
0 to +9 kVA → 0 to +5 V
Power factor (λ)
Power phase angle (φ)
Efficiency (η)
Power factor D/A output value
-1 to 0 to +1 → -5 V to 0 to +5 V
Power phase angle D/A output value
-180° to 0 to +180° → -5 V to 0 to +5 V
Efficiency D/A output value
0 to 200% → 0 to +5 V
Current integration (Ih)
(current range) × (full-scale integration)
For example, integrating for one hour in the 10 A range supports 10
Ah full-scale current integration measurement.
Current integration D/A output value
-10 Ah to 0 to +10 Ah → -5 V to 0 to +5 V
Active power integration (WP) in 1P2W
(voltage range) × (current range) × (full-scale integration)
For example, integrating for one hour in the 300 V and 10 A ranges
supports 3 kW full-scale active power integration measurements.
Active power integration D/A output value
-3 kWh to 0 to +3 kWh → -5V to 0 to +5 V
Active power integration (WP) in 1P3W, 3P3W2M, and 3P3W3M
(voltage range) × (current range) × (full-scale integration) ×2
For example, integrating for one hour in the 300 V and 10 A ranges
supports 6 kWh full-scale active power integration measurements.
Active power integration D/A output value
-6 kWh to 0 to +6 kWh → -5 V to 0 to +5 V
Active power integration (WP) in 3P4W
(voltage range) × (current range) × (full-scale integration) ×3
For example, integrating for one hour in the 300 V and 10 A ranges
supports 9 kWh full-scale active power integration measurements.
Active power integration D/A output value
-9 kWh to 0 to +9 kWh → -5 V to 0 to +5 V
Frequency (f1 to f4)
Full-scale frequency is full scale.
Refer to “10.4.1 Basic Measurement Items (p. 162) for items not listed in the above.
137
8.4 Using Analog and Waveform D/A Output Options (must be factory installed before
8.4.4 D/A Output Examples
Voltage and current (rms, mn, ac, fnd, thd),
apparent power
Voltage and current (dc, pk+, pk-),
active power, reactive power
Power phase angle
Power factor
Output is zero volts (0.0000 Hz displayed) for frequencies below 0.5 Hz and above 5 kHz
8
Frequency
Output held constant
Output held constant
5.
3.
4.
Time
Data
Hold
2.
Output held constant
Stop Integration
Start Integration
Stop Integration
Resume Integration
Data Hold
Resume Integration
Stop Integration
Data Hold
Cancel
Integration
Reset
Start Integration
Current and Active Power Integration
1. Analog output of the integration value is 5 V, which is the product of measurement range × full-scale
integration.
For example, when full-scale integration is set to 10 with the 300 W range, 3 kWh (300W ×10), 6 kWh
(300W × 10 × 2), and 9 kWh (300 W × 10 × 3) are all output as 5 V. (Multiples of -3 kWh are -5 V.)
2. Analog output changes when integration starts, and is held constant after integration stops.
3. The integration value is reset, and analog output becomes 0 V.
4. When the integration value exceeds ±5 V, analog output becomes 0 V and changes proceed from there.
5. When the data hold is activated during integration, analog output is held constant. However, when data
hold is canceled, analog output returns to the actual integration value.
Chapter 8 Connecting External Devices
1. Range × full-scale integration
138
8.5 Using the Motor Testing Option (when specified before factory shipping, for motor
8.5 Using the Motor Testing Option
(when specified before factory shipping,
for motor analysis)
Motor analysis can be performed when the Hioki 9791 Motor Testing Option or the 9793 Motor Testing &
D/A Output Option (referred to below as the motor analysis function) is installed.
Use the motor analysis function to measure torque, rotation rate, motor power and slip by acquiring signals from a tachometer, torque sensor or (incremental) revolution encoder.
Connecting a Torque Meter and Tachometer
When the motor analysis function is installed, apply torque signals to the CH A jack, and rotary encoder
signals to CH B and CH Z jacks (isolated BNC jacks are on the rear of the instrument).
CH A, CH B and CH Z jacks are isolated to support torque meters and tachometers with different ground
potentials.
Rear
CH A torque signal input BNC jack
CH B rotation signal input BNC jacks
CH Z rotation signal input BNC jacks
To avoid electric shock and damage to the instrument, observe the following
when connecting to the CH A torque signal input BNC jack and the CH B and
CH Z rotary signal input BNC jacks.
• Before connecting, turn off the instrument and any devices to be connected.
• Do not exceed the maximum input signal ratings.
• A serious accident could result if a plug falls out and contacts another conductor during operation. Ensure that all connections are secure.
When disconnecting a BNC
plug, always grip the plug and
release the lock before pulling
it out. Attempting to pull out a
plug without releasing the lock,
or pulling hard on the cable,
will damage the connectors.
Connect the instrument and input devices
using Hioki L9217 Connection Cords.
Guide pins on instrument
jack
Notches on BNC plug
Lock
Required items: Hioki L9217 Connection Cords (as needed), input devices
Procedure
1.
2.
3.
4.
Confirm the that instrument and input devices are turned off.
As shown in the examples on the next page, connect the output jacks on the input
devices to the instrument using the connection cords.
Turn the instrument on.
Turn the connected devices on.
139
8.5 Using the Motor Testing Option (when specified before factory shipping, for motor
Example 1. Connecting a torque meter that provides analog torque values and
rotation signals
Torque Meter
L9217 Connection Cord
CH A
Torque value
-10 V to 0 V to +10 V
Analog voltage output
Rotation signal
CH B
-10 V to 0 V to +10 V
Analog voltage output
CH Z
Example 2. Connecting a torque meter that provides torque values as frequency
and rotation signals as pulses
Torque meter
L9217 Connection Cord
CH A
Torque value
Frequency output
Rotation signal
CH B
Pulse output
CH Z
Example 3. Connecting a torque meter that provides torque values as frequency
and incremental rotary encoder signals
CH A
Torque value
Frequency output
Incremental Rotary Encoder
CH B
A-phase pulse output
CH Z
Z-phase pulse output
• CHPulse measurement is not available with CH Z only. Always use pulse input to CH B in
combination with CH Z.
• When using CH Z (original position signal or Z-phase), apply a train of at least four pulses to CH B.
Motor Analysis Settings on the Instrument, Displaying Measured Values
See section "4.8 Viewing Motor Measurement Values (With Hioki 9791 or 9793 installed)" (p. 82) for
measurement displays and instrument setting procedures.
Chapter 8 Connecting External Devices
Torque meter
L9217 Connection Cord
8
140
8.5 Using the Motor Testing Option (when specified before factory shipping, for motor
141
Operation with a
Chapter 9
Computer
The instrument includes standard USB and Ethernet interfaces to connect a computer for remote control.
The instrument can be controlled by communication commands, and measurement data can be transferred to the computer using the dedicated application program.
Ethernet ("LAN") Connection Capabilities
•Control the instrument remotely by internet browser. (p. 146)
•Control the instrument remotely with communication commands
(by creating a program and connecting to the TCP/IP communication command port)
•Control the instrument remotely using the dedicated application program to transfer measurement data to the computer.
USB Connection Capabilities
•Control the instrument remotely using the dedicated application program to transfer measurement data to the computer
(the program's USB driver must be installed on the computer).
Chapter 9 Operation with a Computer
Download the application program (with operating manual) and the communication command
manual from Hioki’s web page (http://www.hioki.com).
9
8
142
9.1 Control and Measurement via Ethernet ("LAN") Interface
9.1 Control and Measurement via Ethernet
("LAN") Interface
Remote control is available by internet browser. Measurement data is transferred to the computer by
using the dedicated software.
Before communicating, configure the instrument's LAN settings for the network environment, and connect
the instrument to a computer with the Ethernet cable.
• See the application program's operating manual for operating procedures.
• See the command communication manual for command communication procedures.
(Both are downloadable from http://www.hioki.com).
9.1.1 LAN Settings and Network Environment
Configuration
Configure the Instrument's LAN Settings
• Make these settings before connecting to a network. Changing settings while connected can
duplicate IP addresses of other network devices, and incorrect address information may otherwise be presented to the network.
• The instrument does not support DHCP (automatic IP address assignment) on a network.
Making Network Settings
Display the
[Interface] page
select a setting item
Select with the F keys
Reboot the instrument when changing
the network settings.
+1↑/-1↓
Increment/decrement by 1
+10↑/-10↓
Increment/decrement by 10
+100↑/-100↓
Increment/decrement by 100
143
9.1 Control and Measurement via Ethernet ("LAN") Interface
Setting Items
IP address
Identifies each device connected on a network.
Each network device must be set to a unique address.
The instrument supports IP version 4, with IP addresses indicated as four decimal octets, e.g., "192.168.0.1".
Subnet mask
This setting is used to distinguish the address of the network from the addresses
of individual network devices.
The normal value for this setting is the four decimal octets "255.255.255.0”.
Default Gateway
When the computer and instrument are on different but overlapping networks
(subnets), this IP address specifies the device to serve as the gateway between
the networks.
If the computer and instrument are connected one-to-one, no gateway is used,
and the instrument's default setting "0.0.0.0" can be kept as is.
Network Environment Configuration
Example 1. Connecting the instrument to an existing network
To connect to an existing network, the network system administrator (IT department) has to assign settings
beforehand.
Some network device settings must not be duplicated.
Obtain the administrator's assignments for the following items, and write them down.
IP Address
Subnet Mask
Default Gateway
___.___.___.___
___.___.___.___
___.___.___.___
Example 2. Connecting multiple instruments to a single computer using a hub
When building a local network with no outside connection, the following private IP addresses are recommended.
Example 3. Connecting one instrument to a single computer using the 9642 LAN
Cable
The 9642 LAN Cable can be used with its supplied connection adapter to connect one instrument to one
computer, in which case the IP address is freely settable. Use the recommended private IP addresses.
IP Address ........................... Computer:192.168.1.1
Power Analyzers:192.168.1.2 (Set to a different IP address than the computer.)
Subnet Mask ........................ 255.255.255.0
Default Gateway .................. 0.0.0.0
Chapter 9 Operation with a Computer
Configure the network using addresses 192.168.1.0 to 192.168.1.24
IP Address ........................... Computer:192.168.1.1
Power Analyzers: assign to each instrument in order 192.168.1.2,
192.168.1.3, 192.168.1.4, ...
Subnet Mask ........................ 255.255.255.0
Default Gateway .................. 0.0.0.0
9
8
144
9.1 Control and Measurement via Ethernet ("LAN") Interface
9.1.2 Instrument Connection
Connect the instrument to the computer using an Ethernet LAN cable.
Required items:
When connecting the instrument to an existing network
(prepare any of the following):
• Straight-through Cat 5, 100BASE-TX-compliant Ethernet cable (up to 100 m,
commercially available). For 10BASE communication, a 10BASE-T-compliant
cable may also be used.
• Hioki 9642 LAN Cable (option)
When connecting one instrument to a single computer
(prepare one of the following):
• 100BASE-TX-compliant cross-over cable (up to 100 m)
• 100BASE-TX-compliant straight-through cable with cross-over adapter (up to 100
m)
• Hioki 9642 LAN Cable (option)
Instrument Ethernet ("LAN") interface
The Ethernet interface jack is on the right side.
Ethernet Interface Jack
RX/TX LED
LINK LED
The RX/TX LED blinks when sending and
receiving data, and the LINK LED lights
when linked to the destination network
device.
145
9.1 Control and Measurement via Ethernet ("LAN") Interface
Connecting the Instrument to a Computer with an Ethernet ("LAN") Cable
Connect by the following procedure.
When connecting the instrument to an existing network
(connect the instrument to a hub)
1
Connect to the Ethernet jack on the instrument.
2
Connect to a 100BASE-TX hub.
When connecting the instrument to a single computer
(connect the instrument to the computer)
Use the Hioki 9642 LAN Cable and cross-over adapter (9642 accessory)
Cross-Over Adapter
Ethernet Interface
Jack
2
Connect the cross-over adapter to
the Ethernet interface jack on the
instrument.
1
3
Connect the Ethernet cable to the
cross-over adapter.
Connect the other end of the Ethernet cable to the 100BASE-TX Ethernet jack on
the computer.
9
8
Chapter 9 Operation with a Computer
When the Ethernet connection is established, the LAN indicator appears at the top of the screen, as
shown below.
146
9.2 Remote Control of the Instrument by Internet Browser
9.2 Remote Control of the Instrument by
Internet Browser
The instrument includes a standard HTTP server function that supports remote control by an internet
browser on a computer. The instrument’s display screen and control panel keys are emulated in the
browser. Operating procedures are the same as on the instrument.
• For remote control of the instrument by the browser, Java may need to be installed, depending on the computer environment. If needed, download and install JRE (the Java run-time
environment) from http://www.java.com.
• The browser (Internet Explorer) security level should be set to Medium or Medium-high.
• Unintended operations may occur if remote control is attempted from multiple computers
simultaneously. Use one computer at a time for remote control.
9.2.1 Connecting to the Instrument
Launch Internet Explorer (afterwards called IE), and enter "http://" followed by the IP address assigned to
the instrument in the browser's address bar.
For example, if the instrument's IP address is 192.168.0.1, enter as follows.
Enter "http://IP Address/".
Click
When the Main page appears as illustrated, the connection to the instrument has been established.
Click the [Remote control] link to jump to the Remote Control page.
What if the Main Page does not display?
• Check the network settings on the instrument and the IP address of the computer.
See"9.1.1 LAN Settings and Network Environment Configuration" (p. 142)
• Check that the LINK LED in the Ethernet internet jack is lit, and that
displayed on the instrument’s screen.
See"9.1.2 Instrument Connection" (p. 144)
(the LAN indicator) is
147
9.2 Remote Control of the Instrument by Internet Browser
9.2.2 Operating Procedure
The instrument's screen and control panel emulations appear in the browser.
Click on the control panel keys to perform the same operations as the instrument keys.
To enable automatic browser screen updating, set the Update Time in the Auto Update menu.
Instrument Screen Emulation
Control Panel Emulation
Auto Display
Update
Auto Display
Update Settings
The instrument screen emulation updates at the specified interval.
OFF, 0.5s, 1s, 2s, 10s, 60s
What if the following message appears?
9
8
• Is the browser's security restriction set too high, or is Java being inhibited by security
software?
Change the browser's security setting to Medium or Medium-high.
• Is Java installed on the computer?
Install Java.
The communication may becomes slow in the Java6 installed environment.
In this case, please set not to keep the temporally internet file from the Java dialog in the control panel of the computer.
Chapter 9 Operation with a Computer
Click this link to jump to the Java website
(if the computer is connected to the internet).
148
9.3 Control and Measurement via USB Interface
9.3 Control and Measurement via USB Interface
The instrument can be remotely controlled and measurement data transferred to a computer using a
standard USB connection.
• Install the dedicated software to a computer before connecting this instrument to a computer.
• A dedicated application program can be downloaded from Hioki’s web site (http://
www.hioki.com). See the application program’s manual for operating procedures.
• To connect the instrument to a computer the first time, a dedicated USB driver must be
installed. This driver is provided with the above application program.
(Compatible to the Windows2000, XP and Vista (32-bit))
9.3.1 Connecting to the Instrument
Connect the instrument to the computer with a USB cable. No
instrument settings are necessary to establish the USB connection.
USB port on computer
USB port
USB cable (supplied with the instrument)
The USB indicator is displayed when the connection to the computer is established.
• To avoid faults, do not disconnect or reconnect the USB cable during instrument operation.
• Connect the instrument and the computer to a common earth ground. Using different
grounds could result in potential difference between the instrument and the computer.
Potential difference on the USB cable can result in malfunctions and faults.
If both the instrument and computer are turned off the power while connected by the USB
cable, turn on the power of the computer first. It is not able to communicate if the instrument is
turned on the power first.
9.3.2 After Connecting
Install the USB driver on the computer before running the dedicated application program.
Before disconnecting the USB cable from the computer, click the "Safely Remove Hardware" icon in the
navigation tray and select the instrument to be disconnected.
149
10.1 General Specifications
Specifications Chapter 10
10.1 General Specifications
Environmental Safety Specifications
Operating environment
Indoors, up to 2000 m (6562-ft.) Pollution degree 2
Storage temperature and humidity -10 to 55°C (14 to 131°F) 80% RH or less (non-condensating)
Operating temperature and humidity 0 to 40°C (32 to 104°F) 80% RH or less (non-condensating)
@50/60 Hz, for 15 s
5.312 kVrms AC (1 mA sense current) Between voltage measurement jacks and instrument chassis
3.32 kVrms AC (1 mA sense current) Between voltage and current measurement jacks, and interface jacks
370 Vrms AC (1 mA sense current) 9791, 9793input terminal (CH A, CH B, CH Z) - 3390to instrument
chassis, Between channels A, B, and Z
Applicable standards
Safety : EN61010
EMC : EN61326 Class A
EN61000-3-2
EN61000-3-3
Rated supply voltage
100 V to 240 VA Anticipated transient overvoltage: 2500 V
(Voltage fluctuations of ±10% from the rated supply voltage are taken into account.)
Rated supply frequency
50/ 60 Hz
Maximum rated power
140 VA
Dimensions
Approx. 340 W× 170 H × 157 D mm (13.39" W × 6.69" H × 6.18" D) (excluding protrusions)
mass
Approx. 4.8 kg (169.3 oz.) (with Model 9793 installed)
Backup battery life
Clock, settings and integration values (Lithium battery), (Litium battery) , Approx. 10 years @23°C
Accessories and Options Specifications
Accessories
•
•
•
•
•
•
Special-order options (preshipping installation only)
9791 Moter Testing Option
9792 D/A Output Option
9793 Moter Testing & D/A Output Option
Current measurement option
9272-10 Clamp-On Sensor
9277 Universal Clamp-On CT
9278 Universal Clamp-On CT
9279 Universal Clamp-On CT
9709 AC/DC Current Sensor
CT6862 AC/DC Current Sensor
CT6863 AC/DC Current Sensor
Instruction Manual ............................................................................... 1
Power cord .......................................................................................... 1
Measurement Guide............................................................................ 1
USB cable (USB 2.0, with ferrite core, approx. 0.9 m) ........................ 1
Measurement cable label sheet .......................................................... 2
D-sub connector (for Model 9792 and 9793 D/A output options) ........ 1
Voltage measurement option
L9438-50 Voltage CordVoltage Measurement Cable Leads (banana male-to-male with alligator clip,
one each red and black, about 3m long)
9243 Grabber Clip (one each red and black)
Printer option
9670 Printer
9671 AC Adapter (for Model 9670)
9638 RS-232C Cable (for Printer)
9237 Recording Paper (80 mm - 25 m, 4 rolls)
Computer connection option
9642 LAN Cable
9726 PC Card 128MB (128MB CompactFlash Card + Adapter)
9727 PC Card 256MB (256MB CompactFlash Card + Adapter)
9728 PC Card 512MB (512MB CompactFlash Card + Adapter)
9729 PC Card 1GB (1GB CompactFlash Card + Adapter)
9830 PC Card 2GB (2GB CompactFlash Card + Adapter)
Other Options
9794 Carrying Case
L9217 Connection Cord (Insulated BNC male-to-male, 1.5 m (for Model 9791 and Model 9793)
9683 Connection Cable (for synchronization 1.5 m)
Chapter 10 Specifications
Dielectric strength
10
10
150
10.1 General Specifications
Basic Specifications
1.Power Measurement Input Specifications
Measurement line type Single-phase 2-wire (1P2W), Single-phase 3-wire (1P3W), 3-phase, 3-wire (3P3W2M, 3P3W3M), 3-phase, 4-wire (3P4W)
Mode 1
CH1
CH2
CH3
CH4
1P2W
1P2W
1P2W
1P2W
1P2W
Mode2
1P3W
1P2W
Mode3
3P3W2M
1P2W
Mode4
1P3W
Mode5
3P3W2M
1P3W
Mode6
3P3W2M
3P3W2M
1P2W
1P3W
Mode7
3P3W3M
1P2W
Mode8
3P4W
1P2W
Number of input channels
Voltage ...... 4 channels U1 to U4
Current ...... 4 channels I1 to I4
Measurement input terminal type
Voltage ...... Plug-in jacks (safety jacks)
Current ...... Dedicated custom connectors
Input methods
Voltage ...... isolated inputs, resistive dividers
Current ...... Insulated current sensors (voltage output)
Voltage range
1500 V, 600 V, 300 V, 150 V, 60 V, 30 V, 15 V @selectable for each measured wiring system
Current range
20 A, 8 A, 4 A, 2 A (20 A with 9272-10)
20 A, 8 A, 4 A, 2 A, 0.8 A, 0.4 A (20 A with 9277)
200 A, 80 A, 40 A, 20 A, 8 A, 4 A (200 A with 9272-10, 9278 and CT6863)
50 A, 20 A, 10 A, 5 A, 2 A, 1 A (CT6862)
500 A, 200 A, 100 A, 50 A, 20 A, 10 A (9279 and 9709)
selectable for each measurement channel (however, the same sensor type must be used for each
channel in multiphase wiring systems)
Crest factor
3 (Voltage, Current) Except 1500 V range: 1.33
Input resistance (50/60 Hz)
Voltage input section 2 MΩ ±40 kΩ (differential inputs)
Current sensor input section1 MΩ ±50 kΩ
Maximum input voltage
Voltage input section 1500 V, ±2000 Vpeak
Current sensor input section 5 V, ±10 Vpeak
Maximum rated voltage to earth
Voltage input terminal1000 V (50/60 Hz)
Measurement Categories III 600 V (anticipated transient overvoltage 6000 V)
Measurement Categories II 1000 V (anticipated transient overvoltage 6000 V)
Measurement method
Simultaneous digital sampling of voltage and current, simultaneous zero-crossing calculation method
Sampling
500 kHz/ 16bit
Measurement frequency range
DC, 0.5 Hz to 150 kHz
Synchronization frequency range
0.5 Hz to 5 kHz
Selectable lower limit measurement frequency (0.5 Hz, 1 Hz, 2 Hz, 5 Hz, 10 Hz, 20 Hz)
Synchronization source
U1 to U4, I1 to I4, Ext (with the motor evaluation option installed and CH B set for pulse input),
DC (50 or 100 ms fixed)
Selectable for each measurement channel (U/I of each channel must be the same as the sync
source)
The zero-crossing filter automatically matches the digital LPF when U or I is selected.
Two filter levels (strong or mild)
Operation and accuracy are undetermined when the zero-crossing filter is disabled (off).
Operation and accuracy are undetermined when U or I is selected and measured input is below 30% f.s.
Data update interval
50 ms
LPF
OFF, 500 Hz, 5 kHz, 100 kHz (selectable for each wiring system)
500 Hz.... Accurate to 60 Hz or better, With specified accuracy to +0.1% f.s.
5 kHz ...... Accurate to 500 Hz or better
100 kHz .. Accurate to 20 kHz or better, (add 1% rdg. from 10 kHz to 20 kHz)
Polarity discrimination
Voltage/current zero-crossing timing comparison method
Zero-crossing filter provided by digital LPF
Measurement items
Voltage (U), Current (I), active power (P), apparent power (S), reactive power (Q), power factor (λ),
power phase angle (φ), frequency (f), efficiency (η), loss (Loss), voltage ripple factor (Urf, current
ripple factor (Irf), current integration (Ih), power integration (WP), peak voltage (Upk), peak current
(Ipk)
151
10.1 General Specifications
1.Power Measurement Input Specifications
Accuracy
Voltage(U)
Current(I)
Active power(P)
DC
±0.1%rdg.±0.1%f.s.
±0.1%rdg.±0.1%f.s.
±0.1%rdg.±0.1%f.s.
0.5 Hz to 30 Hz
±0.1%rdg.±0.2%f.s.
±0.1%rdg.±0.2%f.s.
±0.1%rdg.±0.2%f.s.
30 Hz to 45 Hz
±0.1%rdg.±0.1%f.s.
±0.1%rdg.±0.1%f.s.
±0.1%rdg.±0.1%f.s.
45 Hz to 66 Hz
±0.05%rdg.±0.05%f.s.
±0.05%rdg.±0.05%f.s.
±0.05%rdg.±0.05%f.s.
66 Hz to 1 kHz
±0.1%rdg.±0.1%f.s.
±0.1%rdg.±0.1%f.s.
±0.1%rdg.±0.1%f.s.
1 kHz to 10 kHz
±0.2%rdg.±0.1%f.s.
±0.2%rdg.±0.1%f.s.
±0.2%rdg.±0.1%f.s.
10 kHz to 50 kHz
±0.3%rdg.±0.2%f.s.
±0.3%rdg.±0.2%f.s.
±0.4%rdg.±0.3%f.s.
50 kHz to 100 kHz
±1.0%rdg.±0.3%f.s.
±1.0%rdg.±0.3%f.s.
±1.5%rdg.±0.5%f.s.
100 kHz to 150 kHz
±20%f.s.
±20%f.s.
±20%f.s.
From 0.5 to 10 Hz, voltage, current and active power values are for relative comparison only
From 10 to 16 Hz and over 220 V, voltage and active power values are for relative comparison only
From 30 kHz to 100 kHz and over 750 V, voltage and active power values are for relative comparison only
From 100 kHz to 150 kHz and over 22000/f [kHz], voltage and active power values are for relative
comparison only
Over 1000 V, voltage and active power values are for relative comparison only
For current and active power measurements, combine the accuracy of the current sensor with the
above accuracies
Period of guaranteed accuracy
6 months (and 1.5 times specified accuracy for one year)
Conditions of Guaranteed Accuracy Temperature and humidity for guaranteed accuracy: 23±3°C, 80%RH or less
Warm-up time30 minutes or more
Input ....... Within the specified ranges when the fundamental wave is synchronized with the sync
source, for sine wave input, power factor of one, zero ground voltage, after zero adjustment
±0.01%f.s./ °C (for DC, add ±0.01% f.s./°C)
Effect of common mode voltage
±0.01%f.s. or less (with 1000 V @50/60 Hz applied between voltage measurement jacks and chassis)
Magnetic field interference
±1%f.s. or less (in 400 A/m magnetic field, DC and 50/60 Hz)
Power factor influence
±0.15%f.s. or less (45 Hz to 66 Hz with power factor = 0.0)
with 500 Hz LPF, add ±0.45% f.s.
Susceptibility to conducted
electromagnetic field
@3 V, current and active power not more than ±6% f.s., where f.s. current is the rated primary-side
current of the current sensor
f.s. active power equals the voltage range × the rated primary-side current of the current sensor
Susceptibility to radiated
electromagnetic field
@10 V/m, current and active power not more than ±6% f.s., where f.s. current is the rated primaryside current of the current sensor, and f.s. active power equals the voltage range × the rated primaryside current of the current sensor
Effective measuring range
Voltage, Current, Power ..... 1% to 110% of the range
Total display area
Voltage, Current, Power ..... Voltage, current and power: from zero-suppression range setting to 120%
Zero-suppression ranges
Selectable OFF,0.1 or 0.5% f.s.
When OFF, non-zero values may be displayed even with no measurement input
Zero adjustment
Voltage ±10%f.s., current ±10% f.s. with no more than ±4 mV zero-adjustment compensation
Waveform peak measurement
range
Within ±300% of each voltage and current range
Waveform peak measurement
accuracy
Within ±2% f.s. of voltage and current display accuracy
2.Frequency Measurement Specifications
Measurement channels
Four (f1 to f4)
Measurement source
Select U/I for each measurement channel
Measurement method
Reciprocal method + zero-crossing sample value correction
Measuring range
Synchronous range from 0.5 Hz to 5 kHz (with 0.0000 Hz unmeasurable time)
Selectable lower limit measurement frequency (0.5 Hz, 1 Hz, 2 Hz, 5 Hz, 10 Hz, 20 Hz)
Data update interval
50 ms (measurement-frequency-dependent at 45 Hz and below)
Accuracy
±0.05% rdg. ±1 dgt. (sine wave, amplitude at least 30% of measurement range)
Numerical display format
0.5000 Hz to 9.9999 Hz, 9.900 Hz to 99.999 Hz, 99.00 Hz to 999.99 Hz,
0.9900 kHz to 5.0000 kHz
3.Integration Measurement Specifications
Measurement Mode
Selectable RMS or DC for each wiring mode (DC is selectable only for 1P2W wiring and AC/DC sensors)
Measurement items
Current integration (Ih+, Ih-, and Ih), active power integration (WP+, WP-, and WP)
Ih+ and Ih- only for DC mode measurements, and lh only for RMS mode measurements
Chapter 10 Specifications
Temperature coefficient
10
10
152
10.1 General Specifications
3.Integration Measurement Specifications
Measurement method
Digital calculation from each current and active power phase (when averaging, calculates with previous average value)
In DC mode: calculates current value at every sample, and integrates instantaneous power independent of polarity
In RMS mode: Integrates current effective values between measurement intervals, and polarity-independent active power value
Measurement Interval
50 ms data update interval
Display resolution
999999 (6 digits + decimal)
Measuring range
0 to ±9999.99 TAh / TWh (limited to maximum integration time of 9999 hours, 59 minutes, and 59
seconds)
Integration stops when either maximum integration value or time is exceeded.
Integration time accuracy
±50ppm±1dgt. (0°C to 40°C)
Integration accuracy
± (current and active power accuracy) ± integration time accuracy
Backup function
Integration automatically resumes after power outages.
4.Harmonic Measurement Specifications
Number of measurement channels 4 Channels
Harmonic measurements not available for multiple systems with different frequencies.
Measurement items
Harmonic rms voltage, harmonic voltage percentage, harmonic voltage phase angle, harmonic rms
current, harmonic current percentage, harmonic current phase angle, harmonic active power, harmonic power percentage, harmonic voltage-current phase difference, total harmonic voltage distortion, total harmonic current distortion, voltage imbalance, current imbalance
Measurement method
Zero-crossing synchronous calculation (all channels in same window), with gap
Fixed 500 kHz/s sampling, after digital anti-aliasing filter
Equal thinning between zero crossings (with interpolation calculation)
Synchronization source
U1 to U4, I1 to I4, External (with motor evaluation option installed and CH B set for pulse input), DC
selectable (50 or 100 ms)
FFT calculation word length
32 bits
Anti-aliasing filter
Digital filter (variable according to sync frequency)
Windows
Rectangular
Synchronization frequency range
As specified for power measurements
Data update interval
50 ms (measurement-frequency-dependent at 45 Hz and below)
Phase zero adjustment
Provided by key operation or external control command (only with external sync source)
Highest order analysis
Accuracy
Synchronization frequency
range
Window waveforms
Analysis order
0.5 Hz to 40 Hz
1
100th
40 Hz to 80 Hz
1
100th
80 Hz to 160 Hz
2
80th
160 Hz to 320 Hz
4
40th
320 Hz to 640 Hz
8
20th
640 Hz to 1.2 kHz
16
10th
1.2 kHz to 2.5 kHz
32
5th
2.5 kHz to 5.0 kHz
64
3th
Frequency
Voltage(U), Current(I), Active Power(P)
0.5 Hz to 30 Hz
±0.4%rdg.±0.2%f.s.
30 Hz to 400 Hz
±0.3%rdg.±0.1%f.s.
400 Hz to 1 kHz
±0.4%rdg.±0.2%f.s.
1 kHz to 5 kHz
±1.0%rdg.±0.5%f.s.
5 kHz to 10 kHz
±2.0%rdg.±1.0%f.s.
10 kHz to 13 kHz
±5.0%rdg.±1.0%f.s.
Not specified for sync frequencies of 4.3 kHz and higher
Add the LPF accuracy to the above when using LPF.
153
10.1 General Specifications
5.Noise Measurement Specifications
Calculation channels
1(Select one from CH1 to CH4)
Calculation parameters
Voltage/Current
Calculation type
RMS spectrum
Calculation method
Fixed 500 kHz/s sampling, thinning after digital anti-aliasing filter
FFT calculation word length
32 bits
FFT data points
1,000, 5,000, 10,000, or 50,000 (according to displayed waveform recording length)
Anti-aliasing filter
Automatic digital filter (varies with maximum analysis frequency)
Windows
Rectangular, Hanning, flat-top
Data update interval
Determined by FFT points within approx. 400 ms, 1s, 2s, or 15 s, with gap
Highest analysis frequency
100 kHz, 50 kHz, 20 kHz, 10 kHz, 5 kHz, 2 kHz
Frequency resolution
0.2 Hz to 500 Hz (Determined by FFT points and maximum analysis frequency)
Noise amplitude measurement
Calculates the ten highest level and frequency voltage and current peak values (local maxima).
In FFT calculation results, peak values are recognized when data levels on either side are lower.
The lower noise frequency limit can be specified.
6. Motor Evaluation Option Specifications (Models 9791 and 9793)
3 channels
CH A ....... Analog DC input, Frequency input
CH B ....... Analog DC input, Pulse input
CH Z ....... Pulse input
Measurement input jacks
Insulated BNC jacks
Input impedance (DC)
1 MΩ ±100 kΩ
Input methods
Isolated and differential inputs (not isolated between channels B and Z)
Measurement parameters
Voltage, torque, rotation rate, frequency, slip, and motor power
Maximum input voltage
±20 V (during analog, frequency, and pulse input)
Maximum rated voltage to earth
50 V (50/ 60 Hz)
Measurement category I, 50 V (500 V anticipated transient overvoltage)
Period of guaranteed accuracy
6 months (and 1.5 times specified accuracy for one year)
Conditions of Guaranteed
Accuracy
Temperature and humidity for guaranteed accuracy
80%RH or less
Warm-up time30 minutes or more
Input ...... With 0 V to ground, after zero adjustment
(1)Analog DC Input (CH A/ CH B)
Measurement range
±1 V, ±5 V, ±10 V (when inputting analog DC)
Valid input range
1% to 110%f.s.
Sampling
10 kHz / 16bit
Response time
1 ms (measuring zero to full scale, with LPF off)
Measurement method
Simultaneous digital sampling and zero-crossing synchronous calculation system (cumulative average of intervals between zero crossings)
Synchronization source
Same as 3390 power measurement input specification (common to CH A and CH B)
Measurement accuracy
±0.1%rdg. ±0.1%f.s.
Temperature coefficient
±0.03%f.s./°C
Effect of common mode voltage
Not more than ±0.01% f.s. (with 50 V [DC or 50/60 Hz] between measurement jacks and 3390 chassis)
Effect of external magnetic field
Not more than ±0.1% f.s. (at 400 A/m DC and 50/60 Hz magnetic fields)
LPF
OFF/ ON (OFF: 4 kHz, ON: 1 kHz)
Total display area
Zero-suppression range setting ±120%
Zero adjustment
Zero-corrected input offset of voltage ±10% f.s. or less
(2) Frequency Input (CH A only)
Valid amplitude range
±5 Vpeak
Max. measurement frequency
100 kHz
Measurement range
1 kHz to 100 kHz
Synchronization source
3390 Same as accuracy specifications
Data output interval
According to synchronization source
Measurement accuracy
±0.05%rdg. ±3dgt.
Total display area
1.000 kHz to 99.999 kHz
Chapter 10 Specifications
Number of input channels
10
10
154
10.1 General Specifications
(3) Pulse Input (CH B only)
Detection level
Not more than 0.5 V Low, and at least 2.0 V High
Measurement range
1 Hz to 200 kHz (at 50% duty)
Division setting range
1 to 60000
Measurement frequency range
0.5 Hz to 5.0 kHz (limited to measured pulse frequency divided by selected no. of divisions)
Minimum detectable pulse width
2.5 µs or better
Measurement accuracy
±0.05%rdg. ±3dgt.
(4)Pulse Input (CH Z only)
Detection level
Not more than 0.5 V Low, and at least 2.0 V High
Measurement range
0.1 Hz to 1 kHz
Minimum detectable pulse width
2.5 μs or better
Settings
OFF/ON (when ON, division of CH B is cleared on rising edges)
7. D/A Output Option Specifications (Models 9792 and 9793)
Number of output channels
16 channels
Output contents
Selectable waveform/analog outputs (from basic measurement parameters)
Waveform output only on Channels 1 to 8
Output connector
One 25-pin female D-sub
D/A conversion resolution
16 bits (polarity + 15 bits)
Output accuracy
Analog output .........Measurement accuracy ±0.2%f.s. (DC level)
Waveform output....Measurement accuracy±0.5%f.s. (rms level within synchronous frequency range)
Output update interval
Analog output .........50 ms (according to input data update interval of selected parameter)
Waveform output....500 kHz
Output voltage
Analog output ......... ±5 V DC nom. (approx. ±12 V DC max.)
Waveform output ...±2 V (crest factor at least 2.5)
Output impedance
100 Ω ±5 Ω
Period of guaranteed accuracy
6 months (1.5 times specified accuracy for one year)
Conditions of Guaranteed Accura- Temperature and humidity: 23±3°C 80% RH or less
cy
Warm-up time:.................... 30 minutes or more, After zero adjustment of the 3390
Temperature Coefficient
±0.05%f.s./°C
Pinout
13
12
25
11
24
10
23
9
8
7
6
5
22 21 20 19 18
4
17 16
3
2
1
15 14
Pin No.
Output (Waveform)
Pin No.
1
GND
14
Output (Waveform)
GND
2
D/A1 (U1)
15
D/A9
3
D/A2 (I1)
16
D/A10
4
D/A3 (U2)
17
D/A11
5
D/A4 (I2)
18
D/A12
6
D/A5 (U3)
19
D/A13
7
D/A6 (I3)
20
D/A14
8
D/A7 (U4)
21
D/A15
9
D/A8 (I4)
22
D/A16
10
GND
23
GND
11
GND
24
GND
12
GND
25
GND
13
GND
--
----------
155
10.1 General Specifications
8.Display Specifications
Languages
Japanese, English
Display type
9-inch TFT color LCD (800×480 dots)
Dot pitch
0.246(V) mm×0.246(H) mm
LCDbacklight
Always ON, Auto OFF (after 1, 5, 10, 30, or 60 minutes)
Display numerical resolution
99999 counts (999999 counts for integration)
99999 counts (999999 counts)
Display refresh interval
Measurement values: 200 ms (independent of internal data update interval)
Waveforms, FFT:....... screen-dependent
Screens
Measurement, Setting, and File Operation screens
9.External Interface Specifications
(1) USB Interface (Functions)
Connector
Mini-B receptacle
Compliance standard
USB2.0 (Full Speed/High Speed)
No. of ports
1
Class
Individual (USB488h)
Connection destination
Computer (Windows 2000, XP, Vista 32bit only)
Function
Data transfer, remote operation and command control
Not for simultaneous use with Ethernet: USB has priority when both interfaces used
(2) USB Memory Interface
USB type A connector
Compliance standard
USB2.0
USB power supply
500 mA maximum
No. of ports
1
USB storage device support
USB Mass Storage Class
Recordable content
Save and load settings files
Copy measurement values and recorded data (from CF card)
Save waveform data
Screen captures
(3) LAN Interface
Connector
RJ-45 connector × 1
Compliance standard
IEEE802.3 compliamt
Transmission method
10BASE-T/ 100BASE-TX Auto detected
Protocol
TCP/IP
Function
HTTP server (remote operation),
Dedicated port (data transfer and command control)
Not for simultaneous use with USB (functions): USB has priority when both interfaces used
(4) CF Card Interface
Slot
One Type 1
Compatible card
CompactFlash memory card (32MB or higher)
Supported memory capacity
Up to 2 GB
Data format
MS-DOS format (FAT16/ FAT32)
Recordable content
Save and load settings files
Save measurement voltage and auto-recorded data (CSV format)
Copy measurements/recorded data (from USB storage)
Save waveform data
Screen captures
(5) RS-232CInterface
Method
RS-232C, [EIA RS-232D], [CCITT V.24], [JIS X5101] compliamt
Connector
D-sub9 pin connector ×1
Connection destination
Printer, Temperature tester
Communication format
Full duplex, start-stop synchronization, 8-bit data, no parity, one stop bit, hardware flow control,
CR+LF delimiter
Communication speeds
2400, 9600, 19200, 38400bps
(2400 bps for thermometers)
(6) Synchronization Control Interface
Signal contents
One-second clock, integration start/stop, DATA RESET, EVENT
Connector types
IN: One 9-pin female mini-DIN jack
OUT: One 8-pin female mini-DIN jack
Signal
5V CMOS
Max. input
±20 V
Max. signal delay
2 μs (rising edge)
Chapter 10 Specifications
Connector
10
10
156
10.2 Functions Specifications
10.2 Functions Specifications
1.AUTO range Function
Function
Automatically selects voltage and current ranges according to measured amplitude on each phase.
Operating states
Selectable on or off for each phase system
Auto-ranging span
Wide/Narrow (common to all wiring systems)
Wide: ...... when a phase system’s peak-over or rms value is above 110% f.s., increments one range,
and, when all rms values within the phase system are below 10% f.s., decrements two
ranges (except when peak-over occurs in the lower range, in which case no range decrementing occurs).
Narrow:... when a wiring system peak over or rms value is above 105% f.s., increments one range,
and, when all rms values within the wiring system are below 40% f.s., decrements one
range (except when peak-over occurs in the lower range, in which case no range decrementing occurs).
When Δ-Y conversion is enabled, the range-decrementing voltage is1 ⁄ 3 (approximately 0.57735) f.s.
2.Timing Control Functions
Interval
OFF, 50 ms, 100 ms, 200 ms, 500 ms, 1 s, 5 s, 10 s, 15 s, 30 s
1 min, 5 min, 10 min, 15 min, 30 min, 60 min
Setting determines the maximum data-saving capacity
Timing controls
OFF, Timer, RTC
Timer: 10 s to 9999:59:59 [h:m:s] (in seconds)
Real-Time Clock: Start and stop times (in minutes)
3.Hold Functions
(1) Hold
Function
Stops all updating of displayed measurement values and waveforms, and holds display. However,
the clock and peak-over display continue to be updated.
Disabled when the peak-hold function is enabled.
Data updating
The next display data update occurs when the HOLD key is pressed again, at the end of the measurement interval, or when an external sync signal is detected. Internal data is updated every 50 ms
(independent of the display data update interval). Waveform and noise data are updated when calculation finishes.
Output data
Held values are present at D/A output and are saved to CF card (although waveform output continues).
With auto-saving enabled, data is saved immediately before it is updated.
Display
The HOLD indicator appears when Hold is active.
Backup
Not applicable (the function is deactivated upon recovery from power outages.)
(2) Peak Hold
Function
All measurement values are updated to display the maximum value for each measurement.
However, displayed waveforms and integration values continue to be updated with instantaneous
values.
When averaging is enabled, maximum values are displayed after averaging.
Cannot be used together with the display-hold function.
Data updating
Displayed data is cleared when the HOLD key is pressed again, at the end of the measurement interval, or when an external sync signal is detected.
Internal data is updated every 50 ms (independent of the display refresh interval).
Output data
Held values are present at D/A output and are saved to CF card (although waveform output continues).
With auto-saving enabled, data is saved immediately before it is updated.
Display
The PEAK HOLD indicator appears when Peak Hold is active.
Backup
Not applicable (the function is deactivated upon recovery from power outages.)
4.Calculation Functions
(1) Rectification System
Function
Select which voltage and current values to used for calculating apparent and reactive power, and
power factor
Method
rms/ mean (voltage and current in each phase system)
(2) Scaling
VT (PT) ratio
OFF/ 0.01 to 9999.99 (Settings for which VT×CT exceeds 1.0E+06 are disallowed.)
CT ratio
OFF/ 0.01 to 9999.99 (Settings for which VT×CT exceeds 1.0E+06 are disallowed.)
Display
An indicator is displayed when scaling.
157
10.2 Functions Specifications
(3) Average
Function
Averages all instantaneous measurement values including harmonics (but not peak, integration, or
FFT noise values).
When averaging is enabled, the averaged data is saved.
Method
Indexed average (applied at 50 ms data update intervals)
Averaged voltage (U), current (I), and power (P) values are used for calculations.
rms values are averaged for harmonic amplitude, and instantaneous values are averaged for relative
harmonic content.
Phase angle is calculated from the average real and imaginary components after FFT.
Phase difference, distortion and imbalance are calculated from the above data after averaging.
Ripple factor is calculated from averaging the differences in peak values.
Response time
OFF, FAST, MID, SLOW
(time remains within specified accuracy when input changes from 0 to 100% f.s.)
Corresponding response times are 0.2, 1.0, and 5 s
Display
The AVG indicator is displayed when averaging is enabled.
(4) Efficiency and Loss Calculations
Function
Efficiency η [%] and Loss [W] are calculated from active power values measured on each phase and
system.
Calculation items
Active power (P) of each phase and system
Motor power (Pm) when motor evaluation option 9791 or 9793 is installed
Calculation accuracy
Measurements applied to formulas are handled as 32-bit floating point values.
When calculating parameters between wiring systems with different power ranges, the higher range
is used.
Calculation rate
At every 50 ms data update interval
When calculating between wiring systems having different sync sources, the most recent data is
used at calculation time.
Maximum no. of simultaneous cal- Efficiency and loss, by three formulas
culations
Parameters specified for Pin and Pout are applied as follows
η = 100 × |Pout| / |Pin|, Loss = |Pin| - |Pout|
(5) Δ - YCalculation
Function
For 3P3W3M systems, converts between line-to-line voltage and phase voltage waveforms using a
virtual center point. All voltage parameters including harmonics such as true rms voltage are calculated as phase voltage waveforms.
Calculation method
U1s = (U1s-U3s)/3, U2s = (U2s-U1s)/3, U3s =U3s-U2s)/3
5. Display Functions
(1) Wiring Check screen
Function
The wiring diagram and voltage/current vectors are displayed for the selected wiring system(s). The
correct range for the wiring system is shown on the vector display, to confirm proper measurement
cable connections.
Start-up mode
The Wiring Check screen can be set to always appear upon start-up (Start-Up Screen setting).
Basic settings
Selects auto-ranging for voltage and current on each wiring system, and sets each value to its default. Not available when integration or the Hold function is enabled.
(2) Independent wiring system display mode
Function
Displays power and harmonic measurement values for channels 1 to 4.
A composite measurement line pattern is displayed for each system.
DMM
Basic, voltage, current, and power measurement parameter screens
Harmonics
Bar Graph, List or Vector screen
(3) Display Selections
Function
Select to display any 4, 8, 16, or 32 of the basic measurement parameters.
Display Layout
4, 8, 16, or 32 parameters, Independently set for each screen
(4) Efficiency and Loss Screen
Function
The efficiency and loss obtained by the specified calculation formulas are displayed numerically.
Display Layout
Three efficiency and three loss values.
(5) Waveform & Noise Screen
Function
Voltage and current waveforms sampled at 500 kHz and noise measurements are displayed compressed on one screen.
Chapter 10 Specifications
Calculation method
10
10
158
10.2 Functions Specifications
(5) Waveform & Noise Screen
Trigger
Synchronized with the harmonic sync source
Recording length
1000 / 5000 / 10000 / 50000 ×All voltage and current channels
Compression ratio
1/1, 1/2, 1/5, 1/10, 1/25, 1/50 (peak-to-peak compression)
Also, peak-to-peak compression enables drawing 500-dot (vertical) screen images
Noise sampling
500 kS/s, 250 kS/s, 100 kS/s, 50 kS/s, 25 kS/s, 10 kS/s (according to compression ratio)
Recording time
sampling/Recording length
1000
5000
10000
50000
500kS/s
2 ms
10 ms
20 ms
100 ms
250kS/s
4 ms
20 ms
40 ms
200 ms
100kS/s
10 ms
50 ms
100 ms
500 ms
50kS/s
20 ms
100 ms
200 ms
1000 ms
25kS/s
40 ms
200 ms
400 ms
2000 ms
10kS/s
100 ms
500 ms
1000 ms
5000 ms
(6) X-Y Plot Screen
Function
Select horizontal and vertical axes from the basic measurement items to display on the X-Y graphs.
Dots are plotted at the data update interval, and is not saved.
Drawing data can be cleared.
Horizontal axis
1 data item (gauge display available)
Vertical axis
2 data items (gauge display available)
(7) Motor Screen (only with Model 9791 or 9793 motor evaluation option)
Function
Displays motor evaluation measurement values
Display Layout
Four numerical values
6. Auto-Save Functions
Function
Each value is stored to CF card during every measurement interval.
Can be controlled by timer or real-time clock
Save destinations
Off, CF card (not available for USB storage)
The destination folder can be specified.
Saved items
Any measured values including harmonics and noise value data
Max. no. of saved items
Interval-setting-dependent
Data format
CSV file format
File name
Automatically generated using starting date and time, with CSV extension
7. Manual Saving Functions
(1) Measurement Data
Function
Pressing the SAVE key saves each measurement value at that moment to the save destination.
A new file is created the first time data is saved, and subsequent saves are made to that file.
Save destinations
USB memory/CF card
Able to specify the folder to save.
Saving items
Saved items: any measured values including harmonics and noise value data
Screen Capture
CSV file format
File name
Automatically created with CSV extension
(2) Screen Capture
Function
The COPY key (SHIFT+SAVE) captures and saves a bitmap image of the display to the save destination
Save destinations
Printer, USB memory, CF card (Printing can be selected only when a printer is connected to the
RS232C port.)
When USB memory stick or CF card is selected, the destination folder can be selected.
Data format
Compressed BMP format (256-color), with only black and white printing
File name
Automatically created with BMP file name extension
(3) Settings Data
Function
Settings specified on the FILE screen are saved as a file on the save destination. Saved settings
files can then be reloaded to restore a previous setting configuration (except for language and communications settings).
Save destinations
USB memory/CF card
Able to specify the folder to save.
159
10.2 Functions Specifications
(3) Settings Data
File name
Automatically created with SET file name extension
8. Synchronous Control Function
Function
Synchronous measurements are available by using sync cables to connect one Model 3390 as a
master and one or more as slaves.
Clocks and data updates are synchronized when the slave instrument is turned on.
Afterwards, resynchronization is performed at each second of the clock (disabled when the slave is
started while the master is off).
When internal settings match, auto-save is available while synchronized.
Synchronized Items
Clock, data update interval (except for FFT calculations), integration start/stop, data reset, certain
events
Event items
Hold, manual save, screen capture
Synchronization Timing
Clock, data update interval: within 10 s after power-on by a slave 3390
Start/stop, data reset, event: Upon key-press and communications operations on the master 3390
Maximum 5 μs per connection. Maximum synchronization delay of an event is +50 ms
Synchronization delay
9. Temperature Measurement Functions
Function
Acquires temperature measurement values from an RS-232C-equipped thermometer
Merely attaching a device may be inadequate, as the raw numeric data returned from the thermometer is used
Supported thermometers
Hioki RS-232C-equipped thermometers
Number of channels
1
Range
±500.00°C(single range, independent of thermometer setting)
Temperature units
°C °F
Data acquisition rate
Approx. once per second (actual update rate is thermometer-dependent)
10. External Printer Output Functions
Prints a screen image on a printer connected to the RS-232C interface
Supported printer
HIOKI 9670
Output contents
Screen capture
Printer setup
The printer is automatically set up by key-presses on the Setting screen
11. Other functions
Real-Time Clock function
Auto-calendar, leap-year correcting 24-hour clock
RTC accuracy
±3 s per day @25°C
Sensor recognition
Current sensors are automatically recognized when connected
Sensor range and connection state are detected, and warning indicators displayed as needed
Warning indicators
When peak over occurs on voltage and current measurement channels
When no sync source is detected Warning indicators for all channels are displayed on all pages of
the MEAS screen.
Key-lock
Toggles on/off by holding the ESC key for three seconds.
A key-lock indicator is displayed when the keys are locked.
System reset
Returns all settings to factory defaults
However, language and communications settings are unaffected.
Power-on reset
Holding the DATA RESET key when turning the power on returns all settings, including language
and communications settings, to factory defaults.
File operations
Media content list display, format media, create folders, delete files and folders, copy between storage media
Chapter 10 Specifications
Function
10
10
160
10.3 Setting Specifications
10.3 Setting Specifications
1. Input Settings
Wiring modes
CH1
CH2
CH3
CH4
Mode 1
1P2W
1P2W
1P2W
1P2W
Mode 2
1P3W
1P2W
1P2W
Mode 3
3P3W2M
1P2W
1P2W
Mode 4
1P3W
1P3W
Mode 5
3P3W2M
1P3W
Mode 6
3P3W2M
3P3W2M
Mode 7
3P3W3M
1P2W
Mode 8
3P4W
1P2W
Synchronization source
U1 to U4, I1 to I4, Ext (when channel B is set for pulse input with a motor evaluation option installed)
DC (50 ms/100 ms) @Selectable on all wiring systems
Voltage range
AUTO, 1500 V, 600 V, 300 V, 150 V, 60 V, 30 V, 15 V
Voltage rectification method
RMS / MEAN (voltage value used to calculate apparent and reactive power, and power factor)
Current range
AUTO, 20 A, 8 A, 4 A, 2 A (20 A with 9272-10)
AUTO, 20 A, 8 A, 4 A, 2 A, 0.8 A, 0.4 A (20 A with 9277)
AUTO, 200 A, 80 A, 40 A, 20 A, 8 A, 4 A (200 A with 9272-10, 9278 and CT6863)
AUTO, 50 A, 20 A, 10 A, 5 A, 2 A, 1 A (CT6862)
AUTO, 500 A, 200 A, 100 A, 50 A, 20 A, 10 A (9279, 9709)
Current rectification method
RMS/ MEAN (current value used to calculate apparent and reactive power, and power factor)
VT(PT) ratio
OFF/ 0.01 to 9999.99(setting not available if VT×CT ratio exceeds 1.0E+06)
CTratio
OFF/ 0.01 to 9999.99(setting not available if VT×CT ratio exceeds 1.0E+06)
OFF, 500 Hz, 5 kHz, 100 kHz
LPF
Lower limit measurement frequency 0.5 Hz, 1 Hz, 2 Hz, 5 Hz, 10 Hz, 20 Hz
Frequency measurement
Select U or I for f1, f2, f3, and f4
Integration mode
RMS/ DC
2. Calculation and Recording Settings
Average
OFF, FAST, MID, SLOW
Interval
OFF, 50 ms, 100 ms, 200 ms, 500 ms, 1 s, 5 s, 10 s, 15 s, 30 s,
1 min, 5 min, 10 min, 15 min, 30 min, 60 min
Timer control
Elapsed time / Real-time clock
Timer: ..... Off, 10 s to 9999:59:59 [hhhh:mm:ss] (in 1 s units)
Real-time clock:OFF, start and stop times (YMD-hms, in 1 min units)
Zero suppression
OFF, 0.1%/ 0.5%f.s.
Zero-crossing filter
Off, mild or strong
Auto-ranging span
Wide or narrow
Efficiency calculations
Three items (select from all active power values) η=100 × |Pout|/|Pin|
Loss calculations
Three items (select from all active power values) Loss=|Pin| - |Pout|
Δ- Y Conversion
OFF/ ON
3. Harmonic Settings
Harmonic
U1 to U4, I1 to I4, Ext (when channel B is set for pulse input with a motor evaluation option installed)
DC (50 ms/100 ms) Settings common to all channels
TTHD calculation
THD-F/ THD-R
4. Noise Analysis Settings
Measurement cannels
Select one of channels 1 to 4
Windows
Rectangular, Hanning, flat-top
Lower limit noise frequency
0 kHz to 10 kHz
5. D/A Output Settings (with D/A output option Model 9792 or 9793)
Waveform output
Off or On (See separate specifications for Model 9793 when enabled [ON])
Output items
Select one basic measurement item for each output channel.
Only selectable for channels 9 to 16 when waveform output is enabled [ON]
(Channels 1 to 8 provide waveform output only)
Full-scale frequency integration
100 Hz, 500 Hz, 1 kHz, 5 kHz (same as max. measurement frequency setting for motor)
Full scale
1/10, 1/2, 1/1, 5, 10, 50, 100, 500, 1000, 5000, 10000 × range
161
10.3 Setting Specifications
6. Motor Measurement Settings (with motor evaluation option Model 9791 or 9793)
Synchronization source
U1 to U4, I1 to I4, Ext (with channel B set for pulse input), DC (50ms/100ms)
Common to channels A and B
CHA Input
Analog DC or frequency
CHArange
±1 V, ±5 V, ±10 V (for analog DC only)
Frequency range
Select fc and fd for frequency range fc ± fd [Hz] (frequency measurement only)
1 kHz to 98 kHz in 1 kHz units, where fc + fd <100 kHz and fc – fd >1 kHz)
CHAScalling
0.01 to 9999.99(for analog DC only)
Rated torque
1 to 999 (frequency measurement only)
CHA Unit
Analog DC: ...... V, N• m, mN• m, kN• m
Frequency: ...... Hz, N• m, mN• m, kN• m
CHB Input
Analog DC or pulse
CHB range
±1 V, ± 5V, ±10 V (for analog DC only)
Motor poles
2 to 9 8(pulse input only)
Max. measurement frequency
100 Hz, 500 Hz, 1 kHz, 5 kHz (pulse input only)
Same as full-scale D/A output frequency setting
CHBScalling
0.01 to 9999.99 (for analog DC only)
Pulse count
Integer multiple of half the number of motor poles, from 1 to 60000 (pulse input only)
CHB
Analog DC: ...... V, Hz, r/ min
Pulse: .............. Hz, r/ min
CHZ
OFF/ ON (pulse input only)
Measurement frequency source
f1 to f4 (for slip calculations)
LPF
OFF/ ON
7. Interface Settings
Master/slave
Synchronous event items
HOLD, SAVE, COPY
Saving Data
Select the items to record (Max. number of items is limited according to the interval setting.)
Auto-save
OFF/ ON (CF card)
Data save destination
Destination folder
Manual save destination
USB memory, CF card (selected folder)
RS-232C connection destination
Printer, Temperature tester
RS-232C communications speed
2400bps, 9600bps, 19200bps, 38400bps(2400 bps for thermometers)
IP address
Four 3-digit octets (0 to 255)
Subnet mask
Four 3-digit octets (0 to 255)
Default gateway
Four 3-digit octets (0 to 255)
Temperature units setting
Fahrenheit
8. System Settings
Display language
Japanese, English
Beep sound
OFF/ ON
Screen color schemes
Color1, Color2, Color3, Color4, Mono
Start-up screen selection
Wiring or Last-displayed screen (Measurement screens only)
LCD backlight
ON, 1 min, 5 min, 10 min, 30 min, 60 min
Clock setting
Year, month, day, hour and minute setting, and zero-second adjustment
System reset
Reset
Serial number indication
Displayed
Version indication
Software version displayed
Chapter 10 Specifications
Synchronization control
10
10
162
10.4 Measurement Item Details
10.4 Measurement Item Details
1.Basic Measurement Items
Mode 1
Measurement items
Symbol Unit 1P2W+1P2W
+1P2W+1P2W
Frequency
Hz 1, 2, 3, 4
Mode 4,5,6
1P3W/3P3W2M
+1P3W/3P3W2M
Mode 7,8
3P3W3M/3P4W
+1P2W
Display range
1, 2, 3, 4
1, 2, 3, 4
1, 2, 3, 4
RMS
Urms V 1, 2, 3, 4
1, 2, 3, 4, 12
1, 2, 3, 4, 12, 34
1, 2, 3, 4, 123
U Range
zero to 120%
Voltage MEAN
Umn
V 1, 2, 3, 4
1, 2, 3, 4, 12
1, 2, 3, 4, 12, 34
1, 2, 3, 4, 123
↓
zero to 120%
AC component
Uac
V 1, 2, 3, 4
1, 2, 3, 4
1, 2, 3, 4
1, 2, 3, 4
↓
zero to 120%
Simple average
Udc
V 1, 2, 3, 4
1, 2, 3, 4
1, 2, 3, 4
1, 2, 3, 4
↓
zero to 120%
Ufnd
Fundamental wave
Voltage component
f
Mode 2,3
1P3W/3P3W2M
+1P2W+1P2W
0.5000 to 5.0000k
V 1, 2, 3, 4
1, 2, 3, 4
1, 2, 3, 4
1, 2, 3, 4
↓
zero to 120%
wave peak +
Upk+ V 1, 2, 3, 4
1, 2, 3, 4
1, 2, 3, 4
1, 2, 3, 4
↓
zero to 300%
wave peak -
Upk-
V 1, 2, 3, 4
1, 2, 3, 4
1, 2, 3, 4
1, 2, 3, 4
↓
zero to 300%
THD/ripple rate*6
Uthd
% 1, 2, 3, 4
Urf
1, 2, 3, 4
1, 2, 3, 4
1, 2, 3, 4
Unbalance factor
Uunb %
RMS
Irms
A 1, 2, 3, 4
1, 2, 3, 4, 12
Curret MEAN
Imn
A 1, 2, 3, 4
1, 2, 3, 4, 12
AC component
Iac
A 1, 2, 3, 4
1, 2, 3, 4
Simple average
Idc
A 1, 2, 3, 4
1, 2, 3, 4
Fundamental wave
Current component
Ifnd
A 1, 2, 3, 4
1, 2, 3, 4
0.00 to 100.00
1, 2, 3, 4, 123
I Range
zero to 120%
1, 2, 3, 4, 12, 34
1, 2, 3, 4, 123
↓
zero to 120%
1, 2, 3, 4
1, 2, 3, 4
↓
zero to 120%
1, 2, 3, 4
1, 2, 3, 4
↓
zero to 120%
1, 2, 3, 4
1, 2, 3, 4
↓
zero to 120%
wave peak+
Ipk+
1, 2, 3, 4
1, 2, 3, 4
1, 2, 3, 4
1, 2, 3, 4
↓
zero to 300%
wave peak-
Ipk-
A 1, 2, 3, 4
1, 2, 3, 4
1, 2, 3, 4
1, 2, 3, 4
↓
zero to 300%
THD/ripple rate*6
Ithd
Irf
% 1, 2, 3, 4
1, 2, 3, 4
1, 2, 3, 4
1, 2, 3, 4
Unbalance factor
Iunb
%
0.00 to 500.00
123
1, 2, 3, 4, 12, 34
Pola
rity
(+/-)
0.00 to 500.00
123
0.00 to 100.00
Effective power
P
W 1, 2, 3, 4
1, 2, 3, 4, 12
1, 2, 3, 4, 12, 34
1, 2, 3, 4, 123
P Range
zero to 120%
Apparent power
S
VA 1, 2, 3, 4
1, 2, 3, 4, 12
1, 2, 3, 4, 12, 34
1, 2, 3, 4, 123
↓
zero to 120%
Reactive power
Q
var 1, 2, 3, 4
1, 2, 3, 4, 12
1, 2, 3, 4, 12, 34
1, 2, 3, 4, 123
↓
zero to 120%
0.0000 to 1.0000
Power factor
λ
1, 2, 3, 4
1, 2, 3, 4, 12
1, 2, 3, 4, 12, 34
1, 2, 3, 4, 123
0.00 to
180.00
θU
θI
φ
° 1, 2, 3, 4
1, 2, 3, 4
1, 2, 3, 4
1, 2, 3, 4
0.00 to180.00
° 1, 2, 3, 4
1, 2, 3, 4
1, 2, 3, 4
1, 2, 3, 4
0.00 to180.00
° 1, 2, 3, 4
1, 2, 3, 4, 12
1, 2, 3, 4, 12, 34
1, 2, 3, 4, 123
0.00 to 180.00
Integ. current in
positive direction*1
Ih+
Ah 1, 2, 3, 4
3, 4
4
I Range
zero to 100% *5
Integ. current in
negative direction*1
Ih-
Ah 1, 2, 3, 4
3, 4
4
↓
zero to 100% *5
Ih
Ah 1, 2, 3, 4
1, 2, 3, 4
1, 2, 3, 4
↓
zero to 100% *5
Voltage phase angle
Phase
Current phase angle
angle
power phase angle
Sum of integ.
Integra Current
tion
Energy in positive
direction*1
Energy in negative
direction*1
Sum of energy
Efficiency
1, 2, 3, 4
WP+ Wh 1, 2, 3, 4
3, 4, 12
12, 34
4, 123
P Range
zero to 100% *5
WP- Wh 1, 2, 3, 4
3, 4, 12
12, 34
4, 123
↓
zero to 100% *5
WP Wh 1, 2, 3, 4
3, 4, 12
12, 34
4, 123
↓
zero to 100% *5
η
% 1, 2, 3
1, 2, 3
1, 2, 3
Loss
Loss W 1, 2, 3
1, 2, 3
1, 2, 3
Temperature*2
Temp °
-----
-----
-----
-----
Torque
CH A *4
-----
-----
-----
-----
A Range
zero to 120%
Rotation speed
CH B *4
-----
-----
-----
-----
B Range
zero to 120%
Pm Range
Motor
*3
1, 2, 3
1, 2, 3
Motor power
Pm
W
-----
-----
-----
-----
Slip
Slip
%
-----
-----
-----
-----
0.00 to 200.00
P Range
zero to 120%
0.00 to 500.00
zero to 120%
0.00 to 100.00
*1. DC integration mode
*2. Temp only when a thermometer is selected as RS-232C destination
*3. Requires motor evaluation option Model 9791 or 9793
*4. Can be changed with unit selection No zero suppression when the frequency or pulse is set.
*5. Forward, reverse and combined values should be same range, and are displayed with the number of digits available for any maximum value
*6. THD when the integration mode is RMS, and rf when the integration mode is DC,
zero indicates zero-suppression setting, and values less than zero are zero suppressed
P range is –3. See power range configuration. Pm range = (range A × range B / 10), × 1/1000 for mN・m, or × 1000 for kN・m) Range
A when channel A measures frequency at rated torque setting value
Range B when channel B measures pulses at maximum measurement frequency setting value [Hz]
163
10.4 Measurement Item Details
2.Harmonic Measurement Items
Measurement items
Symbol Unit
Mode 1
1P2W+1P2W
+1P2W+1P2W
Mode 2,3
1P3W/3P3W2M
+1P2W+1P2W
Mode 4,5,6
1P3W/3P3W2M
+1P3W/3P3W2M
Mode 7,8
3P3W3M/3P4W
+1P2W
Uk
V 1, 2, 3, 4
1, 2, 3, 4
1, 2, 3, 4
1, 2, 3, 4
θUk
° 1, 2, 3, 4
1, 2, 3, 4
1, 2, 3, 4
1, 2, 3, 4
Ik
A 1, 2, 3, 4
1, 2, 3, 4
1, 2, 3, 4
1, 2, 3, 4
Harmonic current phase
angle
θIk
° 1, 2, 3, 4
1, 2, 3, 4
1, 2, 3, 4
1, 2, 3, 4
Harmonic active power
Pk
W 1, 2, 3, 4
1, 2, 3, 4, 12
1, 2, 3, 4, 12, 34
1, 2, 3, 4, 123
Phase difference of
harmonic voltage and
harmonic current
θk
° 1, 2, 3, 4
1, 2, 3, 4, 12
1, 2, 3, 4, 12, 34
Harmonic voltage
Harmonic voltage phase
angle
Harmonic current
Pola
rity
(+/-)
Display range
U Range
0 to 120%
0.00 to 180.00
I Range
0 to 120%
0.00 to 180.00
0 to 120%
1, 2, 3, 4, 123
0.00 to 180.00
0.00 to 500.00
P Range
Harmonic voltage content
HDUk % 1, 2, 3, 4
1, 2, 3, 4
1, 2, 3, 4
1, 2, 3, 4
Harmonic current content
HDIk % 1, 2, 3, 4
1, 2, 3, 4
1, 2, 3, 4
1, 2, 3, 4
0.00 to 500.00
Harmonic power content
HDPk % 1, 2, 3, 4
1, 2, 3, 4, 12
1, 2, 3, 4, 12, 34
1, 2, 3, 4, 123
0.00 to 500.00
3.Noise Measurement Items
Measurement items
Voltage noise
Current noise
Symbol
Unit
Display range
UNf
Hz
0 to Maximum frequency setting
UN
V
0 to 120% of U range
INf
Hz
0 to Maximum frequency setting
IN
A
0 to 120% of I range
Ten measurements in descending order of UN
Ten measurements in descending order of IN
(1)With 20A sensors
20.000 A
8.0000 A
4.0000 A
2.0000 A
800.00 mA
400.00 mA
Current/Phase (Wiring) System/
Voltage
15.000 V
30.000 V
60.000 V
150.00 V
300.00 V
600.00 V
1.5000 kV
1P2W
6.0000
12.000
24.000
60.000
120.00
240.00
600.00
1P3W
3P3W(2M/3M)
12.000
24.000
48.000
120.00
240.00
480.00
1.2000k
3P4W
18.000
36.000
72.000
180.00
360.00
720.00
1.8000k
1P2W
12.000
24.000
48.000
120.00
240.00
480.00
1.2000k
1P3W
3P3W(2M/3M)
24.000
48.000
96.00
240.00
480.00
0.9600k
2.4000k
3P4W
36.000
72.000
144.00
360.00
720.00
1.4400k
3.6000k
1P2W
30.000
60.000
120.00
300.00
600.00
1.2000k
3.0000k
1P3W
3P3W(2M/3M)
60.000
120.00
240.00
600.00
1.2000k
2.4000k
6.0000k
3P4W
90.00
180.00
360.00
0.9000k
1.8000k
3.6000k
9.000k
1P2W
60.000
120.00
240.00
600.00
1.2000k
2.4000k
6.0000k
1P3W
3P3W(2M/3M)
120.00
240.00
480.00
1.2000k
2.4000k
4.8000k
12.000k
3P4W
180.00
360.00
720.00
1.8000k
3.6000k
7.2000k
18.000k
1P2W
120.00
240.00
480.00
1.2000k
2.4000k
4.8000k
12.000k
1P3W
3P3W(2M/3M)
240.00
480.00
0.9600k
2.4000k
4.8000k
9.600k
24.000k
3P4W
360.00
720.00
1.4400k
3.6000k
7.2000k
14.400k
36.000k
1P2W
300.00
600.00
1.2000k
3.0000k
6.0000k
12.000k
30.000k
1P3W
3P3W(2M/3M)
600.00
1.2000k
2.4000k
6.0000k
12.000k
24.000k
60.000k
3P4W
0.9000k
1.8000k
3.6000k
9.000k
18.000k
36.000k
90.00k
Active power (P) units are [W], apparent power (S) units are [VA], and reactive power (Q) units are [VAR]
Chapter 10 Specifications
4.Power Range Configurations
10
10
164
10.4 Measurement Item Details
(2) With 50A sensors
50.000 A
20.000 A
10.000 A
5.0000 A
2.0000 A
1.0000 A
Current/Phase (Wiring) System/
Voltage
15.000 V
30.000 V
60.000 V
150.00 V
300.00 V
600.00 V
1.5000 kV
1P2W
15.000
30.000
60.000
150.00
300.00
600.00
1.5000k
1P3W
3P3W(2M/3M)
30.000
60.000
120.00
300.00
600.00
1.2000k
3.0000k
3P4W
45.000
90.00
180.00
450.00
0.9000k
1.8000k
4.5000k
1P2W
30.000
60.000
120.00
300.00
600.00
1.2000k
3.0000k
1P3W
3P3W(2M/3M)
60.000
120.00
240.00
600.00
1.2000k
2.4000k
6.0000k
3P4W
90.00
180.00
360.00
0.9000k
1.8000k
3.6000k
9.000k
1P2W
75.000
150.00
300.00
750.00
1.5000k
3.0000k
7.5000k
1P3W
3P3W(2M/3M)
150.00
300.00
600.00
1.5000k
3.0000k
6.0000k
15.000k
3P4W
225.00
450.00
0.9000k
2.2500k
4.5000k
9.000k
22.500k
1P2W
150.00
300.00
600.00
1.5000k
3.0000k
6.0000k
15.000k
1P3W
3P3W(2M/3M)
300.00
600.00
1.2000k
3.0000k
6.0000k
12.000k
30.000k
3P4W
450.00
0.9000k
1.8000k
4.5000k
9.000k
18.000k
45.000k
1P2W
300.00
600.00
1.2000k
3.0000k
6.0000k
12.000k
30.000k
1P3W
3P3W(2M/3M)
600.00
1.2000k
2.4000k
6.0000k
12.000k
24.000k
60.000k
3P4W
0.9000k
1.8000k
3.6000k
9.000k
18.000k
36.000k
90.00k
1P2W
750.00
1.5000k
3.0000k
7.5000k
15.000k
30.000k
75.000k
1P3W
3P3W(2M/3M)
1.5000k
3.0000k
6.0000k
15.000k
30.000k
60.000k
150.00k
3P4W
2.2500k
4.5000k
9.000k
22.500k
45.000k
90.00k
225.00k
Active power (P) units are [W], apparent power (S) units are [VA], and reactive power (Q) units are [VAR]
(3)With 200 A sensors
200.00 A
80.000 A
40.000 A
20.000 A
8.0000 A
4.0000 A
Current/Phase (Wiring) System/
Voltage
15.000 V
30.000 V
60.000 V
150.00 V
300.00 V
600.00 V
1.5000 kV
1P2W
60.000
120.00
240.00
600.00
1.2000k
2.4000k
6.0000k
1P3W
3P3W(2M/3M)
120.00
240.00
480.00
1.2000k
2.4000k
4.8000k
12.000k
3P4W
180.00
360.00
720.00
1.8000k
3.6000k
7.2000k
18.000k
1P2W
120.00
240.00
480.00
1.2000k
2.4000k
4.8000k
12.000k
1P3W
3P3W(2M/3M)
240.00
480.00
0.9600k
2.4000k
4.8000k
9.600k
24.000k
3P4W
360.00
720.00
1.4400k
3.6000k
7.2000k
14.400k
36.000k
1P2W
300.00
600.00
1.2000k
3.0000k
6.0000k
12.000k
30.000k
1P3W
3P3W(2M/3M)
600.00
1.2000k
2.4000k
6.0000k
12.000k
24.000k
60.000k
3P4W
0.9000k
1.8000k
3.6000k
9.000k
18.000k
36.000k
90.00k
1P2W
600.00
1.2000k
2.4000k
6.0000k
12.000k
24.000k
60.000k
1P3W
3P3W(2M/3M)
1.2000k
2.4000k
4.8000k
12.000k
24.000k
48.000k
120.00k
3P4W
1.8000k
3.6000k
7.2000k
18.000k
36.000k
72.000k
180.00k
1P2W
1.2000k
2.4000k
4.8000k
12.000k
24.000k
48.000k
120.00k
1P3W
3P3W(2M/3M)
2.4000k
4.8000k
9.600k
24.000k
48.000k
96.00k
240.00k
3P4W
3.6000k
7.2000k
14.400k
36.000k
72.000k
144.00k
360.00k
1P2W
3.0000k
6.0000k
12.000k
30.000k
60.000k
120.00k
300.00k
1P3W
3P3W(2M/3M)
6.0000k
12.000k
24.000k
60.000k
120.00k
240.00k
600.00k
3P4W
9.000k
18.000k
36.000k
90.00k
180.00k
360.00k
0.9000M
Active power (P) units are [W], apparent power (S) units are [VA], and reactive power (Q) units are [VAR]
165
10.4 Measurement Item Details
(4) With 500 A sensors
500.00 A
200.00 A
100.00 A
50.000 A
20.000 A
10.000 A
Current/Phase (Wiring) System/
Voltage
15.000 V
30.000 V
60.000 V
150.00 V
300.00 V
600.00 V
1.5000 kV
1P2W
150.00
300.00
600.00
1.5000k
3.0000k
6.0000k
15.000k
1P3W
3P3W(2M/3M)
300.00
600.00
1.2000k
3.0000k
6.0000k
12.000k
30.000k
3P4W
450.00
0.9000k
1.8000k
4.5000k
9.000k
18.000k
45.000k
1P2W
300.00
600.00
1.2000k
3.0000k
6.0000k
12.000k
30.000k
1P3W
3P3W(2M/3M)
600.00
1.2000k
2.4000k
6.0000k
12.000k
24.000k
60.000k
3P4W
0.9000k
1.8000k
3.6000k
9.000k
18.000k
36.000k
90.00k
1P2W
750.00
1.5000k
3.0000k
7.5000k
15.000k
30.000k
75.000k
1P3W
3P3W(2M/3M)
1.5000k
3.0000k
6.0000k
15.000k
30.000k
60.000k
150.00k
3P4W
2.2500k
4.5000k
9.000k
22.500k
45.000k
90.00k
225.00k
1P2W
1.5000k
3.0000k
6.0000k
15.000k
30.000k
60.000k
150.00k
1P3W
3P3W(2M/3M)
3.0000k
6.0000k
12.000k
30.000k
60.000k
120.00k
300.00k
3P4W
4.5000k
9.000k
18.000k
45.000k
90.00k
180.00k
450.00k
1P2W
3.0000k
6.0000k
12.000k
30.000k
60.000k
120.00k
300.00k
1P3W
3P3W(2M/3M)
6.0000k
12.000k
24.000k
60.000k
120.00k
240.00k
600.00k
3P4W
9.000k
18.000k
36.000k
90.00k
180.00k
360.00k
0.9000M
1P2W
7.5000k
15.000k
30.000k
75.000k
150.00k
300.00k
750.00k
1P3W
3P3W(2M/3M)
15.000K
30.000k
60.000k
150.00k
300.00k
600.00k
1.5000M
3P4W
22.500K
45.000k
90.00k
225.00k
450.00k
0.9000M
2.2500M
Chapter 10 Specifications
Active power (P) units are [W], apparent power (S) units are [VA], and reactive power (Q) units are [VAR]
10
10
166
10.5 Calculation Formula Specifications
10.5 Calculation Formula Specifications
1.Calculation Formulas for Basic Measurement Items
Items
Phase
System
Voltage RMS
Voltage MEAN
1P2W
Urms ( i ) =
1---M
1P3W
M–1
( U( i )s )
2
S=0
π 1
Umn ( i ) = ---------- ----- U ( i )s
2 2MS = 0
M–1
Voltage AC
component
Voltage simple
average
Voltage
fundamental wave
component
Peak voltage
3P3W2M
1
Urms12 = --- ( Urms 1 + Urms2 )
2
Urms 34
= 1--- ( Urms 3 + Urms 4 )
2
1
Umn 12 = --- ( Imn1 + Imn 2 )
2
Umn 34
= 1--- ( Imn 3 + Imn 4 )
2
Uac ( i ) =
3P3W3M
3P4W
Urms123 = 1--- ( Urms 1 + Urms 2 + Urms3 )
3
Umn 123 = 1--- ( Umn 1 + Umn 2 + Umn 3 )
3
( Urms ( i ) ) 2 – ( Udc ( i ) ) 2
1Udc ( i ) = ---M
M–1
U( i ) s
s=0
Harmonic voltage U1(i) for harmonic calculation formulas
Upk + ( i ) = U ( i ) s Maximum M value
Upk – ( i ) = U ( i ) s Minimum M value
THD Voltage
Percentage
Voltage ripple rate
Uthd(i) in harmonic calculation formulas
( Upk + ( i ) – Upk – ( i ) )
------------------------------------------------------------ × 100
( 2 × Udc ( i ) )
1 – 3 – 6 β × 100
----------------------------1 + 3 – 6β
Uunb 123 =
U
Voltage unbalance
factor
4
+U
4
+U
4
12
23
31
β = -----------------------------------------------2
2
2 2
( U 12 + U 23 + U 31 )
U12, U23, and U31 are fundamental rms voltages (between lines) obtained from harmonic
calculations. For 3P4W systems, voltage balance is detected from phase voltage, but is
converted to voltage between lines for calculations.
(i) : ......... Measurement channel
M : .......... Number of synchronous samples
s :........... Sample (data point) number
167
10.5 Calculation Formula Specifications
Items
Phase
System
Current RMS
1P2W
Irms ( i ) =
1- M – 1 ( I ( i )s ) 2
---M
S=0
Current MEAN
Imn ( i )
π - ---1- M – 1 I ( i )s
= --------
2 2MS = 0
Current AC
component
Current simple
average
Current
fundamental wave
component
1P3W
3P3W2M
3P3W3M
Irms 12 = 1--- ( Irms 1 + Irms 2 )
2
Irms123 = 1--- ( Irms 1 + Irms2 + Irms 3 )
3
Irms 34 = 1--- ( Irms 3 + Irms4 )
2
Imn 12 = 1--- ( Imn 1 + Imn 2 )
2
Imn 34
Imn 123 = 1--- ( Imn1 + Imn 2 + Imn 3 )
3
= 1--- ( Imn 3 + Imn 4 )
2
Iac ( i ) =
3P4W
( Irms ( i ) ) 2 – ( Idc ( i ) ) 2
1Idc ( i ) = ---M
M–1
I( i ) s
s=0
Harmonic current I1(i) in harmonic calculation formulas
Maximum M value
Ipk – ( i ) = I ( i ) s
Minimum M value
THD Current
Percentage
Current ripple rate
Ithd(i) in harmonic calculation formulas
( Ipk + ( i ) – Ipk – ( i ) )
-------------------------------------------------------- × 100
( 2 × Idc ( i ) )
1 – 3 – 6 β × 100
----------------------------1 + 3 – 6β
Iunb 123 =
I
Current unbalance
factor
4
+I
4
+I
4
12
23
31
β = ----------------------------------------2
2
2 2
( I 12 + I 23 + I 31 )
I12, I23, and I31 are fundamental rms currents
(between lines) obtain from harmonic calculations. For 3P3W3M and 3P4W systems,
these are converted to current between lines
for calculations.
(i) : ......... Measurement channel
M :........... Number of synchronous samples
s :............ Sample (data point) number
Chapter 10 Specifications
Ipk + ( i ) = I ( i ) s
Peak current
10
10
168
10.5 Calculation Formula Specifications
Phase
System
1P2W
Items
1
P ( i ) = ----M
Active
power
1P3W
3P3W3M
3P4W
P 12 = P1 + P 2
M–1
3P3W2M
( U ( i ) s × I( i ) s )
P 123 = P 1 + P 2 + P3
P34 = P3 + P4
s=0
• For 3P3W3M and 3P4W systems, phase voltage is used for waveform voltage U(i)s.
(3P3W3M:U1s=(U1s-U3s)/3, U2s=(U2s-U1s)/3, U3s=(U3s-U2s)/3)
• The polarity sign for active power indicates power flow direction: positive (+P) for forward power (consumption), and negative (-P) for reverse power (regeneration), and indicates net current flow for power.
Apparent
power
S( i ) = U( i ) × I( i )
S 12 = S1 + S2
S 12 = ------3- ( S 1 + S 2 )
2
S 34 = S3 + S4
= ------3- ( S 3 + S 4 )
2
S 34
S 123 = S 1 + S 2 + S 3
• Select U(i) and i(i) from rms/mn.
• For 3P3W3M and 3P4W waveforms, U(i) is phase voltage.
Q 12 = Q1 + Q 2
2
Q ( i ) = si ( i ) S ( i ) – P ( i )
Reactive
power
2
Q 123 = Q 1 + Q 2 + Q 3
Q 34 = Q3 + Q 4
• The polarity sign (si) for reactive power (Q) is indicated by [none] for lag or [–] for lead.
• The polarity sign (si(i)) for each channel (i) is acquired from lag or lead of the voltage waveform U(i)s and current waveform I(i)s. For 3P3W3M and 3P4W waveforms, U(i)s is phase voltage.
(3P3W3M:U1s=(U1s-U3s)/3, U2s=(U2s-U1s)/3, U3s=(U3s-U2s)/3)
P 12
S 12
λ 12 = si 12 -------P(i )
S(i )
λ ( i ) = si ( i ) -------Power
factor
P123
S 123
λ 123 = si 123 ----------
P 34
S 34
λ34 = si34 --------
• The polarity (si) for power factor (λ) is indicated by [no sign] for lag or [–] for lead.
• The polarity sign (si(i)) for each channel (i) is acquired from lag or lead of the voltage waveform U(i)s and current waveform I(i)s. Polarities si12, si34, and si123 are acquired from reactive power values Q12, Q34, and Q123, respectively.
Power
phase
angle
φ( i ) = si ( i ) cos
–1
λ( i )
φ 12 = si 12 cos
–1
φ 34 = si 34 cos
–1
λ 12
λ 34
φ 123 = si 123 cos
–1
λ 123
• The polarity sign (si(i)) for each channel (i) is acquired from lag or lead of the voltage waveform U(i)s and current waveform I(i)s. Polarities si12, si34, and si123 are acquired from reactive power values Q12, Q34, and Q123, respectively.
(i) : .......... Measurement channel
M : .......... Number of synchronous samples
s :........... Sample (data point) number
169
10.5 Calculation Formula Specifications
2.Motor Evaluation Calculation Formulas
Items
Setting Units
Calculation Formulas
1
----M
V (DC Voltage)
For Analog DC
chA
N• m, mN• m, or kN• m common to all measurements (torque)
For Frequency
M–1
As
s=0
A [V] × channel A scaling setting
(Measurement freq. – fc setting value) × rated torque setting value)
fd setting value
M :Number of synchronous samples, S :Sample (data point) number
1---M
V (DC Voltage)
For Analog DC
chB
Hz (Frequency)
Pulse input
M–1
Bs
s=0
|B [V] × channel B scaling setting|
set no. of poles × pulse frequency
*1
2 × set no. of pulses
For Analog DC
r/min (rotation rate)
Pulse input
B [V] × channel B scaling setting
2 × 60 × freuency[Hz] (calculated from above Pulse Input value *1)
set no. of poles
Pm
mN• m (Ch A units)
kN• m (Ch A units)
(Ch A display value) ×
(Ch A display value) ×
(Ch A display value) ×
2 × π ×(Ch B display value)
60
2 × π ×(Ch B display value)
60 × 1000
2 × π ×(Ch B display value)× 1000
60
Calculation is disabled when Ch A units are not those specified above, and when Ch B units are set to other than r/min.
Hz (Ch B units)
frequency - Ch B display valueCh B display value× 1000
100 ×
Slip
r/min (Ch B units)
Select an input frequency (f1 to f4)
input frequency
2 × 60 × input frequency - Ch B display value× set no. of poles
100 ×
2 × 60 × Input frequency
Chapter 10 Specifications
N• m (Ch A units)
10
10
170
10.5 Calculation Formula Specifications
3.Harmonic Measurement Calculation Formulas
Phase
System
Items
1P2W
1P3W
3P3W2M
Harmonic
voltage
3P3W3M
Uk ( i ) =
Harmonic
voltage
Phase angle
2
( U kr ( i ) ) + ( U Ki ( i ) )
–1
3P4W
2
U kr ( i )
θ U k ( i ) = tan ----------------
– Uki ( i )
Harmonic
current
Ik (i ) =
Harmonic
current
Phase angle
2
( I kr ( i ) ) + ( I Ki ( i ) )
–1
2
I kr ( i )
θ Ik ( i ) = tan --------------
– I ki ( i )
Pk1 = 1--- ( U kr1 – U kr3 ) × I kr1 + 1--- ( U ki1 – U ki3 ) × I ki1
3
3
Pk ( i ) = U kr ( i ) × I kr ( i ) + U ki ( i ) × Iki ( i )
Harmonic
effective
power
Pk2 = 1--- ( U kr2 – U kr1 ) × I kr2 + 1--- ( U ki2 – U ki1 ) × I ki2
3
3
Pk3
Same as 1P2W
= 1--- ( U kr3 – U kr2 ) × I kr3 + 1--- ( U ki3 – U ki2 ) × I ki3
3
3
P k4 = U kr4 × I ki4 + U ki4 × I kr4
P k12 = Pk1 + Pk2
------
Pk123 = P k1 + P k2 + Pk3
P k34 = Pk3 + Pk4
1
1
Q k1 = --- ( U kr1 – U kr3 ) × Iki1 – --- ( U ki1 – U ki3 ) × I kr1
3
3
Q k ( i ) = U kr ( i ) × I ki ( i ) – U ki ( i ) × I kr ( i )
Harmonic
reactive power
(only used
internally)
1
Q k2 = 1--- ( U kr2 – U kr1 ) × Iki2 – --- ( U ki2 – U ki1 ) × I kr2
3
3
Q k3
Same as 1P2W
1
= 1--- ( U kr3 – U kr2 ) × Iki3 – --- ( U ki3 – U ki2 ) × I kr3
3
3
Qk4 = U kr4 × I ki4 – U ki4 × I kr4
Qk12 = Q k1 + Q k2
------
Q k123 = Q k1 + Q k2 + Q k3
Qk34 = Q k3 + Q k4
θk ( i) = θ Ik ( i ) – θ Uk ( i)
Harmonic
voltage
Current phase
angle
–1
------
Q k12
θ k12 = tan -----------
Pk12
–1
Q k34
θ k34 = tan -----------
Pk34
–1
Q k123
θ k123 = tan --------------
P k123
(i) : .......... Measurement channel
k :............ Order of analysis
r : ............ Real part of complex result of FFT
i :............. Imaginary part of complex result of FFT
Harmonic voltage phase angle and harmonic current phase angle are corrected to the fundamental waveform of the harmonic sync source
that serves as a phase reference point of 0° (except when an external harmonic sync source is used).
171
10.5 Calculation Formula Specifications
Items
Phase
System
1P2W
1P3W
3P3W2M
3P3W3M
Harmonic voltage content
Uk
Uhd k ( i ) = ------ × 100
U1
Harmonic current content
Ik
Ihd k ( i ) = ---- × 100
I1
Harmonic
power content
Pk
Phd k ( i ) = ------ × 100
P1
K
K
THD Voltage
Percentage
3P4W
( Uk )
2
( Uk )
k=2
Uthd ( i ) = ----------------------------- × 100
U1
(with THD-F setting), or
2
k=2
----------------------------- × 100 (with THD-R setting)
K
( Uk )
2
k=1
K
K
THD Current
Percentage
k=2
( Ik )
( Ik )
2
Ithd ( i ) = --------------------------- × 100
I1
2
k=2
(with THD-F setting), or
--------------------------- × 100 (with THD-R setting)
K
( Ik )
2
(i) : .......... Measurement channel
k :............ Order of analysis
K : ........... Maximum analysis order (depending on sync frequency)
Example: for harmonic voltage
Imaginary
Phase reference
I
– 1 U kr ( i )
tan ---------------- + 180 °
– U ki ( i )
II, III
– 1 U kr ( i )
tan ----------------
– Uki ( i )
IV
– 1 U kr ( i )
tan ---------------- – 180 °
– U ki ( i )
U kr ( i ) = 0 , U kr ( i ) < 0
+90°
U kr ( i ) = 0 , U kr ( i ) > 0
-90°
U kr ( i ) < 0, U kr ( i ) = 0
+180°
U kr ( i ) = 0 , U kr ( i ) = 0
0°
Chapter 10 Specifications
k=1
10
10
172
10.5 Calculation Formula Specifications
4.Wiring System Diagrams
Single Phase 2-wire (1P2W)
äeCH
Single Phase 3-wire (1P3W)
CH1/CH3
CH2/CH4
3-Phase, 3-Wire, 2-Measurement (3P3W2M)
CH1/CH3
CH2/CH4
173
10.5 Calculation Formula Specifications
3-Phase, 3-Wire, 3-Measurement (3P3W3M)
CH1
CH2
CH3
CH2
CH3
3-Phase, 4-Wire (3P4W)
Chapter 10 Specifications
CH1
10
10
174
10.5 Calculation Formula Specifications
175
11.1 Cleaning
11.1 Cleaning
• To clean the instrument, wipe it gently with a soft cloth moistened with water or mild detergent. Never use solvents such as benzene, alcohol, acetone, ether, ketones, thinners or gasoline, as they can deform and discolor the case.
• Wipe the LCD gently with a soft, dry cloth.
11.2 Trouble Shooting
Before requesting instrument repair or inspection, please read "Before returning for repair" (p. 176) and
Section "11.3 Error Indication" (p. 177).
Inspection and Repair
Touching any of the high-voltage points inside the instrument is very dangerous.
Do not attempt to modify, disassemble or repair the instrument; as fire, electric
shock and injury could result.
If the protective functions of the instrument are damaged, either remove it from service
or mark it clearly so that others do not use it inadvertently.The instrument contains a
built-in backup lithium battery, which offers a service life of about ten years. If the date
and time deviate substantially when the instrument is switched on, it is the time to
replace that battery. Contact your dealer or Hioki representative.
• If damage is suspected, check the "Before returning for repair" (p. 176) section
before contacting your dealer or Hioki representative.
However, in the following cases, immediately stop using the instrument, unplug the
power cord and contact your dealer or Hioki representative.
•When the nature of the damage is clearly evident
•When measurement is impossible
•After long-term storage in adverse conditions such as high temperature or humidity
•After being subject to severe shock during transport
•After severe exposure to water, oil, or dust (internal insulation can be degraded by
oil or water, causing increase hazard of electric shock or fire)
• If measurement settings cannot be saved, contact Hioki for repair.
Transporting the instrument
Transporting
Pack the instrument so that it will not sustain damage during shipping, and include a description of existing damage. We do not take any responsibility for damage incurred during shipping.
11
Chapter11 Maintenace and Service
Maintenace and
Chapter11
Service
176
11.2 Trouble Shooting
Replaceable Parts and Useful Life
Certain parts require replacement periodically and at the end of their useful life: (Useful life depends on
the operating environment and frequency of use. Operation cannot be guaranteed beyond the following
periods)
Part
Electrolytic
Capacitors
Useful Life
Remarks
Approx. 10 years
The useful life of electrolytic capacitors depends on the operating environment. Periodic replacement is necessary.
Lithium battery
Approx. 10 years
The instrument contains a built-in backup lithium battery, which offers a
service life of about ten years. If the date and time deviate substantially
when the instrument is switched on, or backup error is returned in selftest, it is the time to replace that battery. Contact your dealer or Hioki representative.
Fan motor
Approx. 50,000
hours
Periodic replacement is necessary.
LCD backlight
(to half brightness)
Approx. 50,000
hours
Periodic replacement is necessary.
Before returning for repair
Symptom
Check Item, or Cause
Remedy and Reference
The display does
not appear when
you turn the power
on.
Is the power cord unplugged?
Is it properly connected?
Confirm that the power cord is properly connected.
See "3.4 Connecting the Power Cord" (p. 27)
Keys do not work.
Are the keys locked?
Hold
for three seconds to disable the
key-lock function.
Cannot print.
Is the recording paper properly loaded?
Are the printer settings (e.g., communication
speed and interface type) correct? Is the printer
connected properly with the correct cable?
See "8.1 Connecting a Printer (to print captured screen images)" (p. 123)
The MENU key is The LCD backlight is set to turn off after a specilit, but the screen is fied interval.
Press any key.
blank
"LCD back light" (p. 100)
Voltage or current
measurement
values are not
displayed
Check connections and wiring.
See "3.6 Connecting the Voltage MeasureAre the voltage measurement and current sensor
ment Cables" (p. 28), "3.11 Verifying
cables connected properly?
Correct Wiring (Connection Check)"
(p. 36)
Press
to change the input channel
Is the proper input channel displayed (e.g., when page.
measuring input on CH1, is the [CH1] page dis- See "4.2 Viewing Power Measurements,
played)?
and Changing the Measurement Configuration" (p. 41)
Verify the input frequency using the noise
Is the input frequency within the range 0.5 Hz to 5 measurement function.
kHz?
See "4.6 Viewing Noise Measurement Values (FFT Function)" (p. 72)
Frequency measurement is imposIs the input frequency below the lower limit setsible, measured
ting?
values are unstable
Is the sync source input correct?
Is the range of the sync source input too high?
When no apparent cause can be established
Perform a system reset.
This will return all settings to their factory defaults.
See "6.1 Initializing the Instrument (System Reset)" (p. 101)
Set the lower limit frequency for measurement.
See "4.2.3 Selecting the Sync Source" (p. 47)
Check the sync source settings.
See "4.2.3 Selecting the Sync Source" (p. 47),
"4.2.2 Selecting Ranges" (p. 43)
177
11.3 Error Indication
11
11.3 Error Indication
case. Press
to clear the error indicator.
Error display
Cause
FPGA initializing error
FPGA boot error.
Sub CPU initializing error.
Sub CPU boot error.
DRAM error.
DRAM error.
SRAM error.
SRAM error.
Invalid FLASH SUM.
Firmware checksum error.
Invalid Adjustment SUM.
Adjusted value checksum error.
Invalid Backuped values.
Backed up system variable invalid.
Sub CPU DRAM error.
Sub CPU DRAM error.
Integrating.
Attempted to change settings while integrating.
Remedy
Repair is required.
Contact your dealer or Hioki representative.
Stop integration, and change the setting after
resetting the integration value.
Waiting or halting for integra- Attempted to change settings while await- See "4.3 Integration Value Observation" (p. 53)
tion.
ing (or stopping) integration.
Holding.
Peak holding.
Attempted to change settings during Data Change the setting after canceling Data or
Hold.
Peak Hold.
Attempted to change settings during Peak See "5.3 Data Hold and Peak Hold Functions"
(p. 94)
Hold.
This operation is effective in
[MEAS] tab only.
Attempted to start/stop integration or saving, perform data reset, or activate Data or Change to the Measurement screen, and try
Peak Hold from the Setting or File Opera- again.
tion screen.
Failed to load the program.
Firmware update file not found, or bad
checksum.
The firmware update file may be corrupted.
Obtain another copy of the file, and try again.
Cannot change wiring.
Wiring mode selection is inhibited by inDifferent current sensors are
correct sensor combination.
in same system.
Check current sensor connections.
See "3.9 Selecting the Wiring Mode" (p. 30)
Some CH could not be
changed in one lump.
Select the current range, VT ratio, CT ratio and
integration mode for each channel.
Channel setting changes inhibited in the
[All Ch] batch setting.
Cannot change the VT value.
Attempted VT ratio setting would cause
VT × CT exceeds the full
over-range VT× CT value.
scale (1.0E+06).
Cannot change the CT value.
Attempted CT ratio setting would cause
VT × CT exceeds the full
over-range VT× CT value.
scale (1.0E+06).
Set values that do not exceed the VT× CT limit
(1.0E+06).
See "4.2.6 Setting Scaling (when using
VT(PT) or CT)" (p. 51)
Cannot add any recording item.
Too many items selected for recording
Exceeding the maximum
within the selected interval setting.
number of recording items.
Cannot change the output
orders.
Exceeding the maximum
number of orders.
Harmonic orders selected for output (including highest and lowest order settings)
would produce too many items.
Set a longer interval.
See "5.1 Timing Control Functions" (p. 91)
Cannot change the interval.
Select fewer recording items.
Too many recording items are Attempted to set the interval too short for
See "7.5.3 Selecting Measurement Items to
selected. Reduce the items the currently selected recording items.
Save" (p. 112)
to change interval.
Chapter11 Maintenace and Service
An error indicator appears when an error occurs. Refer to the corresponding countermeasure for each
178
11.3 Error Indication
Error display
Cannot change the lowest
noise frequency.
Change the noise sampling
speed.
Cause
Remedy
Increase the noise sampling rate setting, or set
the minimum noise frequency setting below the
Attempted to set the minimum noise fremaximum frequency.
quency at or above the maximum frequenSee "4.6.2 Setting the Sampling Frequency
cy (determined by the noise sampling
and Points" (p. 73)
rate).
"4.6.3 Setting the Minimum Noise Frequency" (p. 74)
Cannot change the noise
Decrease the minimum noise frequency setAttempted to set the maximum frequency
sampling speed.
ting.
(determined by the noise sampling rate)
Change the lowest noise freSee "4.6.3 Setting the Minimum Noise Frebelow the minimum noise frequency.
quency.
quency" (p. 74)
Cannot change the setting
under slave mode.
Clock, timer, and clock start/stop settings canAttempted to set the clock, timer or clock not be changed while Slave mode is enabled.
control settings with Slave mode enabled. See "8.3 Connecting Multiple 3390 (Synchronized Measurements)" (p. 129)
Cannot change the setting in Attempted to select DC integration on a
3-phase measurement.
non-1P2W channel.
Cannot set DC when AC sen- Attempted to select DC integration on a
sor is connected.
channel with an AC current sensor.
Not enough free capacity in
CF card.
Not enough space on CF card.
Not enough free capacity in
USB memory stick.
Not enough space on USB drive.
DC integration is only available with 1P2W wiring systems with an AC/DC current sensor connected.
See "4.3.2 Setting the Integration Mode" (p. 56)
Delete unneeded files, or replace storage media (new CF card must be formatted).
Delete unneeded files and folders, or specify
Cannot create a file or folder. Possibly too many file or folders in the root another folder as the file copy destination.
Too many files or folders in root. folder.
See "7.4 Saving Operations" (p. 107)
"7.10 File and Folder Operations" (p. 117)
CF card is not inserted.
CF card not found.
USB memory stick is not conUSB drive not found.
nected.
invalid character is used in
the folder name.
Attempted an operation with folder name
contains an invalid character, entered by
computer or malfunction.
invalid character is used in
the file name.
Attempted an operation with file name
contains an invalid character, entered by
computer or malfunction.
Check that a CF card or USB drive is inserted.
See "7.1 Inserting and Removing Storage
Media" (p. 104)
Try again from the computer.
Skip copying file named with A file name within the folder contains an
the invalid character.
invalid character.
File(s) not copied.
Perform the copy operation from the computer.
Failed to access to the folder. Cannot access non-existent folder.
-
Failed to access to the file.
-
Cannot access non-existent file.
Cannot create a file name auAutomatic file name creation stopped.
tomaticaly.
Specify a different destination folder, or create
a new folder for saving, or delete unneeded
files, or replace storage media (new CF card
must be formatted).
See "7.10 File and Folder Operations" (p.
117)
Skip copying file named with Attempted to open a computer-created
the invalid character.
folder that is not within the root folder.
Try again from the computer.
Skip copying folder not under During folder copy, attempted to copy a
the root folder.
folder containing another folder.
File(s) not copied.
Perform the copy operation from the computer.
Cannot create a folder not un- Attempted to create a folder not in the root Create a folder directly in the root folder.
der the root folder.
folder.
See "7.10.1 Creating Folders" (p. 117)
179
11.3 Error Indication
Error display
Cause
Remedy
Cannot copy a folder not un- Attempted to copy a folder within a nonder the root folder.
root folder.
Try again from the computer.
Cannot delete a folder having Attempted to delete a folder containing ananother folder.
other folder.
Skip copying a file having inDuring folder copy, attempted to copy a
valid character and folder not
file or folder with an invalid name.
under the root folder.
File or folder not copied.
Perform the copy operation from the computer.
Input the name.
Enter a file or folder name.
No file or folder name has been specified. See "Chapter 7 Data Saving and File Operations" (p. 103)
Invalid setteing file.
"Load Setting File" attempted without a
valid setting configuration file selected
(wrong file type, or corrupted or incompatible content).
Select a valid setting configuration file.
Settings cannot be loaded unless instrument
options and save settings are the same as
when saved.
See "7.9 Reloading Setting Configurations"
(p. 116)
Cannot find the firmware up- Attempted firmware update without an up- Copy the update file to the root folder of the
date file in the root.
date file.
storage media, and try again.
Cannot find either CF card or CF card or USB drive not found when
USB memory stick.
copying files and folders.
Confirm that the storage media is inserted.
See "7.1 Inserting and Removing Storage
Media" (p. 104)
Cannot copy the folder.
Same file name already exists.
Select a different name for the file or folder.
See "7.10.4 Renaming Files and Folders" (p.
121)
When copying a folder, a duplicate file
name was found on the destination.
Cannot delete the file having Attempted to delete a folder containing a
invalid character file name in file with an invalid character in its name, Try again from the computer.
this folder.
entered by computer or malfunction.
Cannot copy the file.
Same folder name already
exists.
The name of a file to be copied or created Select a different name for the file or folder.
as a setting configuration file duplicates an See "7.10.4 Renaming Files and Folders" (p.
existing folder name.
121)
Copy after changing the foldThe name of a folder to be copied duplier name.
cates an existing folder name in the root
Same folder name already
folder of the storage media.
exists.
Select a different folder name.
See "7.10.4 Renaming Files and Folders" (p.
121)
CF card is not ready.
Failed to save.
Cannot save because CF card not found.
USB memory stick is not
ready.
Failed to save.
Cannot save because USB drive not
found.
Cannot move to [FILE] TAB
during auto saving.
Attempted to open the File Operation
screen during auto-saving.
Cannot execute during auto
saveing.
Manual saving, waveform saving, and screen
Attempted manual saving, waveform savcapture are not available during auto-saving.
ing, or screen capture during auto-saving.
Wait until auto-saving is finished.
Cannot execute during outputting data.
Attempted to print a screen capture image
Try again when printing is finished.
while the printer is busy.
Failed to copy.
Or, there is a file cannot be
copied.
A problem occurred while copying.
Check that a CF card or USB drive is inserted.
See "7.1 Inserting and Removing Storage
Media" (p. 104)
The File Operation screen cannot be opened
during auto-saving. Wait until auto-saving is finished.
Try again from the computer.
Chapter11 Maintenace and Service
Cannot delete a folder not unAttempted to delete a non-root folder.
der the root folder.
11
180
11.3 Error Indication
Error display
Cause
Remedy
Different sensors! Cannot
Attempted to load an incompatible setting
change the wiring in the setconfiguration file.
ting file.
D/A option is different.
Motor option is different.
Settings cannot be loaded unless instrument
Attempted to load an incompatible setting options and saved items are the same as those
configuration file.
installed and selected when saved.
Attempted to load an incompatible setting See "7.9 Reloading Setting Configurations"
(p. 116)
configuration file.
Inconsistent items to save
Attempted to load an incompatible setting
configuration file.
CF card error!
This card is not supprted.
Incompatible CF card found.
Use a Hioki CF card option.
See "Chapter 7 Data Saving and File Operations" (p. 103)
USB memory stick error!
This memory stick is not sup- Incompatible CF card found.
prted.
Use a Hioki CF card option.
See "Chapter 7 Data Saving and File Operations" (p. 103)
Failed to write.
Writing to storage media failed.
Failed to read.
Reading from storage media failed.
Try again.
Failed to save while calculat- Attempted to save a waveform while it is
ing the waveform data
being created.
Try again after the waveform is created (when
the timer mark disappears).
Failed to create a file.
File creation failed for unknown reason.
Failed to create a folder.
Folder creation failed for unknown reason.
Printer error!
Check that the printer is connected and turned on.
Attempted printer auto-setup without a
See "8.1.1 Printer Preparation and Connecprinter connected, or with printer turned off.
tion" (p. 124)
Unknown error!
An unknown error has occurred.
Try again.
Clear this error by pressing any key except
or
once. If the error recurs, contact your
dealer or Hioki representative.
Contact your dealer (agent) or local sales office if a repair should become necessary.
If the measurement lines are energized when the instrument is turned on, the instrument may
be damaged or an error message may appear, so before energizing the lines, turn the instrument on and confirm that no error message is displayed.
181
11.4 Disposing of the Instrument
11.4 Disposing of the Instrument
• To avoid electric shock, turn off the power switch and disconnect the power
cord and measurement cables before removing the lithium battery.
• Battery may explode if mistreated. Do not short-circuit, recharge, disassemble
or dispose of in fire.
• Keep batteries away from children to prevent accidental swallowing.
Lithium Battery Removal
Tools required: One No. 2 Phillips screwdriver, tweezers
1. Turn the instrument's power switch off.
2. Disconnect the power cord and all cables.
3. Remove the six Phillips head screws in the
rear cover, and remove the cover by sliding it
back.
4. Remove the six Phillips head screws around
the front panel, and remove the panel.
5. Insert the tweezers between the battery and
its holder on the internal board, and lift the
battery to remove it.
CALIFORNIA, USA ONLY
This product contains a CR Coin Lithium Battery
which contains Perchlorate Material - special handling may apply.
See www.dtsc.ca.gov/hazardouswaste/perchlorate
Chapter11 Maintenace and Service
When disposing of this instrument, remove the lithium battery and dispose of battery and instrument in
accordance with local regulations.
Dispose the other options appropriately.
11
182
11.4 Disposing of the Instrument
A1
Appendix1 Block Diagram
Appendix
Appendix1 Block Diagram
Voltage Input Circuit
High-Speed
Power Analysis
Engine
Ω
Range
9-inch WVGA
LCD
Ω
Isolation
Key
Current Sensor Input Circuit
Range
Ω
CF Card
Motor Analysis Input Circuit (Option)
Channel A Input Circuit
Ω
Range
USB Port
Ω
(Remote Con-
Zero-Crossing
Detection
Isolation
trol Functions)
Channel B Input Circuit
USB Port
Ω
(Storage)
Range
Ω
CHZ Input circuit
Zero-Crossing
Detection
Ω
Zero-Crossing
Detection
Ω
Isolation
Sync
Control
D/A Output Circuit (Option)
Appendix
Ω
A2
Appendix2 Measurement Data Saving Format
Appendix2 Measurement Data Saving Format
Header Structure
Headers (item names saved at the head of the file) when measurement data is saved by manual or autosaving are as follows.
• Selected items are output in order from the top of the table, and from left to right.
• Measurement data is output after the last line of the header, in the same sequence as the header.
• The first three items (Data, Time, and Status) are always output regardless of selected items.
Output Item
Year, Month, and Day
Header Item and Alignment
Date
Time
Time
Status
Status
Elapsed Time
Laptime
Elapsed Time (ms)
Voltage
Current
Laptime (ms)
RMS
Urms1 to Urms4
Urms12
Urms34
Urms123
Voltage MEAN
Umn1 to Umn4
Umn12
Umn34
Umn123
AC component
Uac1 to Uac4
Simple average
Udc1 to Udc4
Fundamental wave
component
Ufnd1 to Ufnd4
wave peak +
PUpk1 to PUpk4
wave peak -
MUpk1 to MUpk4
THD/ripple rate
Uthd1 to Uthd4 / Urf1 to Urf4
Unbalance factor
Uunb123
RMS
Irms1 to Irms4
Irms12
Irms34
Irms123
Imn12
Imn34
Imn123
P12
P34
P123
Current MEAN
Imn1 to Imn4
AC component
Iac1 to Iac4
Simple average
Idc1 to Idc4
Fundamental wave
component
Ifnd1 to Ifnd4
wave peak +
PIpk1 to PIpk4
wave peak -
MIpk1 to MIpk4
THD/ripple rate
Ithd1 to Ithd4 / Irf1 to Irf4
Unbalance factor
Effective power
Iunb123
P1 to P4
Apparent power
S1 to S4
S12
S34
S123
Reactive power
Q1 to Q4
Q12
Q34
Q123
Power factor
PF1 to PF4
PF12
PF34
PF123
Phase angle
DEG1 to DEG4
DEG12
DEG34
DEG123
Frequency
FREQ1 to FREQ4
PIH12
PIH34
PIH123
MIH12
MIH34
MIH123
Integ. current in positive diPIH1 to PIH4
rection
Integ. current in negative
MIH1 to MIH4
direction
Integration
Sum of integ. Current
IH12
IH34
IH123
Energy in positive direction PWP1 to PWP4
IH1 to IH4
PWP12
PWP34
PWP123
Energy in negative
direction
MWP1 to MWP4
MWP12
MWP34
MWP123
Sum of energy
WP1 to WP4
WP12
WP34
WP123
Pm
Slip
Efficiency
Eff1 to Eff3
Loss
Loss1 to Loss3
Temperature
Temp
Motor
ExtA
Harmonic Measurement Items
Harmonic Frequency
HFREQ
ExtB
A3
Appendix2 Measurement Data Saving Format
Level
Content
0th Order Voltage
HU1L000 to HU4L000
HU12L000
HU34L000
HU123L000
0th Order Current
HI1L000 to HI4L000
HI12L000
HI34L000
HI123L000
0th Order Power
HP1L000 to HP4L000
HP12L000
HP34L000
HP123L000
0th Order Voltage
HU1D000 to HU4D000
HU12D000
HU34D000
HU123D000
0th Order Current
HI1D000 to HI4D000
HI12D000
HI34D000
HI123D000
0th Order Power
HP1D000 to HP4D000
HP12D000
HP34D000
HP123D000
0th Order Voltage
HU1P000 to HU4P000
HU12P000
HU34P000
HU123P000
0th Order Current
HI1P000 to HI4P000
HI12P000
HI34P000
HI123P000
0th Order Power
HP1P000 to HP4P000
HP12P000
HP34P000
HP123P000
nth Order
the last three digits = n
100th Order Voltage HU1L100 to HU4L100
HU12L100
HU34L100
HU123L100
100th Order Current HI1L100 to HI4L100
HI12L100
HI34L100
HI123L100
100th Order Current HP1L100 to HP4L100
HP12L100
HP34L100
HP123L100
100th Order Voltage HU1D100 to HU4D100
Content Percent100th Order Current HI1D100 to HI4D100
age
100th Order Current HP1D100 to HP4D100
HU12D100
HU34D100
HU123D100
HI12D100
HI34D100
HI123D100
HP12D100
HP34D100
HP123D100
100th Order Voltage HU1P100 to HU4P100
HU12P100
HU34P100
HU123P100
100th Order Current HI1P100 to HI4P100
HI12P100
HI34P100
HI123P100
100th Order Current HP1P100 to HP4P100
HP12P100
HP34P100
HP123P100
Phase angle
•••
Level
Phase angle
Noise Measurement Items
Noise
Voltage
UNf01
UN01
to
UNf10
UN10
Current
INf01
IN01
to
INf10
IN10
About Status Data
The status data indicates the measurement state when the data was saved, and is displayed as a 32-bit
hexadecimal digit, as follows.
bit 31
bit 30
bit 29
bit 28
bit 27
bit 26
bit 25
HM4
HM3
HM2
HM1
MRB
MRA
MPB
bit 24
MPA
bit 23
bit 22
bit 21
bit 20
bit 19
bit 18
bit 17
bit 16
ULM
----
UCU
HUL
UL4
UL3
UL2
UL1
bit 15
bit 14
bit 13
bit 12
bit 11
bit 10
bit 9
bit 8
RU1
RI4
RI3
RI2
RI1
RU4
RU3
RU2
bit 7
bit 6
bit 5
bit 4
bit 3
bit 2
bit 1
bit 0
PI4
PI3
PI2
PI1
PU4
PU3
PU2
PU1
HMx : Invalid harmonic parameter (no harmonic sync)
MRx : Motor analysis options A and/or B over range
MPx : Motor analysis options A and/or B peak over
ULM : Motor analysis options A and/or B sync unlocked
UCU : Calculation Impossible (e.g., measurement data is invalid immediately after changing ranges)
HUL : Harmonic sync unlocked
ULx : Channel x sync unlocked
RIx : Channel x current over range
RUx : Channel x voltage over range
PIx : Channel x current peak over
PUx : Channel x voltage peak over
(x is a channel number)
Measurement Value Data Format
General Measurement
Values
Integration Value
±E±
6-digit decimal mantissa and 2-digit exponent ("+" sign and leading zero are omitted for mantissa.)
±E±
Time
//
::
::
Error state
Input out of range
+9999.9E+99
Appendix
7-digit decimal mantissa and 2-digit exponent ("+" sign and leading zero are omitted for mantissa.)
YYYY/MM/DD
HH:MM:SS
Elapsed Time
Elapsed Time (ms)
A4
Appendix3 Physical Illustration
340±2
170±2
(228.5)
Appendix3 Physical Illustration
157±2
(10)
(380.5)
(Unit: mm)
A5
Appendix4 Rack Mounting
Appendix4 Rack Mounting
The illustrated rack mounting brackets are available. Contact your dealer or Hioki representative.
Front View
Rear View
Appendix
A6
Appendix4 Rack Mounting
Index
i
Index
A
Active Power ...............................41, 53, 56, 62, 64
All CH Set ...........................................................16
Analog DC .....................................................85, 87
Analog Output ............................................ 135, A3
Phase Zero Adjustment ......................................90
Analog output ............................................134, 135
Apparent Power ............................................41, 50
AUTO range ................................................43, 135
Auto-Saving ..............................................110, 111
Averaging ............................................................93
B
Before Connecting ................................................8
Block Diagram .................................................... A1
C
Calculation Formula Specifications ...................166
CF card .............................................103, 104, 106
CH A ...................................................................85
CH B ...................................................................87
CH Z ............................................................88, 138
CHA input ............................................................85
CHA range ..........................................................85
CHA scaling ........................................................86
CHA unit ..............................................................87
CHB input ............................................................87
CHB range ..........................................................87
CHB scaling ........................................................87
CHB unit ........................................................87, 88
Cleaning ............................................................175
Clock .........................................59, 61, 94, 96, 101
Clock control .................................................55, 61
Color .................................................................100
Connection Check ...............................................36
Content .........................................................63, 64
CT .......................................................................51
Current sensor cable .........................24, 28, 35, 36
D
Data Saving ...................................................... 107
DC Integration Moge .......................................... 56
DC100 ms .............................................. 47, 67, 84
DC50 ms ................................................ 47, 67, 84
Dedicated application program ........................ 141
Default Gateway ............................................... 143
Display Contents (Harmonic) ............................. 64
Displayed Item ................................................... 64
Displayed item (Harmonic) ................................. 63
Disposing ......................................................... 181
Distortion ratios .................................................. 93
E
Easy set ............................................................. 35
Efficiency ...................................................... 77, 78
Electrical Angle ............................................ 89, 90
Error Indication ................................................. 177
Ethernet ("LAN") cable ..................................... 145
Ethernet connection ......................................... 145
Ethernet LAN cable .......................................... 144
Ext .............................................. 47, 67, 84, 89, 90
External signal as the sync source ..................... 67
F
Factory Default Settings ................................... 102
FAST .................................................................. 93
File ..................... 21, 103, 105, 117, 118, 120, 121
FILE key ............................................................. 14
Flat-Top .............................................................. 76
Folder ....................................... 117, 118, 119, 120
Formatting ........................................................ 106
Freq range fc ...................................................... 86
Frequency Measurement Source ....................... 49
Full-scale frequency ................................. 135, 160
Full-scale integration ................................ 135, 137
Fundamental Current Content ............................ 42
Fundamental Voltage Content ........................... 42
Fundamental wave component ........................ 162
G
Grounding the Instrument’s Functional Earth ..... 27
D/A output .........................................................134
D/A Output Examples .......................................137
Data format .......................................................103
Data Hold ..........................................................130
Index
Index
ii
H
M
Handle ................................................................ 13
Hann ................................................................... 76
Harmonic Bar Graph .......................................... 62
Harmonic List ..................................................... 64
Harmonic Sync Source .......................... 67, 89, 90
Harmonic Vectors ............................................... 65
Header Structure ................................................ A2
Hiding and Displaying Waveforms ..................... 70
Highest Displayed Order .................................... 64
Highest order .................................................... 113
HOLD ................................................................. 17
Hold .................................................................... 94
Horizontal Axis Magnification (Waveform) ......... 71
HTTP server ..................................................... 146
Main page ......................................................... 146
Manual Integration ........................................ 57, 58
MANUAL range ............................................ 43, 44
Manual Save ............................ 103, 105, 107, 108
Master .............................................................. 129
Max frequency (Motor) ....................................... 88
Maximum recordable items .............................. 112
MEAN ................................................................. 50
MEAS key ........................................................... 14
Measured Items for Display ................................ 38
Measurement Ch (Noise analysis) ..................... 76
Measurement Channel (Harmonic) .................... 65
Measurement Configuration ............................... 41
Measurement Screen ......................................... 18
Media-Busy Indicator .......................................... 17
MID ..................................................................... 93
Minimum Noise Frequency ................................. 74
Motor poles ......................................................... 88
Motor Power ................................... 77, 82, 87, 138
Motor Sync Source ............................................. 84
Motor Testing Option .......................................... 82
I
Incremental rotary encoder .............................. 139
Index averaging .................................................. 93
Initializing ......................................................... 101
Input Cable Labels ............................................... 1
Input Frequency Source ..................................... 84
Inspection ......................................................... 175
Instantaneous values ................................. 94, 135
Integration Value ................................ 53, 156, 157
Interface ............................................................. 17
Internal fixed clock ............................................. 67
Interval ......................................... 58, 91, 111, 112
Interval timing control ......................................... 91
IP address ........................................................ 143
Items to save .................................................... 112
K
N
No. of pulses ...................................................... 88
Noise .................................................................. 72
Noise sampling ................................................... 75
O
Output Level ..................................................... 136
Output order ..................................................... 113
P
Key-Lock ............................................................ 17
L
Labels ................................................................. 24
LAN Interface ........................................... 142, 155
Language ......................................................... 100
LCD back light .................................................. 100
Linear ................................................................. 63
LOG .................................................................... 72
Log ..................................................................... 63
Loss ........................................................ 77, 78, 77
LOW FREQ key ................................................. 49
Lower measurement limit ....................... 18, 49, 50
Lowest order .................................................... 113
Low-pass filter .............................................. 18, 52
Low-pass filter (Motor) ....................................... 84
Peak Hold ............................................... 17, 95, 96
Peak Over .......................................................... 40
PHASE ADJ ....................................................... 90
Phase angle ..................................................... 137
Physical Illustration .............................................A4
Pm .......................................................... 82, 87, 88
Points ..................................................... 71, 74, 76
Power Factor ................................................ 41, 53
Power-On Reset ............................................... 101
Print .............................................................. 2, 123
Printer ....................................................... 124, 125
PT ....................................................................... 51
Pulse count ......................................................... 89
索
引
iii
Index
R
RANGE key ...................................................43, 44
Rated torque ...........................................85, 86, 87
Reactive Power .............................................41, 50
Real time .......................61, 92, 102, 156, 159, 160
Realtime ..........................12, 17, 53, 54, 57, 59, 60
Real-Time Clock ...............................................111
Real-time clock timing control .............................91
Recording paper ...............................................124
Rectangular .........................................................76
Rectification Method ...........................................50
Remaining available recording time ..................110
Repair ...............................................................175
Replaceable parts and useful life ......................176
Resetting Integration ...........................................54
Response time ....................................................93
RF .......................................................................56
ripple factor .........................................................56
RMS 41, 42, 50, 53, 56, 69, 93, 152, 154, 157, 162,
.................................................................... 166, A2
RMS Integration Mode ........................................56
Rotation rate .................................................82, 87
rotation rate .........................................................82
Rotation Signal Input ...........................................87
RS com speed ..................................................125
RS connection ...........................................125, 128
RTC clock .........................................................130
RUN mark ...........................................................17
S
T
THD .................................................................... 68
THD Voltage Percentage ............................. 42, 68
THD-F ................................................................ 68
THD-R ................................................................ 68
Thermometer .................................................... 127
Timer .......................................................... 60, 111
Timer timing control ............................................ 91
Timing Control Functions ............................. 91, 96
Timing control functions
Interval timing control ..................................... 91
Real-time clock timing control ........................ 91
Timer timing control ........................................ 91
Torque .......................................................... 82, 85
Torque meter .................................................... 139
U
Unbalance ratios ................................................ 93
Upgrade ........................................................... 106
USB Connection ............................................... 141
USB flash drive ........................................ 103, 104
USB Interface ................................................... 148
Uunb ................................................................... 42
V
Vector ............................................... 36, 44, 65, 98
VT(PT) ................................................................ 51
W
Warm-up ...................................................... 29, 34
Wave + Noise ....................................... 44, 69, 114
Waveform ........................................... 74, 153, 156
Waveform display ......................................... 67, 96
Waveform outputs ............................................ 135
Waveform saving ............................................. 114
Window Function ................................................ 76
Wiring Mode ....................................................... 30
X
X-Y graphs ......................................................... 97
X-Y Plot .............................................................. 97
Z
Zero Adjustment ..................... 34, 83, 90, 151, 153
Zero Adjustment (Motor) .................................... 83
Zero suppress .................................................. 101
Zero-Crossing Filter ........................................... 48
Index
Sampling Frequency .....................................56, 73
Saving Operations ............................................107
Saving Screen Capture Images ........................114
Scale of the vertical axis .....................................63
Scaling ................................................................51
Screen Captures ...............................................126
Self test ...............................................................26
Settings file ...............................................115, 116
SHIFT key ...........................................................14
Slave .................................................................129
Slip ................................................................82, 85
SLOW .................................................................93
Specifications ....................................................160
Start page .........................................................101
START/STOP key ...............................................14
Starting, Stopping, and Resetting Integration .....54
STOP mark .........................................................17
Subnet mask .....................................................143
Sync cable ........................................................129
Sync event ........................................................130
Sync Source ..................................................47, 67
Sync Unlock ........................................................48
Synchronized Measurement .............................129
SYSTEM .............................................................20
SYSTEM key ...................................................... 14
System reset ............................................ 101, 176
Index
iv
Δ-YConversion ................................................... 98
φ ....................................................................... 136
η ................................................................. 77, 136
θ ....................................................................... 162
索
引