
1
Oracle Financial Services Loan Loss Forecasting and Provisioning User Guide Release 1.5.0.0.0 July 2013 User Guide: Oracle Financial Services Loan Loss Forecasting and Provisioning, Release 1.5.0.0.0 Contents PREFACE............................................................................................................................................ IV INTENDED AUDIENCE ..................................................................................................................................................... IV DOCUMENTATION ACCESSIBILITY ..................................................................................................................................... IV ACCESS TO ORACLE SUPPORT .......................................................................................................................................... IV STRUCTURE.................................................................................................................................................................. IV RELATED INFORMATION SOURCES .................................................................................................................................... IV WHAT’S NEW IN THIS RELEASE ........................................................................................................................................ IV 1. INTRODUCTION ....................................................................................................................... 2 1.1. 2. SCOPE OF THE APPLICATION...............................................................................................................................2 UNDERSTANDING PROVISION CALCULATION METHODS ........................................... 3 2.1. CASH FLOW BASED METHOD .............................................................................................................................3 2.1.1. Cash Flow Based Method - Expected Loss Approach .............................................................................4 2.1.2. Cash Flow Based Method - Incurred Loss Approach ..............................................................................5 2.1.3. Calculation of EIR and EIS ......................................................................................................................5 2.1.4. Collective Assessment ............................................................................................................................6 2.2. PROVISION MATRIX METHOD ............................................................................................................................7 2.3. RECOVERY RATE METHOD .................................................................................................................................7 2.4. COLLATERAL VALUE BASED METHOD...................................................................................................................8 2.4.1. Allowance Calculation ............................................................................................................................8 2.5. ALLOWANCE THRESHOLD ................................................................................................................................10 2.6. PROVISION AMOUNT CALCULATION ..................................................................................................................10 2.7. OTHER IMPORTANT CALCULATION: TRANSITION MATRIX ......................................................................................10 2.7.1. Historical Transition Matrices ..............................................................................................................10 2.7.2. Poisson Calculations.............................................................................................................................11 3. UNDERSTANDING THE LLF&P APPLICATION ................................................................12 3.1. PROVISION CALCULATION................................................................................................................................12 3.1.1. Expected Loss (EL) Approach ................................................................................................................13 3.1.2. Incurred Loss (IL) Approach ..................................................................................................................19 3.1.3. Historical Transition Matrices (HTM) ...................................................................................................22 3.2. LOSS FORECASTING ........................................................................................................................................24 4. PREPARING FOR EXECUTION............................................................................................. 25 4.1. 4.2. 5. DATA REQUIREMENTS ....................................................................................................................................25 IMPORTANT METADATA DEFINITION .................................................................................................................26 EXECUTION ............................................................................................................................. 30 5.1. DATA QUALITY FRAMEWORK ...........................................................................................................................30 5.2. RUN MANAGEMENT ......................................................................................................................................30 5.2.1. Run Management UI Icons...................................................................................................................31 5.2.2. Displaying a Run ..................................................................................................................................31 5.2.3. Modifying a Run ...................................................................................................................................33 5.2.4. Executing a Run....................................................................................................................................37 5.2.5. Database Design ..................................................................................................................................40 5.2.6. Processed Data Maintenance Batch ....................................................................................................41 6. LOAN LOSS FORECASTING & PROVISIONING REPORTS.............................................. 42 6.1. HOME PAGE REPORTS ....................................................................................................................................42 Oracle Financial Services Software Confidential-Restricted ii User Guide: Oracle Financial Services Loan Loss Forecasting and Provisioning, Release 1.5.0.0.0 6.2. 6.3. 6.4. 6.5. 6.6. 7. TREND ANALYSIS ...........................................................................................................................................43 TRANSITION MATRIX ......................................................................................................................................44 COMPARISON ANALYSIS ..................................................................................................................................44 STRESS TEST REPORTS ....................................................................................................................................44 LOSS FORECAST .............................................................................................................................................45 RESOLUTION OF LLF&P IMPLEMENTATION ISSUES ................................................... 46 ANNEXURE A: UNDERSTANDING KEY TERMS AND CONCEPTS ....................................... 47 ANNEXURE B: THINGS TO REMEMBER ................................................................................... 49 ANNEXURE C: FREQUENTLY ASKED QUESTIONS ................................................................. 50 ANNEXURE D: HISTORICAL TRANSITION MATRIX ............................................................... 54 ANNEXURE E: CASH FLOW DICTIONARY ................................................................................. 70 ANNEXURE F: PRODUCT TYPE MAPPING .................................................................................71 ANNEXURE G: DATA FLOW .......................................................................................................... 72 ACRONYMS AND GLOSSARY TERMS ........................................................................................... 73 Oracle Financial Services Software Confidential-Restricted iii User Guide: Oracle Financial Services Loan Loss Forecasting and Provisioning, Release 1.5.0.0.0 Preface Intended Audience Welcome to Release 1.5.0.0.0 of the Oracle Financial Services Loan Loss Forecasting & Provisioning (LLF&P) User Guide. This guide is intended for: Technical Analyst: This user ensures that the data is populated in the relevant tables as per the specifications, executes, schedules and monitors the execution of Runs as batches. Business Analyst: This user reviews the functional requirements and information sources, like reports. Data Analyst: This user would be involved with cleaning, validation and importing of data into the OFSAA Download Specification Format. Administrator: The Administrator maintains user accounts and roles, archives data, loads data feeds, and so on. The administrator would control the access rights of users. Documentation Accessibility For information about Oracle's commitment to accessibility, visit the Oracle Accessibility Program website at http://www.oracle.com/pls/topic/lookup?ctx=acc&id=docacc. Access to Oracle Support Oracle customers have access to electronic support through My Oracle Support. For information, visit http://www.oracle.com/pls/topic/lookup?ctx=acc&id=info or visit http://www.oracle.com/pls/topic/lookup?ctx=acc&id=trs if you are hearing impaired. Structure 1. Introduction 2. Understanding Provision Calculation methods 3. Understanding the LLF&P Application 4. Preparing for Execution 5. Execution 6. Loan Loss and Forecasting & Provisioning Reports 7. Resolution of LLF&P Implementation Issues Annexure Related Information Sources Oracle Financial Services Loan Loss Forecasting and Provisioning Release 1.5.0.0.0, has been referred to as LLF&P in this User Guide. What’s New in this Release Oracle Financial Services (OFS) Loan Loss Forecasting and Provisioning (LLF&P) v.1.5.0.0.0 is a successor to the application’s 1.0.0.0.0 version. The highlight of this release is introduction of Collateral value Based Method for Oracle Financial Services Software Confidential-Restricted iv User Guide: Oracle Financial Services Loan Loss Forecasting and Provisioning, Release 1.5.0.0.0 computation of provisions. Under this method the provision is calculated as the difference between exposure and collateral value. Oracle Financial Services Software Confidential-Restricted v User Guide: Oracle Financial Services Loan Loss Forecasting and Provisioning, Release 1.5.0.0.0 1. Introduction International Financial Reporting Standards (IFRS) guidelines have set out new requirements on classification and measurement of financial assets and liabilities. It specifies two approaches for the measurement of assets namely Amortized Cost and Fair Value approach. The scope of Oracle Financial Services Loan Loss Forecasting and Provisioning is to focus only on the amortized cost approach. Oracle Financial Services Loan Loss Provisioning and Forecasting (LLF&P) is designed to aid institutions in calculating the provision or allowance for exposures as per IAS39 and IFRS 9. Proposed guidelines want institutions to estimate the future loss and make provisions accordingly. Thus, the LLF&P Application calculates expected loss as well as incurred loss. A Run in the LLF&P Application specifies the approach (Expected Loss or Incurred Loss) to be used to calculate Loan Loss Provisioning. Broadly these approaches (Expected loss and Incurred loss) are further classified depending upon the product type and impairment status of the account. The following out of the box Runs are configured in this application: Expected Loss (EL) Run Incurred Loss (IL) Run Historical Transition Matrix (HTM) calculation EL Run OBP(Oracle Banking Platform) Interface (This is similar to EL Run in terms of functionality, except that, it uses underlying tables compatible with OBP interface. Further details are mentioned later in this guide.) 1.1. Scope of the Application The International Financial Reporting Standards (IFRS) has set standards for calculating loan losses and its subsequent provisioning. . IFRS 9 is being discussed and issued in 3 phases. IFRS 9 (Phase I): Classification and Measurement. For more information, refer Financial Instruments: Classification and Measurement, published in July 2009. IFRS 9 (Phase 2) Impairment Methodology. For more information, refer exposure draft, Financial Instruments: Amortized Cost and Impairment, published in November 2009 IFRS 9: Phase 3: Hedge Accounting. For more information on the details on the criteria to classify the asset as either value using amortized cost or fair value, refer to Appendix B (Section 4.1 and 4.26) of the Phase 1 document. Oracle Financial Services Loan Loss Provisioning and Forecasting Release 1.5.0.0.0, caters to the IFRS 9: Phase II standards which expects institutions to classify the exposures in its banking and trading book into those valued, using the fair value concept and those valued using amortized cost. Other regulations which an institution needs to follow as a pre-requisite to using the LLF&P Application are as follows: IFRS 9: Phase I- Classification & measurement IAS 39 Other local accounting regulations as applicable Oracle Financial Services Software Confidential-Restricted 2 User Guide: Oracle Financial Services Loan Loss Forecasting and Provisioning, Release 1.5.0.0.0 2. Understanding Provision Calculation methods This chapter gives a better understanding of the various methods applied by the LLF&P application. An Expected Loss approach applies the following methods: Cash Flow Based Method Provision Matrix Method Recovery Rate Method Collateral Value Based Method An Incurred Loss approach applies the following methods: Cash Flow Based Method Provision Matrix Method Recovery Rate Method Both Expected Loss and Incurred Loss runs have a few activities in common which are as follows: 1. Load the data as per data download requirements. 2. Assign the relevant provision calculation method. 3. Setting Charge-off materiality 4. Decide whether a collective assessment or an individual assessment is to be made. Assign or reclassify a few aspects as follows: Map the external rating grades to internal credit grades for transition matrices. Note: Only one external rating from a rating source can be mapped to only one internal rating. Map the Bank Customer type to Basel Customer type, used for reporting only. Map the Bank Product type to Basel Product type, used for reporting only. Map the Bank Asset class to Basel Asset type, used for reporting only. 2.1. Cash Flow Based Method This method mainly involves projecting cash flows using the asset contract definition. This method is applied on the financial assets for which cash flows can be generated, which includes loans and Held-to-Maturity (HTM) securities. In addition, assets for which cash flows are projected using behavior assumptions can also be included. This is a single name given to the method applicable for non-impaired cash flow based products under Expected Loss and Incurred Loss approach. For Expected Loss approach, time horizon for which the cash flow method is applied is till the maturity of assets. For Incurred Loss approach (Forward Exposure Method - IBNR), time horizon for which the cash flow method is applied till the emergence period. Oracle Financial Services Software Confidential-Restricted 3 User Guide: Oracle Financial Services Loan Loss Forecasting and Provisioning, Release 1.5.0.0.0 Limitation: This method is not applicable for impaired assets as it does not generate cash flows. NOTE: Cash Flow Data Generation Alternative 1 Collective Assessment: The purpose of using collective method is to gain operational efficiency to generate cash flow (saving time required for calculation) and in cases where detailed information is not available. For internal CFE, account information, including cash-flow is expected to be available at individual level. Oracle CFE: In cases where the Oracle Cash Flow Engine is used, the LLF&P application needs IRR of the contractual cash flows as a download. This will be required for the computation of EIS. NOTE: Cash Flow Data Generation Alternative 2 When cash flows are provided as a download, FIC MIS DATE in STG ACCOUNT CASH FLOW is an important field to be considered. For EIR or EIS calculations, cash flows as of Account Start Date are required, and for provision calculations cash flows as per Current Date or FIC MIS DATE is provided. In the first instance, FIC MIS DATE in STG ACCOUNT CASH FLOW must be as per Account Start Date and in second case it should be normal FIC MIS DATE. The steps to be followed for Cash Flow Based Method for both the Expected Loss and Incurred Loss approaches are detailed as follows: 2.1.1. Cash Flow Based Method - Expected Loss Approach The features of this approach are the use of Effective Interest Rate (EIR) and Effective Initial Spread (EIS). The procedure to compute this method is as follows: Transition matrix is assigned to each and every applicable account, exposure, or cohort (that is, group of accounts/exposures). Cash Flow Engine (CFE) calculates the cash flows for each concerned exposure till its maturity. The LLF&P Application requires Cash Flows for two purposes as follows: Calculation of provision Calculation of EIR or EIS. Cash flows are generated as of account start date for the EIR or EIS calculations, whereas Cash flows are generated as of current date in case of provision calculation. If collective assessment has been selected, the cash flows are generated for cohort instead of each account. Every cohort is treated as single exposure from a cash flow perspective. Note: Carrying amount is stored in carrying cost column, for processing and reporting purpose (N_CARRYING_COST_NCY). For more information on the concept of collective assessment, see Collective Assessment section. Projected cash flow is then converted to expected cash flow by multiplying with the expected cash flow rate. The Loss Rate and Expected cash Flow are calculated as follows: Oracle Financial Services Software Confidential-Restricted 4 User Guide: Oracle Financial Services Loan Loss Forecasting and Provisioning, Release 1.5.0.0.0 Loss Rate = Default Probability Applicable as of Cash Flow Date * LGD at Account Level Expected Cash Flow Rate = 1 – Loss Rate Expected Cash Flow = Projected Cash Flow * Expected Cash Flow Rate. Expected cash flows are then discounted to the current date using EIR or EIS. For Fixed Rate Instrument, Discount Rate = EIR For Variable Rate Instrument, Discount Rate = Variable Rate Applicable for Cash Flow Date + EIS Sum of these cash flows at account or cohort level is known as amortized cost. Allowance as of date = Carrying amount – Amortized cost If charge- off is material, Provision as of date = Allowance as of Previous date (Allowance as of current date – Net Charge off) else, it is difference between two previous period allowances. 2.1.2. Cash Flow Based Method - Incurred Loss Approach The procedure to compute this method is as follows: 1. 2. Assign the following to each and every applicable account, exposure, or cohort. You can also provide a download at the required granularity: Transition Matrix Emergence period Risk Free Rate Cash Flow Engine calculates the cash flows for each concerned exposure till the maturity. Note: If you have selected a collective assessment, the cash flows are generated for cohort instead of each account. Every cohort is treated as a single exposure from a cash flow perspective. 3. Projected Cash Flows are converted to Expected Loss using loss rate and Loss Given Default (LGD). The Loss Rate and Expected Loss Amount are calculated as follows: Loss Rate = Default Probability Applicable as of Cash Flow Date * LGD at Account Level Exposure at Default = Principle Outstanding as of each Cash Flow Date excluding Principle Payment as of said Cash Flow Date. Expected Loss Amount = Exposure at Default * Loss Rate 4. Expected loss amount is calculated up to the emergence period. 5. Expected cash flows are discounted to the current date using Risk Free rate assigned. Allowance as of Date = Sum of Expected Loss Amount at Account Level. If charge-off is material, Provision as of Date = Allowance as of Previous Date - (Allowance as of Current Date – Net Charge off) else, it’s the difference between two previous period allowances. 2.1.3. Calculation of EIR and EIS EIR and EIS are calculated for CFE based methods. Here, cash flows are calculated till maturity Oracle Financial Services Software Confidential-Restricted 5 User Guide: Oracle Financial Services Loan Loss Forecasting and Provisioning, Release 1.5.0.0.0 covering the entire life span. EIR is the yield to maturity calculation for expected cash flows. This is calculated for fixed interest rate contracts. Calculation of expected cash flows will be detailed in further sections. EIS is calculated as follows. This is calculated for variable interest rate contracts: – – Internal Rate of Return (IRR) is yield to maturity calculation for contracted cash flows. The calculation of EIS and EIR are explained in the following document: EIR and EIS Calculations.xlsx You can decide the accounts for which EIR or EIS is required to be calculated. There can be various reasons for which EIR or EIS needs to be calculated or re-calculated, namely, new accounts, and change in important contract terms, and so on. However, except on the first day of implementation, percentage of new accounts for which EIR or EIS is to be calculated is expected to be small. Thus, EIR or EIS can be re-calculated based on your instructions taken as input during the data download stage. The re-calculated EIR or EIS would exist along with pre-determined values but with a new ‘as of date’ and status as active. The LLF&P application considers the EIR or EIS with status as active and those with the latest as of date for further computation of loan loss provision. Note: Upon recalculating EIR or EIS, the loan loss provision for the current period would be close to NIL. 2.1.4. Collective Assessment Collective assessment is combining the exposures with similar characteristics, resulting in a single exposure known as a cohort. Hence, collective assessment is referred to as Cohort Formation in the LLF&P application. Cohort is strongly linked to the Oracle Cash Flow Engine (CFE). It uses all the mandatory cash flow calculation parameters as the basis of Cohort formation. Charged off / written off and impaired accounts are not allowed to use collective assessment. Charged off accounts may require higher provisioning than that for non-charged off accounts. To maintain homogeneity of accounts within cohort, these accounts are not part of collective assessment. The purpose of using collective method is to gain operational efficiency (saving time required for calculation) and in cases where detailed information is not available. Collective assessment helps reduce the time required for calculation with minimal loss in accuracy. However, at the bank level, where prudent provisioning is required, differences between collective assessment and individual assessment turns out to be trivial. If one calculates the provision at individual account level and then compares the same with the provision allocated to the individual account from cohort, then this will create a difference. Oracle Financial Services Software Confidential-Restricted 6 User Guide: Oracle Financial Services Loan Loss Forecasting and Provisioning, Release 1.5.0.0.0 NOTE: Collective Assessment Allowance The criteria for cohort formation are a key decision to be made by you. You can choose all the available parameters as the criteria. This will make lots of cohorts giving some sense of enhanced accuracy. However, operational efficiency achieved would be minimal. On the other hand, one can choose only a few required parameters. This will create fewer cohorts thereby increasing operational efficiencies. However, it also creates an impression of being less accurate. Often comparison is made between two allowance numbers: a. Calculated when exposure is treated as an individual asset. b. Calculated when it is part of a cohort. There are various factors affecting these calculations namely, criteria used for cohort formation and the allocation factor itself. Depending on these two numbers, the collective assessment allowance will either be close or depart. It is suggested that a comparison should be made between similar components. Hence, sum of allowance for a group of exposures when they are treated as individual exposures should be compared with allowance at cohort level assuming the composition is the same in both the cases. It is this comparison which should drive the decision for cohort formation criterion and allocation factor. 2.2. Provision Matrix Method This mainly involves the usage of direct provision rates instead of cash flow projection. This is applied on the financial assets mapped to Provision Matrix based methods. There is no constraint to the application of this method. This method is common for both impaired and non-impaired exposures. Note: It is assumed that in case of an impaired status a higher rate of provisioning is to be applied. This can be achieved by adding impairment status as one of the dimensions while applying the Provision Matrix method. The following steps are required to be completed to use the Provision Matrix method: 1. Assign the provision matrix to each and every account, exposure or cohort. These provision matrices are either based on credit rating or delinquency bands or both. 2. Apply provision rate to each exposure, depending on the credit rating and/or delinquency band, from an assigned provision matrix. Provision Matrix Assignment Rule is used for mapping provision Matrix. The parameters required for provision matrix assignment are source hierarchies in the Rule. Applicable provision rate from Provision Matrix is assigned to an account based on its rating or delinquency band using Provision Rate Assignment Rule. Amortized cost is calculated using provision rate as Amortized cost = Carrying amount * (1 -Provision rate). Allowance is calculated as difference between carrying amount and amortized cost. 2.3. Recovery Rate Method In case of impaired accounts, a formula based approach is used, wherein the LLF&P application uses average recovery period and IRR of an account to calculate the provision. Oracle Financial Services Software Confidential-Restricted 7 User Guide: Oracle Financial Services Loan Loss Forecasting and Provisioning, Release 1.5.0.0.0 Carrying amount, (Carrying amount at impairment) LGD (Loss given Default) ‘r’ (Original Effective interest rate given as a download, that is, IRR of contractual cash flows). ‘t’ average time to recovery 2.4. Collateral Value Based Method Collateral Value Based (CVB) Method is used to calculate allowance for Mortgage products or other retail products only. In the Collateral Value Based Method, shortfall between the collateral value and carrying amount (with expected recovery cost) of an exposure is calculated. Allowance is calculated based on shortfall amount subject to shortfall threshold. Collateral is assumed to be allocated at 100% mitigate an exposure which means the full value of collateral is available for the account it is mapped to. Hence, if collateral is shared across accounts of different product type, then the all associated accounts should be excluded from provision calculation processing. For non-retail customers or for customers having accounts not passed through CVB methods, it is assumed that same customer will not have same product type if the customer is shared across legal entity.. 2.4.1. Allowance Calculation To arrive at allowance amount, CVB Method requires calculating shortfall of collateral amount to cover carrying amount and expected recovery cost. Allowance is calculated only if shortfall is a positive value. Shortfall is calculated as follows: Expected recovery costs and carrying amounts are provided as input data at account level granularity. Collateral value is also provided as input data at a collateral-level granularity. Since CVB Method is to be applied on home loan and for retail customers, it is assumed that collateral amount, expected recovery cost and carrying amount will be in same currency that is the natural currency of the account. Based on number of collaterals for an account there will be following possible scenarios; and hence potentially varied formula to calculate shortfall: Scenario ID Description 1 1 Account : 1 Collateral 2 1 Account : N Collaterals Shortfall Calculation Formula In addition to the above, there could be a case where one customer is holding multiple accounts to be treated by CVB Method. In such case, shortfall needs to be necessarily calculated at product type level for each customer and then allowance has to be allocated back to account level using waterfall approach as explained in Allowance Calculation – Multiple Accounts section. Based on Oracle Financial Services Software Confidential-Restricted 8 User Guide: Oracle Financial Services Loan Loss Forecasting and Provisioning, Release 1.5.0.0.0 number of accounts for a customer, there will be following possible scenarios; and hence potentially varied formula to calculate shortfall. Scenario ID Description 1 1 Customer : 1 Account 2 1 Customer : N Accounts Shortfall Calculation Formula Allowance Calculation – Single Account For a single customer and single account scenario, allowance amount is calculated from shortfall amount as follows: or Threshold amount is assigned by computing a Rule at Legal Entity, Product type and Reporting Currency level. Allowance Calculation – Multiple Accounts If one customer is holding multiple accounts, then the shortfall is calculated at product type and customer level as follows: Shortfall amount thus calculated will undergo threshold check at product type and customer level. or Threshold amount is a semi-static download amount at Legal Entity, Product type and Reporting Currency level. Allowance amount is derived at account level from the eligible shortfall amount using the waterfall approach. In this approach, the shortfall amount is first used to cover the account with the maximum carrying amount, and then the account with the second highest carrying amount is covered and so on, till the shortfall amount is exhausted. The waterfall approach is explained with an example in the attached worksheet. Oracle Financial Services Software Confidential-Restricted 9 User Guide: Oracle Financial Services Loan Loss Forecasting and Provisioning, Release 1.5.0.0.0 Example.xlsx 2.5. Allowance Threshold Threshold is checked against the sum of allowance across accounts for a customer and product type combination. Since the product type is one of the source hierarchies it is assumed that the underlying accounts would have undergone same provision calculation method. Eligible Allowance amount for the underlying accounts can be considered as 0 if sum total of the allowance of its account-set, at which threshold was checked, is less than or equal to the given threshold. Eligible Allowance is the same as the allowance if sum total of allowance of its account-set, at which threshold was checked, is greater than the given threshold. Threshold amount is assigned through rule at Legal Entity, Product type and Reporting Currency level. 2.6. Provision Amount Calculation Provision is calculated as a difference between allowance of current period and allowance of previous period. The provision calculation is based on f_Chargeoff_Materiality_Flag. If the flag is “Y”, then, the formula is: Provision at time (t) =Allowance at time (t) - (Allowance at time (t-1)-Net Charge off) And if the flag is “N”, then The formula is: Provision at time (t) =Allowance at time (t) - Allowance at time (t-1) Provision is calculated using Provision Calculation rule. 2.7. Other Important Calculation: Transition Matrix Transition Matrix is the probability of an exposure or a customer moving from one credit grade to another over a defined period of time. Grades can be defined as: Credit rating: For example AAA, AA. Or Delinquency bands: For example 0-30 Days, 31-60 days. Transition matrix is used in the following steps: 1. Calculating a set of Historical Transition Matrices. 2. In Predicted Transition Matrix, use Poisson process to convert these probabilities to a suitable frequency. 2.7.1. Historical Transition Matrices Keeping an eye on the set of exposures where these transition matrices are used, different granularities of data are used to generate different historical transition matrices. They represent the institution’s experience. Oracle Financial Services Software Confidential-Restricted 10 User Guide: Oracle Financial Services Loan Loss Forecasting and Provisioning, Release 1.5.0.0.0 In this calculation: The sum of all transitions is one, thus maintaining unity constraint, New and closed accounts are excluded. NOTE: New accounts are those which are not available in the last data point whereas they are available in the current data point. The concept of closed account is the exact opposite of new account. Denominator is the base of the previous period. This means either the total number of accounts or the sum of carrying amount is used as the denominator which belongs to the previous period. At every instance, transition matrix from one period to another is calculated. For multi-period transition matrix, one needs to execute multiple times. Once the institution has this set ready, it needs to predict or forecast the transition matrix for future years. These predicted transition matrices are used in the LLF&P application. For example: Assume internal rating is from AAA to D (in the order of credit rank with AAA as most sound and D as rating for defaulted assets). If you keep the rating D as impaired state rating then the transition probability from AAA to D will be considered as probability of impairment for exposure having AAA rating. If you keep a rating better than D, say C+, as impaired state rating then all the ratings from C+ to D (both rating inclusive), in the order of credit rank, will be considered as impaired state rating. The transition probabilities from AAA+ to C+ and to all other rating between C+ and D (C, C-) will be aggregated and considered as probability of impairment for exposure having AAA rating. 2.7.2. Poisson Calculations Poisson calculations are used to convert the probability from one frequency to another. For example: if the Transition Matrix frequency is annually and we are interested in monthly probabilities, then we look for Poisson calculations. In these calculations, per period loss rate, which is credit grade specific, is the most important for calculations. Every grade calculation differs depending on the probability of default. The per period loss rate is computed through the following steps: 1. Calculate the Poisson Parameter (φ) for the Poisson Process of converting the Poisson parameter to the lower granularity based on the inputs of time (Monthly, Quarterly, Semiannually or Annually), using the below formula for each credit grade: Formulae used: 1-Exp(-φ t) = t-year cumulative probability All other parameters apart from ‘Poisson Parameter’ (φ) are input. Thus we solve this for φ. (The value for ‘Poisson Parameter’ should be stored) 2. Calculation is performed at a Monthly level which will be the default option provided in the LLF&P Application. The output is a cumulative probability at a given frequency. 3. Cumulative probabilities are then adjusted for LGD. 4. Adjusted cumulative probabilities are used to calculate per period loss rate. 5. Per Period Loss rate for period(t) = Cumulative Prob. for Period (t) - Cumulative Prob. for Period (t -1) Then, conversion to cumulative probability across years takes place; where: Oracle Financial Services Software Confidential-Restricted 11 User Guide: Oracle Financial Services Loan Loss Forecasting and Provisioning, Release 1.5.0.0.0 6. Cumulative Loss rate for period(t) across TM period = Cumulative Prob. for Period (t1) + Cumulative Prob. for Period (t) Expected Cash Flow rate at period (t) = 1 - Cumulative Loss rate for period(t) 3. Understanding the LLF&P Application The main objective of this chapter is for you to get familiarized with the various functions of Oracle Financial Services Loan Loss Forecasting and Provisioning, through the process flow. The logical order, in which the LLF&P application functionalities are executed, will help in understanding, executing, and maintaining data in the LLF&P Application. LLF&P Business Processes are majorly classified into the following: Provision Calculation Loss Forecasting 3.1. Provision Calculation Two types of approaches that are used to calculate provision which are as follows: Incurred Loss (IL) Approach Expected Loss (EL) Approach Each approach is a separate Run in the LLF&P application. For more information on executing a Run, refer to chapter 5-Execution. A high level process flow to calculate provision is as follows: The Expected Loss Run applies any one of the following methods to an account: Oracle Financial Services Software Confidential-Restricted 12 User Guide: Oracle Financial Services Loan Loss Forecasting and Provisioning, Release 1.5.0.0.0 Cash flow based Method Provision Matrix Method Recovery Rate Method Collateral Value Based (CVB) method The Incurred Loss Run applies any one of the following methods to an account: Cash flow Based Method Provision Matrix Method Recovery Rate Method NOTE: Provision Calculation method is expected to be changed. 3.1.1. Expected Loss (EL) Approach EL Approach consists of the following major business processes: 1. Basic Procedure 2. Expected Loss Method 3. Provision Matrix Method 4. Recovery Rate Method 5. Collateral Value Based (CVB) Method 6. Net Charge Off Calculation 7. Provision Calculation 8. Currency Conversion Basic Procedure The basic procedure is as follows: 1. Load the setup data and Run data as mentioned in chapter 4 “Preparing for Execution”. 2. Basel reclassification Rule is used to map the bank’s customer type and product type to Basel Customer Type and Basel Product Type respectively. It is used for reporting purposes. This is done using the following reclassification Rules: 3. Basel Customer Type Re-classification Basel Product Type Re-classification Basel Asset Class Re-classification Methodology is selected based on following source hierarchies: Product Type Account Status (Indicates Accrual Status, Write Off Indicator, Closed Account Indicator and other statuses) Days Past Due (DPD) band Customer Status (Indicates Bankruptcy Indicator and Fraud Indicator) Account Based Provisioning Approach Indicator (Preferential method assignment indicator) Oracle Financial Services Software Confidential-Restricted 13 User Guide: Oracle Financial Services Loan Loss Forecasting and Provisioning, Release 1.5.0.0.0 Carrying Amount Band Cash Flow Approved Indicator Customer Type Impairment status a. Cash Flow Based Expected Loss (EL) method is mapped using the Rule Provision Calculation Methodology Selection - EL Run. For Non-retail customers, this method can be used. b. Provision Matrix method is mapped using the rule Provision Calculation Methodology Selection - IL Run for the following Source: (Non-Impaired Asset AND Customer Type AND Product) OR (Impaired Asset AND High Net Worth Individual AND Credit Cards) OR (Impaired Asset AND Corporate - Small AND Overdraft) OR (Impaired Asset AND Corporate - Medium AND Overdraft) OR (Impaired Asset AND Corporate Large AND Cash Credit) Method Override – Assume a customer has many accounts. If any one account is treated by CVB method then, all the other accounts should be treated by CVB method (meant for mortgage loans and other retail loan portfolios). It is assumed that same customer will not have same product type if shared across legal entity. Among all the accounts mapped to CVB method, if the collateral is shared across accounts of different product types, then the associated accounts will be excluded from provision calculation processing. Note: Provision calculation Method selection rule is expected to be customized based on client’s data and requirement. Further, Method override process may override the method, assigned by the rule, to ensure that all accounts of the customer, under same product type, are assigned CVB method to if one of the account is assigned to CVB Method. 4. Setting Charge-off materiality: If gross charge-off is greater than the charge-off materiality threshold then its net charge-off is adjusted from the calculated provision amount. In the preconfigured Run, charge-off materiality threshold amount is 500. This is done using Chargeoff Materiality Assignment rule. Charge-off materiality is also used to identify accounts for collective assessment treatment. Materially charged-off accounts are not considered for collective assessment. Cash Flow Based - Expected Loss Method The process for computing Expected Loss Method is as follows: 1. Using Collective Assessment Assignment Rule, accounts are classified to be treated collectively. All retail customers having non-impaired accounts are assessed collectively to calculate provision. 2. Populate contractual cash flow from the stage table for each account using the T2T rule CONTRACTUAL_CASH_FLOW_POPULATION. This includes populating the principal component and the interest component for each cash flow date. 3. CFE_CONTRACTUAL_CASH_FLOWS: This T2T is used if Oracle Asset Liability Management (ALM) and LLF&P is installed together and the current cash flow is generated using Oracle Asset Liability Management (ALM) and if you want to reuse cash flows of Oracle Asset Liability Management (ALM). AS OF DATE is FIC_MIS_DATE for LLF&P to generate cash flows as on FIC_MIS_DATE. In addition, the ALM process ID should be updated in the LLF&P T2T. Oracle Financial Services Software Confidential-Restricted 14 User Guide: Oracle Financial Services Loan Loss Forecasting and Provisioning, Release 1.5.0.0.0 4. Amortized cost using EL approach is calculated when the Expected Interest Rate (EIR) and Expected Interest Spread (EIS) are as of account start date. If it is not provided as a download, then the application calculates the same. EIR or EIS calculation indicator needs to be updated to indicate that EIR and EIS need to be calculated. This flag is updated by task EIR_EIS_Flag_Update – which updates the flag to A. 5. To calculate EIR or EIS as of account origination date, LLF&P needs cash flow from account origination and expected cash flow after considering the cumulative loss rate. If cash flow is a download as of account start date it needs to be populated using ACCT_ORIGINATION_CASH_FLOWS DT. Cumulative loss rate is calculated with the help of the transition matrix as described in the following steps: NOTE: If you want to calculate EIR or EIS, then the transition matrix provided for EIR or EIS calculation should be valid as of account origination date, that is, account origination date should be in between record start date and record end date of the transition matrix assigned. 6. Assign Transition Matrix: Transition matrix is assigned based on following parameters: Customer Type Currency Product This is done using Transition Matrix Assignment Rule. Accordingly, rating and delinquency based transition matrix data is populated for Poisson processing. This is done using T2T RATING_TRANSITION_MATRIX_POPULATION and DPD_TRANSITION_MATRIX_POPULATION. 7. Each rating scale or delinquency band scale has a default grade state, which indentifies defaulted accounts. Allowance amount is a function of transition probability to default or impairment. To calculate allowance, you may keep impaired state the same as default grade scale or assign some other impaired state depending on the credit policy or outlook. To enable this, you need to assign impaired state rating (absorbing state) for the transition matrix. This is done using the same source hierarchies that are used for Transition Matrix assignment. Transition probability for credit rating grade of impaired state rating and below will be accumulated and considered as Lamda calculation for Poisson process. 8. Similarly, assign impaired state delinquency band. 9. Poisson process is executed to arrive at monthly transition probability. It is done using Cumlt_Impaired_Prob_Calc DT. You can change monthly to quarterly/yearly by setting it up in Reveleus_Parameter_Master table by changing LLF&PBUCKETLENGTH. NOTE: Frequency period of the input transition matrix should be greater than that of bucket length. For example: Input transition matrix cannot be monthly and LLF&PBUCKETLENGTH as Quarterly. In this case, all transition matrices should have frequency period as at least quarterly or more. 10. Accounts to be assessed and treated collectively are identified based on their credit rating, delinquency band, customer type, start date, interest rate, cash flow pattern, and other such characteristics that can affect allowance amount. Cohort is formed according to such data. Cohort_Identification DT is used to achieve this. 11. After identifying such cohorts, data pertaining to accounts forming a cohort is aggregated for collective treatment. This is done using T2T rule COHORT_DATA_POPULATION. Oracle Financial Services Software Confidential-Restricted 15 User Guide: Oracle Financial Services Loan Loss Forecasting and Provisioning, Release 1.5.0.0.0 12. Loss Given Default is calculated at cohort level with relative weight of carrying amount of the account in the cohort. Weighted average LGD for Collective Assessment rule is used for this. 13. For an account or at a cohort level (if account is part of cohort) following steps are performed to calculate allowance: a. Pre cash flow validation- This is to validate input data to CFE. All errors are logged in FIC_DTDQ_MESSAGE_LOG with value of the column V_MAIN_PROG_NAME as FN_DT_PRE_CF_VALIDATIONS. All values need to be picked up for the current batch. b. Generate cash flow and calculate principal and interest component of the cash flow amount. Errors thrown by CFE are logged in FSI_OPS_ERROR_DETAILS. c. Periodic Cumulative Loss Rate is calculated by multiplying LGD with cumulative impaired transition probability using a Rule. d. Expected cash flow rate is derived from cumulative loss rate using a Rule. e. Expected cash flow amount is calculated using cash flow amount and expected cash flow rate (calculated earlier). f. EIR_EIS_Calculation- EIR and EIS values are considered in the following order. First, the application checks for EIR / EIS value in stage table values. If EIR/EIS value is present in the stage table, then the application checks in the Account Inception table. If not present in the Account Inception table, then the LLF&P application calculates by itself. While calculating, records having erroneous data are skipped. Errors during processing are logged in FSI_OPS_ERROR_DETAILS. In addition, account start date is mandatory for EIR EIS calculation g. EIR EIS is calculated at account level and not at cohort level. h. Table is updated with calculated EIR and EIS as on account start date. This is done using Upd_Inception_Rates. i. EIR is aggregated at cohort level with relative weight of carrying amount of the account in the cohort. Weighted Average EIR for Collective Assessment Rule is used for this. j. EIS is aggregated at cohort level with relative weight of carrying amount of the account in the cohort. Weighted Average EIS for Collective Assessment Rule is used for this. k. EIR or EIS value is updated in the cash flow table. This is done using EIR_EIS_Update DT. l. Benchmark interest rate is populated till the highest maturity for all distinct benchmark curves mapped to accounts and risk free rate for all distinct currencies. m. Benchmark rate is interpolated and updated. If benchmark rate is not available for the specified period then it is interpolated using either linear, cubic, and quadratic interpolation method as selected in Run execution parameters. n. Discounted rate used in the EL method for discounting future cash flows is EIR as on inception for fixed interest rate assets and EIS as on account origination added to benchmark rate for variable rate assets. This is assigned using the Rule Periodic Discount Rate calculation. o. Calculate discounting factor using discounting rate assigned as above. This is done using Periodic Discount Factor Calculation rule. p. Present value of expected cash flow is calculated by multiplying cash flow with discounting factor. Expected Cash Flow Present Value Calculation Rule does this task. 14. Amortized cost of an account is calculated as sum of present value of expected cash flow of the account. Amortized cost calculation for individual assessment rule is used for this. Oracle Financial Services Software Confidential-Restricted 16 User Guide: Oracle Financial Services Loan Loss Forecasting and Provisioning, Release 1.5.0.0.0 15. Amortized cost of a cohort is calculated as sum of present value of expected cash flow from the cohort. Amortized cost calculation for collective assessment rule is used for this. 16. Net charge-off is calculated using Net Charge off Calculation Rule that subtracts cumulative recovery from gross charge-off. This is done for all product types. 17. Net charge-off rate is calculated from net charge-off as proportion of carrying amount. Net Charge-off Rate Calculation Rule is used for this. 18. Allowance is calculated as difference between carrying amount and amortized cost. Allowance calculation using Amortized Cost - Individual Assessment rule is used for this. 19. For collectively assessed exposure allowance is calculated at cohort level as difference between carrying amount and amortized cost of the cohort. This is done using the allowance calculation using Amortized Cost - Collective Assessment 20. In Collective assessment, amortized cost, and allowance is calculated at cohort level and then apportioned to account level as per allocation factor. Allocation factor is calculated as per proportion of carrying amount of an account in the cohort. This is done using Allowance Allocation Factor Calculation Rule. To allocate cohort level amortized cost back to the account level as per allocation factor Collectively Assessed Exposure Amortized Cost Calculation Rule is used. To allocate cohort level allowance back as per allocation factor Collectively Assessed Exposure Allowance Allocation Rule is used. 21. Allowance is capped to carrying amount using Reporting Allowance Calculation Rule which takes maximum and minimum of carrying amount and calculated allowance. Allowance amount threshold check, is applicable for all the methods in EL run. Threshold is checked against sum of allowance across accounts for a customer and product type combination. Product type is one of the source hierarchies in method selection. Ensure that underlying accounts have undergone the same provision calculation method. Eligible Allowance amount for the underlying accounts is considered as 0 if the sum total of allowance of its account-set, at which threshold was checked, is less than or equal to the given threshold. Eligible Allowance is same as the allowance, if sum total of allowance of its accountset, at which threshold was checked, is greater than the given threshold. Threshold amount is assigned through rule at Legal Entity, Product type and Reporting Currency level. Provision Matrix Method All exposures under Provision Matrix method will be individually assessed. Collective Assessment approach is not applicable for Provision Matrix method. Provision rate may vary based on rating and delinquency days across various counterparties, products, or impairment statuses. Hence, Provision Matrix is assigned based on the following parameters: Impairment Status Customer Type Product. Provision Matrix Assignment Rule is used for mapping provision Matrix. The parameters required for provision matrix assignment are source hierarchies in the Rule. Applicable provision rate from Provision Matrix is assigned to an account based on its rating or delinquency band using Provision Rate Assignment Rule. Amortized cost is calculated using provision rate as Oracle Financial Services Software Confidential-Restricted 17 User Guide: Oracle Financial Services Loan Loss Forecasting and Provisioning, Release 1.5.0.0.0 Amortized cost = Carrying amount * (1 -Provision rate). Allowance is calculated as difference between carrying amount and amortized cost. NOTE: Each method calculates allowance amount as of FIC_MIS _Date. Recovery Rate Method Based on method selection criteria, that is, which has the impairment status as Y across products and customers, Recovery rate method is followed. Recovery rate method requires discounting of recovery amount till average recovery period based on type of interest rate. Recovery amount at the time of recovery are discounted using IRR for fixed interest rate assets. For variable interest rate assets, discount rate is original contractual spread added to interpolated benchmark rates. This is done using type 3 rule Discount Factor Calculation. NOTE: Average Recovery period can be given in number of days, months or years. Amortized cost for Recovery Rate method is the product of carrying amount, recovery rate (1-LGD) and discounting factor. It is calculated using Amortized Cost Calculation - Impaired Assets. Allowance is calculated as difference between carrying amount and amortized cost. Collateral Value Based (CVB) Method Collateral Value Based (CVB) Method is used for retail customer of mortgage portfolio. CVB Method is expected to be used to calculate allowance for retail assets. The CVB method is calculated as follows: 1. If the provision calculation method is CVB, then the following is computed: Collateral Value for each collateral Carrying amount and Recovery cost at the account level Account to collateral mapping 2. The Carrying Amount, Recovery Cost, and Collateral Value are converted to Reporting Currency. 3. The Shortfall (RCY) at customer and product type level is calculated as follows: Shortfall = - [∑Collateral value – (∑Carrying amount + ∑Recovery costs)] 4. If Shortfall > Threshold, an account with the same customer and product type and which has the highest carrying amount to which shortfall is not allocated is considered. Account level EoP Allowance (RCY) = Minimum (balance eligible shortfall, carrying amount) 5. If the customer does not have another account with the same product type, then the account level EoP Allowance is converted to the natural currency. Eligible Allowance = Min (EoP Allowance, Carrying amount) in NCY. 6. Provision is then calculated and converted eligible allowance and Provision Value to Reporting Currency. Net- Charge off Calculation Net charge-off is calculated using Net Charge off Calculation Rule that subtracts cumulative recovery from gross charge-off. This is done for all product types. Net charge-off rate is calculated from net charge-off as proportion of carrying amount. Net Charge-off Rate Calculation Rule is used for this. Oracle Financial Services Software Confidential-Restricted 18 User Guide: Oracle Financial Services Loan Loss Forecasting and Provisioning, Release 1.5.0.0.0 Provision Amount Calculation Provision is calculated as a difference between allowance of current period and allowance of previous period. The provision calculation is based on f_Chargeoff_Materiality_Flag. If the flag is “Y”, then the provision calculation formula will be = Allowance (t) – (Allowance(t-1)-Netchargeoff). If the flag is “N”, the provision calculation formula will be = Allowance (t) – Allowance (t-1). Provision is calculated using Provision Calculation rule. Currency Conversion Allowance, Provision and other reporting measures are converted to reporting currency using Key_Measure_RCY_Conv task. Please note that exchange rate will be applied as defined in STG_FORWARD_EXCHG_RATES table for the respective MIS date or earliest rate available till previous five days of the pre-defined source. Source of currency conversion rate should be given at Legal Entity level in V_ATTRIBUTE_ASSIGN_VALUE column of STG_LEGAL_ENTITY_ATTR_INTF table with corresponding parameter in V_ATTRIBUTE_VARCHAR_LABEL as “FX_SRC”. Cohort level provision is updated for reporting purpose using Cohort_Provision DT. 3.1.2. Incurred Loss (IL) Approach IL Approach consists of the following major business processes: Basic Procedure Forward Exposure Method Provision Matrix Method Recovery Rate Method Net Charge Off Calculation Provision Calculation Currency Conversion Basic Procedure The basic procedure is as follows: 1. Load the setup data and run data as mentioned in chapter 4 “Preparing for Execution”. 2. Basel reclassification rule is used to map Bank’s customer type and product type to Basel Customer Type and Basel Product Type respectively. It is used for reporting purpose. This is done using the following reclassification rules: 3. Basel Customer Type Re-classification Basel Product Type Re-classification Basel Asset Class Re-classification Methodology is selected based on following source hierarchies: Product Type Customer Type Oracle Financial Services Software Confidential-Restricted 19 User Guide: Oracle Financial Services Loan Loss Forecasting and Provisioning, Release 1.5.0.0.0 Impairment status Forward exposure method is mapped using the rule Provision Calculation Methodology Selection - IL Run to the following Source: (Non-Impaired Asset AND Insurance companies AND Product) OR (Non-Impaired Asset AND Corporate - Small AND Product) OR (Non-Impaired Asset AND Corporate Medium AND Product) OR (Non-Impaired Asset AND Corporate - Large AND Product) OR (Non-Impaired Asset AND Banks AND Product) 4. Setting Charge-off materiality: If Gross charge-off is greater than the charge-off materiality threshold then its net charge-off is adjusted from the calculated provision amount. In the preconfigured run, charge-off materiality threshold amount is 500. This is done using Charge-off Materiality Assignment rule. Charge-off materiality is also used to identify accounts for collective assessment treatment. Materially charged-off accounts are not considered for collective assessment. Cash Flow Based Forward Exposure Method The process for computing Forward Exposure Method is as follows: 1. Classify the accounts to be treated collectively using Collective Assessment Assignment Rule: To improve the overall efficiency of the process to generate cash flows using Oracle Cash Flow Engine (CFE) Accounts having similar characteristics are grouped together to form a cohort. Typically, all retail customers having non-impaired accounts can be assessed collectively to calculate provision. 2. Populate contractual cash flows for each account to be treated under Forward Exposure Method using T2T rule. This includes populating principal component and interest component for each cash flow date. 3. Assign Transition Matrix: Transition matrix is assigned based on the following parameters: Customer Type Currency Product Accordingly, rating, and delinquency based transition matrix data is populated for Poisson processing. This is done using the T2T RATING_TRANSITION_MATRIX_POPULATION and DPD_TRANSITION_MATRIX_POPULATION. 4. Each rating scale or delinquency band scale has a default grade state, which indicates defaulted accounts. Allowance amount is a function of transition probability to default or impairment. To calculate allowance, you may keep the impaired state the same as default grade scale or assign some other impaired state depending on the credit policy or outlook. 5. Transition probability for credit rating grade of impaired state rating and below will be accumulated and considered for Lamda calculation for Poisson process .It is done using Cumlt_Impaired_Prob_Calc DT. 6. Similarly, assign impaired state delinquency band. 7. Poisson process is executed to arrive at a monthly transition probability. You can change Monthly to Quarterly or Yearly by setting it up in the Reveleus_Parameter_Master Table by changing LLF&PBUCKETLENGTH. Oracle Financial Services Software Confidential-Restricted 20 User Guide: Oracle Financial Services Loan Loss Forecasting and Provisioning, Release 1.5.0.0.0 NOTE: Frequency period of the input transition matrix should be greater than that of bucket length. For example: input transition matrix cannot be Monthly and LLF&PBUCKETLENGTH be Quarterly. In this case, all transition matrices should have a frequency period of at least quarterly and more. 8. Accounts to be assessed and treated collectively are identified based on their credit rating, delinquency band, customer type, start date, interest rate, cash flow pattern and other such characteristics that can affect cash flow amount. Cohort is formed according to such data. Cohort_Identification DT is used to achieve this. 9. After identifying such cohorts, data pertaining to accounts forming a cohort is aggregated for collective treatment. This is done using T2T rule COHORT_DATA_POPULATION. Following parameters are calculated at cohort level with relative weight of carrying amount of the account in the cohort: Emergence Period LGD CCF For an account or at a cohort level (if account is part of cohort) following steps are performed to calculate allowance: 1. Pre cash flow validation- This is to validate input data to CFE. All errors are logged in FIC_DTDQ_MESSAGE_LOG with value of the column V_MAIN_PROG_NAME as FN_DT_PRE_CF_VALIDATIONS. All values need to be picked up for the current batch. 2. Generate cash flow and calculate principal and interest component of cash flow amount. Errors thrown by CFE are logged in FSI_OPS_ERROR_DETAILS. 3. Periodic Cumulative Loss Rate is calculated by multiplying LGD with cumulative impaired transition probability using a rule. 4. Expected cash flow rate is derived from cumulative loss rate using a rule. 5. Expected cash flow amount is calculated using cash flow amount and expected cash flow rate calculated earlier. 6. Benchmark interest rate is populated till highest maturity for all distinct benchmark curves mapped to accounts and risk free rate for all distinct currencies. Interpolate benchmark rate and update interpolated benchmark rate. If benchmark rate is not available for the specified period then it is interpolated using either linear, cubic and quadratic interpolation method as selected in the Run execution parameter 7. Calculate Exposure at Default for revolving and non-revolving exposure: Value in Revolving Exposure Indicator will determine the nature of exposure. a. For Non-revolving Lines it is done using a DT EAD_Non_Revolving_Lines. It updates EAD for non-revolving exposures and undrawn amount for revolving exposure. b. For revolving lines, it is done using a type 3 rule – Exposure at Default Calculation Revolving Lines. It is calculated as Principal Run-off + (Undrawn Amount * Credit Conversion Factor). 8. Expected loss amount is calculated up to the emergence period: Expected Loss is the product of Exposure at Default and Periodic Cumulative Loss rate. It is calculated by a type 3 rule Expected Loss Calculation. 9. Discounting rate used in Forward Exposure Method for discounting future cash flow is risk free rate: This is assigned using a rule Periodic Discount Rate Calculation. Oracle Financial Services Software Confidential-Restricted 21 User Guide: Oracle Financial Services Loan Loss Forecasting and Provisioning, Release 1.5.0.0.0 10. Calculate discounting factor using risk free rate: This is done using Periodic Discount Factor Calculation rule. 11. Present value of Expected Loss is calculated by discounting each cash flow with the discounting rate. This is done by multiplying cash flow with discounting factor. Loss Amount Present Value Calculation rule does this task. 12. Allowance as of date is calculated as sum of Present value of Expected Loss Amount at account level. This is done using a type 3 rule allowance calculation using Forward Expected Loss Individual Assessment. 13. For collectively assessed exposure allowance is calculated at cohort level and then apportioned to account level as per allocation factor. a. Allowance is calculated at a cohort level as sum of Present value of Expected Loss Amount. This is done using type 3 rule Allowance calculation using Forward Expected Loss - Collective Assessment. b. Allocation factor is calculated as per proportion of carrying amount of an account in the cohort. This is done using Allowance Allocation Factor Calculation rule. c. To allocate cohort level allowance back as per allocation factor Collectively Assessed Exposure Allowance Allocation rule is used. 14. Allowance is capped to carrying amount using Reporting Allowance Calculation rule which takes maximum minimum of carrying amount and calculated allowance. NOTE: Each method calculates allowance amount as of FIC_MIS _Date Provision Matrix Method Refer to Provision Matrix method explained in EL Approach. Recovery Rate Method Refer to Recovery Rate Method explained in EL Approach. Net- Charge off Calculation Refer to Net-Charge off Calculation explained in EL Approach Provision Amount Calculation Refer to Provision Calculation explained in EL Approach Currency Conversion Refer to Currency Conversion explained in EL Approach 3.1.3. Historical Transition Matrices (HTM) Keeping an eye on the set of exposures where these transition matrices are used, different granularities of data are used to generate different historical transition matrices. They represent the institution’s experience. In this calculation: The sum of all transitions is one, thus maintaining unity constraint, Oracle Financial Services Software Confidential-Restricted 22 User Guide: Oracle Financial Services Loan Loss Forecasting and Provisioning, Release 1.5.0.0.0 New and closed accounts are excluded. NOTE New accounts are those which are not available in the last data point whereas they are available in the current data point. The concept of closed account is the exact opposite of new account. Denominator is the base of the previous period. This means either the total number of accounts or the sum of carrying cost is used as the denominator which belongs to the previous period. At every instance, transition matrix from one period to another is calculated. For multi-period transition matrix, one needs to execute multiple times. Once the institution has this set ready, it needs to predict or forecast the transition matrix for future years. These predicted transition matrices are used in the LLF&P application. For more information on the predicted or forecasted transition matrix, see the LLF&P Application User Manual. Identifying Default State A default state is to be identified which can be a helpful tool to tweak the probability, without substantial changes like changing the matrix itself. Thus, with the account status remaining the same, it is the probability of default that gets altered. You can use different combinations for different granularities. For example shown below, we have two choices: Credit grade D can be the default state in which case no additional calculation is required. If you define everything beyond B as the default state then the above matrix reduces to the following: One-year rating transition probability matrix (Horizontal: New, Vertical: Existing) Rating Aaa Aa A Baa Ba Default Probability Aaa 88% 10% 1% 1% 0% 0%+0%+0% = 0% Aa 1% 89% 10% 0% 0% 0%+0%+0% = 0% A 0% 3% 90% 6% 1% 0%+0%+0% = 0% Baa 0% 0% 7% 85% 6% 1%+1%+0% =2% Ba 0% 0% 1% 6% 80% 8%+4%+1% = 13% B 0% 0% 0% 1% 7% 83%+2%+7% = 92% Caa 0% 0% 1% 1% 3% 6%+63%+26% = 95% One-year rating transition probability matrix (Example) Oracle Financial Services Software Confidential-Restricted 23 User Guide: Oracle Financial Services Loan Loss Forecasting and Provisioning, Release 1.5.0.0.0 3.2. Loss Forecasting Apart from calculating the provision (by EL and IL approach), Oracle Financial Services Loan Loss Forecasting and Provisioning, forecasts the losses by using ratings or days-past-due matrices based on the number of customers or total amount of exposures across product types. Loss forecast component doesn’t report the losses for the future period; instead it predicts the status of the exposure count or exposure amount. For example: For the current period if the total exposure value at a given product type is 3000 and the forecasted PD for period 1 is 10%, then the loss forecasted value would be 300, than 2700. The user input matrices would differ in their frequency ranging from a month to one year. The forecasted period is based on the least available frequency to: five (5) periods in case of rating based and twenty four (24) periods in case of days-past-due (DPD) based. Loss forecasting procedure is computed as follows: 1. Determination of Min Frequency: Minimum frequency period of the matrices for both rating based and days-past-due based is used as an input for Poisson process, to bring down all the other matrices to the common platform of frequency. For example: For a given set of exposures if the matrix frequency period ranges from Monthly, Quarterly, Half-yearly to Yearly, the minimum frequency period of all the matrices available (monthly) will be used as a base frequency for the other matrices to undergo Poisson process. The forecasting is done for five (5) months in case of rating based and twenty four (24) months in case of DPD based (excluding current period). 2. Loss forecast for Current Period: For current period values, the LLF&P application will just populate the summation of the values on the given dimension. This will not need any matrix intervention. Normally, loss forecast is done on pre-determined dimensions like product type, product, asset class and so on. Hence, while reporting the current period; LLF&P will sum up the values across the selected dimensions for both exposure count and exposure amount level. 3. Poisson Parameter: The Poisson process is initiated after successful assignment of Individual exposures undergoing Expected Loss or Incurred Loss approach to transition matrix. The matrix is assigned based on predetermined dimensions (Customer type, product type and currency). All the matrices irrespective of the frequency applicability will undergo Poisson parameter. Poisson Parameter = 1-exp (-Φ) = λ; where Φ = the probability of default values for a given period. 4. Calculation of Probability of Defaults: The default values for the forecasted period (5 periods / 24 periods) are loaded by using time homogeneous and time-non-homogeneous matrices. For those matrices with variant frequency, the Poisson process of decomposition is used to trickle down the matrices to a common platform of frequency and then loaded for the respective periods. 5. Customer count & Exposure amount: LLF&P application supports the forecast based on the customer count and exposure amount. Under the given dimensions (Product type, Geography, and so on) the sum of exposures or amount of exposures are multiplied with the corresponding default values. For the second consecutive period, the output of the first period is multiplied with the corresponding default values and so on. Oracle Financial Services Software Confidential-Restricted 24 User Guide: Oracle Financial Services Loan Loss Forecasting and Provisioning, Release 1.5.0.0.0 4. Preparing for Execution The main objective of this chapter is for you to get familiarized with the various requirements of LLF&P before data execution. This chapter is classified into the following: Data Requirements Important Metadata Definition 4.1. Data Requirements The most important activity, to commence working on the LLF&P Application, is configuration of data into the application. Data can be divided into the following categories: Master Data or Dimension Data: This set of data includes the following: Slowly Changing Dimension (SCD) data: It is a set of Dimension tables wherein data changes by a small amount regularly over a period of time. Following SCD tables are used in LLF&P: stage customer type master stage geography master dim organization structure NOTE: To work with OBP interface, dim_org_structure needs to be updated directly based on records in stg_legal_entity_master. Dim data population batch does not update dim_org_structure from stg_legal_entity_master. stage industry master stage IRCS stage LOB master stage market variables master stage product master stage mitigant master or stage collateral master NOTE: For EL-OBP interface, collateral specific tables are used. For EL run, Mitigant related tables are used. Setup Data: Setup Data is a static data and does not change at regular intervals. List of setup data tables is provided in Seeded Data Tables sheet in the attached Download Specification. For more information, refer to the Download Specification (DL Specs) document. Fact Data: Fact Data can be populated in either the Product Processors or Other Stage tables as follows: Product Processor: is an entity in the LLF&P Application which stores data from the Operational Systems of the Bank. This entity is created based on the various financial products that the bank caters to. Stage tables for Product Processors have been categorized as Exposures data of Product Processors. The Product Processor tables have been represented in the following tables: stage cards stage investments stage loan contracts stage over draft accounts Oracle Financial Services Software Confidential-Restricted 25 User Guide: Oracle Financial Services Loan Loss Forecasting and Provisioning, Release 1.5.0.0.0 Others: In addition to Product Processors, there are other stage tables which are used to store customer and account attributes as represented in the following tables: stage customer details stage customer master stage issuer master NOTE: Issuer data is also expected to be in customer master table for customer reclassification purpose and to get customer specific attribute in method selection rule. stage party rating details stage account cash flows stage account inception rates stage forward exchange rates stage irc rate history stage market variables stage dpd transition matrix stage provision matrix stage rating transition matrix stage mitigants or stg collaterals stage account mitigant map or STG EXP MITIGANT MAPPINGS NOTE: For EL-OBP interface, collateral specific tables are used. For EL run, Mitigant related tables are used. NOTE: Transition Matrix should be complete, that is, all rating or delinquency bands should be there. Square Matrix, that is, source and destination rating or DPD band should be equal. Transition frequency unit should be consistent across time periods, that is, if it is yearly transition matrix given for 2 periods then it should be 2 yearly transition matrices. Any other combination, like, 1 year and 4 quarters and so on, is not valid Transition Matrix should be available for a continuous time period starting from period 1, that is, if transition matrix is available for 3 years then it should be for first three consecutive years. In case of external rating transition matrix, rating source and external to internal mapping is mandatory. For more information on the list of columns and tables to be populated within each table, refer to the Download Specifications document. After data population to stage and setup table, follow the Run Chart 4.2. Important Metadata Definition Rating Re-classification: It populates rating data and reclassifies external rating to internal rating. Data population is done Oracle Financial Services Software Confidential-Restricted 26 User Guide: Oracle Financial Services Loan Loss Forecasting and Provisioning, Release 1.5.0.0.0 using T2T and reclassification is done using a Type 2 rule External Rating to Internal Rating Re-classification. Current Application supports only 1-1 mapping of External Rating to Internal Rating. This rule is expected to be reviewed and customized based on internal rating and mapping strategy of the bank. NOTE: As each rating has its unique characteristics, it is required to map each external rating to a unique internal rating. Market Data Population: It populates Interest Rate data and Exchange Rate data using T2T IRC_DATA_POPULATION and EXCHANGE_RATE_DATA_POPULATION respectively. Runskey marked as -1 will the actual history data. For each run, data from -1 will be populated with execution runskey in the same table. Approach Setting: The Rules associated with this task are: Provision Calculation Methodology Selection - EL Run Provision Calculation Methodology Selection - IL Run As mentioned earlier, Allowance can be calculated using Cash-Flow method or Provision Matrix Method. In case of Cash-flow based method, impaired assets needs to be treated based on recovery rate method whereas non-impaired can be treated with the projected cash flow and EIR or EIS in expected loss approach or with risk free rate in incurred loss approach. Provision Matrix method assigns provision rate to an account based on rating or delinquency band as per mapping. To select the treatment, each account is mapped to an approach based on following criteria: Impairment Status Customer Type Product This rule is expected to be reviewed and customized based on data and mapping strategy of the bank. Transition Matrix Mapping: The Rules associated with this task are: Transition Matrix Assignment: In EL approach, future cash flows need to be adjusted with the probability of transition to impaired state. Transition probability is calculated based on Predicted transition matrix and converted to suitable frequency using Poison process. Largely, Transition Probability may vary depending on the currency of exposure, product and customer type of the account. In the preconfigured run, transition matrix is mapped with following source hierarchy: Currency Customer Type Product This rule is expected to be reviewed and customized based on data and mapping strategy of the bank. Oracle Financial Services Software Confidential-Restricted 27 User Guide: Oracle Financial Services Loan Loss Forecasting and Provisioning, Release 1.5.0.0.0 Provision Matrix Mapping: The Rules associated with this task are: Provision Matrix Assignment Accounts for which cash flow cannot be predicted, or not available, can be treated with provision matrix method wherein provision rate is assigned to an account based on its rating or delinquency days or both. If Provision Matrix given is only rating-based then delinquency band given at account level, if any, is ignored and vice-versa for delinquency-based matrix. Provision rate for the accounts having same rating or delinquency band may vary across products, customer type or impairment status. Hence, Provision Matrix is mapped based on following criteria: Impairment Status Customer Type Product This rule is expected to be reviewed and customized based on data and mapping strategy of the bank. Basel Re-classification: The Rules associated with this task are: Basel Customer Type Re-classification Basel Product Type Re-classification Basel Asset Class Re-classification For regulatory reporting and consolidation purpose, bank product and customer needs to be reclassified to Basel product type and Basel customer type respectively. In addition, Basel customer type and Basel Product Type are reclassified to Basel Asset class for future purpose of regulatory capital calculation and reporting. This rule is expected to be reviewed and customized based on data and mapping strategy of the bank. Impaired State Identification: The Rules associated with this task are: Rating Impairment State Assignment DPD Impairment State Assignment To allocate probability of transition to impairment for an account, impairment state should be identified. Transition probability of rating identified as impaired state and below will be aggregated to be counted as impairment probability. Impaired state may vary depending on the various factors of an account. In pre-configured rule, impaired state is identified based on the following: Currency Customer Type Product Oracle Financial Services Software Confidential-Restricted 28 User Guide: Oracle Financial Services Loan Loss Forecasting and Provisioning, Release 1.5.0.0.0 This rule is expected to be reviewed and customized based on bank’s strategy to identify the impaired / default state Collective Assessment: The Rules associated with this task are: Collective Assessment Assignment Rule Cohort_Identification DT To improve overall process efficiency to generate cash flow, accounts having similar characteristics – typically small in value and large in volume accounts like retail accounts – are grouped together to form a cohort. Cash flow and allowance is then, calculated at cohort level. Amortized cost and allowance calculated at cohort level is allocated back to account level based on allocation factor of an account. Allocation factor is typically carrying amount of an account in the cohort. Gross Charge-off Threshold: The Rules associated with this task are: Charge-off Materiality Assignment This rule sets materiality flag based on for gross charge-off amount to be considered for Provision calculation. Oracle Financial Services Software Confidential-Restricted 29 User Guide: Oracle Financial Services Loan Loss Forecasting and Provisioning, Release 1.5.0.0.0 5. Execution The main objective of this chapter is for you to get familiarized with the data execution process. This chapter is classified into the following: Data Quality Framework Run Management 5.1. Data Quality Framework Data from stage table is checked for quality of data. Any erroneous data that is not processed and are reported in log file. SCD is executed in following order: 1. DIMENSION_DATA_POPULATION 2. MARKET_DATA_POPULATION 3. ACCOUNT_DATA_POPULATION 4. MITAGANT_MAP_DATA_POPULATION 5. SEMI_STATIC_DATA_POPULATION There is one base run each for EL and IL approach of LLF&P. Provision Matrix method and Recovery Rate method are part of both the Runs. In EL run, an account can be mapped to either of the EL, Provision Matrix or Recovery Rate method. Similarly, in IL run, an account can be mapped to either of IL, Provision Matrix or Recovery Rate method. Output Table Population batch is used to populate provision amount to fct_llfp_output table for OBP-CSA interface to fetch the output data. NOTE: Hierarchies need to be resaved after the DIMENSION_DATA_POPULATION batch execution. 5.2. Run Management The Run Management framework is a unique feature of the LLF&P which enables a business user - without assistance from a technical analyst - to easily define and execute a Run. The features of this framework are as follows: Displays all the Runs. Provides details of the Run. Parameters can be entered at the Run Level. The Existing Parameter values can be edited and there is an option to create and execute a batch. The Execution Summary page provides the selected Run Execution details, for each execution there is an option to check the following: Parameters defined. Copy option to copy the parameters of the execution selected. Option to trigger batch Refer to the following steps to navigate to the Run Management Screen: 1. Click Risk Application on the Left Hand Side (LHS) pane of the OFSAAI. Oracle Financial Services Software Confidential-Restricted 30 User Guide: Oracle Financial Services Loan Loss Forecasting and Provisioning, Release 1.5.0.0.0 2. Click Loan Loss Forecasting & Provisioning under Run Execution to open Run Management screen. 3. Click Run Management on LHS pane to open Run Management Summary screen. 5.2.1. Run Management UI Icons The following table aims to familiarize you with the common icons available in the Run Management UI: Button Name Pagination Options View Run Default Parameters Run Execution Parameters Add Run Execution Summary Icon Copy Execute Description Helps in navigating from one page to another Helps to view details of a particular Run Click this icon to allow you to update the Run Default Parameters Click this icon to allow you to update the Run Execution Parameters Helps in adding a hierarchy Helps in viewing the Run Execution details Click this icon to display the Run Execution Parameters window to modify or create a batch Click to execute a Run 5.2.2. Displaying a Run Run Management Summary The Run management Summary screen displays the list of runs defined in the PR2, except the Immediate Execution Option Yes in the grid. It provides the following details of the run: Run name Run Type Created By Creation Date Last Modification By Last Modification Date The Search Panel has a provision to search, based on Segment, Run Name, and Run Type. Search Panel Oracle Financial Services Software Confidential-Restricted 31 User Guide: Oracle Financial Services Loan Loss Forecasting and Provisioning, Release 1.5.0.0.0 Run Management Summary Screen You can see the complete list of Runs with the help of pagination by navigating from one page to another by clicking the (Next) (Previous) icons. By clicking the (No Records) icon, you can provide the number of records to be displayed per page or on the bar. You can also sort the records to view it in convenient way. View a Run You can view individual Run details at any given point. Ensure that the Modify Run Parameters role is mapped to the user profile. To view the existing Run details: 1. Select the checkbox adjacent to the required Run. 2. Click the View icon from the navigation bar. The window displays the details of the Run and the details relating to the underlying processes and the rules if any. Oracle Financial Services Software Confidential-Restricted 32 User Guide: Oracle Financial Services Loan Loss Forecasting and Provisioning, Release 1.5.0.0.0 View details 5.2.3. Modifying a Run Run Parameters Run Parameter window allows you to enter and save the Run level parameters. To input the run level parameters: 1. Select the checkbox adjacent to the required Run. 2. Click the icon from the navigation bar. The Run Parameters window is displayed, where you can view and input Run level parameters related to the corresponding Run. You can add or modify the parameter values and store the same. NOTE: To modify or view the parameters, the Modify Run Parameters role should be mapped to your user profile. The following parameters are to be updated: Field Legal Entity Description The accounts of the selected legal entity and its child entity (depending on the consolidation type selected), is processed to calculate provision. Parent-child relationship between Legal Entity will be as defined in DIM_ORG_STRUCTURE table. Consolidation Type This field is read in conjunction with the Legal Entity field. It is a dropdown box and the value could be Solo or Consolidated. Select Oracle Financial Services Software Confidential-Restricted 33 User Guide: Oracle Financial Services Loan Loss Forecasting and Provisioning, Release 1.5.0.0.0 Field Reporting Currency Description Solo if you want to process direct accounts of the legal entity and not that of its child entities. Select Consolidated if you want to process all the accounts under the legal entity and its child entities. In case of Consolidated, all intra-group exposures are excluded. You can define reporting currency by selecting one in this field. Allowance threshold is based on reporting currency. NOTE: The exchange rate is applied as defined in STG_FORWARD_EXCHG_RATES table for the respective MIS date or earliest rate available till previous five days of the pre-defined source. Run Parameters Screen Run Execution Parameters In addition to the Run Default parameters, Run Execution Parameter window allows you to enter and save the Run execution parameters. By clicking the button, a batch with the entered Run execution parameters is created. The batch created can be executed by clicking Oracle Financial Services Software Confidential-Restricted 34 User Guide: Oracle Financial Services Loan Loss Forecasting and Provisioning, Release 1.5.0.0.0 button. To execute a Run, ensure that the Execute Run role is mapped to the user profile. To input the Run execution parameters: 1. Select the checkbox adjacent to the required Run. 2. Click the icon from the navigation bar. The following Run execution parameters are to be updated: Field Legal Entity Description Default Legal Entity set for the Run (as mentioned in Default Parameters for Run) can be changed for the specific execution. The accounts of the selected legal entity and its child entity (depending on the consolidation type selected) are processed to calculate provision. Parent-child relationship between legal entities will be as defined in DIM_ORG_STRUCTURE table. Consolidation Type Default Consolidation Type set for the Run (as mentioned in Default Parameters for Run) can be changed for the specific execution. This field is read in conjunction with Legal Entity field. It is a dropdown list and the value could be Solo or Consolidated. Select Solo if you want to process direct accounts of the Legal entity and not that of its child entities. Select Consolidated if you want to process all the accounts under the Legal Entity and its child entities. In case of Consolidated, all intra-group exposures are excluded. Reporting Currency You can define reporting currency by selecting one in this field. NOTE: Exchange rate will be applied as defined in STG_FORWARD_EXCHG_RATES table for the respective MIS date or earliest rate available till previous five days of the pre-defined source. Default value displayed for Legal Entity, consolidation Type and Reporting Currency is as set in Run Default Parameter. Bucket Conversion For discounting purposes, the LLF&P application works on monthly bucketing. Here, month is representative of 30 days bucket. All the cash flows falling in a given bucket will be discounted by the same interest rate as selected in the Time Convention. Similarly, for variable rate cash flows spot rate is required to discount. You can select one of the three time conventions namely Beginning of Bucket Mid of Bucket End of Bucket If you select Beginning of Bucket, it means benchmark interest rate as of first day of month will be used as the discount rate. Similarly mid means middle of month and end means end of month. The beginning, mid, and end are referred to bucket-period and not calendar month. Interpolation Method If the exact interest rate is not available for the period of cash flow, then the applicable needs to be calculated as by interpolating from the Oracle Financial Services Software Confidential-Restricted 35 User Guide: Oracle Financial Services Loan Loss Forecasting and Provisioning, Release 1.5.0.0.0 Field FIC_MIS_DATE Run Execution Description Description available interest rate. The method to be used for interpolation can be selected from this dropdown box. Methods available in pre-configured Run are Linear Quartic Cubic Spline Date as-on which data should be picked and processed. The date can be selected from the calendar (icon). This is to describe a Run in detail. It is an optional parameter. Run Execution Parameters Screen Oracle Financial Services Software Confidential-Restricted 36 User Guide: Oracle Financial Services Loan Loss Forecasting and Provisioning, Release 1.5.0.0.0 5.2.4. Executing a Run Run Execution Summary To execute a Run: 1. Select the checkbox adjacent to the required Run. 2. Click the icon from the navigation bar. The Run Execution Summary screen is displayed. The screen has two panels. Run Details Run Execution Details The Run Details panel displays the following: Run Name Run Type Run ID The Run Execution Details displays the following: Run Skey Run Execution Id FIC MIS DATE Execution Status Execution Date Time of Execution Reporting Flag Oracle Financial Services Software Confidential-Restricted 37 User Guide: Oracle Financial Services Loan Loss Forecasting and Provisioning, Release 1.5.0.0.0 Run Execution Summary Screen To View the Parameter details: 1. Select the checkbox adjacent to the required Run. 2. Click the icon from the navigation bar. The parameter details are displayed. To Copy the Parameter: 1. Select the checkbox adjacent to the required Run. 2. Click the icon from the navigation bar. The Run Execution Parameter window appears. The parameters are populated as the selected execution and it can be modified or can create a batch and execute the same. Oracle Financial Services Software Confidential-Restricted 38 User Guide: Oracle Financial Services Loan Loss Forecasting and Provisioning, Release 1.5.0.0.0 Run Execution Parameters To Execute the Parameter: 1. Select the checkbox adjacent to the required Run. 2. Click the icon from the navigation bar. The status of the triggered batch is displayed. In the execution summary screen multiple selections of the execution ids is available to trigger a batch. Batch triggered dialog box Oracle Financial Services Software Confidential-Restricted 39 User Guide: Oracle Financial Services Loan Loss Forecasting and Provisioning, Release 1.5.0.0.0 5.2.5. Database Design Logical Data Model Data model for Run Management consists of Run Management UI Tables and Rules Framework tables. Storage for Run Management is as follows: The definition is stored in the Run Management UI tables. The data is later inserted into the PR2 batch group tables. Run Management UI tables are listed in the following tables: Run Management Data Model.xlsx Setup Tables The following Setup tables are used in the Run Management framework is as follows: Run_Parameter_Details table: V_SEGMENT_CODE: Stores the segment codes. V_PARAM_ID: Stores the parameter id of the parameters used in the default parameter screen. V_PARAM_DESC: Stores the description of the parameters. V_PARAM_TYPE: Stores the information on the parameter type. The type can be HIER for Hierarchy, LIST for dropdown, TEXT for input, RADIO for radio button, CALENDAR for calendar. F_IS_MANDATORY: Stores the information whether the parameter is mandatory or not. N_DISPLAY_ORDER: Specifies the order in which the parameters need to appear in the screen. F_IS_DEFAULT_PARAM: Specifies if the parameter is default or not. F_NODE_SELECTION: Specifies if the hierarchy selection is single level or multi level. V_RUN_TYPE: Specifies the type of run. BR for Baseline Run, SR for Simulation Run, ST for Stress Run. F_IS_LEBASED: Specifies that the run is LE based. Run_Parameters_Lov Table: V_SEGMENT_CODE: Stores the segment codes. V_PARAM_ID: Stores the parameter id of the parameters used in the default parameter screen. V_PARAM_VALUE_CODE: Stores the code of the list of values to be displayed. V_PARAM_VALUE_DESC: Stores the description of the list of values to be displayed. N_DISPLAY_ORDER: Specifies the order in which the parameters need to appear in the screen Oracle Financial Services Software Confidential-Restricted 40 User Guide: Oracle Financial Services Loan Loss Forecasting and Provisioning, Release 1.5.0.0.0 V_RUN_TYPE: Specifies the type of Run. BR for Baseline Run, SR for Simulation Run, ST for Stress Run. 5.2.6. Processed Data Maintenance Batch The LLF&P application can reuse previously calculated EIR or EIS and cash flow values using Processed Data Maintenance Batch. This batch is an ICC batch and requires previous run skey as parameter from which data needs to be fetched for future use. Primarily, it performs following tasks: Inception Rates Maintenance: It makes EIR and EIS calculated by previous Run available for the subsequent Run. Run skey of the Run from which the value should be taken is given as property value of ‘parameter list’ in Task definition as ‘$RUNSK=Run skey’. This can be updated from Batch Maintenance. Stage Cash Flow Population: This task makes cash flow calculated by previous Run available for the subsequent Run. Run skey of the previous Run from which the value should be taken is given as property value of ‘Data File Name’ as - $RUNSK=’Run Skey’ . This can be updated from Batch Maintenance. Oracle Financial Services Software Confidential-Restricted 41 User Guide: Oracle Financial Services Loan Loss Forecasting and Provisioning, Release 1.5.0.0.0 6. Loan Loss Forecasting & Provisioning Reports LLF&P uses the Oracle Dashboard reporting tool for expected loss and incurred loss executables. The reports are in graphical and tabular form. The reports are generated by using the following filters: Execution Date: It refers to the FIC_MIS_DATE of the RUN executed RUN Name: This is the name of the Run. When selecting this filter, it should be noted that only those Runs falling under the execution date would be displayed in the drop down menu. RUN Skey: You are supposed to select the RUN skey corresponding to the Run. Like in case of Run name, the Run skey would also display only those Skey’s corresponding to the execution date and Run name. Oracle Business Intelligence has the following set of tabs classified for simpler user interface. Home Page Trend Analysis Transition Matrix Comparison Analysis Stress Test Reports Loss forecast Apart from the above tabs some of the reports are allowed to drill down to a more granular detailing of the outputs. Stress reports and Loss forecast and some of baseline reports are provided with a drill down option. 6.1. Home page Reports The objective of the Home Page reports is to provide a glimpse of the entire outputs starting from carrying amount information to the loss forecast. There are seven such classifications provided. Tabular Reports: The set of reports provide the details for parameters like allowance, impairment, transition matrices and loss forecast in tabular format. You have to click the individual reports to display the same in a new browser. You have to select the three filters mentioned above. Oracle business Intelligence provides the following Tabular Reports: Allowance for Credit Losses – Basel Asset class Allowance for Credit Losses – Product Type Impaired Assets – Product Type Impaired Assets – Basel Asset Classes Impaired Assets - Line of Business Trend Reports of Provision – Basel Asset Classes Historical Transition Matrix Effective Interest Rate Report Charge off Rates – Product Type Predicted Transition Matrix – Stress Scenario Oracle Financial Services Software Confidential-Restricted 42 User Guide: Oracle Financial Services Loan Loss Forecasting and Provisioning, Release 1.5.0.0.0 Charge off Report Loss Forecast – Retail Exposures Loss Forecast – Wholesale Exposure Allowance for Credit Losses: The report is generated at a RUN level. Overall allowance value for the Run is displayed. It has an additional filter on period. Only when previous period data exists, both the current period and previous period details are made available in the report. If you do not have previous period data, only current period details are displayed. Allowance for Credit Losses by Line of Business: The report displays allowance values across Lines of Business (LOB) level in a tabular format. You are supposed to select the period filter and click the Apply icon to see the previous period data. In addition, you can opt for a more granular view by drilling down till account level. For each level of drill through, corresponding filters need to be selected separately. Allowance at Product Type level: The report is viewed filtering LOB and Product type. This allows you to interpret the allowance amount at each product type level at LOB level. Allowance at Product Level: The report is viewed filtering LOB, product type and product level. This allows you to interpret the allowance amount at each product level falling under a particular product type and Line of Business Allowance at Account Level: The report is viewed filtering LOB, product type, product and Account level. This allows you to view the allowance at the most granular level of account. Allowance Account Trend: This report allows you to interpret the allowance values at Asset Class Level. The list of Basel Asset Class is displayed in the drop down. You can select the Asset class and the period filters. There is no drill down reports provided in this report. The report is in graphical format. Impaired Assets across Line of Business: The impaired asset report is displayed under two measures: Allowance: Graphical representation of Allowance at each line of business of those assets which are impaired. Provision: Graphical representation of Provision at each line of business of those assets which are impaired. Charge of Rate by Line of Business: Charge off rate refers to the ratio of net charge off and carrying amount. The reports are displayed in graphical across LOB for a particular period. Charge of Rate Trend: The trend displays five years or twelve months or twelve quarters based on the filter selected. The charge off rate is at the Run level unlike in 1.6 which is at Line of business level. 6.2. Trend Analysis All the reports in this tab provide the historical trend in graphical form. Accordingly, the following set of reports is displayed: Allowance Trend by Line of Business: The Allowance amount trend is displayed at each line of business level. The trend displays five years or twelve months or twelve quarters based on the filter selected. Charge off Trend by Line of Business: The report summarizes the charge off trend at line of business level with three measures; Gross charge off Net Charge off Oracle Financial Services Software Confidential-Restricted 43 User Guide: Oracle Financial Services Loan Loss Forecasting and Provisioning, Release 1.5.0.0.0 Recoveries Allowance Trend by Product: Allowance amount trend is given at product level. The trend displays five years or twelve months or twelve quarters based on the filter selected. Charge off Trend by Product: Charge off Trend is at product level selected in a filter. The trend displays five years or twelve months or twelve quarters based on the filter selected. Charge off Rate Trend: The report is at Line of Business (LOB) Level. The trend displays five years or twelve months or twelve quarters based on the filter selected. Charge off Rate Trend: The report is at product level. The trend displays five years or twelve months or twelve quarters based on the filter selected. 6.3. Transition Matrix Transition matrix displays the square matrix individually for both retail and corporate separately along with historical and predicted Transition Matrix. Historical Average Transition Matrix- Wholesale: You have to select the Transition Matrix name as a filter to display the matrix in the same browser. The reports are populated from fct_rating_transition_matrix. It is identified with N_PERIOD_APPLICABLE as -1. Historical Average Transition Matrix- Retail: You have to select the Transition Matrix name and the product as a filter to display the matrix in the same browser. The reports are populated from and fct_dpd_transition_matrix. It is identified with N_PERIOD_APPLICABLE as -1. Predicted Transition Matrix-Wholesale: You have to select the Transition Matrix name and the time period applicable as a filter to display the matrix in the same browser. Predicted Transition Matrix-Retail: You have to select the Transition Matrix name, the product, and time applicable, as a filter to display the matrix in the same browser. 6.4. Comparison Analysis The tab compares the provision amount between two runs or two periods based on your selection of comparison. Provision Comparison across Business Lines: The filter used is the Run Identifier. Each identifier is the combination of Run Name and Run Skey. Upon selection of these filters you can compare the provision amount across business lines between two separate Runs in graphical form. Provision Comparison: This is the comparison report of all the available Runs. The comparison is between Allowance - beginning of period, end of period, Provision, Carrying amount and Net charge off across the Runs. 6.5. Stress Test Reports Stress reports would have the following filters: Scenario Stress Run Run Skey Each stress Run would have multiple scenarios. Only those scenarios corresponding to the particular Run is displayed. NOTE: Stress Test Reports are not a part of the ‘out of box’ product. However, if it Is created and executed on the LLF&P application, the complete report will be displayed. Allowance for Credit Losses: Stress report for collective assignment and individual assignment Oracle Financial Services Software Confidential-Restricted 44 User Guide: Oracle Financial Services Loan Loss Forecasting and Provisioning, Release 1.5.0.0.0 are done separately. The report is similar to that available in the baseline report in the home page. Stressed Provisions Across Business Lines: The report displays the comparison of provision amount between the baseline Run and the stressed Run. Charge off Rates: Charge off rate is similar to that of baseline Run displayed in the home page. Stressed Impaired Assets Across Business Lines: The report summarizes the impaired assets across business line. The comparison is done between two measures which are carrying amount and Allowances. Stressed Effective Interest Rate or Spread across Business Lines: The report summarizes the interest rates of all the active accounts. For fixed rate instruments weighted average, EIR is calculated and for variable rate instruments weighted average EIS is calculated. Expected Loss % Across Business Lines: Expected loss is calculated as the percentage of allowance of individual business line to the corresponding carrying amount. The comparison is between baseline and stressed reports. 6.6. Loss Forecast Loss forecast is an independent function of any Run. The filters used for these reports are Run Skey, Run Name, and Execution Date. Oracle Business Intelligence reports the following: Loss Forecast for Wholesale Exposures: Based on the measure selected, the forecast period is provided for five periods excluding the current period. The reports are given at two measures: Total customers Total Exposure Value The period selection is displayed at the top of the report. Loss Forecast for Wholesale exposures by time period: The report gives the graphical representation of customer count and exposure value. Accordingly, the percentage report is also computed graphically. Loss Forecast for Retail Exposures: Based on the measure selected, the forecast period is provided for five periods excluding the current period. The reports are given at two measures: Total customers Total Exposure Value The period selection is displayed at the top of the report. Loss Forecast for Retail exposures by time period: The report gives the graphical representation of customer count and exposure value. Accordingly the percentage report is also computed graphically. Oracle Financial Services Software Confidential-Restricted 45 User Guide: Oracle Financial Services Loan Loss Forecasting and Provisioning, Release 1.5.0.0.0 7. Resolution of LLF&P Implementation Issues Data related issues can be generally classified as Initiation Date (Date of initial application) and Subsequent Day, subsequent day being any day other than initiation date. Initiation date of implementation is crucial from data perspective. Few notable ones are as below: To calculate EIR or EIS, transition matrix and interest rates pertaining to the account start date is required. Old accounts may not have transition matrix as of account start date. However, interest rate data should be available, which is not a serious issue nowadays. Yet calculating EIR or EIS of these old accounts is an important decision to be made, mainly due to transition matrix. According to IFRS, in its draft on Amortized cost published in 2009, refer to the pages with Para 23 – 27. However, this is left to the interpretation of each entity. NOTE: ○Institutions are expected to make use of all the possible data available. This necessarily means that even if we have data not as of account start date but some reasonable date in history, it can be used. However, it is expected to use the same transition matrices pertaining to a given period for all the accounts having their account start date in the given period. This will enable benchmarking. ○In the LLF&P Application, you need to define a separate run named aptly. In this run, you can assign the appropriate transition matrix to the concerned exposures and define a run only till EIR or EIS calculations. Later post verification, you can post the same to the INCEPTION TABLE. Later in the provision calculation run, this can be used as an input for discount rate. ○Alternatively, you can provide the EIR or EIS as a download based on some assumptions like EIR is x% below IRR. This at times either underestimates or overestimates the risk. However, being approximate numbers, provision using these rates and actual rates should be compared to arrive at a logical decision which should be in compliance with regulatory requirements if any. Oracle Financial Services Software Confidential-Restricted 46 User Guide: Oracle Financial Services Loan Loss Forecasting and Provisioning, Release 1.5.0.0.0 Annexure A: Understanding Key Terms and Concepts Poisson Process and Exponential Distribution The Poisson process is a counting process for the number of events that have occurred up to a particular time. It is at times called a jump process, as it jumps up to a higher state each time an event occurs. It is also a special case of a continuous Markov process. It has potential applications in the Financial Industry. For example: Total Credit default amounts consist usually of a sum of individual default amounts. The number of defaults is usually assumed to occur according to a Poisson process. The exponential distribution plays a very important role in Poisson process partly because the time between events or jumps follow an exponential distribution. Random variable X is said to have an exponential distribution if density has the form: fX(x) = e−x, for x 0. Splitting of Poisson Processes For Example: Times between births (in a family) follow an exponential distribution. The births are categorized by gender. For Example: Times between back pains follow an exponential distribution. However, the degree of pain may be categorized as per the required medication (which depends on the degree of pain). Consider a Poisson Process fN(t); where in addition to observing an event, the event can be classified as belonging to one of r possible categories. Define Ni(t) = no. of events of type i during (0; t] for i = 1; 2; : : : ; r) N(t) = N1(t) + N2(t) + … + Nr(t) This process is referred to as splitting the process. The LLF&P Application makes use of this property to arrive at n-period probability from a given Transition matrix. This method is used to calculate monthly probabilities from the annual transition matrices. Marginal Transition Matrix Vs Cumulative Transition Matrix Cumulative Transition Matrix refers to the cumulative, which includes transitions from previous years as well. Marginal Matrix refers to transitions that are incremental or only one unit of time at a time. Generally, Cumulative Transition Matrices are used when you are required to compute at the transition rates at the end of period n, whereas when you want to analyze incremental defaults, marginal transition matrices are used. In the LLF&P Application, if you want to calculate provision at exposure level for each time period like each year individually throughout the life time of the asset, then factors like discount rate for the same cash flow makes a considerable impact on the overall amortized cost, compared to discounting from chosen milestones like 3 year, 6 year and so on. This makes Marginal Transition Matrix a better choice over Cumulative Transition Matrix. Examples of Marginal Transition Matrices: Year 1 - Transition Matrix From /To AAA AA AAA AA A BBB BB B D 88.53% 7.75% 0.47% 0.00% 0.00% 0.00% 3.25% 0.60% 87.50% 7.33% 0.54% 0.06% 0.50% 3.47% Oracle Financial Services Software Confidential-Restricted 47 User Guide: Oracle Financial Services Loan Loss Forecasting and Provisioning, Release 1.5.0.0.0 Year 1 - Transition Matrix A 0.40% 2.07% 87.21% 5.36% 0.39% 0.16% 4.41% BBB 0.01% 0.17% 3.96% 84.13% 4.03% 0.72% 6.98% BB 0.02% 0.05% 0.21% 5.32% 75.62% 7.15% 11.63% B 0.00% 0.05% 0.16% 0.28% 5.92% 73.00% 20.59% CCC/C 0.00% 0.00% 0.24% 0.36% 1.02% Marginal Transition Matrix (Year 1) 11.74% 86.64% Let us assume that we are using time homogeneous matrices, then the same matrix will be used for year 2 also, Year 2 - Transition Matrix From /To AAA AA A BBB BB B D 88.53% 7.75% 0.47% 0.00% 0.00% 0.00% 3.25% AA 0.60% 87.50% 7.33% 0.54% 0.06% 0.50% 3.47% A 0.40% 2.07% 87.21% 5.36% 0.39% 0.16% 4.41% BBB 0.01% 0.17% 3.96% 84.13% 4.03% 0.72% 6.98% BB 0.02% 0.05% 0.21% 5.32% 75.62% 7.15% 11.63% B 0.00% 0.05% 0.16% 0.28% 5.92% 73.00% 20.59% CCC/C 0.00% 0.00% 0.24% 0.36% Marginal Transition Matrix (Year 2) 1.02% 11.74% 86.64% AAA However, if it has been cumulative transition matrix, then we have for up to year 2 transitions as, Year 2 - Transition Matrix From /To AAA AAA AA A BBB BB B D 78.42% 13.65% 1.40% 0.08% 0.04% 0.42% 5.98% AA 1.09% 76.76% 12.84% 1.34% 0.21% 1.23% 6.53% A 0.72% 3.66% 76.43% 9.23% 0.91% 0.85% 8.20% BBB 0.03% 0.38% 6.82% 71.23% 6.57% 2.25% 12.72% BB 0.03% 0.10% 0.60% 8.57% 57.94% 12.03% 20.73% B 0.00% 0.09% 0.33% 0.84% 9.02% 56.13% 33.59% CCC/C 0.00% 0.01% 0.45% 0.71% 2.37% 18.82% 77.64% Cumulative Transition Matrix (Year 2) Oracle Financial Services Software Confidential-Restricted 48 User Guide: Oracle Financial Services Loan Loss Forecasting and Provisioning, Release 1.5.0.0.0 Annexure B: Things to Remember Basel Reclassification rule is for reporting purposes only and does not have any effect on method selection or calculation. LLF&P application expects one internal rating for only one external rating. Provision matrix method is assigned for specific condition and as default method for all, unless otherwise specified. In case cash flow is given as download, then all accounts are treated individually. Overnight rate (1 Day) is mandatory for Interest Rate Curve. Historical Average Transition Matrix reports are populated from fct_rating_transition_matrix (for wholesale) and fct_dpd_transition_matrix (for retail). It is identified with N_PERIOD_APPLICABLE as -1. Method override also checks for accounts having different product types but sharing same collateral. Such accounts are not assigned any provision calculation method and, hence, Provision amount is not calculated for it. For Poisson process, the desired frequency period should be less than the input matrix frequency period. To calculate proper coefficient, no consecutive interest rates in historical interest rate curve table should be precisely same. Maximum of 100 data points (interest rate points) can be given for interpolation coefficient calculation. LLFP does not handle partial allocation of mitigant value to an account, i.e. 100% of the mitigant value is considered to be associated with the account. Threshold can only be applied at product-type, Legal Entity and Currency level. Accounts with Negative balance or 0 as carrying amount will be forced to have an allowance of 0. Loss forecasting is done for five (5) periods in case of rating based and twenty four (24) periods for DPD based (excluding the current period); where a period is the minimum frequency period of the transition matrix mapped. For example: if there are 3 transition matrices (TM1, TM2 and TM3) mapped to various accounts in a run and frequency period of these transition matrices are TM1-quarterly, TM2-quarterly and TM3-yearly period, then forecasting is done for 5 quarters for rating based and 24 quarters for DPD based. Oracle Financial Services Software Confidential-Restricted 49 User Guide: Oracle Financial Services Loan Loss Forecasting and Provisioning, Release 1.5.0.0.0 Annexure C: Frequently Asked Questions 1. Can LLF&P be used with other cash flow engines instead of Oracle CFE? If yes, then what is required be done? Oracle LLF&P can be used with other cash flow engines. LLF&P uses Oracle cash flow engine to generate contractual cash flow at account level and cash flow as of account start date to calculate EIR and EIS. If any external engine is used then cash flow generated by other engines need to be given as download in stg_account_cash_flows table in the format as specified in download specifications. 2. For a given transition matrix can the user define the impairment grade? The user can change the default grade by selecting a Target Hierarchy in Rating Impairment State Assignment or DPD Impairment State Assignment. However, impairment status should be at a transition matrix level and, hence, source hierarchy in this should be consistent with that of transition matrix selection. 3. Effective Initial Rate and Effective Initial spread provided by Oracle LLF&P are calculated as of which date? Effective Initial Rate and Effective Initial spread provided by Oracle LLF&P are calculated as of account start date. 4. What are the conditions when Effective Initial Rate and Effective Initial spread are recalculated in Oracle LLF&P? EIR and EIS values are considered in following order: 5. EIR or EIS value is in Stage Table value. If EIR/EIS value is not there in Stage table then it checks in Account Inception Table If not found there then application calculates by itself How to select the approach for available products? Following rules are used to assign a method in EL and IL approach respectively: Provision Calculation Methodology Selection - EL Run and Provision Calculation Methodology Selection - IL Run. You can change this rule to select the approach based on the requirement. 6. How is collective assessment handled in Oracle LLF&P? Accounts that can be assessed and treated collectively are identified based on their credit rating, delinquency band, customer type, start date, interest rate, cash flow pattern and other such characteristics that can affect allowance amount. Cohort is formed according to such data. Allowance and provision amount is calculated for cohort and then allocated back to account level using carrying amount as allocation factor. 7. If we provide only rating based Provision Matrix then is it compulsory to provide rate for delinquency band as well? In case of 'rating-only' provision matrix, delinquency band is considered as missing (value 0) and delinquency band of the account is not considered for provision rate assignment. 8. Are there any conditions on Transition matrix data download in Oracle LLF&P? Transition Matrix should be: Complete Square Transition frequency unit should be consistent across time periods. Oracle Financial Services Software Confidential-Restricted 50 User Guide: Oracle Financial Services Loan Loss Forecasting and Provisioning, Release 1.5.0.0.0 9. Transition Matrix should be available for continuous time period starting from period 1 In case of external rating transition matrix, rating source and external to internal mapping is mandatory. For more information, refer to the DL Specs. Can cash flow be generated for revolving products? Yes, cash flow can be generated for revolving products using payment patterns. Following Pre- configured payment patterns are available: Code Description 5999 For payment pattern of Cards 6000 For payment pattern of Purchase Receivables For payment pattern of cash credit and overdraft 6001 10. Can we download TM with different interval for example TM1 with 1year ,3 year, 5year and so on? No. Refer Question No. 10 for more details. 11. Does the user need to give cash flow download every time for same day execution? Yes. Cash flow needs to be in stage table for each run. 12. Can EL and IL approach be combined and executed? Yes. To combine EL and IL run, Provision Calculation Methodology Selection rule needs to be modified. In addition, some rules which are specific to the approach need to be included for processing. 13. Can download TM with different frequency for example TM1 with 1 year, 6 month, 1 month and so on? No. To generate Lamda for Poisson process and subsequent usage, Transition Matrix needs to be of same frequency for all period. Please refer Q No 10 for more detail. 14. Can Charged off account be part of a collective assessment? No. Charged off / written off and impaired accounts are cannot be part of any cohort. 15. Is it feasible to compare individually calculated allowance and those which are allocated back to account level from collective assessment? Accounts having similar behaviour and potential cash flow are combined to generate cash flow more efficiently. These are typically large-in-volume accounts like retail exposures. Considering carrying amount as weight for individual allocation, allowance may be compared with individual treatment. If allocation factor is other than Carrying amount then there will be some difference. 16. Why recoveries are not part of collective assessment assignment? Recovery pattern and impact on cash flow parameters may not be same. To maintain homogeneity of accounts within cohort these accounts are not part of collective assessment. 17. Can we download TM with non-continuous time period? For example: TM1 with applicable period 1, 3, 5 years and so on. No. Refer Question No. 10 for more details. 18. Are EIR and EIS calculated collectively or individually? EIR EIS is calculated at account level and not at cohort level. Then, it is allocated back to account level using carrying amount of the account in the cohort as allocation factor. 19. Can a Run be without collective assessment? Oracle Financial Services Software Confidential-Restricted 51 User Guide: Oracle Financial Services Loan Loss Forecasting and Provisioning, Release 1.5.0.0.0 Yes. Collective assessment is done to efficiently generate cash flow for identical accounts. 20. Can Provision Matrix be based on External Ratings? No. User can map external rating to internal rating at account level and then internal rating based provision matrix can be mapped to it. 21. Which Transition Matrix is used for Loss Forecasting? Transition Matrix mapped to the accounts is used for Loss Forecasting. In addition, same matrix is used for Provision calculation in Cash flow based approach. 22. Is account mapped with PMM/RRM considered for loss forecasting computation? Yes, all accounts mapped with Transition Matrix are considered for Loss Forecasting, irrespective of approach mapped. 23. Does LLF&P compute the EIR/EIS for impaired state accounts? No, LLF&P does not calculate EIR/EIS for accounts mapped to Recovery Rate Methodology and Provision Matrix Methodology. EIR / EIS are calculated only for the accounts mapped to Expected Loss Methodology - Cash Flow Based. 24. Can user use the calculated EIR/EIS in the future execution runs? Yes, it can be used for future execution by maintaining in Account Inception Table. Calculated EIR/EIS can be posted in FSI_ACCOUNT_INCEPTION_RATES using batch name PROCESSED_DATA_MAINTENANCE and Task Name Processed Data Maintenance. 25. Is overnight rate (1 Day) mandatory for Interest Rate Curve? Yes. 26. Is Risk free IRC mandatory for IL Run? Yes. Discounting of cash flow till average recovery period is done using risk free rate. 27. Can you use the cash flows to generate in EL to IL Run? The generated cash flows can be re-used by populating those values back to the stage table. Then it will be considered as a download and would not be recalculated. Batch Name is PROCESSED_DATA_MAINTENANCE and Task Name Stage Cash Flow Population. 28. In which currency charge-off amount threshold is denominated? Charge-off amount threshold is in account's Natural Currency. User has the flexibility to set the threshold currency wise also by selecting currency as source hierarchy in the rule. 29. Can user give average recovery period for monthly, quarterly or yearly period? Average recovery period can be in Days, Months or Years. 30. Can user give emergence period for monthly, quarterly or yearly period? Emergence period can be in Days, Months or Years. 31. Why charge-off materiality flag is calculated based on Gross charge-off and not based on net charge-off which would consider recoveries as well? Charge off materiality flag helps in deciding whether particular exposure to be considered as charged off (instance of default) or not. Whereas, whether recoveries are done or not does not impact this decision, it helps to arrive at actual LGD. 32. Does LLF &P calculate carrying amount based on amount of principal outstanding, write off, interest and other such component that could potentially form carrying amount? Oracle Financial Services Software Confidential-Restricted 52 User Guide: Oracle Financial Services Loan Loss Forecasting and Provisioning, Release 1.5.0.0.0 While we take these individual components as download, it is left to the user to arrive at carrying amount based on their accounting requirement. Presently, carrying amount is EOP Balance. 33. Can collective assessment be used when cash flow for all accounts is provided as download? No. If cash flow is given as download then corresponding account is treated individually. 34. Can the application calculate EIR / EIS if cash flow is provided as a download? Yes. EIR / EIS can be calculated with downloaded cash flow and Transition matrix valid as on account origination date. Oracle Financial Services Software Confidential-Restricted 53 User Guide: Oracle Financial Services Loan Loss Forecasting and Provisioning, Release 1.5.0.0.0 Annexure D: Historical Transition Matrix A Transition Matrix is a square matrix in which the rows and columns correspond to categories defined in equivalent ways. Usually, the row categories refer to one time period and the column categories to a subsequent time period. The entries can be frequencies, probabilities, or conditional probabilities. Table 2 and Table 3 is an example on transition probability which show the transition in the ratings of Investment Banks in the year 1996. For example: we have considered a sample of 100 Banks and their transition in the rating through the year. Banks which have moved from AAA rating to AAA rating from 1996 to 1997 expressed in terms of rate is 0.6 (9/15). Around 60% (9/15) AAA Rated Banks’ Rating has not changed. Transition Matrix of Investment Banks for year 1996 Year 1997 Year 1996 AAA AA A BBB BB B CCC D AAA 9 2 1 2 1 0 0 0 15 AA 4 14 3 2 0 0 0 0 23 A 2 2 9 1 1 1 0 0 16 BBB 2 1 3 11 0 1 0 0 18 BB 0 1 2 1 4 0 1 1 10 B 0 0 2 1 0 6 1 1 11 CCC 0 0 0 0 0 1 3 1 5 D 0 0 0 1 1 2 0 0 0 Table 1: Transition Matrix Transition Rate yearly calculation Total Year 1997 Year 1996 AAA AA A BBB BB B CCC D AAA 0.6 0.13333 0.06667 0.13333 0.06667 0 0 0 AA 0.17391 0.6087 0.13043 0.08696 0 0 0 0 A 0.125 0.125 0.5625 0.0625 0.0625 0.0625 0 0 BBB 0.11111 0.05556 0.16667 0.61111 0 0.05556 0 0 BB 0 0.1 0.2 0.1 0.4 0 0.1 0.1 B 0 0 0.18182 0.09091 0 0.54545 0.09091 0.09091 CCC 0 0 0 0 0 0.2 0.6 0.2 D 0 0 0 0 0.5 0.5 0 0 Table 2: Transition Matrix Oracle Financial Services Software Confidential-Restricted 54 User Guide: Oracle Financial Services Loan Loss Forecasting and Provisioning, Release 1.5.0.0.0 A Historical Transition Matrix (HTM) is a square matrix which calculates the transition movement from one stage to another in the past. This is calculated using the observed transition over a period. Period can be monthly, quarterly, and yearly. Transition is based on the following: Number of customers Number of accounts Total exposure outstanding HTM provides the transition probability of movement of customers, accounts, or exposure outstanding from one stage to another. This transition probability can be used as a dependent variable in the model to predict or forecast the future transition probability. The following table shows the historical transition in the ratings of Investment Banks for the financial years 1996-1999 (3 years). For example: We have taken a sample of 100 Banks and their transition in the rating over the financial years. Banks which have moved from AAA rating to AAA rating from 1996 to 1997 expressed in terms of rate is 0.6 (9/15). This means that 60% of the total numbers of Banks have moved from rating AAA from 1996 to AAA 1997 (the same logic applied for other years also). This movement of ratings is termed as transition and the table which shows this transition over years at a group level is known as Historical Transition Matrix. Yearly Transition Matrix of Investment Banks Year 1997 Year 1996 AAA AA A BBB BB B CCC D Total AAA 9 2 1 2 1 0 0 0 15 AA 4 14 3 2 0 0 0 0 23 A 2 2 9 1 1 1 0 0 16 BBB 2 1 3 11 0 1 0 0 18 BB 0 1 2 1 4 0 1 1 10 B 0 0 2 1 0 6 1 1 11 CCC 0 0 0 0 0 1 3 1 5 D 0 0 0 0 1 1 2 0 0 Historical Transition Matrix Transition Rate Yearly Calculation Year 1997 Year 1996 AAA AA A BBB BB B CCC D AAA 0.6 0.13333 0.06667 0.13333 0.06667 0 0 0 AA 0.17391 0.6087 0.13043 0.08696 0 0 0 0 A 0.125 0.125 0.5625 0.0625 0.0625 0.0625 0 0 BBB 0.11111 0.05556 0.16667 0.61111 0 0.05556 0 0 BB 0 0.1 0.2 0.1 0.4 0 0.1 0.1 B 0 0 0.18182 0.09091 0 0.54545 0.09091 0.09091 Oracle Financial Services Software Confidential-Restricted 55 User Guide: Oracle Financial Services Loan Loss Forecasting and Provisioning, Release 1.5.0.0.0 Transition Rate Yearly Calculation Year 1997 CCC 0 0 0 D 0 0 0 0 0 0 0 Historical Transition Matrix 0.2 0.6 0.2 0 0.5 0.5 HTM generation is delivered through the Oracle Financial Services Analytical Applications Infrastructure (OFSAAI). You can build your own HTM definitions using the HTM User Interface You can generate the HTM values for the past period by executing the Run Historical Transition Matrix. HTM can be defined as a Rating Based Matrix and Delinquency Band Based Matrix Rating Based Matrix: In Rating Based, ratings are the row category and column category. Generally these types of matrices are generated for corporate counterparties. Number of counterparts and the outstanding exposure measures are used for transition probability computation. Delinquency Based Matrix: In delinquency based, delinquency bands are the row category and column category. Generally these types of matrices are generated for retail exposures. Number of accounts and outstanding exposure measures are used for transition probability computation. There are five roles and functions supported by the HTM UI as follows: ADMIN: An important function, a user group having access to this function is allowed to access the HTM UI. Function code is HTRNSADMIN. NEW: This function allows you to create any HTM definition. Function code is HTRNSNEW. VIEW: This function allows you to view any HTM definition. Function code is HTRNSVIEW. EDIT: This function allows you to edit any HTM definition. Function code is HTRNSEDIT. DELETE: This function allows you to delete any HTM definition. Function code is HTRNSDEL. Role and Function mapping are available as part of the pre-configured solution. A User Group can be mapped to any of the functions as required. However, the Admin function is a mandatory function to access the HTM user interface. These functions are at a user group level. In the preconfigured solution, a user group is mapped to all the functions. Function Code Function Name HTRNSADMIN Transition Matrix Admin HTRNSDEL Delete transition Matrix HTRNSEDIT Edit Transition Matrix HTRNSNEW Add Transition Matrix HTRNSVIEW View Transition Matrix HTM UI Function Code Oracle Financial Services Software Confidential-Restricted 56 User Guide: Oracle Financial Services Loan Loss Forecasting and Provisioning, Release 1.5.0.0.0 Accessing the HTM UI Refer to the following steps to access the HTM UI: Click Risk Application > Loan Loss Forecasting & Provisioning > Historical Transition Matrix Definition from the Left Hand Side (LHS) menu of the OFSAAI. Click Historical Transition Matrix which displays the Transition Matrix Summary Screen. Overview of Transition Matrix Summary Screen The various functionalities supported by the Transition Matrix Summary screen are explained in a tabular format as follows: 10 8 9 11 2 1 3 4 5 6 7 Transition Matrix Summary Screen Screen Description Using the Transition Matrix Summary screen you can create, edit, or delete transition matrices as required Reference Number Tag Description 1 Transition Matrix ID This is a unique Transition Matrix reference number 2 Transition Matrix Name A unique name defined by you for a transition matrix 3 Active This column displays the status of the created transition matrix. The executions Oracle Financial Services Software Confidential-Restricted 57 User Guide: Oracle Financial Services Loan Loss Forecasting and Provisioning, Release 1.5.0.0.0 Screen Description Reference Number Using the Transition Matrix Summary screen you can create, edit, or delete transition matrices as required Tag Description done would consider only the data of the Active Transition matrix which is shown as Y on the screen 4 Created By This section displays the name of the user who has created the Transition matrix. 5 Creation Date This section displays the date on which the transition matrix is created 6 Last Modified By Displays the name of the user who has last modified the Transition matrix. 7 Last Modified Date This section displays the date on which the transition matrix was last modified 8 Pagination Options Pagination options are displayed on the Transition Matrix Summary screen to facilitate you to choose from the available dropdown, the number of transition matrices to be displayed on the screen. Navigation options like First, Previous, Next and last is also available in form of arrow keys which navigates the user from one page to another Search This icon helps in searching the Transition Matrix by providing the Transition Matrix Name in the text box displayed next to it (Refer to OFSAAI manual for text box features). All the Transition Matrices which contain the unique input name will be displayed in a tabular format in Transition Matrix Summary panel. Icon 9 10 Reset Icon The Reset icon when clicked refreshes the screen, clears the text typed in the text field and restores the default screen Add Refer Section Define a New HTM View Refer Section View an HTM Edit Refer Section Edit an HTM Oracle Financial Services Software Confidential-Restricted 58 User Guide: Oracle Financial Services Loan Loss Forecasting and Provisioning, Release 1.5.0.0.0 Screen Description Reference Number Using the Transition Matrix Summary screen you can create, edit, or delete transition matrices as required Tag Delete 11 Expand / Collapse Description Refer Section Delete an HTM Using this icon you can expand or collapse the panel as per your convenience. Transition Matrix Summary Screen Overview NOTE: For the benefit of users, tool tips are displayed over a mouse hover for all the icons. Defining a New HTM To define a new HTM click icon in the Transition Matrix Summary Screen. This will direct you to the Transition Matrix Definition Screen, shown in Figure 10. NOTE: To return to the Transition Matrix Summary Screen, click Historical Transition Matrix a hyperlink on the left top corner of the screen The important functionalities of the Transition Matrix Definition Screen have been explained in a tabular format (Refer Table 8): Oracle Financial Services Software Confidential-Restricted 59 User Guide: Oracle Financial Services Loan Loss Forecasting and Provisioning, Release 1.5.0.0.0 1 2 3 5 4 6 7 8 9 Transaction Matrix Definition Screen (Define HTM) Screen Description Reference Number Using this Transition Matrix Definition Screen you can define a new HTM. Tag Description Transition Matrix Details This panel describes the name, description, data set and active checkbox for a transition matrix which are mandatory for adding or creating any HTM Definition. 2 Transition Matrix Name Transition Matrix Name is a text field. The name of a Transition matrix should be unique (should not be duplicate of any existing Transition matrix). The maximum length of a transition name is 100 characters. The following special characters are the only ones which will be accepted by the solution : .,:,_,-, ,$,%,&,@,!,#,(,),*,+,,,;,=,?,[,],^,| 3 Transition Matrix Description Transition Matrix Description is a text field. The description field should explain the particular id and should be a maximum of 100 characters 1 Oracle Financial Services Software Confidential-Restricted 60 User Guide: Oracle Financial Services Loan Loss Forecasting and Provisioning, Release 1.5.0.0.0 Screen Description Reference Number 4 5 6 7 Using this Transition Matrix Definition Screen you can define a new HTM. Tag Description Active checkbox A check box with label Active is be checked by default. This check box is editable. It indicates if a transition matrix is active or inactive. If you select the check box then this Transition Matrix would be considered while performing executions. Only those HTM Definitions which are active will be processed during the HTM Run execution Data Set Data Set is a field accompanied by a browser button. By clicking the button, a window is displayed to select a dataset from the available datasets for HTM definition. For HTM definition, dataset selection is limited through the Parameter Master table (reveleus_parameter_master). The pre-configured solution comes with two datasets like Corporate Historical Transition Matrix and Retail Historical Transition Matrix. A dataset can be selected using the arrow key. Once you have selected the dataset, click the OK button to display the selected dataset on the Transition Matrix summary screen. State Space State Space is the form or stage in which transition happens. State Space can be the rating of the customer or delinquency band of the exposure. This field is accompanied by a browser button. By clicking this button a window is displayed to select a hierarchy from the available hierarchies for HTM definition. For HTM definition, hierarchy selection is limited through the Parameter Master table (reveleus_parameter_master). A hierarchy can be selected using the arrow key. Once you have selected the hierarchy click the OK button to display the selected dataset on the Transition Matrix summary screen. Transition Basis Transition Basis is a measure, based on which the Transition Probability is calculated for HTM. This field is accompanied by a browser button. By clicking this button, a window is displayed to select a measure from the available measures for HTM definition A measure can be selected using the arrow key. Once you have selected the measure click the OK button to display the selected dataset on the Transition Matrix Summary screen. For more information on Transition Basis, click here. Oracle Financial Services Software Confidential-Restricted 61 User Guide: Oracle Financial Services Loan Loss Forecasting and Provisioning, Release 1.5.0.0.0 Screen Description Reference Number Using this Transition Matrix Definition Screen you can define a new HTM. Tag Description A Filter panel is provided to you to filter the data for the HTM calculation. To calculate transition probability for only Line of Business (LOB) – Retail: 8 1. Select the filter hierarchy Line Of Business 2. Select the Retail node of the hierarchy (while processing, it will pick on the LOB- Retail data and calculate the transition probability for this definition.) 3. Click the OK button to display the selected hierarchy on the Transition Matrix definition screen. (The selected hierarchies would be displayed as a hyperlink on the screen) 4. Click the hyperlink of any of the selected hierarchy to sub filter. This would replace the No Element Selected with the selected hierarchy. The Add icon displayed on the right side of the selected hierarchy will become active. 5. Click the Add icon to display the available hierarchies. You can select single or multiple hierarchies. 6. Click the OK button to display the selected hierarchy/hierarchies on the Transition Matrix definition screen. Filter Audit Trail panel displays the following columns. 9 Audit Trail Created By Last Modified By Creation Date Last Date Modification The purpose of this panel is to provide the details of the user who has created or modified a transition matrix as on date. This detail would be seen only when the transition matrix has been created and you want to view or edit the id details. It also has a user comments tab where you can write any comments as part of transition matrix creation or for reference. Transaction Matrix Definition Screen Overview (Define HTM) Oracle Financial Services Software Confidential-Restricted 62 User Guide: Oracle Financial Services Loan Loss Forecasting and Provisioning, Release 1.5.0.0.0 Once all the above mentioned fields are populated with mandatory values, click the Save button. This Transition matrix is now displayed in the Transition Matrix Summary screen To exit the screen without saving the data, click Cancel button. This will direct you to the Transition Matrix Summary screen without creating any transition matrix. NOTE: Transition Basis is of two types: Transition basis (Corporate Historical Transition Matrix): For corporate, $ credit exposure in LCY and number of corporate customers measures are available in the transition basis browser window. When a customer selects number of corporate customers as a measure for calculating internal rating based transition rates, the final output gives the count of the transition of customers across the ratings in the form of transition rate over the period at a group level. When $ credit exposure in LCY is selected as the measure for calculating internal rating based transition rates, the final output would provide the Sum of the transition amount, as of current period, across the ratings in the form of transition rate over the period at a group level. Transition basis (Retail Historical Transition Matrix): For Retail, number of accounts and EOP $ Outstanding measures are available in the transition basis browser window. When a customer selects number of accounts as a measure for calculating delinquency band based transition rates, the final output gives the count of the transition of accounts across delinquency band in the form of transition rate over the period at a group level. When EOP $ Outstanding is selected as the measure for calculating delinquency band based transition rates the final output would provide the Sum of the transition amount, as of current period, across delinquency band in the form of transition rate over the period at a group level Viewing an HTM To view a particular transition, the check box displayed next to Transition matrix id and click in the Transition Matrix summary screen (refer Figure 9). NOTE: Multiple selection of transition matrix is not possible. On multiple selections, the View icon will be disabled. You will be directed to the Transition Matrix Definition screen to view the details of the selected Transition matrix. This screen is non-editable (Refer figure 11). Click Close to return to the Transition Matrix Summary Screen Oracle Financial Services Software Confidential-Restricted 63 User Guide: Oracle Financial Services Loan Loss Forecasting and Provisioning, Release 1.5.0.0.0 Transaction Matrix Definition Screen (View HTM) Editing an HTM To edit a particular transition matrix, select the check box displayed next to transition matrix id and click the icon in the Transition Matrix summary screen (refer Figure 9). You will be directed to the Transition Matrix Definition screen to edit the details of the selected Transition matrix. NOTE: Multiple selection of transition matrix is not possible. On multiple selections, the View icon will be disabled. Oracle Financial Services Software Confidential-Restricted 64 User Guide: Oracle Financial Services Loan Loss Forecasting and Provisioning, Release 1.5.0.0.0 Transaction Matrix Definition Screen (Edit HTM) The text fields in Transition Matrix Definition screen is non editable except the Active Checkbox. You can only change the status of a transition matrix to Active or Inactive by selecting the Active Checkbox. When you check or uncheck the active check box (refer Figure 12), the following buttons are displayed: Cancel: If cancel button is clicked you will be directed to the Transition Matrix Summary screen. Save: Click Save to save the revised details of the Transition Matrix. Copy: You can edit the existing Transition matrix by creating a new Transition matrix using the Copy button displayed on the screen (refer Figure 12). By clicking this button, you will be able to edit the screen and the copy button would no longer be available on the screen. All the values would display details as per the previous saved data except the Transition Matrix Name and Transition Matrix description which should be unique values. You can either override (edit) the data populated in the Transition Matrix Details, State Space and Filter panel or can proceed with the selected values. In either case, provide a unique Transition Matrix Name and Transition Matrix description. If you wish to edit the data with new values, selecting a different value from the browser window displayed next to the text fields. On selecting a different value you will be prompted by a warning message. Click Yes to override the selected text field (applicable for all the three data sets Transition Matrix Details, State Space and Filter). Once you have provided the unique Transition Matrix Name or Transition Matrix description and edited the text fields click the Save button. You have successfully defined a transition matrix which will be displayed in the transition matrix field. Deleting an HTM To delete a transition matrix, select the check box displayed next to the transition matrix ids and Oracle Financial Services Software Confidential-Restricted 65 User Guide: Oracle Financial Services Loan Loss Forecasting and Provisioning, Release 1.5.0.0.0 click the icon in the Transition Matrix Summary screen (refer Figure 9). You will be prompted with a warning message. Click Yes to delete the selected transition matrix or else click No to close the warning window and to stop deletion of the transition matrix. NOTE: Multiple deletions are also possible Transaction Matrix Definition Screen (Delete HTM) Oracle Financial Services Software Confidential-Restricted 66 User Guide: Oracle Financial Services Loan Loss Forecasting and Provisioning, Release 1.5.0.0.0 Historical Transition Matrix Execution To generate the Historical Transition Matrix, execute the Historical Transition Matrix Population Run. HTM related metadata are provided in a separate segment. While generating the Transition Matrix, the Oracle Financial Services HTM generates the Transition probability. Transition probability can be based on any measure. Regular measures used in HTM are as follows: Number of Counterparties Number of Accounts Outstanding Exposure For more information on Run Execution, refer to the Run Management User Manual. Data Requirements Data are populated to processing table through product processers. Two sets of data are populated. Corporate Data Population: In Corporate Data population, Product processors like Cards, Investments, Loan Contracts and Overdraft Accounts data are expected. Also Customer data is expected. Retail Data Population: In Retail Data population, Product processors like Cards, Loan Contracts and Overdraft accounts data are expected. The main processing tables are as follows: FCT_ACCOUNT_DETAILS FCT_CUSTOMER FCT_CREDIT_RISK_SUMMARY Also for predictive modeling, General Market Variable, Rated Bond Prices, Interest Rate Data are populated. These data is required only if predictive modeling is performed through OFSAAI. For more information on the complete data requirements for HTM Generation, refer to the Download Specifications Document (DL Specs). Previous Period Data For transition matrix generation, we require information of the previous period. Here previous period refers to Previous Month, Previous Quarter and Previous Year. Previous period is identified using the oracle function ADD_MONTHS. The example of dates is provided in the following table: Current Date Previous Month Previous Quarter Previous Year 31-Dec-10 30-Nov-11 30-Sep-11 31-Dec-09 15-Dec-10 15-Nov-10 15-Sep-10 15-Dec-09 30-Nov-10 31-Oct-11 31-Aug-11 30-Nov-09 1-Feb-05 1-Jan-05 1-Nov-04 Previous Period Data 1-Feb-04 The solution updates the customer’s previous rating and the exposure’s previous delinquency state. If previous period information is not available, then NULL (blank) will be updated. Accounts or Customers which don’t have previous period information will not be considered for HTM Generation. Oracle Financial Services Software Confidential-Restricted 67 User Guide: Oracle Financial Services Loan Loss Forecasting and Provisioning, Release 1.5.0.0.0 Historical Transition Matrix Generation HTM Generations are done through a DT (FN_DT_HIST_TRANSITION_RATES). HTM is populated into FSI_HIST_TRANSITION_MATRIX table. For all the active HTM definition, matrix is generated and population. The solution calculates Monthly Transition Rates, Quarterly Transition Rates and Yearly Transition Rates. If yearly information is not available, then the solution will continue with monthly and quarterly rate computation. If the duplicate definitions are used, the solution continues to calculate the transition rates for both. You only have to restrict the computation using the active flag of the definition. FN_DT_HIST_TRANSITION_RATES generates the transition rates for one period that is, considering previous month, and not for previous to previous month. For example: if the execution data is 31-Dec-2010, then matrix is generated as on 31-Dec-2010 only. Matrix will not be generated for 30-Nov-2010, if data is available. You need to execute the same run with the execution date 30-Nov-2010. For multiple period executions, use the FN_DT_HIST_TRANS_MULTI_PERIOD function, which calculates the transition rates for the complete history period. HTM definition has the transition basic as Number of Customers. Transition Rate is computed for AAA – AAA as Suppose Total AAA customer in the previous month is 800 AND Current Month AAA Rated Customers out of previous month AAA Rated Customers is 720. Then the Transition Rate is 720/800 i.e., 0.90 Transition Rates will be negative if the exposure outstanding has negative values. Error messages are logged into FIC_DTDQ_MESSAGE_LOG table. Data Maintenance Dataset selection in HTM UI is restricted through reveleus_parameter_master table. Preconfigured solution comes with two datasets namely. Corporate Historical Transition Matrix Retail Historical Transition Matrix If you want to add new dataset, an entry has to be made in the reveleus_parameter_master table. Parameter Code always should be suffixed with HTRNSDS V_PARAM_CODE V_PARAM_VALUE HTRNSDS<<any value>> <<Dataset Code>> Add New DataSet State space selection in HTM UI is restricted through reveleus_parameter_master table. Preconfigured solution comes with two hierarchies namely: Internal Rating Delinquency Band If you want to add new hierarchy, an entry has to be made in the reveleus_parameter_master table. Parameter Code always should be suffixed with HTRNSH Oracle Financial Services Software Confidential-Restricted 68 User Guide: Oracle Financial Services Loan Loss Forecasting and Provisioning, Release 1.5.0.0.0 V_PARAM_CODE HTRNSH<<any value>> V_PARAM_VALUE << Hierarchy Code>> Add New Hierarchy Matrix definition is stored in FSI_HIST_TRANSITION_MTRX_MAST, FSI_HIST_TRANS_MTRX_FILTER_DFN. Transition rate is calculated based on measure definition. If the measure definition aggregate function is count distinct, then count distinct is used to transition rate computation. If you delete the HTM definition, it is only a logical delete. To restore the definition change the flag. There is no interface to do this activity. It has to be done manually. Matrix outputs are stored in FSI_HIST_TRANSITION_MATRIX table. For Corporate HTM Definition, Dataset should be Corporate Historical Transition Matrix and State Space hierarchy should be Internal Rating. For Retail HTM Definition, Dataset should be Retail Historical Transition Matrix and State Space hierarchy should be Delinquency Band. Oracle Financial Services Software Confidential-Restricted 69 User Guide: Oracle Financial Services Loan Loss Forecasting and Provisioning, Release 1.5.0.0.0 Annexure E: Cash Flow Dictionary Cash flow processing is executed from Oracle Financial Services Cash Flow Engine (CFE). This processing accesses specific fields from instrument tables to perform cash flow calculations. In order for OFSA cash flow processing to generate appropriate results, the data within the accessed instrument tables must be appropriate and consistent. The OFSA cash flow edits function provides a measure of validation for this data. However, the cash flow edits function cannot ensure that the input data from the instrument tables is correct and faithfully reflects reality. Therefore, this chapter contains detailed information necessary for correct data population, including field definitions, formulas used in the cash flow process calculations, and recommended default values for the cash flow processing fields. Unless otherwise stated, when calculations refer to frequency or term fields in this chapter, the implication is that both the frequency (or term) and its associated multiplier fields are used. For example: if N_INTEREST_FREQ is used in a formula, it refers to N_INTEREST_FREQ and V_INTEREST_FREQ_UNIT to determine the true payment frequency. The cash flow processing columns have been explained in detail in the following document: Oracle Financial Services Cash Flow Dictionary_Reference Manual.docx Oracle Financial Services Software Confidential-Restricted 70 User Guide: Oracle Financial Services Loan Loss Forecasting and Provisioning, Release 1.5.0.0.0 Annexure F: Product Type Mapping Each product in STG_PRODUCT_MASTER should be mapped to one of the Product Type as mentioned in the following document. In addition, each product type should be mapped to product sub category, product category and product group as mentioned therein. Product Types and Categories.xlsx Oracle Financial Services Software Confidential-Restricted 71 User Guide: Oracle Financial Services Loan Loss Forecasting and Provisioning, Release 1.5.0.0.0 Annexure G: Data Flow The LLF&P Application data flow is represented in the following diagram: Oracle Financial Services Software Confidential-Restricted 72 User Guide: Oracle Financial Services Loan Loss Forecasting and Provisioning, Release 1.5.0.0.0 Acronyms and Glossary Terms Allowance: Allowance is an amount set aside for adequacy to absorb the potential credit losses in a Bank’s portfolio of loans, HTM securities or other assets. Allowance account When financial assets are impaired by credit losses and the entity records the impairment in a separate account (For example: an allowance account used to record individual impairments or a similar account used to record a collective impairment of assets) rather than directly reducing the carrying amount of the asset, it shall disclose a reconciliation of changes in that account during the period for each class of financial assets (IFRS 7 PARA 16) Present value of the expected cash flows over the remaining life of the financial asset or a pool of assets, discounted using the original effective interest rate. Amortized cost: Benchmark interest rate: Carrying Cost: Cash flow engine: Cash Flow Method: CFE Charge off: Contractual cash flow: A rate used as a yardstick for measuring or setting other interest rates; for example LIBOR Carrying Cost of an asset is its value stated (carried) in the books of accounts on a measurement date. Also called Current Carrying Cost This is an OFSAA Specific terminology. Cash Flow Engine is a component used in the Oracle ALM application. This implies to calculate amortized cost of underlying asset the LLF&P Application will project cash flows. It typically includes Loans and Held-to-Maturity securities (HTM Securities).This is OFSAA specific term. Cash Flow Engine Process of removing uncollectible loans or closed accounts or other assets from the Balance Sheet. This conveys that cash flows are generated using terms and conditions as specified in the contract. This is contrasted against the expected cash flows where cash flows are multiplied by probability which is not part of the contract. Credit Conversion Factor: This term is generally referred from Basel accord by BIS. The credit risk exposure attached to off-balance sheet items is calculated by multiplying the face amount of each of the off-balance sheet items by the credit conversion factor. Thus, this serves as numerical factor for conversion. Effective interest rate The Effective Interest Rate (EIR) is the rate that exactly discounts estimated future cash flows to the net carrying amount of the financial instrument through the life of an asset. In context of IFRS 9, this means rate that exactly discounts probability weighted future cash flows to the net carrying amount of the financial instrument through the life of an asset. Expected Loss Approach The emergence period is typically defined as the time it takes from the date a loss event occurred to the date the entity identifies it has occurred. EL Approach Emergence Period: Expected Cash Flows: Contractual cash flows adjusted for expected credit losses. This involves reduction of future cash flow by the percentage of expected credit losses. Expected Loss Approach The expected loss model requires an entity to make an ongoing assessment of expected credit losses, which may require earlier recognition of credit losses. Recovery Cost It represents cost of recovery to recover the outstanding amount of the account, in case of default. Oracle Financial Services Software Confidential-Restricted 73 User Guide: Oracle Financial Services Loan Loss Forecasting and Provisioning, Release 1.5.0.0.0 Fair Value: Fic_MIS DATE: As defined by IASB, it is the amount for which an asset can be exchanged or a liability is settled, between knowledgeable, willing parties in an arm’s length transaction. This is OFSS specific terminology meaning current date or date stamp for which data belongs to which is also referred to as current date. Fixed interest rate: A loan or other financial asset with an interest rate that will remain at a constant rate for the entire life. (Maturity) Gain and Loss A gain or loss on a financial asset that is measured at amortized cost and is not part of a hedging relationship (see paragraphs 89–102 of IAS 39) shall be recognized in profit or loss when the financial asset is derecognized, impaired or reclassified in accordance with paragraph 5.3.2, and through the amortization process (IFRS 9 Phase1, PARA 5.4.2) Held for trading: A financial asset or financial liability is held for trading if: i) It is acquired or incurred principally for the purpose of selling or repurchasing it in the near term ii) on initial recognition it is part of a portfolio of identified financial instruments that are managed together and for which there is evidence of a recent actual pattern of short-term profit-taking; or iii) It is a derivative (except for a derivative that is a financial guarantee contract or a designated and effective hedging instrument). Held-to-Maturity securities (HTM): HTM Incurred But Not Reported (IBNR): IL Approach Impaired Asset: Security that a company intends to hold until its date of Maturity. Impairment Loss Impairment loss is the difference between the carrying amount of the financial asset before the change in estimate and the present value of the expected cash flows of that asset after including the change in estimate, that is, difference between carrying amount before change and amortized cost estimated after factoring the change This is the date from which IFRS 9 is applicable for a given bank. IFRS 9 tells us that on this date, the entity shall recognize the asset to be valued either as a fair value or amortized cost. For amortized cost this is the date on which EIR will be calculated. In case of applicable loans and bonds on this date Effective interest rate is calculated. Hence expected loss on this date will be zero. (IFRS 9 Phase 1) Under IAS 39, an entity accounts for credit losses in financial assets only if a loss event has occurred without considering the effects of future expected losses. Inception / Initial Recognition: Incurred loss Approach: Held to Maturity The losses pertaining to exposures that have not been reported as such by the obligor. Incurred Loss Approach An asset which is carried at more than its recoverable amount if its carrying amount exceeds the amount to be recovered through use or sale of the asset (Ref: IAS 36). However for the scope of this application impaired status is downloading. LLF&P This is an OFSS specific term. This means EIR or EIS of required exposures calculated as of initiation date are available for all future dates. This includes IRR of contractual cash flows as well. This data is available across the runs and for all future references. Suggestion has been received to change the same which will be done in the subsequent revision. Post first day of implementation, the LLF&P application will calculate EIR/EIS/IRR and store the same as part of initiation data, Loan Loss forecasting and Provisioning OBP(Oracle Banking Platform) This is similar to EL Run in terms of functionality, except that, it uses underlying tables compatible with OBP interface. Initiation Data: Oracle Financial Services Software Confidential-Restricted 74 User Guide: Oracle Financial Services Loan Loss Forecasting and Provisioning, Release 1.5.0.0.0 Period Applicable: This is the period for which Transition matrix is applicable. PM Provision Amount: Provision Matrix An expense set aside as an incremental allowance (Allowance = Loan loss Reserve) for bad loans over and above previous year allowance. This implies that to calculate amortized cost of an underlying asset the LLF&P Application will use provision rates and cash flows will not be generated for the same. The method is common for both impaired and non-impaired status of the ‘Receivable type of assets’. This is an OFSS specific term. Provision Method: TM Transaction costs Transition Matrix They are incremental costs that are directly attributable to the acquisition, issue or disposal of a financial asset or financial liability (see Appendix a paragraph AG13). An incremental cost is one that would not have been incurred if the entity had not acquired, issued or disposed of the financial instrument (IAS 39, PARA 9) Variable interest rate: An interest rate that changes according to the underlying or Benchmark interest rate index like Treasuries or LIBOR rates Oracle Financial Services Software Confidential-Restricted 75 User Guide: Oracle Financial Services Loan Loss Forecasting and Provisioning, Release 1.5.0.0.0 Oracle Financial Services Loan Loss Forecasting and Provisioning, Release 1.5.0.0.0, User Guide July 2013 Version number 1.0 Oracle Corporation World Headquarters 500 Oracle Parkway Redwood Shores, CA 94065 U.S.A. Worldwide Inquiries: Phone: +1.650.506.7000 Fax: +1.650.506.7200 http://www.oracle.com/us/industries/financial-services/ Copyright © 2013, Oracle and/or its affiliates. All rights reserved. No part of this work may be reproduced, stored in a retrieval system, adopted or transmitted in any form or by any means, electronic, mechanical, photographic, graphic, optic recording or otherwise, translated in any language or computer language, without the prior written permission of Oracle Financial Services Software Limited. Due care has been taken to make this Oracle Financial Services Historical Transition Matrix User Guide and accompanying software package as accurate as possible. However, Oracle Financial Services Software Limited makes no representation or warranties with respect to the contents hereof and shall not be responsible for any loss or damage caused to the user by the direct or indirect use of this User Manual and the accompanying Software System. Furthermore, Oracle Financial Services Software Limited reserves the right to alter, modify or otherwise change in any manner the content hereof, without obligation of Oracle Financial Services Software Limited to notify any person of such revision or changes. All company and product names are trademarks of the respective companies with which they are associated. Oracle Financial Services Software Confidential-Restricted 76


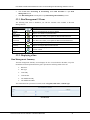
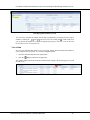
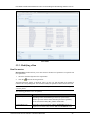
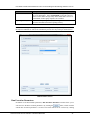
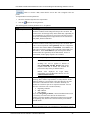
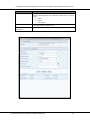
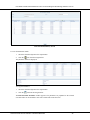
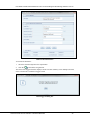


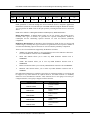

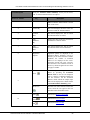
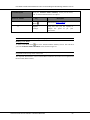
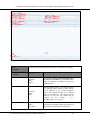
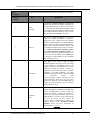
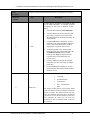

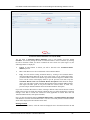
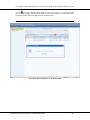


![T] .1](http://vs1.manualzilla.com/store/data/005831826_1-5c5b79be6c7f2f902c022f1ff12b7474-150x150.png)