1
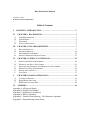
Data Extraction Cookbook
September 2, 2003
D:/data/extraction cookbook.doc
Table of Contents
I.
CHAPTER 1: INTRODUCTION ............................................................................. 3
II.
A.
B.
C.
D.
III.
A.
B.
C.
D.
IV.
A.
B.
C.
D.
E.
F.
V.
A.
B.
C.
VI.
CHAPTER 2: BACKGROUND ........................................................................... 3
USER REQUIREMENTS ............................................................................................. 3
USER SUPPORT ........................................................................................................ 4
EQUIPMENT............................................................................................................. 4
STARTUP PROCEDURE............................................................................................. 6
CHAPTER 3: DATA REQUIREMENTS ............................................................ 7
WEATHER IMPACTS ................................................................................................ 7
INCIDENTS IMPACTS.............................................................................................. 10
DETERMINE PEAK P ERIODS .................................................................................. 16
IDENTIFY MODELING P ROJECT LIMITS.................................................................. 19
CHAPTER 4: EXTRACT SYSTEM DATA ...................................................... 20
IDENTIFYING DETECTOR NUMBERS ...................................................................... 20
DECIDE ON THE DATA PULL OPTION .................................................................... 20
SELECTING THE MAINLINE AND RAMP DETECTOR NUMBERS ................................ 23
DEFINE DATA PULL PARAMETERS ........................................................................ 24
EXTRACTING THE DATA ....................................................................................... 32
SAVE DATA .......................................................................................................... 33
CHAPTER 5: RAMP CONTROL DATA .......................................................... 34
CONTINUITY REPORT ............................................................................................ 34
RAMP METER ANALYSIS ....................................................................................... 35
IRIS RAMP ANALYSIS HELP ................................................................................. 40
APPENDIX ............................................................................................................ 40
Appendix A: All Detector Report
Appendix B: DataPlot User Manual
Appendix C: DataExtract User Manual
Appendix D: IRIS User Manual
Appendix E: Stratified Zone Metering – The Minnesota Algorithm
Appendix F: Ramp Metering System Status
List of Figures
Figure III-1 Data Extraction Flowchart .............................................................................. 8
Figure III-2 National Weather File ..................................................................................... 9
Figure III-3 Local Climatological Data ............................................................................ 10
Figure III-4 Selection Tool Main Form, Highway/Month Tab......................................... 11
Figure III-5 Timeframe, Data and Impact......................................................................... 12
Figure III-6 More Selection and Save Tab........................................................................ 12
Figure III-7 Data Table Tab .............................................................................................. 15
Figure III-8 Report Tab..................................................................................................... 16
Figure III-9 DataPlot Main Screen.................................................................................... 17
Figure IV-1 Save File Formatted Text .............................................................................. 22
Figure IV-2 DataExtract Main Menu................................................................................ 23
Figure IV-3 Composite File Example ............................................................................... 28
Figure IV-4 Data File Example- Speed.csv...................................................................... 29
Figure IV-5 Data File Example- Volume.csv................................................................... 30
Figure IV-6 Data File Example- Density.csv ................................................................... 31
Figure V-1 IRIS Report Main Menu................................................................................. 34
Figure V-2 Ramp Meter Analysis ..................................................................................... 35
Figure V-3 Ramp Meter Timing Example ........................................................................ 38
Acknowledgements
I want to acknowledge the contribution of the following individuals for making the Data
Extraction Cookbook a reality. Tim Johnson developed and customized the DataExtract
program to meet our modeling needs. This task reduced the time to extract system data
from days to a few minutes. Denise Hesselroth developed Metro Incident Selection Tool
(MIST) and supportive documentation. MIST is the front-end application to Mn/DOT’s
Incident log database. Denise took this opportunity to work with RTMC staff and make
enhancements to the Incident Log. Jim Cray was instrumental in setup and configuring
the data extraction workstation at the Waters Edge facility and working through the
security issues. Teresa Hyde provided valuable supportive system data and information
including the All Detector Report, Ramp Metering Status, and Ramp Control System that
included in the Appendix. I also want to thank Deb Bishop for reviewed and edited the
Data Extraction Cookbook.
2
I.
Chapter 1: INTRODUCTION
This Data Extraction Cookbook was put together to aid external clients in pulling system
data and information. The demand for system information has steadily increase over the
years as the instrumented system expanded to cover the majority of the TCMA roadway
network. The system data is used for many purposes including planning, design and
research. Mn/DOT is looking into creatively ways of providing this information more
efficiently and effectively. Some of the factors that precipitated this need include the
new Federal modeling requirements, State budget shortfall, and limited staff resources.
The instrumented portion of the Freeway Management system is the primary source of
this data. The system data includes volume and occupancy data from mainline and ramp,
loop detectors, and ramp metering rates. The data is stored every 30 seconds, twentyfour hours a day. The data extraction cookbook, tool documentation, and resource
materials are available on the Mn/DOT Metro Division web site:
http://www.dot.state.mn.us/metro/trafficeng/modeling and can be downloaded.
A copy of this resource document is available at the Mn/DOT’s Water Edge facility and
should not leave the work area located in Traffic Engineering.
II.
Chapter 2: BACKGROUND
This chapter outlines the user requirements, contacts for user support, hardware and
software available to customers, and the startup procedure to access the data.
A. User Requirements
Below explains the user requirements for customers using Mn/DOT facilities and
equipment to extract data and information. Please contact Gabriella Tsurutani
at (651) 634-5277, if you have a large data pull that could impact the Freeway
Management System or computer network.
• Register at the Front Desk
External clients are required to register at the Waters Edge front desk. The
data extraction computer is located on the second floor in Traffic
Engineering. The receptionist on the second floor will direct you to the
workstation.
• Data pulls are conducted during off-peak period
Data extraction should be conducted during the off-peak periods, between
the hours of 9:00 A.M and 3:00 P.M.
3
• Bring CD or Floppy Disks
The external customer is responsible for supplying their own CD or floppy
disks to store the extracted data.
• Sign the Log Book
We ask that you sign- in the logbook and record any problems, questions,
and/or comments that you may have on the documentation, tools, or
equipment provided. This will allow us a way to continuously improve
this service.
B. User Support
Below is a list of resources available to you if you experience problems with the equipment and
software/tools or if you have technical questions.
Support Area
Computer
Specific Topics
Physical computer,
network, & office packages
DataExtract, DataPlot, and
IRIS reports
Ramp Metering status or
timing,
Control room observations
Extraction Tools
Technical
Questions
Data Extraction
Modeling data requirement
Contract
Metro MIS Unit
Jim Cray (651) 582-1202
RTMC Computer Support
Tim Johnson (651) 634-5252
RTMC Operation
Gabriella Tsurutani (651) 634-5277
RTMC Operations
Teresa Hyde (651) 634-5311
Metro Modeling Unit
Linda Taylor (651) 634-2126
Table II-1.1 Support Area Contact List
C. Equipment
The workstation provided has been configured to facilitate your data extraction process.
The system is set-up to allow you access only to the systems, information, data, and
software packages required to perform the functions necessary to access, select, extract,
and store data identified within the Data Extraction Cookbook. Desktop icons have been
developed for each application software package.
1. Office Packages
The following office packages are loaded on the workstation:
• Access 97 (This is the version of software currently used by RTMC for their
detector, ramp meter and incident databases).
• Office 2000 - Word
• Office 2000 - Excel
• WipZip version 8.0
• Ez CD creator version 5.0
4
Several data extraction programs have been developed internally over time for different
purposes. Below provides a listing of the tools/programs available to you and a brief
description of how they can facilitate the data extraction process.
a) DataPlot Program
DataPlot is a program for visualizing freeway traffic data in the Twin Cities Metropolitan
Area. DataPlot has access to 3500+ traffic detectors on the instrumented freeway system.
The “All Detector Report” provides a listing of available detectors. This document is
available to you in many formats:
• A hardcopy format can be found in Appendix A: All Detector Report.
• On-line copy is accessible from the Waters Edge workstation by selecting the
“All Detector Report” icon.
• Electronic copy is available on the Mn/DOT web:
Http://www.dot.state.mn.us/metro/trafficeng/modeling
Traffic data is available from 1994 to present day. This program allows the user to
graphically plot system detectors. The DataPlot program is capable of plotting either
one detector with multiple dates, or multiple detectors (up to 10) with one date. Refer to
Appendix B for the hardcopy of the DataPlot program. This program is very useful in
determining if a detector is malfunctioning and to determine peak periods.
b) DataExtract Program
Data Extract is a graphical program for retrieving historical traffic data for the Twin
Cities Metropolitan Area. It is designed to simplify the extraction process and is not
intended to be a tool for data manipulation (although a limited set of manipulation tools
are available). A copy of the DataExtract User manual is located in Appendix C.
c) IRIS Reports
The IRIS reports were developed over time to address specific needs by the operations,
maintenance, and integration staff for accessing system data. The ramp meter analysis
and continuity reports are useful for modeling.
The Ramp Meter report provides the ramp meter timing for a specific day. This
information replicates the ramp metering timing within CORSIM. The Continuity report
provides a means to quickly review a roadway segment and identify mainline and/or
ramp detectors that are problematic. The RTMC Operations unit uses this program to
evaluate the existing system. Reference Appendix D, for a copy of the IRIS User
manual.
5
D. Startup Procedure
Below outlines the procedure for accessing the Metro data extraction workstation.
• Sign in at the Water’s Edge front desk and receive a visitor badge. Take the
elevator to the second floor turn right to the Metro Traffic Engineering office.
The traffic receptionist will direct you to the data extract computer workstation.
• Sign the data computer logbook located at the computer workstation. The
workstation positioned behind the receptionist desk.
• Turn the computer on by selecting the power switch on the central processing
unit.
Once the computer is power on, the main screen is configured to facilitate the extraction
of system data and information.
6
III. CHAPTER 3: DATA REQUIREMENTS
This chapter walks you through the process of extracting system data using the data and
tools provided by Mn/DOT. The system data extraction flowchart is documented in
Figure 1. This flowchart will be reiterated throughout the text to reinforce the steps in the
process.
The first step in the process is to determine feasible dates that can be used to pull
system data. Outlined below are the steps in the process:
Step 1: Start by selecting and printing out a calendar for September
October timeframe for the previous year.
Step 2: Eliminate Fridays, Saturdays, Sundays and Mondays.
Step 3: Eliminate holidays and the days proceeding or following a
holiday.
Step 4: Eliminate bad weather days.
Step 5: Eliminate dates that the roadway is impacted by incidents.
A. Weather Impacts
The weather information can be accessed from the National Weather Service
Forecast Office. This site has weather information by month and year for the
Twin Cities Metropolitan Area. Select the month and year of interest. Typically,
this is last year for September and October timeframe. Below outlines the steps
necessary to identify days that should be eliminated due to bad weather.
Step 1: Log onto the National Weather Service web site: .
7
Figure III-1 Data Extraction Flowchart
8
Step 2: Select the appropriate file.
Typically, the dataset used is the previous year and either late September or early
October timeframe.
For example, for September 2002 weather data select the file:
mpxsep2002.html.
Figure III-2 National Weather File
Step 3: Build a Calendar
The calendar should identify all possible data extract days. Start by eliminating
Fridays, Saturdays, Sundays and Mondays and any days following a major
holiday. When selecting dates in September and October, remember to exclude
the day after Labor Day and Halloween.
Review the weather information provided. Pay particular attention to columns 7
(WTR-precipitation), 8 (SNW-snowfall amounts) and 16 (unusual events). Snow
dates and dates flagged in column 16 should be eliminated. Precipitation of .20
inches or greater should be eliminated.
9
Figure III-3 Local Climatological Data
Step 4: Check the weather information recorded in the Mn/DOT’s Incident log.
Step 5: Update the calendar of possible date(s) and proceed by checking for
incident impacts.
B. Incidents Impacts
The IncModeling.mdb is a “front-end” database linked to a copy of the Mn/DOT Incident
Log database. This front-end program streamlines the preprocessing of the Incident Log
database to help identify incident impact days that should be eliminated. The end user is
able to query the database by specific criteria (year, month, highway, and impact type),
which is selectable from the main screen.
To access the front-end application, click on the MIST (Metro Incident Selection Tool)
icon on the desktop. This will automatically bring up the front-end form and link you to
the database.
10
This is the opening form:
Figure III-4 Selection Tool Main Form, Highway/Month Tab
Step 1: Select a Year and Month
A year must be entered. The current year is entered by default. Select a
month by clicking
on the drop down button and clicking on the month.
Step 2: Select a Highway
Start by selecting the Highway from the drop down menu or just type in its
number in the box. The program will automatically generate a list of
crossroads. You have the option to select the entire roadway or a segment of
the roadway by clicking either “Entire Highway” or (if you have selected two
crossroads) “Selected Crossroads ”. Your selected parameters will appear in
the boxes at the top of the form.
Step 3: Click the Timeframe, Date and Impacts Selection tab, which is located at
the top of the form to select the timeperiods, days and impacts to include in the query.
11
Hint:
You can change the
values in the top
five boxes “by
hand” instead of
going back to the
first tab.
This way you can
quickly look at each
month for the same
set of parameters.
Figure III-5 Timeframe, Data and Impact
This is the second tab:
Figure III-6 More Selection and Save Tab
12
From here you can further narrow down the selection of incid ents:
-
Choose a timeframe for the AM rush hour and the PM rush hour
o If you want to include all times just click on the pre-selected times to
deselect them.
o If you select more than two times the program will only use the first two
selected times.
o If you select only one time it
uses that as the From time.
-
Choose at least one set of days from
the center two boxes.
Choose to include the smaller
impact incidents if you wish.
Click Count Incidents.
-
Incidents will be counted by date.
To eliminate holidays, days after
holidays, days of bad weather, etc. :
-
Click on the day(s) you want to
remove.
Click “Add selected dates to the ‘excluded’ list” button
The selected dates are added to the EXCLUDED dates list
13
Hint:
The text of the buttons turns black
or gray to remind you that new
selections may have changed the
results that are showing.
However, the buttons are still
active no matter what color their
text is.
You must click the Count Incidents button again to exclude them from the results.
Click the “SAVE DATA” button to
save the details of the selected
incidents to an Excel spreadsheet.
You do not have to click “Count
Incidents” before clicking “SAVE
DATA”.
- The file is given the name of the
highway, year and month like
this:
o US169_2002_9.xls or
I394_2002_10.xls
-
The file is saved in the subdirectory noted on the “Data Tables” tab (see next
page).
14
Figure III-7 Data Table Tab
The subdirectory where the output files will be saved is shown.
You can change this to save to another location. However, if using this database on
the network then all users should have access to this subdirectory. Saving to the C:
drive lets all users save their own work without being overwritten.
The look- up table for the highway selection list is shown. If incidents start being
logged for new highways you can add them to this list. Those highways will only be
found if they exist on the MilePointTBL table which is linked from the database
copied from RTMC. Metro MIS can help to make sure all underlying tables are up to
date.
15
Figure III-8 Report Tab
Select a report. You can view and/or print the report.
Reports are based on the selection criteria defined in the five boxes at the top and the
selections on the “More Selections and SAVE” tab. You do not need to click the
Count Incidents or SAVE DATA buttons to run a report.
C. Determine Peak Periods
The peak period varies considerable across the Twin Cities Metropolitan Area
roadway system. Mn/DOT typically uses 6:00 to 9:00 A.M for the AM peak and
3:00 to 6:00 P.M. for the PM peak. This peak period changes significantly as you
move away from the central business district toward the outer beltline. The
DataPlot program is used to review the mainline detector stations and to
determine the peak periods.
Step 1: Select the DataPlot icon from the desktop. This will bring up the DataPlot
main screen.
16
Figure III-9 DataPlot Main Screen
Step 2: Select the date from the calendar by using the arrow tabs to select the year
and month. Click on the date to select the day.
Step 3: Select 15 minutes under the smoothing tab
Step 4: Enter the mainline detectors by entering the detector identification.
Example: On TH 100 WB, the mainline station is 419. Station 419 is
made up of three detectors: 1298, 1299 and 1300.
Make sure that all the detectors entered are actively recording data.
17
Example: On TH 100 EB, the mainline station 377 (detectors 1260, 1261 and
1262). Detectors 1260 and 1261 are bad.
18
Step 5: Select the view tab in the left hand corner of the screen. Highlight the
Y-axis and select speed parameter. This will display the speed profile for the
same date and year selected.
Step 6: Clear detectors and enter another series of mainline detectors. Repeat step
4 for several mainline station detectors. Record the AM and PM peak periods.
Step 7: Review the results and determine AM and PM peak periods for modeling.
D. Identify Modeling Project Limits
The modeling project limits are defined and mutually agreed upon at the initial
modeling meeting. Section 2.1.2, in the Advanced CORSIM manual, outlines the
criteria used to identify the modeling limits. Do not assume that the
construction limits are the modeling limits. Microscopic modeling packages
(CORSIM, AIMSUN, and VISSIM) all require you to start the modeling in an
uncongested state for the model to work. This may require you to expand the
model several miles outside of the construction limits or to modify the modeling
time increments.
The procedure for identifying the modeling projects limits is similar to
determining the peak periods. The DataPlot program is used to evaluate the
mainline station detectors. You should be looking at the system data to determine
freeflow conditions and/or uncongested traffic flow.
19
IV. CHAPTER 4: EXTRACT SYSTEM DATA
This section explains the process used to identify and make a list of the detectors that are
needed to gather data for modeling projects.
A. Identifying Detector Numbers
Once the start and end points of a modeling project has been determined, make a list of
the detector numbers using the “All Detector Report.” Break up the data by major
freeway and direction. Detectors should be recorded in the sequential order of the
direction of traffic flow. This same sequencing will be used in the output format.
Splitting up the files in this fashion helps keep the file smaller and more manageable.
In addition, queue detectors are typically not extracted; however, this information may be
useful if there is a missing or bad detector. HOV ramp volumes are usually very low and
not considered unless the project specifically calls for this information.
B. Decide on the Data Pull Option
This step provides two examples of ways that data can be extracted. Each process has
advantages and disadvantages. You need to decide which option works best for your
project. This may change with the project size, volume of data extracted, and post
processing tools available to manipulate the data.
1. Direct Data Pull
Directly enter all of the necessary mainline and ramp detectors into the Data Extract
program. For example, to model I-394 from I-494 to TH 100:
• Open the “All Detector Report” to the I-394 page.
• Starting at I-494 make a list of all the detector numbers on I-394 in the eastbound
direction. For example: 1645, 1646, 1647…Be sure to keep the list of detector
numbers organized so that they are sorted in the direction that traffic flows.
• Save this list of detectors as an Excel file and name it “394EB Detectors.”
• Open the All Detector Report to the I-394 page.
• Starting at TH 100 make a list of all the detector numbers on 394 in the
westbound direction. Be sure to keep the list of detector numbers organized so
that they are sorted in the direction that traffic flows.
• Save this list of detectors as an Excel file and name it “394WB Detectors.”
Advantages:
- Faster for smaller modeling projects involving less than about 100 detectors
per extraction.
- An easy, straight- forward approach to pulling data. You don’t need to build
Excel tables.
20
Disadva ntages:
- Detectors may be missing because of human errors (oversight, typographical
errors, etc.)
2. Indirect Data Pull using Importing Function
This option allows the user to import a list of detectors directly into the Data Extract
program. The user will to create an input file in any text editor. Common editors
include notepad, textpad, and Microsoft Word. The document format requirement are:
1) one entry per line,
2) line start with either a “d” or “s” and a space, then
3) the detector or station number
Below outlines the procedure using Excel program and building the list of detectors and
import it into the Data Extract Program. This is just one way to facilitate the date
extraction procedure for a large, complex modeling projects.
For example, to model I-394 from I-494 to TH 100:
Step 1: Open a blank Microsoft Excel spreadsheet.
Step 2: Open the “All Detector Report” to the I-394 page. Starting at I-494 make a list of
the entire detector numbers on I-394 in the eastbound direction by typing them into the
left most column in Excel. For example: 1645, 1646, 1647…Be sure to keep the list of
detector numbers organized so that they are sorted in the direction that traffic flows.
Step 3: Save this list of detectors as an Excel file and name it “394EB Detectors.”
Step 4: Insert a column to the left of the column containing the detector numbers. Type a
lower case “d” in each cell of the column next to the detector numbers.
21
Step 5: Save this new list as a “Formatted Text (Space delimited)(*.prn)” file with the
same name (394EB Detectors).
Figure IV-1 Save File Formatted Text
Step 6: Open Data Extract program by clicking on the desktop icon. Now the list of
detectors can be directly imported into Data Extract program.
Step 7: In the upper left section of the Data Extract window, select the detector button.
Step 8: Click the “Import” button.
Step 9: Select the file name “394EB Detectors.prn” and click OK.
This detector selection process is now complete. The detector numbers have been
selected in Data Extract without having to manually enter each one.
Advantages:
- The end user can easily check and verify that all impacted detectors have been
identified.
- These Excel files can be built in advance.
- The files can be easily edited and updated if there are changes to the project
limits or missing detectors or detector incorrectly entered.
22
Disadvantages:
- The end user needs to be familiar with Excel and data format structure.
Figure IV-2 DataExtract Main Menu
C. Selecting the Mainline and Ramp detector numbers
The data extract option selected will determine how the detector information is entered
into the Data Extraction program. Below outlines the direct option for pulling detector
information:
•
•
•
Print a copy of the Excel file “394EB Detectors”
Open Data Extract
In the top left section of the Data Extract box, click the “Detector” button.
Place the cursor in the white box that is about two inches to the right of the
word “Search:”
Type the first detector number and press enter. The cursor will remain in that
white box. Enter the remaining detector numbers in this fashion. Continue to
enter all affected detectors. If the detector number is entered incorrectly, select
the detector and click on the “Remove” button. Below is an illustration of how to
enter the detector numbers.
23
D. Define Data Pull Parameters
1. Selecting the Time Frame and Interval Length
Locate the lower left section of the Data Extract window. This is where the time frame
and interval length are entered. For example, if a project calls for volume counts from
6:00-9:00AM and 3:30-6:30PM at count intervals of 15 minutes, follow this procedure:
•
•
Move the cursor to the white “Start:” box and enter 6:00
Next, move the cursor to the white “End:” box and enter 9:00
•
Click on the drop-down box next to “Smoothing:” and select 15minutes
•
•
•
•
•
Click “Add”
Move the cursor to the white “Start:” box and enter 15:30 (Military Time )
Next, move the cursor to the white “End:” box and enter 18:30 (Military Time )
Click “Add”
Verify the correct time period has been selected.
24
This procedure is illustrated below:
2. Selecting the Date
Locate the upper right section of the Data Extract window that contains the calendar.
Click on the day(s) that data is to be pulled from. For example, to extract data from
October 2nd and 10th 2002 simply find the October 2002 calendar and click the days.
For modeling, the date selected should represent a typical day, which is not impacted by
incidents or weather.
25
NOTE: Be sure to clear the dates selected on the calendar if you are pulling data for a
different project. This is to ensure that no dates are selected that are not supposed to
be selected. This can be done by simply clicking “Clear” button located below the
calendar in the upper middle section of the Data Extract window.
3. Selecting the Type of Data to be gathered
Locate the upper right section of the Data Extract window. Click on the box next to the
type(s) of data that needs to be extracted. Typically for modeling examples, we
recommend selecting volume, density, and speed data. These data types can be selected
by clicking on the boxes next to the corresponding word.
26
4. Define the File Name and Storage Location
To enter the file name, move the cursor to the white box next to “File Name:” in the
lower right section of the Data Extract window and type “filename.”
For example, for the 394 eastbound data extraction example mentioned in section 1
above, enter “394 EB Data” in the white box.
Define the file storage location by simply click “Browse…” and select the drive and
direction location where “394EB Data” is to be saved.
5. Select the File Format Structure
There are many different file format structures available within the Data Extraction
program. Two file formats (Composite and Data) have been formatted to facilitate the
extracting data for modeling projects. The same data and information is available
through both options. The data is just presented and formatted differently depending on
the option selected.
27
The major difference between the two options is that the composite file option places all
the data in one file and the user defines the file name, while the data file option creates a
file for each data type selected with a default name.
The “Composite File” format allows the end user to enter a file name and writes all the
data to this file (filename.csv). Below is the Excel file created for this option. Notice
that the detector information (volume, density and speed) is provided in sequential order
for each timeperiod.
Figure IV-3 Composite File Example
The “Data File” format creates a comma separated value (csv) file for each data type
selected. The files are stored on the hard disk in D:/temp directory. For example, if you
selected volume, density and speed; the following default files would be created based on
the data extract criteria selected:
Default filenames
- speed.csv
- volume.csv
- density.csv
Stored filena me
- 394EBspeed.csv
- 394EBvolume.csv
- 394EBdensity.csv
28
These files should be renamed and stored on disk prior to proceeding with your next data
extraction. Caution: The default files are over-written with each data extraction query.
Below are the sample default files created using the data file format. The speed file
contains speed data for each detector and time period identified. This data is very useful
when calibrating the existing system.
Figure IV-4 Data File Example- Speed.csv
29
The volume file provides the volume data for each detector and timeframe identified.
You should note that this file is structured in the same sequence as the speed and density
file. This format is helpful in identifying suspect and bad detectors.
Figure IV-5 Data File Example- Volume.csv
30
Below is an example of the density file created.
Figure IV-6 Data File Example- Density.csv
6. Select the Export Options
There are several data export options available including values, sum, average, time
median, day median, and sample. Select the export options by clicking on the box next to
the value. For example, if you want the raw data values (volume, density and speed)
select the “Values” option by clicking on the box in the lower right section of the Data
Extract window.
7. Select the Time Ranges Configuration
Use the “Time ranges in:” drop-down box to select the configuration of the time field in
the “394EB Data” file that is about to be pulled. To set time ranges to a columns format
click the drop-down menu and select “Columns.” Either Column or Rows can be
selected, but be aware that the number of columns are limited within Excel. This may
cause a problem when extracting large datasets. To set time to be in rows click the dropdown menu and select “Rows.” We recommend selecting the “Rows” time range format
to eliminate this problem.
31
E. Extracting the Data
Once all of the parameters have been set the data is ready to be pulled. Simply click on
the “File” menu at the top left corner on the tool bar and select “Extract Data.” Data
Extract will notify the user when the extraction is complete.
•
•
•
Verify the data file was created and stored to hard disk. Go to the d:/temp
directory and open the file.
Verify the data is in the correct format. This is a good time to note the detector(s)
that are bad.
Rename the default Excel files, if you have selected the Data file format.
For example, if an extraction was performed in which volume data was pulled into a
“Data” file, the file will be named “data.” You will need to open and rename (394EB
Data) this file after the extraction is complete.
32
F. Save Data
The data extraction for the mainline and ramp loops is complete at this point. You can
now proceed to store the data to disk. The wipzip software has been provided to aid you
in storing these files in an efficient format.
33
V. CHAPTER 5: RAMP CONTROL DATA
This section explains the IRIS report options available and walks you through the process
of identifying a list of the affected ramp meter query data to determine the ramp metering
timing to use within CORSIM.
Below is a listing of IRIS Report Options available to assist you in extracting ramp
metering information and verifying detector data. The Continuity Report and Ramp
Metering Analysis Reports are the most useful. The IRIS user manual can be found in
Appendix D.
Figure V-1 IRIS Report Main Menu
A. Continuity Report
The continuity report provides a quick review of the current status of the detector system.
The report can be used to help identify detectors that are not functioning, undercounting,
or off- line.
The Ramp Meter Analysis allows the user to query for the ramp meter timing on a
specific day and time period.
34
B. Ramp Meter Analysis
Below outlines the procedure for acquiring the ramp metering timing in the affected
project area using the IRIS Ramp Meter Analysis program.
1. Identify affected ramp meters
Refer to the Mn/DOT Traffic Management map or list of ramp meters in Appendix G.
Identify and develop a list of meters within the modeling project limits.
2. Determine ramp meter operations
Cross reference the list of ramp meters with the current operating ramps by checking
Appenidx H, listing of stratified ramps meters. Contact the Mn/DOT’s RTMC Operation
unit at (651) 634-5311 to verify the ramp meters operations during peak periods.
3. Extract ramp meter rates
Figure V-2 Ramp Meter Analysis
35
Click on the “Ramp Analysis” desktop icon, to extract ramp metering rates using the
IRIS Ramp Analysis program
Step 1: Enter the ramp metering identification number. For example: m100n32
Step 2: Enter the start and end time in (hh:mm:ss) format. For example: 6:00:00 means
6:00 A.M.
Step 3: Select the date
This date field can be either entered directly or through the calendar icon.
Direct Entry: Entering the date directly in the following format (mm/dd/yyyy).
Example: 10/16/2002
Calendar Entry: Start by clicking on the calendar icon. Select the month and year,
and then double click on the date to fill- in the date field
Step 4: Submit the Query
Review the output file and write the information to disk.
36
4. Interpreting Output
Figure V-3 provides a sample of the meter timing output. The cycle time is the time
between the beginnings of one green to the beginning of the next green for one signal.
This includes the red, yellow and green portions of the meter. For ramp meter (m100n32
at 7:15 am), there is 10 seconds between greens for each meter.
Approximately 2 seconds is used for the yellow and green. The green is allocated 1.3
seconds and the yellow .7 seconds. This is true for any ramp meter.
The green count is the number of cycles in a 30 second time period. This is also the
number of vehicles that pass the meter in 30 seconds. For m100n32 at 7:15 am, the green
count is 3. This means that each meter is letting 3 vehicles pass during that 30-second
interval. As we are using dual metering, 6 vehicles can enter the freeway during this 30second period.
For the parameters, use 2 vehicles per green with the headway set to the cycle length.
This should account for the dual metering that is used at these locations.
Example of how the ramp meter timing is coded into CORSIM.
37
5. Save and Store Files
Step1: Select the Download csv file from the Ramp Meter output query screen.
Step 2: Select the option to save this file to disk
Figure V-3 Ramp Meter Timing Example
Step 3: Select the drive from the pop-down menu on the Save as screen.
38
Step 4: Enter a unique filename for each meter. We recommend using the metering
identification in the filename.
Step 5: Repeat this process until you have stored ramp meter timing for all affected ramp
meters.
Step 6: Verify that all the files have been stored on CD or Floppy drive.
Step 7: Data extracted from the ramp meter timing is complete.
Step 8: Shutdown the computer
Step 9: Sign out in the logbook and enter any suggestions or comments.
39
C. IRIS Ramp Analysis Help
Any numbers that are followed by an asterisk (*) indicate that there is a missing value or
number. If a number is replaced by a question mark (?), this means that either all of the
values for that total were missing or the result of the calculation was not a number (ie.
division by zero).
1. Column Descriptions
Time: The start time in (hh:mm:ss) format for a 30-second interval.
Cycle Time: The number of seconds to complete the cycle of red, yellow, green.
Green Count: The number of greens given in that 30 second time interval.
Greens/Merge: The ratio of the number of greens given to the merge detector volume.
Queue Occupancy: The occupancy on the queue detector for the 30-second interval.
Queue Volume: The volume measured by the queue detector for the 30-second interval.
VI. APPENDIX
40