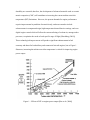
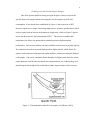
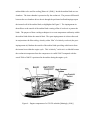
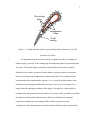
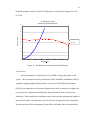
1
ABSTRACT
The Design and Validation of an Impinging Jet Test Facility
Peter R. Robertson
Mentor: Kenneth Van Treuren, Ph.D.
An experimental jet impingement facility was constructed with the capability of
conducting a detailed analysis of the local heat transfer coefficients beneath an array of
large impinging jets. The facility was validated with initial heat transfer studies that
determined an appropriate jet discharge coefficient of 0.802 and created a correlation
relating local jet Reynolds number and stagnation point heat transfer. The correlation
matched closely with previous studies. The thermal effects of impinging jets were
visualized by liquid crystal thermography. The resulting thermal footprints of
downstream jets revealed the first known documented case of the heat transfer effects of
hairpin vortices on the target surface. This phenomenon was identified and discussed.
Copyright © 2005 by Peter R. Robertson
All rights reserved
TABLE OF CONTENTS
LIST OF FIGURES .............................................................................................
vi
LIST OF TABLES...............................................................................................
viii
LIST OF ABBREVIATIONS..............................................................................
ix
ACKNOWLEDGMENTS ...................................................................................
xiii
DEDICATION.....................................................................................................
xv
CHAPTER ONE ..................................................................................................
1
Introduction......................................................................................................
1
Jet Impingement Background and Applications ..........................................
1
Performance in Gas Turbine Engines..........................................................
1
Challenges of a Gas Turbine Engine Designer ...........................................
4
Jet Impingement in the Gas Turbine Engine................................................
5
Statement of Problem...................................................................................
7
Aims and Objectives.....................................................................................
8
CHAPTER TWO .................................................................................................
9
Literature Review ............................................................................................
9
Introduction to the Literature ......................................................................
9
Review of Experimental Facilities ...............................................................
9
Impinging Jet ...............................................................................................
12
Single Jet......................................................................................................
14
Multiple Jets.................................................................................................
17
Unconfined Jets........................................................................................
17
Confined Jets............................................................................................
17
iii
Array Configurations ...............................................................................
22
Heat Transfer Enhancement Elements.....................................................
25
CHAPTER THREE .............................................................................................
26
Theory..............................................................................................................
26
Heat Transfer Model....................................................................................
26
Liquid Crystal Theory ..................................................................................
28
Thermochromatic Liquid Crystals ...........................................................
28
Transient Liquid Crystal Technique ........................................................
30
Double Crystal Technique Using Liquid Crystal Intensity......................
34
CHAPTER FOUR................................................................................................
36
Design of the Experimental Jet Impingement Facility ....................................
36
Introduction to the Experimental Design.....................................................
36
Experimental Apparatus Overview ..............................................................
36
Experimental Design and Component Sizing ..............................................
39
Prediction of Flow Losses in the Facility ................................................
39
Fan Selection ...........................................................................................
41
Piping and Orifice Plate ..........................................................................
43
Diffuser Plenum .......................................................................................
45
Flow Straighteners...................................................................................
49
Heater Mesh.............................................................................................
52
Test Section ..............................................................................................
55
Image and Data Acquisition ....................................................................
61
CHAPTER FIVE .................................................................................................
66
Experimental Investigation ..............................................................................
66
Instrumentation ............................................................................................
66
iv
Experimental Procedure ..............................................................................
67
Liquid Crystal Calibration Method .............................................................
71
Jet Hole Discharge Coefficient....................................................................
72
Local Heat Transfer Coefficient ..................................................................
75
Flow Field Interpretation ............................................................................
77
CHAPTER SIX....................................................................................................
87
Conclusions and Recommendations ................................................................
87
Summary of the Current Work .....................................................................
87
Recommendations to Improve the Current Facility.....................................
88
Recommendations for Future Work .............................................................
90
APPENDICES .....................................................................................................
92
REFERENCES ....................................................................................................
124
v
LIST OF FIGURES
Figure 1 – Effects of RIT on engine power output ..............................................
2
Figure 2 – Introduction of cooling technology and its effect on RIT ..................
3
Figure 3 – Thermodynamic tradeoffs in an engine cycle ....................................
4
Figure 4 – Engine components of a GE CF6 turbofan.........................................
6
Figure 5 – Cooling schematic within a typical turbine blade ..............................
7
Figure 6 - The characteristic regions of an impinging jet....................................
14
Figure 7 – Local Nu maxima for various nozzle geometries...............................
16
Figure 8 – Impinging jet in crossflow..................................................................
18
Figure 9 – Test section nomenclature ..................................................................
19
Figure 10 – Pre-impingement jet interference .....................................................
20
Figure 11 – Jet fountain .......................................................................................
20
Figure 12 – Influence of crossflow on impinging jet structure............................
21
Figure 13 - Impingement plate with varying jet hole diameter and spacing .......
23
Figure 14 – Reorientation of TLC lattice structure..............................................
29
Figure 15 – Aqueous mixture of encapsulated crystals and binder solution .......
30
Figure 16 – Schematic of semi-infinite solid assumption....................................
32
Figure 17 – Baylor University impinging jet test facility ....................................
37
Figure 18 – Experimental Facility .......................................................................
37
Figure 19 – Prediction curve for maximum fluid flowrate ..................................
41
Figure 20 – Blower fan and nozzle for the current facility..................................
42
Figure 21 – Side view of the orifice and piping for the current facility ..............
45
Figure 22 – Inlet diverter plates to the diffuser plenum.......................................
46
vi
Figure 23 – Flow diverter plates in the plenum chamber ....................................
46
Figure 24 – Flow characteristics in a 90 degree bend..........................................
47
Figure 25 – Plenum sections side view of the current facility.............................
52
Figure 26 – Heater mesh component schematic ..................................................
54
Figure 27 – Impingement array geometry ...........................................................
56
Figure 28 – Sample turbine blade impingement hole geometry
from a formerly operational Rolls Royce engine...........................................
57
Figure 29 – Surface thermocouple locations .......................................................
60
Figure 30 – Liquid crystal layers on the target surface........................................
62
Figure 31 – Fan control panel ..............................................................................
69
Figure 32 – Fluid ejection through a jet hole.......................................................
73
Figure 33 – Discharge coefficient distribution across the impingement plate.....
74
Figure 34 – Stagnation point Nusselt numbers at streamwise jet row one ..........
76
Figure 35 – Time sequence for average Rej= 14,050...........................................
78
Figure 36 - Thermal contour of a first row jet .....................................................
79
Figure 37 – Progressive elongation of impinging jets due to crossflow..............
80
Figure 38 – Enhanced heat transfer effects in the jet channel region ..................
81
Figure 39 – Enhanced heat transfer in the jet channel at the back of the array ...
82
Figure 40 – Generation of a hairpin vortex..........................................................
82
Figure 41 – Thermal footprint of a hairpin vortex...............................................
83
Figure 42 – Time sequence for average Rej = 28,800..........................................
84
Figure 43 – Peak in heat transfer at 0.5d from stagnation point ..........................
85
Figure 44 – Secondary peak in heat transfer at 1.5d to 2.0d
from stagnation point .....................................................................................
86
vii
LIST OF TABLES
Table 1 – Comparison of experimental facilities.................................................
13
Table 2 – Comparison of impingement plate geometries and flow conditions ...
24
Table 3 – A comparison of discharge coefficients...............................................
75
viii
LIST OF ABBREVIATIONS
A
area
Aj
jet hole area
Ao,i
orifice inner diameter
Av
area of jet vena contracta
CCD
charged-coupled device (camera)
CFD
computational fluid dynamics
CMC
ceramic matrix composite
C
Centigrade
CD
coefficient of discharge
Cp
specific heat
Gc
crossflow mass velocity
Gc/Gj
ratio of crossflow to jet mass velocity
GE
General Electric
Gj
jet mass velocity
d
diameter
h
heat transfer coefficient
f
friction factor
F
Fahrenheit
Fo
orifice flow coefficient
g
gravity constant
ix
h
local total heat transfer coefficient
hc
crossflow heat transfer coefficient
hj
jet heat transfer coefficient
hL
head loss
I
current
IHPTET
Integrated High Performance Turbine Engine Technology
k
thermal conductivity
KL
loss coefficient
ℓ
length
ℓ/d
length-to-diameter ratio
m
experimental constant [Kercher and Tabakoff (1970)]
m&
mass flowrate
Nu
Nusselt number
PC
personal computer
Pr
Prandtl number
q
local surface heat flux
Q
flowrate
Qideal
ideal flowrate
Rej
jet Reynolds number based on jet hole diameter
RGB
red, green, blue (camera)
RIT
turbine rotor inlet temperature
t
time
T
temperature
x
Taw
adiabatic wall temperature
Tc
crossflow temperature
Tdown
downstream temperature
Ti
initial temperature
Tj
jet temperature
Tmesh
mesh temperature
TOC
thermocouple open circuit
Ts
surface temperature
Tup
upstream temperature
TSFC
thrust specific fuel consumption
TLC
thermochromatic liquid crystal
V
velocity; voltage
x/d
streamwise jet spacing
y/d
spanwise jet spacing
z
distance to target plate
z/d
jet-to-target spacing
Greek Symbols
α
thermal diffusivity
β
orifice diameter ratio, h αt / k , or h α (t − τ i ) / k
ΔTm,I
temperature difference between each temperature step and Ti
φ1
experimental constant [Kercher and Tabakoff (1970)]
xi
φ2
experimental constant [Kercher and Tabakoff (1970)]
η
efficiency
ρ
density
τ
time constant
υ
dynamic viscosity
xii
ACKNOWLEDGMENTS
Having “lived” the past year and a half of my life in Room 102 of the Engineering
Building at Baylor University, I am both excited and relieved to see my research arrive at
an end. However, this day could not have been achieved without the assistance and
encouragement of several people who have helped me along this journey.
First, I must extend my most sincere gratitude and admiration to my advisor and
mentor, Dr. Ken Van Treuren, who took the challenge of fostering me as the first
mechanical engineering graduate student at Baylor University. His passion for teaching
and genuine excitement for research has left a lasting impression on me that I pray will
only continue to develop as I now venture out into the world to put to good use the
practices I have learned. And to Dr. Carolyn Skurla, who first gave me the opportunity to
explore research opportunities in her lab, and instilled in me the desire and drive to reach
my full potential as a student here at Baylor. Thank you both for your constant support
and encouragement that kept me motivated and inspired to continue forth in my studies.
I would also like to thank Mr. Ashley Orr for his machining assistance and
guidance which helped make this test facility a reality; and Mr. Dan Hromadka for his
computer and software technical assistance in establishing the data and image acquisition
systems. Thank you for your tireless efforts in establishing the foundation of this project,
upon which, the research could grow. I also wish to thank Dr. Truell Hyde, Vice Provost
for Research at Baylor University, whose funding contributions fueled not only this
xiii
study, but the establishment of the Baylor University Mechanical Engineering graduate
program.
I must also extend earnest thanks to my parents for providing not only the
financial resources to my undergraduate education, but for their constant encouragement
and guidance in sending me down the right path in my education and in life. Thank you
for providing for me this great opportunity and for shaping me into the engineer and the
man that I am today.
And lastly, I leave my final appreciation and sentiments to my future wife, Laura,
who has endured a great deal over this past year and a half, not the least of which
includes many long nights studying with me in “the black hole,” also known as my lab. I
cannot even begin to express the love and gratitude I feel for her understanding and
patience, which allowed me to concentrate and finish the job. Thank you for always
standing by my side and encouraging me to succeed
xiv
DEDICATION
To my family and my fiancé Laura,
whose constant love and support continue to be my motivation
xv
CHAPTER ONE
Introduction
Jet Impingement Background and Applications
Impingement heat transfer has emerged as a principle source for both controlled
cooling and heating of a target surface because of its exceptional ability to augment heat
and mass transfer in a variety of industrial processes. Jet impingement can be seen
cooling turbine blades and vanes, combustors, electrical and electronic equipment, heating
surfaces, and even drying paper, thereby contributing to improving product performance,
longevity, efficiency, and quality. The focus of the current study is the application of
impinging jets as an effective source of cooling the leading edge and midspan regions of
gas turbine blades and vanes by enhancing the convective heat transfer. This thesis
reports on the development of an experimental facility and the subsequent facility
validation through the investigation of convective heat transfer coefficient, h, distributions
on a flat target surface beneath a standard array of inline impinging jets.
Performance in Gas Turbine Engines
The Integrated High Performance Turbine Engine Technology (IHPTET) program
is a Department of Defense initiative established in 1993 to increase the current 8:1 thrustto-weight ratio for aircraft gas turbine engines to a more powerful 20:1 level [Han et al.
(2000)]. This improvement will be the resultant of several advanced technologies
including improvements in material composition. Simple ceramics and composites are
too brittle to survive the harsh environment within a gas turbine engine where strength and
1
2
durability are essential; therefore, the development of advanced materials such as ceramic
matrix composites (CMC) will contribute to increasing the current turbine rotor inlet
temperature (RIT) limitations. However, the present demands for engine performance
require improvements beyond that of materials only, and must extend to include
advancements in component design, high-temperature thermal barrier coatings, and even
digital engine control which will allow the custom tailoring of coolant air, amongst other
processes, to optimize the needs of each specific stage of flight [Hirschberg (2004)].
These technological improvements will produce significant enhancements in fuel
economy and thrust for both military and commercial aircraft engines, but as Figure 1
illustrates, increasing the turbine rotor inlet temperature is critical for improving engine
power output.
Figure 1 – Effects of RIT on engine power output [Han et al. (2000)]
3
Figure 1 illustrates several current and past Pratt and Whitney engines, as well as
the original Whittle and Van Ohain engines, with their corresponding RIT and specific
engine core power output. The ideal performance line denotes a 100% efficient engine
(i.e. no leakage or coolant flow). The engines represented tend to advance near this line
along the same upward progression of performance. Clearly Figure 1 depicts improved
thermal efficiency and power output, and thus, enhanced overall engine performance, with
increasing RIT. However, although it remains clear that increasing the RIT improves
engine performance, Figure 2 demonstrates that these temperatures exceed the allowable
metal temperature, and without proper cooling, the metals within the engine cannot
withstand the increased RIT requirement for improved performance.
Figure 2 – Introduction of cooling technology and its effect on RIT [Han et al. (2000)]
4
Challenges of a Gas Turbine Engine Designer
One of the greatest problems facing an engine designer is how to increase the
specific thrust of an engine without increasing the aircraft weight or specific fuel
consumption. It has already been established, by Figure 1, that an increase in RIT
increases engine power output. Increasing engine power, increases specific thrust, which
is then coupled with an increase in the thrust-to-weight ratio, which, as Figure 3 depicts,
lowers the thrust specific fuel consumption (TSFC). The increase in turbine inlet
temperature also allows for options when considering mission application and
performance. The increase in thrust can either translate to an increase in payload capacity
for commercial aircraft or increased flight speed for fighter aircraft, which allows for
quicker combat departure and improved combat abilities, without increasing the diameter
of the engine. Conversely, should the thrust demands of a flight remain fixed, the actual
engine diameter could be reduced, thereby decreasing material cost, reducing drag, and
minimizing aircraft weight which could lead to further improvements in fuel economy.
Figure 3 – Thermodynamic tradeoffs in an engine cycle [Borns (1989)]
5
As Figures 1 and 2 illustrate, current gas turbine engines operate at temperatures
exceeding 3000°F (2000 K) in order to maximize their thermal efficiency and power
production. As temperatures rise within the turbine to generate this improved
performance, the amount of heat transferred to the turbine blade increases, which creates
higher fatigue and thermal stress concentrations on the blade itself. An engine designer
must therefore use cooling air to minimize these concentrations and create a durable,
longer-lasting part. A simple 100°F reduction of turbine blade metal temperature can
prolong the blade life by a factor of ten [Van Treuren (1994)]. The use of cooling air does
however, decrease the amount of air available for combustion, and subsequently, the
capable thrust and cycle efficiency, since the coolant air is extracted from the compressor
bleed.
Jet Impingement in the Gas Turbine Engine
The extraction of air from the compressor for the use of cooling penalizes the
thermal efficiency. Therefore, it is important to optimize the amount of coolant air used to
cool turbine blades. Too little coolant air will reduce blade life due to the higher
temperatures it experiences; however, too much coolant air will negatively impact the
engine’s Brayton Cycle and thus, diminish engine performance by removing an excess of
air from the combustion cycle. An advanced cooling system must therefore create a
balance between performance and component longevity within a gas turbine engine.
Figure 4 depicts a cutaway section of the General Electric (GE) CF6 turbofan
engine. From this figure, it can be seen that air enters from the fan-side, and travels
through the engine to the exit of the compressor. Here, typically twenty percent of the
compressor bleed air is removed from the engine cycle and routed to the inside of the
6
turbine blade to be used for cooling [Han et al. (2000)]. Inside the turbine blade are two
chambers. The inner chamber is pressurized by the coolant air. The pressure differential
between the two chambers drives the air through the perforated wall and impinges upon
the internal wall of the turbine blade, as highlighted in Figure 5. The impingement air
then effuses to the outside of the turbine blade creating a film of cooler air to protect the
blade. The purpose of these cooling techniques is to create temperature uniformity within
the turbine blade below the material limit. The spent impingement air is then often used
in conjunction with film cooling, whereby a thin “film” of relatively cooler air (the postimpingement air) blankets the outside of the turbine blade providing a thin barrier from
the intense heat within the engine cycle. This “relatively” cooler air is so labeled because
the coolant air temperature from the compresssor is a mild 1500°F compared with the
actual 2500 to 3000°F experienced in the turbine during the engine cycle.
Figure 4 – Engine components of a GE CF6 turbofan [Mattingly (1996)]
7
Film cooling
holes
Impingement
holes
Pin fin
cooling
Figure 5 – Cooling schematic within a typical turbine blade [Nomoto et al. (1996)]
Statement of Problem
Jet impingement arrays have been widely accepted as an effective technique of
turbine cooling, especially on the leading edge and midspan regions of gas turbine blades
and vanes. The turbine industry would most benefit from heat transfer correlations
obtained for the complex geometries found within an actual gas turbine environment;
however, modeling such configurations to obtain useful data is very complicated and
experimentally and computationally expensive. As a result, the turbine industry often
includes more jet impingement holes than necessary, uses an excess of coolant air, or
simply limits the operating conditions of the engine. Nevertheless, various simple jet
configurations and geometries have provided a vast resource to the gas turbine community
in regards to jet heat transfer characteristics, which are confined to the empirical
correlations resulting from experimental studies of these jet geometries and
configurations. By determining the local heat transfer coefficients on the target surface,
8
the optimum jet configuration can be established to promote the greatest heat transfer for
the minimum usage of coolant flow.
The cooling effectiveness of impinging jets generates a significantly high local
heat transfer coefficient centered on the target surface directly beneath the jet’s core. This
aids in the reduction of the intense temperatures experienced in the high pressure turbine
so vital to improving engine performance. Since this engine performance is governed by
the engine’s allowable turbine inlet temperature, a higher inlet temperature translates to
higher efficiency and greater power output. The inlet temperature is bounded by the
material’s melting point, and thus, impinging jets are employed to increase the capable
inlet temperature beyond that of the material properties.
Aims and Objectives
These impinging jet heat transfer methods can be investigated through the
development and subsequent use of an impinging jet test facility, whereby more detailed
correlations can be obtained to help designers better configure jets in a turbine blade. The
primary purpose of this study is to
1. Develop an impinging jet test facility with an array of very large
impingement holes at Baylor University
2. Validate the facility by performing initial heat transfer studies to determine
an appropriate jet discharge coefficient and the heat transfer coefficient at
the stagnation point beneath an impinging jet. Compare the results with
previous studies. Validation will be considered satisfactory if the percent
difference between the current study and the literature is within 10%.
CHAPTER TWO
Literature Review
Introduction to the Literature
The need to improve engine performance and efficiency is the driving force behind
experimentation and testing of engine cooling techniques. Experimentation provides
designers with correlations whereby they may better design the impingement cooling
schemes within gas turbine blades and vanes. The actual gas turbine engine is very
complex with many different parameters to control in order to examine the effect of one
phenomenon such as impingement cooling. Therefore, a facility must be created
specifically for the purpose of testing different impingement systems, so that an impinging
jet’s characteristic behavior may be properly observed and correlated.
Review of Experimental Facilities
Jet impingement facilities allow for the modeling of the cooling effects of
impinging jets on gas turbine blades and vanes. Van Treuren et al. (1994, 1996) used a
suction-type fan to draw air through a heater, and into the 0.5 x 0.5 x 0.2m plenum
through well-insulated pipework. Until the heated air had reached a uniform plenum
temperature, a set of valves acted as a bypass mechanism to prevent the air from reaching
the impingement plate. Upon reaching a steady thermal conduction in the plenum, the fast
acting valves were opened, allowing air to flow through the impingement plate. The test
plate was an 8 x 5 jet array of 5 mm diameter, sharp-edged impinging jet holes with 8d
spacing in both the streamwise and spanwise directions. Since the impingement plate is
9
10
linked to the target plate by the recirculation regions created by the shear interaction
between the jet and the stagnant air of the test section, it was important for this study that
the impingement plate temperature be controlled to determine any heat transfer
contributions to the target surface from sources other than the jet itself. Therefore, the
temperature of the impingement plate was controlled using a constant water bath
throughout the transient experiments. The jet-temperature profile was then attained over
time for jet Reynolds (Rej) numbers ranging from 10,000 to 40,000, by the thermographic
liquid crystal (TLC) technique using three narrowband crystals with a CCD video camera
and frame grabber software.
Wang et al. (1996) performed a comparative study which examined the use of a
heater mesh coated in thermochromatic liquid crystals (a temperature indicator discussed
in Chapter Three) to measure the heating uniformity of air flow at the exit of the
experimental tunnel. This study validates the heater mesh method originally developed
and described by Gillespie (1993) and establishes the use of the mesh heater and liquid
crystal thermography as an accurate and cost-effective means of uniformly heating airflow
and producing an accurate thermal profile. These conclusions effectively eliminate the
need for a fast acting valve system by allowing rapid temperature change at low speed
flows. Previously, a much more complex technique was required to validate heating
uniformity which included the use of traversing probes and temperature rakes [Byerley et
al. (1988) and Moss and Oldfield (1991)]. Therefore, the heater mesh method using liquid
crystal thermography will be used for the present study.
Lee et al. (1997) examined a single, round jet produced from a centrifugal blower
fan, which was networked through a copper pipe to the constant temperature bath and heat
11
exchanger coil. The pipe then transitioned to a cast acrylic pipe which housed the orifice
meter. The exit to the orifice included a smooth transition approximately 150 cm
downstream of its exit into the smaller diameter impingement pipe whose length was 58d
to ensure a fully developed round jet condition. Thermocouples were inserted in the pipe
upstream of the impingement to measure the jet temperature and outside of the pipe to
measure the ambient temperature. Images of the liquid crystal-coated target surface were
captured by a color video camera system and frame grabber board.
San and Lai (2001) also used a water bath and heat exchanger coil to heat air
supplied by a large reciprocating air compressor. Before impingement, the air had to be
purified, and therefore, the system included a vapor compressor type dehumidifier and
adsorption columns to remove oil in the air supply line. An isobaric surge tank was also
used to minimize pressure fluctuations generated from the cyclic nature of the air
compressor, and a pressure regulator controlled the exit pressure of the air to the system.
The impingement test section was 0.26 x 0.4m with spent air confined to exit in two
opposing directions. The air itself was not heated; instead, the target plate was fitted with
nine 0.01 mm thick, stainless steel heating foils with silicon filling the irregularities
between foils to promote a smooth target area. The impingement heat transfer
measurements for this study were taken with 76 traditional T-type thermocouples affixed
beneath the heating foil with a highly thermally conductive paste.
Gao et al. (2003) passed air via a compressor through an orifice to measure
flowrate and determine the effective jet Reynolds number. Air was channeled through an
in-line heater, and diverted away with a valve system until a steady heated temperature
was reached. The heated air was then forced through a 90 degree bend into a diffuser
12
which emptied into a 38.1 x 38.1 cm plenum chamber. The target plate was coated with
liquid crystals to indicate the heat transfer rate and the effects recorded by an RGB camera
and color frame grabber PC board. This experimental system was capable of achieving jet
Reynolds numbers ranging from 2,000 to 10,000 and image capture was obtained via an
RGB camera and frame grabber system.
A complete comparison of the experimental facilities is seen in Table 1. All these
facilities were designed for the purpose of investigating the cooling effectiveness of
impinging jets, so that engine designers might better understand the characteristic nature
and flow patterns associated with an impinging jet or jet array.
Impinging Jet
An impinging jet is a locally concentrated stream of coolant air expelled from a
hole or slot, which impinges upon a target surface (Fig. 6). The jet itself can be
subdivided into three characteristic zones: the free jet, stagnation region, and wall jet
region. The free jet exists directly beneath the hole exit. Jet flow does not reach a fully
developed state until approximately six hole diameters from the exit plane [Van Treuren
(1994)]; therefore, in the case of the gas turbine application, the plate-to-target (z/d)
distance is too small for a fully developed jet to be realized.
When the coolant air is ejected from the hole, the jet forms a shear layer with the
surrounding, relatively stagnant air. This shear layer is unstable and therefore generates
turbulence in the form of a recirculation region directly adjacent to the jet’s core. The
eddies that result from the shear interaction are then propagated downstream along with
the spent coolant, helping to enhance heat transfer in the regions between jets.
Table 1 – Comparison of experimental facilities
13
The core of the jet impinges upon the target surface, and the region directly
beneath the jet is known as the stagnation region. Here, essentially only the effects of that
single jet are realized, and it is therefore the highest area of heat transfer. Upon
impingement, the jet must flow radially outwards, and thus, forms a wall jet along the
target surface. The wall jet creates a thin boundary layer, which is due to the column of
jet air “pressing down” on the boundary layer as it moves outward. This causes some
local acceleration with higher heat transfer coefficients. The wall jet region, outside the
impinging jet region, is characterized by a deceleration and disbursement of coolant as it
interacts with the recirculation region, which may cause turbulent transition of the laminar
boundary layer; however, locally, the influence of the wall jet enlarges and progressively
decreases the heat transfer effectiveness.
z/d
Impinging Jet
(Free Jet Region)
Stagnation
Region
Recirculation
Region
Wall Jet
Figure 6 - The characteristic regions of an impinging jet
Single Jet
The study of a single jet is of importance to the present work because it models the
initial rows of jets in an impingement array. Since the beginning rows of jets do not
generally experience a crossflow effect, their effects closely resemble that of a single
15
impinging jet. Therefore, a detailed study of a single jet can aid in the understanding of
jet behavior in an impingement array.
Jambunathan et al. (1992) provides a detailed literature review of singular circular
jet impingement heat transfer studies. Their review emphasizes the critical regions,
parameters, and variables of interest in a single impinging jet study, and provides a
comparative examination of experimental differences which can lead to a significant
influence on the ensuing heat transfer rate. The simplest correlation for the local heat
transfer coefficient was reported to be of the form
Nu = f (Re j , z / d , x / d , Pr )
where Nu is the average Nusselt number, Rej is the jet Reynolds number, z/d is the jet-totarget spacing, x/d is the jet hole spacing, and Pr is the Prandlt number. This correlation
does not, however, account for the effects of nozzle geometry, jet confinement, and
turbulence generation upstream of the jet nozzle. Several others [Goldstein et al. (1986)
and Metzger et al. (1989)] have also provided correlations relating the above parameters,
and Florschuetz et al. (1981) even extended the correlation to include the effects of
crossflow.
Obot et al. (1979) determined that nozzle geometry is pivotal in determining the jet
turbulence levels which Jambunathan et al. (1992) referred to as points of experimental
variation in their literature survey. Their study examined contoured and sharp-edged jet
holes as well as varying jet hole length-to-diameter ratios (ℓ/d). Jets with a short ℓ/d
(ℓ/d = 1) produced a significant variation in heat transfer effectiveness for the two inlet
geometries, with sharp-edged holes producing approximately 25 percent greater heat
transfer than the contoured geometry (see Figure 7). This is due in part to the large
16
variation in jet exit velocities. Jets with a contoured geometry or a sharp-edged hole with
a large ℓ/d (10d) tend to reattach inside the jet hole. With a large enough ℓ/d, fully
developed pipe flow can result, which can reduce the exit velocity by up to 30 percent and
thus, diminish the heat transfer rate.
A local heat transfer maximum has been frequently reported in the literature at a
radial distance of 0.5d from the stagnation point for low ℓ/d jet holes and low z/d values
(less than 6-8d) (see Figure 7) [Gardon and Akfirat (1965), Obot et al. (1979), and Lee et
al. (1997)]. The strength of the maximum is a function of the jet Reynolds number and
z/d. These studies have attributed this phenomenon to a local acceleration of flow caused
by a minimum in the boundary layer thickness of the wall jet. Heat transfer was found to
monotonically decrease radially outwards from this point until a second peak in heat
transfer was found to occur at a radial distance of approximately 1.5d to 2d from the
stagnation point. This additional maximum is attributed to the transition of the wall jet
region from laminar to turbulent flow resulting in an abrupt increase in the heat transfer
rate (see discussion on page 15).
Figure 7 – Local Nu maxima for various nozzle geometries [Obot et al. (1979)]
17
Multiple Jets
Unconfined Jets
An impinging jet may be unconfined or confined. An unconfined jet allows the
spent coolant air to diffuse openly with the atmosphere, thereby concentrating its primary
use in only one centralized location. Rhee et al. (2002) and Hebert et al. (2004) examined
this effect by developing effusion holes between the jet holes in which the spent air could
exit from the test chamber without interfering with neighboring jets. The results show that
the minimization of crossflow generated relatively uniform distributions of heat transfer
coefficients. Overall, this study showed that jet strength was maintained under each hole,
and little degradation in heat transfer occurred downstream as is present with crossflow in
a confined design. However, although these results are promising for maximizing the
results of the impinged coolant air, the idea is not indicative of current gas turbine engines
where crossflow is the inherent result of spent air exiting the engine naturally.
Confined Jets
A confined jet impinges on the target surface and is constrained within the bounds
of the impingement plate and the target plate (and usually on three sides), causing the
spent air to be ejected in only one direction. This confinement generates a “crossflow”
perpendicular to the core jet flow direction, as illustrated in Figure 8. When several
impinging jets are arranged in an array and confined to one flow exit direction, the effects
of the upstream jets can be felt by the downstream jets.
Kercher and Tabakoff (1970) provided the foundation for examining the effects of
crossflow in impingement cooling. They tested a variety of Reynolds numbers for the
18
Impinging Jet
Crossflow
Stagnation
Region
Figure 8 – Impinging jet in crossflow
effects of jet diameter, jet spacing, and jet-to-target distance and arrived at the following
empirical steady state correlation for the average Nusselt number, Nu:
Nu = φ1φ 2 Re j
m
1
3
⎛z⎞
Pr ⎜ ⎟
⎝d ⎠
0.091
(1)
where φ1, φ2, and m are constants evaluated from graphs derived from the presented data.
The variable, φ2, is a function of Gc/Gj, the ratio of crossflow to jet mass velocity.
Increasing this ratio decreases the value of φ2 and consequently the average Nu, or heat
transfer. They also noted that crossflow produces the opposite effect on performance in
regards to z/d spacing. That is, increasing z/d in crossflow diminishes the heat transfer
rate at the start of the array. With no crossflow, the heat transfer rate was enhanced with
increasing z/d due to formation of turbulence in the expelled jet. Bailey and Bunker
(2002) however, showed that the contribution of crossflow to a small z/d, can actually
increase the row resolved average Nu downstream, near the flow exit. This is due to the
channel-like flow of the spent impingement air gaining strength and velocity from each
successive spanwise row of jets as the spent air moves closer to the exit.
19
Perry (1954) first showed that any bending of a jet which alters its impingement
angle results in a reduction in heat transfer coefficient. Since a strong crossflow may
displace the jet core from directly beneath the center of the impingement hole, as Figure 8
illustrates, so must the largest area of heat transfer be shifted in the direction of the
crossflow, and its ensuing heat transfer effects diminished. In addition to the jet Reynolds
number and the spacing of the impingement channel (z/d), the spacing between the jets
(see Figure 9) themselves has been shown to be a vital factor in heat transfer effectiveness
in the presence of crossflow [Florschuetz et al. (1981), San and Lai (2001), and Bailey and
Bunker (2002)].
Figure 9 – Test section nomenclature [Van Treuren (1994)]
San and Lai (2001) attempted to optimize jet spacing and noted two plausible
causes for diminished heat transfer: pre-impingement jet interference and/or jet fountain.
For small jet spacing, because of shear layer expansion, adjacent jets may interfere prior
to target impingement (see Figure 10). This interference diminishes the overall jet
strength and weakens the heat transfer effect. Conversely, if both jets impinge, a strong
20
head-on collision between wall jets may produce a jet fountain, as shown in Figure 11.
The entrainment effect will then force both the left and right side flows to recirculate with
the jet core causing heated air to mix with the cooling air, diminishing its heat transfer
capability. Florschuetz et al. (1981) showed that for small spanwise (xn ≤ 10d) and
streamwise (yn ≤ 6d) jet spacings and/or a jet-to-target (z/d) spacing greater than one jet
diameter, the resulting crossflow created a significant diffusion of the jet core, and a
notable reduction in heat transfer effectiveness.
Figure 10 – Pre-impingement jet interference [San and Lai (2001)]
Figure 11 – Jet fountain [San and Lai (2001)]
21
For larger jet hole spacings and a z/d = 1, Florschuetz et al. (1981) documented a
slight increase in heat transfer as crossflow was found to directly increase the heat transfer
rate without significantly reducing the contribution of the impinging jet itself. This is in
part explained by the further enhancement of heat transfer at locations between the jets
because crossflow promotes greater jet interaction, thereby increasing the turbulent
influence of the recirculation region, but, in this case, without generating a strong jet
fountain effect which interferes with the bulk flow.
Crossflow also tends to elongate and distort the circular heat transfer footprint that
would normally be seen under a single jet. This elongation of the core impingement area
corresponds with a resulting diminished heat transfer rate, since the same amount of
coolant must be applied to the greater (elongated) effective area. This effect is better
demonstrated in Figure 12, which illustrates the elongated jet influence effects generated
by crossflow.
Figure 12 – Influence of crossflow on impinging jet structure
[Van Treuren (1994)]
22
Array Configurations
The array configuration is also a critical factor in the influence of crossflow and
the resulting heat transfer effectiveness. An array of multiple impinging jets is often
modeled in a variety of configurations, the most common of which is a uniform, inline
array [Kercher and Tabakoff (1970), Florschuetz et al. (1981), Van Treuren et al. (1994
and 1996), and Bailey and Bunker (2002)]. The uniform, inline array consists of jet holes
of identical size and spacing, placed directly streamwise and spanwise of each other. This
array was illustrated earlier in Figure 9, given that xn = yn, and will be the array used for
the present experimental validation.
The uniform hole case can also be coupled with a staggered geometry, whereby
the odd numbered rows exhibit the same geometry as the inline case, but the holes of the
even numbered rows are shifted to be midway between the holes in the preceding row
[Florschuetz et al. (1981), San and Lai (2001), and Hebert et al. (2004)]. This
configuration is more specifically aimed to allow crossflow to penetrate the areas between
jets.
The hole size and spacing may also be varied [Gao et al. (2003)]. A plate with
varying hole diameter and spacing is shown in Figure 13. Here, the hole size
progressively enlarges downstream of the first row of holes. The spacing between holes
also increases, that with each successive row, the spacing increases by a jet diameter (i.e.
if row one begins at a 2d spacing, then row two has 3d spacing, and row three has 4d, and
so on)
This geometry is meant to create a larger bulk flow in the latter rows of jets,
thereby trying to minimize the adverse effects of crossflow on the downstream holes by
limiting the amount of coolant mass which is ejected from the initial row jets. This is
23
effective in maintaining the core of the latter row jets, but heat transfer upstream is usually
lessened directly beneath the jet because of its limited flow.
A summary of some of the literature for single and multiple arrays of impinging
jets is presented in Table 2. The table provides a synopsis of the types of arrays studied as
well as a comparison of the jet diameter, Reynolds number, and spacing parameters
investigated. This review was used to finalize the present design parameters to ensure that
the present work is well representative of past and current impinging jet studies. It is
Figure 13 - Impingement plate with varying jet hole diameter and spacing
(Gao, et al. 2003)
hoped that this facility will provide a better understanding of the heat transfer behavior of
arrays of impinging jets, so that their use might be optimized to produce the best possible
performance enhancements for today’s gas turbine engines.
Table 2 – Comparison of impingement plate geometries and flow conditions
24
25
Heat Transfer Enhancement Elements
Several other experimental techniques have also been investigated to enhance the heat
transfer of the jet without altering the amount of flow from the jet itself. These include
the use of effusion holes [Rhee et al. (2002) and Hebert et al. (2004)], target surface
dimples [Kanokjaruvijit and Martinez-Botas (2003)], and rib turbulators (pin fins,
pimples, etc.) [Son et al. (2005) and Hong et al. (2005)]. Effusion holes were described
earlier as a means of eliminating the adverse effects of crossflow and promoting greater
direct jet impingement. Dimples and rib turbulators promote heat transfer by not only
adding surface area, but by also tripping the boundary layer to advance the onset of
transition and turbulence which enhances the heat transfer rate. All of these are a means
of advancing the technology of the gas turbine engine to enable better performance of
today’s aircraft so they can fly higher, faster, farther, and more efficiently.
CHAPTER THREE
Theory
This chapter presents the transient heat transfer theory, beginning with a simplified
heat transfer model. Next, a discussion of liquid crystal theory and the principle concepts
behind their thermochromatic capabilities is given. Lastly, the transient liquid crystal
technique using the double crystal method of analyzing color intensity to determine the
local heat transfer coefficients across the target surface is discussed.
Heat Transfer Model
The impingement of heated air onto the target surface is a convective heat transfer
problem with the local surface heat flux, q, expressed as:
q = h(Taw − Ts )
(2)
where h is the local total heat transfer coefficient, Taw is the adiabatic wall temperature,
and Ts is the surface temperature. The total heat transfer coefficient is a combination of
the heat transfer effects caused by the jet and crossflow as seen by the following:
h = h j + hc
(3)
where hj is the jet heat transfer coefficient and hc is the crossflow heat transfer coefficient.
On some occasions, the effects of the impingement plate are taken into consideration by
controlling the temperature of the impingement plate (by means such as a water bath [Van
Treuren (1994)]), but for most studies, these effects are not considered and will not be
considered in the present investigation.
26
27
The adiabatic wall temperature found in Equation (2) is often referred to as the
driving gas temperature because it considers the effective mixing of the jet and crossflow
together as:
Taw =
h j T j + hcTc
h j + hc
(4)
where Tj is the jet temperature and Tc is the crossflow temperature. Equations (3) and (4)
can therefore be combined and simplified to give the surface heat flux as:
⎛ h j T j + hcTc
⎞
− Ts ⎟ = h j (T j − Ts ) + hc (Tc − Ts )
q = (h j + hc )⎜
⎜ h +h
⎟
j
c
⎝
⎠
(5)
or even more simply:
q = h(Taw − Ts )
(6)
where both the total heat transfer coefficient and adiabatic wall temperature can be found
for the current study with a transient test using the double crystal method of measuring
heat transfer (discussed later in this chapter). Therefore, Equation (6) provides the local
surface heat flux for the convective heat transfer problem by simplifying all temperatures
and corresponding heat transfer coefficients into the adiabatic wall temperature, or fluid
temperature, and the effective local total heat transfer coefficient.
For literature comparison purposes, the results can then be presented in terms of
the dimensionless Nusselt number, Nu:
Nu =
hd
k
(7)
where d is the jet hole diameter and k is the thermal conductivity. Based upon these
equations, the present study will develop a facility that will provide the local heat transfer
coefficient and adiabatic wall temperature for an array of impinging jets.
28
Liquid Crystal Theory
Thermochromatic Liquid Crystals
Thermochromatic liquid crystals have been utilized in heat transfer experiments
for several decades as a method of temperature measurement [den Ouden and
Hoggendoorn (1974), Hippensteele et al. (1983), Van Treuren (1994), and Son et al.
(2005)]. Essentially, liquid crystals are a temperature indicator that reflects incident white
light to display color relative to wavelength which is proportional to temperature. The
temperature response is determined by the pitch, or the measure of molecule rotation of
the helicoidal arrangement of liquid crystal molecules [Van Treuren (1994)]. A
byproduct of the helical structure of the cholesteric mesophase is its ability to selectively
reflect light of wavelengths equal to the pitch length. This means that a color will be
reflected when the pitch is equal to the corresponding wavelength of light in the visible
spectrum. Since temperature directly affects the molecule orientation between successive
layers (see Figure 14), the pitch length changes with temperature, resulting in the
alteration of the wavelength of reflected light, producing temperature-dependent color
ranging from red (longest wavelength) to dark blue (shortest wavelength). An increase in
temperature increases the angle between successive molecule layers, consequently
tightening the pitch and shortening the wavelength. Similarly, a decrease in temperature
increases the pitch length and the corresponding wavelength of light. The resulting color
exhibited by the liquid crystals can then be calibrated to temperature using a thin foil
thermocouple adhered to the test surface. This visible color play interval is both
reversible and repeatable making thermochromatic liquid crystals ideal for temperature
measurement across large surface areas of the experimental apparatus.
29
Figure 14 – Reorientation of TLC lattice structure [Jones (1992)]
Liquid crystals exist in a microencapsulated liquid solution, capable of
chromatically indicating large ranges of temperatures (-30°C to 120°C) and bandwidths as
small as 0.5°C, or as large as 20°C [Stasiek and Kowaleski (2002)]. For most transient
experimental studies, a one degree-wide, narrowband crystal is used [Van Treuren et al.
(1994), Lee et al. (1997), and Gao et al. (2003)] because of its sharp color transition and
strong intensity definition; however, a single wideband crystal has also been used for
color hue analysis [Bailey and Bunker (2002), Gao and Sunden (2002), and Saxena et al.
(2003)]. The present study uses three one-degree wide crystals. Across this bandwidth,
the crystal exhibits the entire color spectrum, from red at the lowest temperature to blueviolet at the highest temperature. When the temperature is outside of a crystal’s
bandwidth, the resulting color display is transparent. For heat transfer experimentation,
the yellow-green color is the preferred indicator for temperature measurement because it
corresponds with a peak in color intensity; however, exposure to ultra-violet light, oils,
and chemical vapors can contaminate the experimental surface and severely diminish the
TLC color intensity.
30
Liquid crystals exist in the mesophase, exhibiting a conjunction of both orderly
arrangement (solid-like) and mobility (liquid-like). The tiny crystals are encapsulated by
a very thin polymer membrane which helps to protect it from the effects of shear and
pressure fluctuations generated in a heat transfer experiment; however, TLC remains very
sensitive to touch and extreme heat. The encapsulated shell, with an approximate
diameter of only 10 μm, allows for a very thin layer of TLC, 20 to 30 μm thick, to be
applied to the target surface as in Figure 15. This thickness is considered thermally thin,
allowing the crystal to respond to temperature change almost instantaneously (≈ 3 ms)
yielding accurate time-temperature thermography [Ireland and Jones (1987) and Stasiek
and Kowaleski (2002)]. This response time is negligible in comparison with the total
experiment time.
Figure 15 – Aqueous mixture of encapsulated crystals and binder solution [Jones (1991)]
Transient Liquid Crystal Technique
The impingement of the heated air onto the target surface is a convective heat
transfer problem with the local surface heat flux expressed as in Equation (6) previously:
q = h (Taw − Ts )
(8)
31
where q is the local heat flux, h is the convection coefficient, Taw is the adiabatic wall
temperature (fluid temperature) that yields h independent of temperature, and Ts is the
local surface temperature. The convection coefficient can be reduced to a function of only
the flow field with an appropriate choice of the adiabatic wall temperature. For
impingement experiments, where one-dimensional heat conduction behavior is assumed
into the Plexiglas target surface, gas temperature differences are sufficiently small (around
20°C) that fluid properties can be assumed to remain constant and independent of the
transient temperature.
The convection problem of impinging jets is considered a three-temperature
situation involving the temperature of the fluid, Taw, the temperature of the surface, and
the initial jet temperature. Therefore, Taw is the driving gas temperature in the heat flux
equation. The temperature of the surface is determined by the transient response of the
liquid crystal color play on the target surface. Initially, the target surface is at uniform
temperature, Ti, and is suddenly exposed to the heated impingement air. The liquid crystal
response for each surface pixel to reach a given temperature is dependent upon the
adiabatic wall temperature and the local heat transfer coefficient at each pixel location.
The thermal conditions of a heat transfer experiment allow the lateral conduction
of the target plate to be neglected compared to the convected heat from the bulk airflow
because the principal form of heat transfer in the experiment is convection rather than
conduction. The local heat transfer coefficients across a liquid crystal coated target
surface can then be obtained using a semi-infinite solid assumption (see Figure 16) and
solved using the one-dimensional Fourier equation:
k
∂ 2T
∂T
= ρC p
2
∂z
∂t
(9)
32
with boundary and initial conditions:
−k
∂T
∂z
= h (Taw − Ts )
z =0
T
= Ti
z =∞
T t =0 = Ti
where k is the coefficient of thermal conductivity of the substrate, z is the length in the
heat flux direction, ρ is the density, Cp is the specific heat, t is time, and Ti is initial
temperature. The equation applies the conservation of energy to the transient conduction
problem by equating the net accumulation of heat per unit volume due to conduction (lefthand side) to the rate of change of thermal energy per unit volume within the substrate
(right-hand side).
h, Taw
y
TLC layer
x
Plexiglas
z
T=Ti at 0 ≤ z < ∞
Figure 16 – Schematic of semi-infinite solid assumption
The constants of Equation (9) can be related by the thermal diffusivity,α, which is a
measure of the ratio of thermal conductivity to the material’s thermal capacity, and is
defined as:
33
α=
k
ρ Cp
(10)
The solution for the surface temperature response with time is:
2
Ts − Ti
= 1− e β erfc(β )
Taw − Ti
(11)
where
β=
h αt
k
and h and Taw are unknown. Therefore, two events are required to solve for the
unknowns. Using the double liquid crystal technique described in the subsequent section,
the surface temperature at a particular time permits the simultaneous evaluation of the
convective heat transfer coefficient and adiabatic wall temperature provided that all other
parameters in Equation (11) are known.
Although the initial temperature of the Plexiglas is uniform at ambient
temperature, the impinging fluid temperature is higher and not a true step increase. This is
accounted for through the modification of Equation (11) by Duhamel’s superposition
theorem [Ireland et al. (1993)], which represents the temperature change as a series of
steps described by:
N
[
]
T − Ti = ∑ 1 − e β erfc(β ) ΔTm,i
i =1
2
where
β=
h
α (t − τ i )
k
(12)
34
and τi is the time step for each temperature step, ΔTm,i is the temperature difference
between each temperature step and the initial temperature, and Ti, α, and k are
characteristic of the Plexiglas plate.
For this process to be employed, several assumptions must be satisfied. The
present experiment involves a target plate of finite thickness. In order to satisfy the semiinfinite assumption, the transient temperature must not penetrate through the thickness of
the plate during the test duration. This is achieved by a sufficiently thick plate of low
thermal conductivity and diffusivity (0.187 W/m⋅K and 0.1073x10⁻⁶ m2/s for Plexiglas
respectively). The semi-infinite assumption is governed by:
z > 4 αt
(13)
which was developed by Schultz and Jones (1973) as a guideline for determining an
acceptable target plate thickness, z. For the one-dimensional heat transfer assumption to
be satisfied, conduction can only occur normal to the plate surface with all lateral
conduction effects neglected. Although the plate may actually experience some smallscale lateral conduction, the dominant temperature gradient is in the direction
perpendicular to the surface, and thus lateral effects are considered negligible.
Double Crystal Technique Using Liquid Crystal Intensity
For the double crystal technique to be used, the target surface must first be coated
in at least two different liquid crystals. Bonnett (1989) showed that the brightness of a
color response under fixed lighting conditions is not significantly affected by this thicker
layer of liquid crystal, while Ireland and Jones (1987) determined that the crystal response
time is also insignificantly affected. The double crystal method utilizes the peak value in
intensity (or color brightness) emanated from the liquid crystal coated target surface, in
35
conjunction with the corresponding previously calibrated temperature value and measured
test time. Using two different peak intensity values (i.e. two different t and Ts values)
given by two different liquid crystal responses in a single transient test, two equations of
the form in Equation (11) can be solved simultaneously for the unknown values of Taw and
h, thereby allowing a complete local heat transfer coefficient profile to be created across
the entire experimental test surface. These intensity values are determined by a color
image processing system used by Baughn and Shimizu (1989). The present study uses
three narrowband crystals, of which, the two with the most definitive peak intensity values
will be analyzed as described by the double crystal method by a color processing system
which will be discussed in detail in Chapter 4.
CHAPTER FOUR
Design of the Experimental Jet Impingement Facility
Introduction to the Experimental Design
This chapter details the design and initial development of the Baylor University
impinging jet test facility. The design was modeled after other impingement facilities and
experimental flow systems, infusing the basic design concepts of the wind tunnel with
advanced heating concepts and typical jet impingement array and flow configurations.
The design will accurately model conventional engine representative conditions of
impinging jets on a larger scale than has been previously documented. The facility
establishes the premise of the current study and creates a cornerstone toward the
development of future jet impingement studies.
Experimental Apparatus Overview
The experimental apparatus (Figure 17) was designed to be compatible with a variety
of jet impingement array configurations. The facility consists of a blower fan, diffuser
plenum, flow straighteners, heater mesh, impingement and target plates, three-chip CCD
camera, and image processing system. An overhead model of the experimental apparatus
is presented in Figure 18. Air is supplied to the experimental facility by a variable speed
blower fan and the flowrate measured with an Oripac orifice meter. The desired mass
flow rate is established by measuring the differential pressure across the orifice and
matching the reading with the manufacturer-supplied calibration curve. This is used to set
36
37
the desired jet Reynolds number based on the 0.7344 in (18.65 mm) impingement hole
diameter [Robertson and Van Treuren (2005)].
Figure 17 – Baylor University impinging jet test facility
Figure 18 – Experimental Facility [Robertson and Van Treuren (2005)]
38
Airflow reaches the impingement plate after first entering the diffuser plenum. The
plenum accepts air from downstream of the orifice plate and serves to both reduce the
bulk air velocity and diffuse the concentrated air jet across the entire span of the chamber.
The flow then enters a series of flow straighteners which assist in minimizing flow
turbulence by providing a pressure drop that promotes uniform flow.
The heater mesh method developed by Gillespie (1993) is used to heat the air just
prior to impingement. The mesh consists of a 40 μm 316-stainless steel fine wire mesh
with a 0.38 open area ratio soldered between two brass bus bars. A Miller Syncrowave
250 arc welder is connected to the brass bars to provide heating to the mesh [Robertson
and Van Treuren (2005)].
The heated air impinges on a target plate coated with thermochromatic liquid crystals.
A coating that combines three different encapsulated liquid crystals (R25C1W, R30C1W,
and R35C1W) is used to measure the surface temperature created by the impinging jets.
The system is designed with fluorescent lights mounted on the frame to ensure uniform,
non-heated lighting and a three-chip CCD camera is used to capture the transient process.
The video feed is transferred into a standard IEEE-1394 (FireWire) PC card and
successive images are captured by a LabVIEW program. The image capture rate is 30
frames per second [Robertson and Van Treuren (2005)]. The local heat transfer
coefficients and adiabatic wall temperature were determined using a visual technique
employed by Li et al. (1988) and Jones (1992).
39
Experimental Design and Component Sizing
Prediction of Flow Losses in the Facility
The design of the impinging jet testing facility was developed through an iterative
theoretical analysis involving a Loss Calculator that predicted the pressure loss through
each component and then fit a theoretical curve predicting head loss as a function of air
flowrate against the manufacturer’s data. The main purpose of the theoretical study was
to determine the largest possible impingement hole capable of producing engine
representative Reynolds numbers of nearly 15,000 to 45,000 in a large 8 x 8 array.
The calculator was therefore used as the determination factor for component
sizing. It was created with the idea that given several “desired” inputs, the resulting sizes
of the dependent components could be sized. The input cells are highlighted in yellow in
the calculation program (Appendix A). These include the desired number of holes in the
streamwise and spanwise direction as well as the hole spacing. These were the first
factors considered in the calculator’s computation as it was most important to be sure that
the array geometry would be representative of other typical array configurations. Other
input factors are determined by the surroundings, such as room temperature, which
generates the air density and viscosity by interpolating values from an air properties table
taken from Munson et al. (2002). The jet temperature does a similar calculation based
upon the desired input and produces an estimate of the jet Reynolds number. Several
more parameters are used to help determine the overall system length, although their
inputs are based upon some standard sizes and are therefore fixed. These include the
mesh and heater mesh wire diameter, the fan’s cart depth, and the required camera
distance from the test plate. The remaining inputs; pipe diameter, orifice inner (bore)
40
diameter, hole diameter, and input flowrate; provide the means of the iterative theoretical
analysis.
Through an iterative approach, the effects of altering these parameters can be seen
on the jet Reynolds number, predicted system head loss, and overall facility length. A
compromise must therefore be made between these parameters to maximize the facility’s
capabilities within the confines of the room dimensions. With these component sizings in
place, an estimate of the facility’s capabilities can be predicted as governed by Figure 19.
The Loss Calculator prediction begins with the input flowrate entered at the fan
local control panel. The calculator then computes local velocities through each
component based upon the sizing criteria. Using the component loss coefficients and
overall pressure loss equations determined in the following sections, the actual loss in the
system can be calculated by the sum of each component’s contribution to the overall
system pressure loss:
hL , overall = ∑ hL , components
(14)
where the component losses are found from the forms of Equations (15) through (17),
which will be discussed in detail. All required parameters used in these equations, such as
friction factor, air properties, and water properties are automatically interpolated from
tables extracted from Munson et al. (2002) based upon the input criteria. After all the
inputs have been entered into the calculator, the calculator produces the predicted overall
system pressure loss, jet Reynolds number, and minimum overall facility length. By this
means, the facility was predicted to produce a maximum fluid flowrate of 1350 m3/s
(47,674 ft3/s), which yields an impingement hole of 0.7344 in (18.65 mm) for jet
41
Reynolds numbers of nearly 15,000 to 45,000 and an overall facility length of 20.5 feet
(6.25 m).
Jet Impingement Facility
Flowrate Vs. Calculated Head Loss
20
18
16
Head Loss (in H2O)
14
12
Calculated Losses
10
Fan Curve
8
6
4
2
0
0
500
1000
1500
2000
2500
3000
3500
Flowrate (m3/sec)
Figure 19 – Prediction curve for maximum fluid flowrate
Fan Selection
From the literature, several choices were available to supply the airflow to the
system. The air compressor used by San and Lai (2001) and Bailey and Bunker (2002) is
capable of supplying high Reynolds number values (up to 65000 [Bailey and Bunker
(2002)]), but without the use of pressure regulators and valves to meter the air supply, the
cyclic nature of a compressor would produce large fluctuations in flow velocity and
uniformity. These instabilities would then require either a greater upstream pipe length, or
more screens (both of which produce more flow losses) to help promote flow uniformity.
Suction-type fans offer the advantage of greater flow uniformity, but are limited in their
42
ability to produce high Reynolds numbers, which forces smaller jet diameters. Van
Treuren et al. (1996) achieved Reynolds numbers in the range of 10,000 to 34,000 using a
vacuum pump to draw the air through the experimental facility and impinge with a small
array of 5 mm (0.197 in) jet diameter holes. The suction fan also requires a large
contoured inlet which demands additional room space for the air to enter. The centrifugal
blower fan alleviates the space restriction be instilling a side-inlet design and offers the
necessary power to achieve typical engine representative Reynolds numbers with the
much desired large-scale jet hole design which is large enough to allow future hot-wire
studies. The blower fan does however produce some small-scale pulsations; however,
these are sufficiently low, even at off-design operation. The centrifugal blower fan
therefore runs with reasonable steadiness and efficiency across a large range of flow
conditions, making it ideal for the current wind tunnel design [Mehta and Bradshaw
(1979)]. For the present study, air will be supplied to the system by a Cincinnati
Centrifugal Blower Fan model HDBI-160 (Figure 20). The fan drives the open circuit
facility upstream of the test section and will be capable of driving jet Reynolds numbers in
the range of 10,000 to 50,000 with a much larger jet diameter of 0.7344 inches.
Figure 20 – Blower fan and nozzle for the current facility
43
The fan delivers the airflow to the system through a nozzle which serves to
transition the flow from the large 10 inch by 18 inch rectangular fan exit into the 6 inch
diameter PVC pipe. The nozzle contour helps to minimize system flow losses and reduce
percentage fluctuations by increasing the velocity without altering the total pressure
[Mehta and Bradshaw (1979)]. This creates a loss coefficient, KL, of only 0.07 for the 30
degree nozzle as opposed to a 0.43 loss coefficient for a sudden contraction design based
upon the pre- and post-contraction areas [Munson et al. (2002)]. This produces an overall
system loss, hL, of:
hL = K L
V2
2g
(15)
where V is the velocity through the exit of the nozzle and g is the gravitational constant.
The contraction also serves to reduce both the mean and fluctuating velocity variations to
a smaller fraction of the average velocity exiting the blower [Mehta and Bradshaw
(1979)].
Piping and Orifice Plate
The piping network consists of an orifice between two lengths of pipe: the 90 inch
upstream (of the orifice) pipe and the 30 inch downstream (of the orifice) pipe. The
orifice was chosen with a large diameter ratio, β, of 0.80 to again minimize the flow losses
by creating a greater orifice flow coefficient, Fo = 0.83 [Holman (2001)]. This translates
to a total system loss of:
⎛ Q
hL = ⎜⎜
⎝ Fo Ao ,i
⎞
⎟
⎟
⎠
2
⎛1− β 4
⎜⎜
⎝ 2g
⎞
⎟⎟
⎠
(16)
44
through the orifice, where Q is the flowrate through the orifice and Ao,i is the orifice inner
bore diameter. The β value is also used to determine the two pipe section lengths from the
British Standards for Fluid Flow in Closed Conduits (1989). A minimum distance of 15d
is required upstream of the orifice to ensure that flow has reached a fully developed state.
Similarly, a 5d distance is used in the downstream pipe section to allow the effects of the
orifice contraction to settle [British Standards (1989)]. A large pipe diameter (6 inch
PVC) was chosen to help reduce the flowrate through the pipe. This also reduces flow
loss which is directly proportional to the square of the velocity of the fluid within the pipe,
and is given by the following:
hL = f
l V2
d 2g
(17)
where hL is the head loss, f is the friction factor determined from the Moody Chart
[Munson et al. (2002)], ℓ is the length of the pipe, d is the pipe diameter, V is the fluid
velocity in the pipe, and g is gravity. A simple calculation with the losses calculator of
Appendix A reveals that the use of a 6 inch pipe produces 80 percent savings in flow loss
versus a 4 inch pipe, which translates into the ability for the facility to push higher
Reynolds numbers though the impingement plate. However, an 8 inch pipe requires
40 inches in length more than the 6 inch pipe. Therefore, the diameter of the pipe was
limited by the standard length requirements mentioned earlier, and a tradeoff between loss
and length must be considered. Ultimately, the 6 inch PVC pipe was selected because it
produced the least flow loss for the dimension requirements of the room.
Between the two pipe sections, an Oripac orifice meter (Model 4150) measures the
system flowrate by a pressure differential. The meter is tapped for pressure readings both
upstream and downstream of the contraction. The pressure differential is then fit to a
45
manufacturer’s supplied data curve (see Appendix B) which allows for the determination
of the fluid flowrate. This fluid flowrate is then used to calculate the average ideal jet
Reynolds number for the flow setting.
Figure 21 – Side view of the orifice and piping for the current facility
Diffuser Plenum
Airflow from the downstream pipe empties into the diffuser plenum. The incoming
air is immediately met by two radiused diverter plates (Figure 22) which divide the
incoming air into three sections, thereby facilitating the diffusion of the concentrated air
jet across the entire height of the chamber. As the air spreads across the plenum, it is
again met by two more radiused diverter plates (Figure 23) spanning the height of the
plenum. Each plate is set 2 inches inward from the front and back of the plenum inlet hole
in order to evenly divide the air and promote even diffusion across the width of the
chamber, as well as turn the flow towards the plenum exit. The back wall of the diffuser
plenum is also radiused to facilitate the 90 degree turn.
46
Inlet
diverter
plates
Figure 22 – Inlet diverter plates to the diffuser plenum
[Robertson and Van Treuren (2005)]
Diverter plates
Figure 23 – Flow diverter plates in the plenum chamber
[Robertson and Van Treuren (2005)]
The plenum and guide vanes are radiused for several reasons. The first is to
minimize the flow losses to the system. Instituting guide vanes across a 90 degree mitered
bend produces a loss coefficient of 0.2 compared to that of 1.1 without the diverter plates
[Munson et al. (2002)]. This reduces the total losses seen by the system, which serves to
permit a greater flow velocity, and thus, greater jet Reynolds numbers or greater jet hole
diameters. The second reason is to minimize separated flow regions. Guide vanes help to
turn more of the flow quicker, as shown in Figure 24(b). Without the flow diverters, the
47
fluid would turn with a larger radius proportional to its flow velocity (i.e. the greater the
velocity, the less inclination of the flow to turn). This means that the bulk flow would be
forced to the far side wall of the turned plenum, creating a region of flow separation at the
near wall of the bend as seen in Figure 24(a).
(a)
(b)
Figure 24 – Flow characteristics in a 90 degree bend: (a) without guide vanes, (b) with
guide vanes
The third, and probably most important reason, is simply for space purposes.
Room 102 at Baylor University, where the facility is located, is 23 ft in its longest
direction. Therefore, the total length of the testing facility and required system analysis
tools could not exceed this dimension. With the already established dimensions of the
fan, lengths of the piping, and including a sufficient distance for camera placement, a
typical wide-angle conical diffuser would not fit within the room dimensions. For a
conical diffuser to see a benefit in its loss coefficient compared to that of the current 90
degree design, it would require no greater than a 35 degree diffusion angle [Munson et al.
(2002)]. This would produce a diffuser length more than 3 feet longer than the 90 degree
48
design, and would exceed the dimensions of the room. Although a greater diffusion angle
would shorten this plenum length, the increased expansion would essentially generate no
difference in diffusion capability or corresponding flow losses as compared to the current
design since it would simply be seen as a common sudden expansion. Consequently, the
90 degree bend was implemented to create greater experimental versatility and ensure that
the facility would be able to remain in the same laboratory room even if the test section
were elongated to support greater z/d spacings.
As the name implies, the plenum serves to “diffuse” the concentrated stream of air
from the downstream pipe. Therefore, the fluid must flow from a lesser area to a greater
area. The basic dimensions of the diffuser plenum include a 47 in x 47 in
(1.19 m x 1.19 m) exit area that is 24 in (0.61 m) deep. The diffusion of the pipe airflow
into the diffuser plenum can be seen as a sudden expansion. Although the inlet diverter
plates of Figure 22 would help to diminish the losses of such a case, a conservative
estimate of the flow losses was considered which neglects their loss reduction effects.
This was done to ensure that the calculated facility component dimensions determined by
the losses calculator would be capable of producing the desired jet Reynolds numbers.
Therefore, considering the conservation of mass, momentum, and energy equations, the
loss coefficient associated with this sudden expansion can be expressed as:
⎛
A ⎞
K L = ⎜⎜1 − 1 ⎟⎟
A2 ⎠
⎝
2
(18)
where A1 is the upstream area (area of the pipe) and A2 is the downstream area (crosssectional area of the diffuser plenum. A calculation reveals that the associated loss
coefficient is 0.95. The diffuser plenum as a whole sees both the losses due to the
90 degree bend as well as those due to the sudden expansion. Therefore, the total loss
49
coefficient created in the diffuser plenum is simply a sum of the component losses, or
KL = 1.15, and the total system loss is given by Equation (15).
Flow Straighteners
According to the conservation of mass, the mass flowrate in the pipe must equal
that in the plenum. Therefore, the larger plenum area also serves to slow the airflow
velocity as governed by the following:
ρA1V1 = ρA2V2
(19)
where V1 is the velocity in the pipe and V2 is that in the plenum. The flow immediately
following the bend in the diffuser is non-uniform, and therefore, a series of flow screens
serve to promote uniformity and reduce turbulence and pressure fluctuations. The flow
conditioners consist of a sequence of one honeycomb section followed by two stainless
steel mesh screens. The honeycomb panel produces a relatively low pressure drop,
rendering it rather ineffective against streamwise non-uniformities and fluctuations
[Lindgren and Johansson (2002)]. However, honeycomb is very effective in reducing the
lateral components of the mean velocity and of the larger turbulent eddies, thereby
minimizing flow swirl, and straightening the flow path from the 90 degree turn to be
normal to the flow exit plane [Mehta and Bradshaw (1979)]. Generally, the panel will
break up eddies larger than the cell size and reduce the overall free-stream turbulence
level [Lindgren and Johansson (2002)]. The effectiveness of a honeycomb panel in
reducing these cross-stream fluctuations is attributed to the nature of the cell grid which is
elongated in the flow direction, but a sufficient length of six to eight cell diameters is
necessary for its effects to be realized [Mehta and Bradshaw (1979)]. The honeycomb
panel used in the present study is 2 inches (5.08 cm) thick with a 0.25 inch (0.635 cm) cell
50
diameter, thereby meeting the requirements for an adequate honeycomb section size. The
honeycomb itself will actually produce some turbulence of its own on the same order as
the cell diameter. This turbulence diminishes much slower than that from a screen, and
therefore, two successive screens follow the honeycomb section to reduce this turbulence
effect.
The idea of a mesh screen to enhance flow uniformity was first proposed by
Prandtl (1932) and has been frequently implemented in impinging jet facility designs such
as those used in the experimental work of Van Treuren (1994), Gao et al, (2003), and
Saxena et al. (2003), just to name a few. Screens, much like contractions, serve to reduce
the longitudinal components of turbulence and promote more uniform flow profiles by
imposing a static pressure drop proportional to the square of the approaching velocity and
the loss coefficient. The loss coefficient was quantified by Wieghardt (1953) as:
KL
(1 − β ) ⎛⎜ Vd ⎞⎟
= 6.5
−1
3
β 2 ⎜⎝ βν ⎟⎠
(20)
where β is the open area ratio, V is the approaching velocity, d is the wire diameter, and ν
is the dynamic viscosity. The equation shows that the loss coefficient is inversely
proportional to the approaching velocity; therefore, the reduction in plenum velocity as
determined from Equation (19) will produce a larger pressure drop across the screen. At
first this may seem like an adverse effect as the previous components were sized to
minimize flow losses; however, according to Mehta and Bradshaw (1979), a large KL is
necessary to promote a sufficient pressure drop that will effectively remove the mean
velocity fluctuations. It was found that a KL value of approximately 2.8 will eliminate the
majority of flow unsteadiness. Therefore, the higher loss coefficient created by the
51
reduced flowrate is actually desirable, and in turn, the small velocity produces an
insignificant contribution to the overall system pressure loss which is determined by
Equation (15). For the current blower fan capabilities, a loss coefficient in the range of
4.4 to 6.2 is produced in the screens.
The screen is essentially a hydrodynamic resistance to the flow that, when
confined within a constant area flow path such as the plenum box, experiences a drag
force. This drag force reduces the total pressure of the air flowing through the screen
without affecting the local average velocities; however, where the local velocity is higher
than the average, the drag force will also be higher, thus, tending to equalize the total
pressure across the plenum cross section effectively reducing velocity variations [Mehta
and Bradshaw (1979)]. The combination of several screens in series will significantly
reduce these mean velocity fluctuations and turbulence to an acceptable level,
For the current facility design, two standard 0.011 inch (0.2794 mm) wire diameter
mill-grade mesh screens with an open-area ratio of 0.51 were used in conjunction with the
honeycomb panel to promote a uniform flow field. The first screen was placed directly at
the exit of the honeycomb panel to encourage the reduction of both longitudinal and
lateral fluctuations. A 5.5 inch (13.97 cm) settling chamber was installed before the next
successive mesh because, as with the exit of the honeycomb, the exit of the screens also
produces a small amount of turbulence, although much less than would be at the exit of a
honeycomb alone. A 500d distance is thus required post-mesh to allow the small amount
of wire-induced turbulence to decay [Cheong (2002)]. A second mesh of the same
proportions as the first then serves to further eliminate the velocity fluctuations, and a
52
second 5.5 inch settling chamber is again affixed to the facility to allow the slight flow
unsteadiness to settle.
Screens successfully reduce the streamwise components of turbulence; however,
they are not as successful in reducing the lateral components. Therefore, the honeycombscreen combination, which effectively reduces both lateral and longitudinal nonuniformities and fluctuations, is ideal for basic wind tunnel design and the present facility
development. Figure 25 shows a side view of the plenum chamber and the sections
following its exit.
Figure 25 – Plenum sections side view of the current facility
Heater Mesh
Following the two 0.51 open-area ratio screens, is a third screen of 0.38 open-area
ratio. This screen serves two purposes. The first is to provide one final mesh screen to
reduce any remaining flow uniformities. Groth (1991) determined that a cascade of
53
successive wire mesh screens of progressively finer mesh serves to reduce flow variation
substantially. This is again accomplished with a nearly non-existent effect to the overall
system pressure loss due to the same low-velocity flow condition found with the previous
screen sections. The second reason is to provide heating to the facility through a heater
mesh component first developed by Gillespie (1993). However, several other methods of
heating the airflow have also been used in experimental heat transfer facilities. One
method involves pre-heating the flow and using valves to divert it away from the test
section until a steady state flow temperature has been reached. When the flow reaches
thermal equilibrium, the valves are quickly switched and airflow is allowed to pass
through the test section providing a near step increase in temperature [see Van Treuren et
al. (1994), Gao et al. (2003), and Kanokjaruvijit and Martinez-Botas (2003)]. Other
methods involve heating the target surface rather than the airflow to examine the
convective heat transfer effects [San and Lai (2001)]. However, for the current design,
the heater mesh concept was implemented.
The heater mesh provides several advantages. First, the need for a fast acting
valve system is avoided. This allows for multiple experiments to be run in a short time
frame since there is a shorter waiting period for the test section to return to ambient
temperature. The nature of the heater mesh itself, thus, simplifies the heating process and
allows for rapid temperature switching in low-speed flows. Although the change in
temperature is not considered a true step-change (< 0.1 sec), the time constant can easily
be accounted for by Duhamel’s Superposition Principle (Equation (12)) presented in
Chapter Three.
54
Figure 26 – Heater mesh component schematic
The heater mesh (Figure 26) is created by soldering a 316-stainless steel fine-wire
(40 μm / 1.575 x 10⁻³ in diameter) mesh between two sets of brass bus bars using silver
solder (see Appendix C for mesh production instructions). The mesh is housed within a
wooden frame which helps to insulate the heat and ensure greater heater efficiency. This
efficiency can be found by:
η=
Tdown − Tup
Tmesh − Tup
(21)
where Tdown is the temperature downstream of the mesh, Tup is the temperature upstream of
the mesh, and Tmesh is the actual temperature of the heated mesh. A typical heater mesh
efficiency is approximately 0.55, which means that the mesh temperature is roughly twice
the temperature difference from the inlet air as the exit temperature is from the inlet
[Cheong (2002) and Ireland (2005)]. A simple current-producing device, such as an arc
welder or car battery, is connected to the brass bus bars to provide energy to the mesh, and
55
thus, the airflow. A downstream temperature produced by such a device is determined
with the known power output by:
Tdown =
IV
+ Tup
m& c p
(22)
where I and V are the supplied current and voltage respectively, m& is the mass flowrate,
and cp is the coefficient of heat. For the arc welder, the amperage is simply a dial
adjustment, and the associated voltage can be measured by a Phillips PM2525 Multimeter
with leads connected to the welder electrodes. For a car battery, the battery voltage and
the natural resistance of the mesh (approximately 0.074 Ω – see Appendix D) draw
enough current necessary to satisfy Ohm’s Law (V = IR). The current can then be used
with the voltage measure and Equation (22) to determine the downstream temperature.
For the present design, a Miller Syncrowave 250 arc welder provides sufficient power to
produce almost 47°C (116.6°F) downstream of the mesh by providing 18.5 volts DC and
250 amps for a mass flowrate of 0.2 kg/s (0.441 lbm/s).
Test Section
Once the air is heated, it travels a 3.5 inch settling chamber before encountering
the test section. The test section consists of an impingement plate, target plate, and
spacers as seen in Figure 27. The entire test section is constructed out of Plexiglas whose
material properties make it an ideal candidate for experimentation. The low thermal
conductivity and diffusivity of Plexiglas permit the use of the one-dimensional semiinfinite solid assumption and also serves to naturally insulate the test section thereby
ensuring that the only heat effect is the convective heat transfer of the jets acting on the
target surface. The transparency of Plexiglas is also beneficial because it allows for the
56
liquid crystal thermal profile to be visible through the Plexiglas. A camera system can
therefore be set up behind the test plate and still collect the transient experiment images
for post-processing analysis.
Exit Flow Direction
8d
Target Plate
z
8d
Plate Spacer
Impingement Plate
Figure 27 – Impingement array geometry [Robertson and Van Treuren (2005)]
The array geometry is modeled after the works of Kercher and Tabakoff (1970),
Van Treuren et al. (1994), and Kanokjaruvijit and Martinez-Botas (2003), among others.
The impingement plate is an 8 x 8 jet array of 0.7344 in (18.65 mm) diameter holes,
uniformly spaced 8d in both the streamwise and spanwise directions as shown in
Figure 27. The impingement holes in the array are sharp-edged to be indicative of current
turbine blade design which utilizes rows of laser-drilled holes. Van Treuren (1994)
presented detailed turbine blade images in which the jet hole was examined under a
scanning electron microscope to enhance the visual geometry of the hole. Figures 28(a)(c) show an actual turbine blade insert from this study.
57
(a) Suction surface
(b) Pressure surface
(c) Jet hole
Figure 28 – Sample turbine blade impingement hole geometry from a formerly operational
Rolls Royce engine [Van Treuren (1994)]
58
Figure 28(a) shows an inline array on the blade suction surface with jet hole
diameters of 0.48 mm (0.189 in) and an ℓ/d of 0.75. The hole spacing is 7d in the
streamwise and 5d spanwise with the number of spanwise holes ranging from two to six
for a given streamwise row, with the larger occurring in the midspan region. The pressure
side (Figure 28(b)) jet hole diameter is almost twice as large at 0.95 mm (0.374 in), while
spacing is about half. These figures and data, courtesy of Van Treuren (1994), help
provide a visual basis for the chosen impingement array model developed in the current
study. The inline array is not only representative of current impingement models
(examined in Chapter 2), but it is also very characteristic of the actual turbine blade. Also,
the current model contains impinging jet hole diameters approximately 20 to 39 times that
in an actual gas turbine engine and nearly three to four times larger than any facility of
comparable array size and jet Reynolds numbers, thereby satisfying the first objective
outlined at the close of Chapter 1.
The 8 x 8 geometry was chosen to be very representative of the literature. This
will allow for accurate comparison between the results of the current facility and that of
previous designs. Although the array seems much larger than that of the actual turbine
blade as seen in Figure 25, the enlarged design allows for the examination of the middle
jet section, away from the upper and lower walls and their associated boundary layers, so
that simply the effects of the impinging jets themselves may be analyzed accurately. The
enlarged hole size was also chosen for several reasons. The first is so that a more detailed
assessment of the heat transfer effects of an array of impinging jets could be analyzed than
ever before. To the author’s knowledge, no other experimental facility contains an array
of jet holes as large as the present design while still capable of delivering jet Reynolds
59
numbers of 45,000. This enlarged jet area will allow for the heat transfer features of the
impinging jet to also be enlarged, and thus, analyzed in greater detail to better determine
the characteristic nature of their heat transfer effects. The larger jet diameter will also
provide enough area for a hotwire or computational fluid dynamics (CFD) study on the
same impingement array.
Figure 27 also shows a plate spacer between the impingement and target plates.
This serves to confine the test section on three sides, allowing spent air to exit in only one
direction which represents the post-impingement flow across the surface of a turbine blade
within a gas turbine engine. This spacer is placed at one diameter distance from the exit
of the jet hole to allow for accurate comparison with the literature, such as Florschuetz et
al. (1981), Van Treuren (1994), and Gao et al. (2003).
The heated air impinges upon a liquid crystal coated target surface. The surface
provides a chromatic temperature profile of the jet-induced heat transfer which, when used
in conjunction with its corresponding time required to reach the indicated temperature,
allows for the determination of the local heat transfer coefficient and adiabatic wall
temperature. Liquid crystals were used because of their significant advantage over
thermocouples. Firstly, liquid crystals are much quicker to implement than adhering
thermocouples to the test plate at all desirable locations. Liquid crystals are applied to the
test surface by an air brush. With this technique, a thermally thin layer of approximately
20 μm can easily be applied to the test surface. Secondly, liquid crystals create a
continuous surface model flow field that thermocouples cannot. Thermocouples are
unable to give an exact temperature at every point on the test surface due to the nature of
their construction. They require wire leads either to run through or across the test plate.
60
For either situation, extreme care must be taken to ensure that the target surface is smooth
to prevent tripping the boundary layer which can introduce conditions that will affect the
jet heat transfer investigation. Liquid crystals remove this situation as the entire surface is
uniformly coated in the crystal itself to provide a smooth test surface. However, the use
of liquid crystals does require some form of temperature measurement whereby the liquid
crystal color intensity at a particular location can be compared to a known value of
temperature so that a calibration curve can be created. Therefore, four surface
thermocouples are applied to the target surface by means of a thin layer of adhesive glue.
Two thermocouples are applied between jets, and two are applied at the center of the jets
as shown in Figure 29. The calibration technique is discussed in Chapter Five.
Figure 29 – Surface thermocouple locations (indicated by an “x”)
The main form of temperature measurement for the current study however, uses
three crystals applied to the target surface. Although the double crystal technique
described in Chapter Three outlines the need for only two crystals, the third is used mainly
to provide longer test times in the regions of high heat transfer. With a large enough
61
temperature difference created by the heater mesh, so that the third crystal can provide a
sharp enough peak in intensity, it can also provide an extra check in the heat transfer
coefficient calculation as well.
The present study uses one-degree wide liquid crystals. This creates a sharp color
contrast that provides the clear peak in intensity necessary to accurately determine the
associated specific time to calculate the heat transfer coefficient in Equation (11).
However, care must be taken in choosing the operating temperature of the crystal to
minimize the experimental uncertainty. The crystal temperatures must demonstrate
sufficient separation so as not to exhibit interfering color play intervals, and the difference
between the driving gas temperature and these crystal temperatures must be large enough
to minimize errors by ensuring a definitive intensity peak [Van Treuren (1994)]. For this
reason, a 25°C, 30°C, and 35°C crystal combination was used (Hallcrest R25C1W,
R30C1W, and R35C1W).
Image and Data Acquisition
In order to better visualize the liquid crystal, a thin layer of aqueous black backing
paint (Hallcrest BB-G1) is applied to the target surface after the three liquid crystal layers
have already been sprayed. The coating on the target surface is illustrated by Figure 30.
The black paint simply provides a dark contrast to the bright display of the liquid crystal
so that the visual heat transfer is more vibrant. To ensure that the camera system will only
capture the color intensity emanated from the crystals, the test is performed, with the test
plate illuminated only by a controlled light source. For this purpose, a fluorescent light is
mounted both above and below the test section to provide uniform lighting. A typical
incandescent light source would not suffice for experimentation because of the nature in
62
which it produces light. The incandescent light bulb glows because electricity flows
through a filament, which offers resistance, which transforms the electrical energy into
heat, much like how the resistance in the heater mesh creates heat when supplied with
power from a car battery. This heat makes the filament white hot, thereby producing
light. On the other hand, fluorescent lights use electric current to stimulate mercury
atoms, causing them to release ultraviolet photons, which in turn stimulate phosphors.
These phosphors emit visible light photons creating a four to six times more efficient,
non-heating, “cool” light. Therefore, fluorescent lights provide the illumination necessary
to view the crystal’s color play without contributing additional heat to the test plate.
Triple Crystal
Layers
Black Paint
Layer
Black Paint
R35C1W
R30C1W
R25C1W
Plexiglas
Plexiglas
Camera
Figure 30 – Liquid crystal layers on the target surface
In order to capture the images from the liquid crystal color play, an adequate
camera system is required. Heat transfer experimentation has utilized several different
types of camera systems including RGB [Wang et a. (1996), Lee et al. (1997), and Gao et
al. (2003)], CCD [Van Treuren (1994), Van Treuren et al. (1996), and Gao and Sunden
(2002)], 3CCD [Kanokjaruvijit and Martinez-Botas (2003)], and infrared [(Hollworth and
63
Bowley (1975)]. For the present study, a three-chip CCD camera system was selected.
The 3CCD camera produces the greatest color resolution of the systems available.
Compared to a the single-chip CCD camera, the 3CCD system provides three times the
color resolution as there are three different chips, each capable of storing one component
of color. Since the entire chip is dedicated to one facet of color; either red, green, or blue;
a greater resolution of the color intensity can be captured. Similarly, RGB cameras (or the
common consumer camera) are incapable of matching the color resolution of the 3CCD.
However, they have often been used in heat transfer experimentation because they are
significantly less expensive, and can still provide a good heat transfer image, but its
limitations are confined to smaller impingement arrays and geometries than the current
design [see Wang et al. (1996), Lee et al. (1997), and Gao et al. (2003)]. Infrared camera
systems, by design, offer the greatest potential contribution to heat transfer studies as they
provide a thermal image that can give a direct temperature reading without the
thermochromatic liquid crystals and image analysis required from the other three systems.
However, this convenience comes at a very significant cost increase, and it is therefore not
used for the current test.
The primary goal in the selection of the camera system was to establish a state-ofthe-art image acquisition system. Therefore, the 3CCD camera chosen was a Sony
DXC-C33. The camera is IEEE-1394 (FireWire) compliant allowing for faster transfer
rates of 30 images per second. This is a significant improvement over the previous Baylor
University image acquisition system which acquired an image every six seconds. Clearly,
this means that more images will be taken per transient test, which provides greater detail
into the jet activity and interaction that will allow for a more detailed view of the
64
formation of each individual aspect of the impinging jet’s contribution to heat transfer.
This can possibly lead to image acquisition of developing features too quick for the
previous system and the naked eye that will provide greater depth into the characteristic
nature of jet impingement. The Sony camera system is also digital, which provides
greater resolution over the previous analog signal which required simultaneous capture
and digitization during data acquisition. This aids in the image acquisition speed by
simplifying the image acquisition process. A Fujinon VCL-616WEA C-mount camera
lens was also added to the camera to provide the capability of expanding to view the entire
impingement array without distortion, as well as zoom in on a single jet to provide
excellent resolution and detail.
The image acquisition is run via a LabVIEW program which successively captures
the images from the camera and stores them in the computer memory for post-processing.
This program is shown in Appendix E. Simultaneous data is also collected by a Fluke
Hydralogger data acquisition system. The system allows for the concurrent logging of the
orifice pressure, upstream temperature, plenum temperature (four locations), jet
temperature, surface temperatures (four locations), and room temperature. Overall, the
system provides for the capability of measuring 20 input devices.
A different data acquisition system was also investigated, the National Instruments
SCXI-1600 USB data acquisition system. The system allows for the same measurements
as the previous system, but at a much faster rate with more channels. The system provides
for the capability of measuring 32 thermocouple inputs and 8 input/output devices. The
SCXI-1102 Thermocouple Input Module provides 32 thermocouple input channels that
each include an instrumentation amplifier and a 2 Hz lowpass filter designed for high-
65
accuracy temperature measurement that provides cold junction compensation to an
accuracy of 0.1°C. The data acquisition device itself connects to the computer by a USB
connection which was selected to allow for the greatest mobility and modularity so that
the system could be transported for use with other laboratory experimental data collection
as well as the current facility. The system also provides the means for an all-in-one
trigger start, whereby the push of a single button, the entire experiment can be started and
data acquired through an easy LabVIEW interface. This however, was not implemented
into the present design, but the system was investigated and chosen with its future
implementation in mind.
CHAPTER FIVE
Experimental Investigation
This chapter explains the instrumentation employed as well as the experimental
procedures and the techniques used in the validation of the impinging jet test facility. The
calibration methods and data reduction techniques for the liquid crystal thermography are
also discussed.
Instrumentation
In order to validate the experimental facility, the apparatus must be instrumented.
The mass flowrate input into the system by the fan was measured using a Mamac
PR-274-R4 Pressure Transducer. The transducer was connected to the orifice via
0.25 inch (0.635 cm) flexible plastic tubing, and the transducer was connected to the data
acquisition system by a pair of wire leads. The transducer jumper was set to read a range
of 0-15 inH20 pressure differential across a voltage range of 0-10 volts, but the jumper
could be reconfigured to read a variety of smaller pressure differential ranges across the
same full scale voltage range or a smaller voltage range depending upon the data
acquisition device’s capabilities (see Mamac PR-274-R4 User’s Manual for other jumper
configurations). The present range however, allows for the full capable fan flowrate to be
measured.
The target plate is instrumented with four surface thermocouples as described
previously and shown in Figure 29. The thermocouples are Omega “Cement On” Thin
Foil Type K Thermocouples (Catalog #CO2-K). These thermocouples are constructed of
a very thin foil (thickness = 0.005 in (0.0127 cm)) that was easily run along the surface of
66
67
the plate to a female thermocouple connecter adhered to the edge of the target plate. A
10 ft (3.05 m) K-type thermocouple wire extender then connected each of the surface
thermocouples to the data acquisition device. Similarly, six other thermocouples were
inserted into the facility: five in the heated settling chamber section, and one in the pipe
downstream of the orifice. Each of these thermocouples was made of the same K-type
thermocouple wire as the extenders, and the tip was soldered together using an Omega
Thermocouple and Fine Wire Welder (Model TL-WELD). The wire was then inserted
into a 0.125 inch (0.3175 cm) outer diameter brass rod, with the tip extruding from the
opposite end, which provided the wire with rigidity. Four of the thermocouples were
placed 8d inward in both the streamwise and spanwise directions from all four corners of
the settling chamber, halfway between the heater mesh and the impingement plate. This
allowed for thermal monitoring of the approaching air temperature. The fifth
thermocouple placed in the settling chamber was positioned directly in front of the hole
12d from the top of the test plate and 4d inward from the left-hand side in order to provide
a measure of the air temperature just prior to entering the test section. The final
thermocouple was inserted into the downstream pipe, five pipe diameters from the orifice
plate. All of these thermocouples were provided with a ten foot length and were directly
connected to the female connectors of the data acquisition device.
Experimental Procedure
This is the procedure for the current study, which does not utilize the data
acquisition device and the camera system specified in the previous chapter. However, the
procedure for using those devices is presented in Appendix F. The current process, which
instead uses a stop watch and the visual identification of the color intensity peaks, also
68
uses a Fluke Hydralogger to acquire the instrumented data. The experimental procedure is
as follows:
1. Ensure that the test plate is properly secured to the spacers and impingement plate
via the attachment clips. In the event that any part of the test section has been
replaced (i.e. impingement plate, spacers, or target plate), ensure that all joints are
sealed with silicone to prevent leakage in the test section.
2. Measure and mark the center of each impingement hole desired to be tested on the
target plate (since the black backing was applied to better view the crystal, the jet
hole can no longer be seen through the Plexiglas). A measure of 3.44 in (8.73 cm)
downward and inward from the top right corner of the impingement plate was used
as the experimental jet. This will allow for better accuracy in determining the heat
transfer coefficient at the stagnation point.
3. Check the pressure transducer connections and ensure that the tubing is connected
to the proper “high” or “low” side of the orifice and transducer. Ensure that the
jumper is properly placed within the Mamac PR-274-R4 Pressure Transducer
according to its User’s Manual so that a 0 to 15 inH2O pressure differential can be
measured. This pressure differential range will be adequate for the entire span of
the fan’s capabilities. (For more precise measurements, the jumper placement can
be modified per its User’s Manual)
4. Turn on the Fluke Hydralogger and computer. Load file <httest1.ini>. This will
load the configuration of the thermocouples and pressure transducer. This file
configuration sets up the 11 thermocouple inputs as channels 1-11 and the pressure
transducer input as channel 12. This can be verified by selecting <Show Setup>.
69
Check the thermocouple connections to ensure that they are secure and are input
into the proper channels. Ensure that the pressure transducer is wired into the
proper channel.
5. Initiate the program so that temperature measurements can be made. Make certain
that there are no open circuits by viewing the output and making sure that every
thermocouple has a temperature output and does not read TOC, or thermocouple
open circuit.
6. Inspect the fan to be sure that there is no loose debris in or around the inlet area.
Remove all paper and other lightweight objects nearby that could easily be sucked
into the inlet of the fan.
7. Turn on the blower fan by (1) pulling out the red knob on the back of the fan near
the fan control panel, and then (2) pressing the green button (see Figure 31).
Figure 31 – Fan control panel
Allow the control panel approximately ten to fifteen seconds to initiate itself and
warm up (a “click” will be heard when it is ready). (3) Press the LOCAL button,
70
followed by (4) the FWD button. This will start the fan. (5) Adjust the fan to the
desired flowrate by increasing/decreasing the flowrate in whole number
increments from 20Hz to 60Hz using the or keys. A pre-calibrated flowrate
curve has been created to match the fan setting with its corresponding mass
flowrate. This data curve is presented in Appendix G.
8. Allow the system to run until the thermocouples all reach a uniform reading.
9. Set the dial on the arc welder to the desired current output based on the calculation
of Equation (22). After the temperatures have steadied in the test section, the
experiment is ready to begin.
10. The method of data collection for the present study involves two people, one to
operate the arc welder, and other to run the three stopwatches. The timer must
position himself to get a good view of the jet hole he wishes to examine by using
the marked hole as a guide. On his count, the welder switch is turned on and the
timers started simultaneously. When the yellow-green color of the first crystal
reaches the grid point, timer one is stopped, but timers two and three continue to
run. When the second crystal reaches the yellow-green color over the grid point,
the second timer is stopped as well. Similarly, when the third crystal reaches
yellow-green, the third timer is stopped. Record the three times.
11. The experiment is now finished. Turn off the arc welder but do NOT turn off the
blower fan. It is extremely critical that the fan is left on to continue cooling the
heater mesh to prevent it from burning up. Once the test plate returns to its
original black color (i.e. crystal color play has ceased and the temperatures shown
71
on the Hydralogger are at approximately room temperature), the Hydralogger data
acquisition may be ceased by clicking <QUIT>.
12. The fan may then be turned off by first (7) pressing the red button, and then by (8)
depressing the red knob (see Figure 31).
With the known time values and the corresponding temperature values obtained from
a calibration using the surface thermocouples (calibration described in the following
section), the double crystal technique creates two forms of Equation (11) that can now
be solved for the local heat transfer coefficient and adiabatic wall temperature.
Liquid Crystal Calibration Method
The current experiment uses a method used by Li et al. (1988) and Jones (1992)
which does not use a camera system with an image processor. Li et al. (1988) determined
that visual perception of the yellow-green isotherm was sufficient for determining the heat
transfer coefficient for a location on the target surface. For experimentation, three
Hallcrest narrowband liquid crystals, R25C1W, R30C1W, and R35C1W, were used to
cover the desired experimental temperatures. The intensity method involved calibrating
all three liquid crystals for the peak intensity temperatures. With the prepared test plate in
place, the calibration was performed under the controlled lighting conditions of the heat
transfer experiment produced by the fluorescent lamps. A surface mounted thermocouple,
located beneath an impinging jet, was used for calibration. The surface was slowly heated
by incrementally increasing the supplied amperage from the arc welder. When the thin
yellow-green band appeared to be directly on top of the thermocouple tip, the temperature
was recorded by a handheld Fluke 52 K/J Thermometer directly connected to the surface
thermocouple leads. This was performed until each of the three crystals had reached the
72
yellow-green peak intensity state over the thermocouple tip. The initial calibrations for
the narrowband crystals were 26.6°C, 32.5°C, and 37.8°C.
The procedure for calibrating the liquid crystal color intensity using the three-chip
CCD camera and NCXI data acquisition systems is also presented in Appendix H.
Jet Hole Discharge Coefficient
Flow uniformity through the jet holes was verified by examining the discharge
coefficient of each impinging jet. The discharge coefficient is a ratio of the average
flowrate of each jet to the flowrate obtained from the Bernoulli Equation. The average
flowrate was obtained by measuring the total mass flowrate through the orifice and then
dividing it evenly between the 64 holes to obtain an average jet flowrate per hole. The
flowrate at each jet hole was then calculated from pressure measurements made at the
centerline of each jet hole. This flowrate, Qideal, can be described by:
Qideal = A j
2 Δp
ρ
(23)
where Aj is the jet cross-sectional area and Δp is the pressure differential measured at the
jet hole centerline. A pitot-static tube was used to measure the pressure diferential exiting
each jet hole. A Mamac PR-274-R4 Pressure Transducer was used to convert the pressure
to a voltage signal which was read by a Phillips PM2525 Digital Multimeter. The jumper
was set for a range of 0-15 inH20 across a full scale output of 0-10 volts. With the target
plate removed from the facility, five pressure measurements were taken at each jet hole
centerline, and the results were averaged for use with Equation (23).
Non-ideal effects can occur for two reasons. The first is that the flow through the
jet hole actually forms a vena contracta as seen in Figure 32(b).
73
(a)
(b)
Figure 32 – Fluid ejection through a jet hole (a) ideal, (b) actual
In this case, it is clear that the diameter, and therefore, the resulting cross-sectional area of
the vena contracta, Av, is less than the area of the jet hole, Aj by some unknown amount.
Therefore,
Av = CD Aj
(24)
where CD is the contraction coefficient, or the coefficient of discharge. The second reason
for non-ideal effects is created by the swirling flow and turbulent motion of the fluid near
the orifice plate, which introduces a head loss that must be empirically derived [Munson et
al. (2002)]. Therefore, the discharge coefficient accounts for these effects by:
Q = C D Qideal = C D A j
2 Δp
ρ
(25)
The average discharge coefficients measured for the current study were distributed as
follows for a Reynolds number of approximately 20,000:
74
0.8023
0.8004
0.8008
0.8017
0.8021
0.8017
0.8000
0.8001
0.7989
0.8006
0.8023
0.8007
0.8024
0.8023
0.8012
0.8024
0.8017
0.8005
0.8015
0.8014
0.8016
0.8016
0.8025
0.8023
0.8019
0.8014
0.8024
0.8019
0.8031
0.8029
0.8018
0.8014
0.8012
0.8019
0.8009
0.8017
0.8009
0.8035
0.8032
0.8036
0.8024
0.8018
0.8027
0.8022
0.8037
0.8031
0.8038
0.8023
0.8013
0.8018
0.8027
0.8021
0.8041
0.8034
0.8026
0.8024
0.8013
0.8013
0.8014
0.8029
0.8020
0.8020
0.8018
0.8020
Figure 33 – Discharge coefficient distribution across the impingement plate
The average jet discharge coefficient was found to be 0.802 with a maximum percent
difference of 0.375%. This is very similar to the 0.80 value for CD obtained by
Florschuetz et al. (1981) for the same jet Reynolds number and an ℓ/d = 1. The value also
falls directly in line with the results obtained from McGrehan and Schotsch (1988) and
Bailey and Bunker (2002) who also obtained discharge coefficients equal to 0.80. The
experimental value also finds very close agreement (within 2.2% difference) with
James (1961), Van Treuren (1994), and Hay et al. (1987). A comparison between these
results and the current study is presented in Table 3.
75
Table 3 – A comparison of discharge coefficients
This validates the facility for jet flow uniformity, which allows for further comparison of
the test rig and the resulting heat transfer coefficients.
Local Heat Transfer Coefficient
The local heat transfer coefficient was examined at the stagnation point of the
upper right hand corner jet. By the procedure described at the beginning of this chapter,
test times of the crystal were measured and recorded. Five test times were obtained and
averaged for the second and third crystal (R30C1W and R35C1W) for a range of average
jet Reynolds numbers spanning 14,000 to 44,000. However, the heater mesh is unable to
make a proper step change in time (<0.1 sec) and therefore, a time constant, τ, must be
accounted for [Gillespie (1993)]. Using the correlation equation developed by Gillespie
(1993), the time constant is given by
τ = 0.0840u −1.014
(26)
where u is the mesh velocity. A calculator was then developed to iteratively calculate two
simultaneous equations of the form Equation (12). This calculator is shown in Appendix
I. The initial inputs are highlighted in yellow. With an initial guess of the beta (β) value
from Equation (12), the adiabatic wall temperature and local heat transfer coefficient can
76
be calculated. The resulting stagnation point Nu are shown in Figure 34. These values
were compared with the correlation obtained by Van Treuren (1994), which was given by
the following:
Nu = 0.567 Re jet
0.511
(26)
where Rejet is the local jet Reynolds number obtained by using the calculation program
developed by Florschuetz et al. (1982) which predicts the crossflow distribution resulting
in the local jet Reynolds number for each row of jets.
Figure 34 – Stagnation point Nusselt numbers at streamwise jet row one
Figure 34 plots the measured stagnation point Nu for a first row jet. From the data,
a least squares fit was obtained to correlate Nu for a given local Rej. This correlation is
given by the following equation:
Nu = 0.7681Re j
0.4851
(27)
This equation is a general correlation for stagnation point Nu in the absence of crossflow
for the conditions tested. This correlation gives a maximum percent difference of only 5%
77
for Rej in a range of 10000 to 50000 when compared to the results obtained by Van
Treuren (1994) in Equation (26). For all actual measured values, the largest percent
difference with the predicted Nu correlated by Van Treuren (1994) was approximately 8%
at the maximum blower fan setting of roughly Rej, local = 37,500 (Rej, avg = 44,000). This is
within the criteria of 10% required for satisfactory facility validation outlined in Chapter
One.
For the calculation of the local Nusselt number, the experimental uncertainty was
determined by the method of Moffat (1988). The greatest experimental uncertainty was
determined at local Rej = 18,850. The calculated Nu for this condition was found to be
84.813 ± 5.943 (20:1 odds). This yields an experimental uncertainty of 7.01%.
Flow Field Interpretation
With the implementation of the camera and data acquisition system, a complete
transient map of local heat transfer coefficient and adiabatic wall temperature can be
obtained. However, for the current study, only the single stagnation point described in the
previous section was used to validate the facility. The camera was however used to
analyze the flow field and local heat transfer features beneath the inline array of
impinging jets. The thermal map produced by the liquid crystal color play gives an
indication of the relative heat transfer levels over the target surface. The color play
initially appears in areas of highest heat transfer (which is typically, beneath the jet).
Then, as the transient experiment progresses, the areas of lower heat transfer gradually
exhibit the color play, as the areas of higher heat transfer begin to transition into the color
play of the higher temperature crystal (i.e. from R25C1W to R30C1W or R30C1W to
R35C1W). This process can be seen in Figure 35. As shown in the figures, the transition
78
lines for the narrowband liquid crystal form a sharp, thin color transition. The flow is
from right to left (for all subsequent figures).
t = 5 sec
t = 30 sec
t = 15 sec
t = 60 sec
Figure 35 – Time sequence for average Rej= 14,050
The sequence of images are for average jet Reynolds numbers of 14,050 and a z/d = 1.
Figure 35 shows the formation of the jet interaction over time. It is important to note the
circular nature of the thermal contour in the first row of jets (Figure 36). The contour is
79
circular because the influence of crossflow is minimal. The only crossflow present is that
portion of the spent flow which moves toward the closed end before proceeding
downstream between the first row jets. The first row is thus an indication of the effects of
each jet without crossflow, and the spent air from the first row of jets then causes
crossflow in the second row. The crossflow continues to accumulate for each subsequent
row of jets until it exits from the test section.
Figure 36 - Thermal contour of a first row jet
The most prominent feature of Figure 35 is the distortion of the jets downstream of
the first row. This is attributed to crossflow. Crossflow affects the impinging jet in two
ways. First, it attempts to displace the jet downstream of the jet exit; and secondly, it
seemingly prevents the impinged jet from spreading in the upstream and spanwise
directions. Both of these effects tend to elongate the circular footprint of the jet from that
seen in the first row of jets. The spent flow that would typically spread radially outwards
80
in all directions to form circular contours, can now only spread in the downstream
direction because of the upstream crossflow colliding with the jet core. This generates
enhanced heat transfer at the back of the jet from the increased flow in that direction,
hence, the elongated jet. With each subsequent jet row, the amount of crossflow
increases, and its effects strengthened. This causes greater jet elongation with each
downstream jet row. The effect of crossflow on an impinging jet is illustrated in
Figure 37.
Figure 37 – Progressive elongation of impinging jets due to crossflow
(flow from right to left)
An examination of the transient images reveals that the collision between the
crossflow and the core flow also deflects the crossflow to the region between the jets.
This indicates that the impinging jet acts as an obstruction to the crossflow. Since the jet
is a circular contour, its effective footprint creates a reduced area available for crossflow
at the midpoint directly in line with the adjacent jet center. Therefore, a local acceleration
of the crossflow must occur between the jet centers, also known as the jet channel, which
may attribute to the slight increase in heat transfer in this region (Figure 38).
81
Figure 38 – Enhanced heat transfer effects in the jet channel region
Consequently, just downstream of this region, there is more area available for crossflow,
and thus, the local deceleration in crossflow could account for this diminished crystal
color play. With each successive downstream row, massflow is added to the crossflow,
and thus, the highest channel velocity and channel heat transfer is achieved at the last row
of jets. This explains the color play scheme of the impingement channel, which begins at
the back of the array and progressively transitions upstream (Figure 39). However, the
color play in the downstream jets is first impacted at the stagnation point beneath the jet,
and not by the crossflow.
A very significant feature of the impinging jet flow field has also become evident
because of the large scale of the impingement plate: the formation of a hairpin vortex in
the downstream jet rows. A hairpin vortex is characteristic of turbulent flow, whereby
counter-rotating streamwise vortices act as interacting hairpin legs, elongated by the mean
82
Figure 39 – Enhanced heat transfer in the jet channel at the back of the array
streamwise flow with hairpin heads embodied as traverse vortices inclined to the wall.
This means that the legs of the hairpin vortex are comprised of rotational flow, which
augments the heat transfer beneath it, before lifting and finally separating from the wall.
This flow characteristic is generated by the turbulence of the crossflow exhibited in the
region between the jets. Figure 40 shows the generation of the hairpin vortex beginning
with the initial oscillation, and ending with the formation of the hairpin vortex.
Figure 40 – Generation of a hairpin vortex [Acalar and Smith (1987)]
83
Figure 41, shows the thermal footprint of this flow characteristic. From the figure, the
counter-rotational vortical legs of the hairpin vortex are clearly evident by the three heat
transfer streaks running on either side of the core jet. Since the image is only capable of
showing the effects of the hairpin on the target surface, the head of the hairpin vortex is
not evident, as it is out of plane with the target plate.
Figure 41 – Thermal footprint of a hairpin vortex
(top): t = 0.35 sec, (bottom): t = 0.50 sec
For the current study, only the acknowledgement of the existence of the hairpin
vortex is investigated. To the author’s knowledge, no other experimental study has
recorded such a find via thermal mapping, although its existence has been noted through
84
flow field studies involving smoke visualization and CFD techniques [Acalar and Smith
(1987), Jeong et al. (1997), Patel and Roy (2003)]. Further studies should be conducted in
order to quantify the contribution of the hairpin vortex to the overall heat transfer
effectiveness.
t = 5 sec
t = 15 sec
t = 30 sec
t = 60 sec
Figure 42 – Time sequence for average Rej = 28,800
With an increase in the jet Reynolds number, a clear increase in stagnation point
and channel heat transfer levels becomes apparent. Figure 43 shows the impingement
85
array for an average jet Re of 28,800. From these images, a few key features become
apparent. The first is that the area of highest heat transfer has been clearly defined as a
small, circular ring just outside of the stagnation region. This contour is evident in the
first rows of jets, and is illustrated by Figure 44 Several studies have determined this
region to be approximately 0.5d in the radial direction from the jet center [Gardon and
Akfirat (1965), Obot et al. (1979), Van Treuren et al. (1996), and Lee et al. (1997)]. This
increase in heat transfer has been attributed to jet interaction with the relatively quiescent
channel air at the edges of the jet, as well as the local acceleration of flow caused by a
minimum in boundary layer thickness of the wall jet as described in Chapter Two [Van
Treuren (1994) and Lee et al. (1997)].
Figure 43 – Peak in heat transfer at 0.5d from stagnation point
This peak in heat transfer is followed by an additional sudden increase in heat
transfer away from the axial jet center. This region has been experimentally determined
by Obot et al. (1979), Van Treuren (1994), and Lee et al. (1997), among others, to form at
a radial distance of approximately 1.5d to 2d from the stagnation point. This feature is
86
again related to the boundary layer, and is shown in Figure 44. At this point, the boundary
layer is thought to transition from laminar to turbulent, thus, the increase in heat transfer.
With an increase in average jet Reynolds number to 43,300, the characteristic features of
the surface heat transfer remains similar to that of the 28,800 case.
Figure 44 – Secondary peak in heat transfer at 1.5d to 2.0d from stagnation point
CHAPTER SIX
Conclusions and Recommendations
In this final chapter, a summary of the current work is presented with reference to
the aims and objectives outlined in Chapter One, as well as the study’s resulting
contributions to the understanding of impinging jet arrays. The practical significance of
the facility is then outlined and detailed. Finally, recommendations for facility
improvement and future work are discussed.
Summary of the Current Work
A versatile experimental heated wind tunnel facility has been designed, developed,
and validated for jet impingement heat transfer studies. Experiments were conducted for
an inline jet array of uniform diameter jet holes in an 8 by 8 array configuration. The hole
size was enlarged beyond the examined literature studies for a large range of engine
representative Reynolds numbers. A calculation program was developed to determine the
local heat transfer coefficient and driving gas temperature given inputs of measured
surface temperature with time. For the configuration, the effect of the local jet Reynolds
number has been quantified for the local stagnation point heat transfer. A subsequent
correlation relating Rejet and Nu was formulated.
Comparisons were made between the experimental stagnation point data and the
published correlation presented by Van Treuren (1994). The experimental results were
found to match the predicted results within the 10% criteria established in the Objectives.
section of Chapter One.
87
88
Comparisons were also made between the experimental jet discharge coefficient
and published data from several sources. The measured discharge coefficient was found
to correspond closely (within 2.2%) of all literature comparisons with similar
experimental conditions. The facility was therefore validated for flow uniformity through
the jet holes.
For the first time, a thermal footprint of a hairpin vortex has been identified. The
identification of this structure will allow for the determination of the feature’s contribution
to the local and overall heat transfer. The current study however, did not quantify this
contribution.
Recommendations to Improve the Current Facility
The current impinging jet facility provides an accurate model of engine
representative impinging jets with values of local heat transfer closely matching with
previous experimental correlations. However, several improvements to the facility could
be made to upgrade its components. The honeycomb section initially provided flow leaks.
The cause of the leaks was created by the material used in the section’s construction. The
leaks were caused when the Plexiglas frame buckled and broke when it was bolted to the
frame, thereby creating gaps between the honeycomb panel and the frame. These gaps
were accordingly sealed; however, the author recommends that the section could be better
constructed by replacing the Plexiglas with a different material such as wood. The wood
frame would provide the rigidity necessary to withstand the stresses created by bolting it
to the frame. It is also recommended that a filler, such as an epoxy resin, should be used
to fill the honeycomb cells at the screw attachment locations, so that the action of
attaching the honeycomb between the top and bottom frames does not crush the
89
honeycomb (which can also create gaps). This is the same process used in the aerospace
industry when attaching a fitting to the base of a aircraft fuselage.
The present heater mesh also produces a temperature gradient, with the upper right
hand corner producing higher temperatures than the lower left, within the plenum. This
has been determined to be associated with a bad connection between the mesh and the
brass bus bars on the bottom side of the facility. By calculating the expected downstream
temperature from Equation (22), and comparing the measured plenum temperatures from
the data acquisition system, it can be seen that the upper right corner of the plenum is
producing within the expected temperature values, while the other three corners fall short,
with the bottom left producing the lowest values. Therefore, the right corner is sufficient
for validating the facility’s ability to produce accurate local heat transfer coefficients in
this region; however, it is necessary to remove the mesh from the facility and resolder the
mesh to the brass to produce a better connection, and thus, uniform heating for all regions.
The current facility also uses the Fluke Hydralogger data acquisition system,
despite the capacity to use a much more advanced NI-SCXI system. The NCXI system
was researched and purchased for the purpose of use with the current facility; however, it
was not utilized for the validation of the current design. Implementation of this system
would allow for faster data acquisition times as well as integration with the camera
system. This would eliminate the stopwatch procedure described in Chapter Five. The
system would also allow for the integration of a single trigger start, whereby with one
click of the mouse, the welder would begin providing energy to the mesh, the data
acquisition sequence would begin, and images would be successively captured via a coded
LabVIEW program. This would allow for the use of the MATLAB program for analyzing
90
liquid crystal color intensity developed by Adavi (2003), as the associated time with each
image would be known from the DAQ device.
Recommendations for Future Work
The Baylor University impinging jet test facility was designed and developed with
the idea of future experimental work as the foundation. The current work validated the
facility for use in jet impingement heat transfer studies; however, the entire heat transfer
array distribution was not investigated. Therefore, a complete surface analysis for
differing Rejet is recommended to quantify the current configuration heat transfer. It
would then be logical to analyze different z/d dimensions, as well as varying jet hole
spacing and geometries and compare them with the present configuration. This might
provide a means for a combined geometry effect which could optimize a jet arrangement
or cover a wider span of engine representative configurations. The facility might further
be modified to eliminate the array altogether in favor of one very large single jet. The
capabilities of the blower fan and the facility would allow for a single very large diameter
hole to be investigated so that the features of the impinging jet would be enlarged on a
very large scale to enhance the details of the thermal footprint.
The current facility was however, designed with special attention and
consideration given to the current jet hole size. The hole diameter was designed to be
large enough that a hot-wire flow field study could be performed on the current array of
impinging jets. This would allow for an in-depth, detailed look at the jet flow by
examining the local velocities at the jet exit. Also of interest would be to include a
computational fluid dynamics study with the facility to predict the flow field and heat
transfer and compare it with the experimental results.
91
The current experiment validates the design of the impinging jet testing facility,
showing excellent correlation with heat transfer predictions from the literature. Since the
current work only provides information for one jet region, other prediction correlations
might be developed to compare the heat transfer and determine a local maximum location.
APPENDICES
92
93
APPENDIX A
Screenshot of Losses Calculator
loss_calculator.xls
94
95
APPENDIX B
Oripac Orifice Meter Manufacturer’s Supplied Data Curve
96
APPENDIX C
Mesh Production Instructions
To Remove an Old Heater Mesh Screen
1. Evenly heat the brass bus bar with a heating torch
2. After the bar has been partially heated, unscrew the locking screws in the bar
3. Continue heating the two bars which are now only held together by solder
4. When the two bars are able to be separated by hand, do so, being sure that a glove
is used to handle the bar, as it will be extremely hot
5. Peel/scrape off the thin sheet of solder that remains on the brass bus bar
6. Use a steel wire brush to scrape the soldered surface of each brass bus bar until the
solder has been evenly distributed and the metal feels smooth
Cutting a New Mesh Screen
1. Unroll the mesh screen in necessary and place on a flat surface.
2. Measure and trace out a square of 47 in x 55 in on a flat portion of the mesh,
keeping in mind that folds and crinkles in the mesh will affect uniform heat
transfer when heated.
a. The 55 in length will provide the 4 in extra length on either side to allow
for clamping the mesh on one end and locking the other end in the mesh
jig, to help make it taut. Therefore, this length can be adjusted as desired,
as long as enough length is kept to provide ease in using the mesh jig.
97
b. Be sure to leave room on either side of the 47 in length for one extra inch.
This material will be used to make tabs. (mesh width = 52 in)
3. Trace out 1 in wide by 1 in tall triangular tabs, every six inches, along the 47 in
length as seen below. These will provide the tabs which become clamped between
the two heater mesh frame halves. (The tabs must so be done because if a large
area of mesh is clamped between the frame, the mesh will burn up upon heating)
Figure C.1 – Mesh tab measurements
4. Cut the mesh to shape using a standard scissors
Soldering to the Brass Bus Bars
1. Lay the thin section of frame on the mesh jig with the flat side down. Lay a piece
of brass flush against the ridge of the frame bottom , allowing one end to remain
flush with the edge and the other to protrude past the frame edge. Do the same on
the opposite side with the brass flush with the edge on the opposite side as it was
with the other bar.
98
Brass flush with the edge
Brass protruding past the edge
Figure C.2 – Orienting the brass on the wood frame
2. Lay the mesh over the jig, placing careful attention to aligning the tabbed edge of
the mesh with the edges of the frame. Lock one end of the mesh over the ratchet
bar of the mesh jig, and clamp the other end to the flat aluminum surface of the
mesh jig. Ratchet the mesh taut.
3. Poke holes in the mesh at the screw points in the brass bars on the CLAMPED
SIDE (not the ratchet side). This will help the screw into the hole.
4. Cut a piece of silver solder to the length of the mesh. Flatten the solder by
hammering it on a clean, solid surface. Try as carefully as possible to keep the
solder in a straight line, as the flattening will tend to create a snake-like effect in
the solder. This is acceptable as long as the solder stays relatively straight.
5. Place the flattened solder over the mesh and brass bar on the clamped side. Try to
keep the solder away from the inner portion of the mesh if possible. Squirt some
flux along with the solder in this same area.
6. Place the top brass bar over the solder, etc. and start the screw as much as possible.
Note, it will not tighten all the way.
99
7. Prop up the opposite side of the mesh jig so that the lower end is the working end.
This is done so that when the brass is heated and the solder melts, it does not run
into the inner portion of the mesh, but rather, away from it.
8. Place a large piece of aluminum across the length of the top piece of brass so that
the mesh immediately touching the brass is covered by the aluminum plate. This
will act as a heat sink and prevent the torch from directly coming into contact with
the heater mesh to prevent it from burning up. Make sure that no portion of mesh
is visible between the edge of the top piece of brass and the edge of the aluminum
plate.
9. Use a low temperature torch to heat the top piece of brass, working the torch back
and forth over a small section of the bar. As this portion heats, move the torch to
the adjacent portion of the bar, and use a screwdriver to tighten the screws of the
heated portion (Be careful of the torch!) After the screw has been tightened, be
sure to continue heating the area, as another screw is tightened. Continue this
process until every screw is satisfactorily tightened across the entire bar and the
bars appear to be tightly joined. Note: it may be possible to see some solder
squeeze out the bottom end away from the inner portion of the mesh. This can be
used as a guide as to whether or not the solder has melted yet.
10. When the side has been completed, wait for it to cool before proceeding to the next
side. A fan may be used to help convect heat away from the surface.
11. When the bars have cooled sufficiently enough that it would be impossible for the
solder to run towards the inner portion of the mesh, it is time to begin soldering the
100
opposite side. Ratchet the mesh taught using a ratchet and socket attached to the
end of the ratcheting rod.
12. Repeat steps 3 through 10.
13. After the mesh has cooled, begin on one side of the mesh and pull the tabs outward
so that the mesh tightens. Place a small piece of electrical tape over a portion of
the tip of the triangle and adhere it to the frame.
14. Move to the opposite side of the frame, and repeat step 13 with the tab directly
across from it.
15. Repeat steps 13 and 14 for the tab next to this tab. Continue repeating this
procedure until all of the tabs have been taped to the frame. This will create a
taught mesh.
16. Overlay the top frame and screw the two pieces together so that the mesh can be
transported to the facility and mounted using the designated screw holes. If the
mesh is not to be mounted right away, place the mesh in a safe spot top prevent it
from being damaged.
101
APPENDIX D
Heater Mesh Resistance Measurement Technique
1. To measure the resistance in the heater mesh, simply connect the arc welder to the
brass bus bars.
2. Follow the procedure described in Chapter Five to start the facility.
3. Wire a Phillips PM2525 Multimeter with alligator clips and connect them to the
welder electrodes at the base of the welder. Turn on the welder.
4. Use the Multimeter to measure the output voltage. Perform this operation for a variety
of welder amperage outputs. (Note: a test was performed to validate the amp output of
the welder and it was found that the output matches the setting at approximately
125 A)
5. Using Ohm’s Law (V=IR), calculate the resistance in the mesh.
The resistance found in a 316-Stainless Steel mesh with 40 μm diameter wire, soldered
with Stay-Brite (Lead-free, Cadmium-free) Silver Solder, between 1660 Brass bars is
0.074 Ω.
102
APPENDIX E
LabVIEW Program for Image Acquisition
firewire_continuousgrab.vi
103
The following programs MUST be installed on the computer IN THIS ORDER for the
program to work:
1. LABVIEW 7.1 or greater
2. IMAQ Vision for LabVIEW 7.1
3. IMAQ 3.1.1 driver (available on the National Instruments Website)
NI_IMAQ_for_USB_Cameras (available on the National Instruments Website)
104
APPENDIX F
Experimental Procedure Using Camera and SCXI Acquisition Systems
1. Ensure that the test plate is properly secured to the spacers and impingement plate
via the attachment clips. In the event that any part of the test section has been
replaced (i.e. impingement plate, spacers, or target plate), ensure that all joints are
sealed with silicone to prevent leakage in the test section.
2. Overlay a grid to pinpoint the center of each impingement hole on the target plate
(since the black backing was applied to better view the crystal, the jet hole can no
longer be seen through the Plexiglas). This will allow for better accuracy in
determining the heat transfer coefficients in the region around the stagnation point.
3. Check the pressure transducer connections and ensure that the tubing is connected
to the proper “high” or “low” side of the orifice and transducer. Ensure that the
jumper is properly placed within the Mamac PR-274-R4 Pressure Transducer
according to its User’s Manual so that a 0 to 15 inH2O pressure differential can be
measured. This pressure differential range will be adequate for the entire span of
the fan’s capabilities. (For more precise measurements, the jumper placement can
be modified per its User’s Manual)
4. Turn on the computer, SCXI data acquisition device, and camera. Load file
<htexperiment.vi>. This will load the configuration of the thermocouples, pressure
transducer, and camera system. This file configuration sets up the 11
thermocouple inputs as thermocouple channels 0-10 and the pressure transducer
input as channel 11. Check the thermocouple connections to ensure that they are
105
secure and are input into the proper channels. Ensure that the pressure transducer
is wired into the proper channel. Ensure that the camera is plugged into the
computer via an USB port.
5. Calibrate and verify the thermocouples connected to the SCXI-1102
Thermocouple Module per the step-by-step calibration procedure for the device
found in the supplied Users Manual.
6. Set up the camera and remove the lens cap. Ensure that the desired view is
captured in the screen by using the real-time display monitor of Microsoft Movie
Maker.
7. Inspect the fan to be sure that there is no loose debris in or around the inlet area.
Remove all paper and other lightweight objects nearby that could easily be sucked
into the inlet of the fan.
8. Turn on the blower fan by pulling out the red knob on the back of the fan near the
fan control panel, and then pressing the green button (see Figure 31). Allow the
control panel approximately ten to fifteen seconds to initiate itself and warm up.
Press the LOCAL button, followed by the FWD button. This will start the fan.
Adjust the fan to the desired flowrate by increasing/decreasing the flowrate in
whole number increments from 20Hz to 60Hz using the or keys. A precalibrated flowrate curve has been created to match the fan setting with its
corresponding mass flowrate. This data curve is presented in Appendix G.
9. Allow the system to run for five minutes to allow the thermocouples to steady at
ambient temperature.
106
10. Set the dial on the arc welder to the desired current output based on the calculation
of Equation (22). After the five minute waiting period, the temperatures should be
steady in the test section. The experiment is now ready to begin.
11. The method of data collection for the present study involves two people. One to
man the arc welder, and one to man initiate the data acquisition program. On a set
count, simultaneously switch on the welder and trigger the data acquisition by the
START button.
12. Let the experiment run for a set experiment time of two minutes. After two
minutes, click the STOP button to cease data acquisition and save the output file.
Turn off the arc welder, but do NOT turn off the blower fan. It is extremely
critical that the fan is left on to continue cooling the heater mesh to prevent it from
burning up. Once the test plate returns to its original black color (i.e. crystal color
play has ceased).
13. The fan may then be turned off by first pressing the red button, and then by
depressing the red knob.
The saved images may now be implemented into CalculateTempArray.m with these
results going into HeatTransferMain2.m in MATLAB. Follow the directions within
UsageNotes.doc to process the images for their intensity values [Adavi (2003)].
107
APPENDIX G
Cincinnati Blower Fan Flowrate Curve
Fan Freq. Vs. Rej, avg
50000
Average Jet Reynolds Number
45000
y = 734.879891x - 593.341185
R2 = 0.999954
40000
35000
30000
25000
20000
15000
10000
5000
0
0
10
20
30
40
50
60
70
Fan Speed (Hz)
Fan Freq. Vs. Flowrate
0.7
y = 0.010347x - 0.003874
2
R = 0.999872
0.6
3
Flowrate (m /sec)
0.5
0.4
0.3
0.2
0.1
0
0
10
20
30
40
Fan Speed (Hz)
50
60
70
108
APPENDIX H
Liquid Crystal Calibration Procedure for Camera and SCXI System
For experimentation, three Hallcrest narrowband liquid crystals, R25C1W,
R30C1W, and R35C1W, were used to cover the desired experimental temperatures. The
intensity method involved calibrating all three liquid crystals for the peak intensity
temperatures. With the prepared test plate in place, the calibration was performed under
the controlled lighting conditions of the heat transfer experiment produced by the
fluorescent lamps. A surface mounted thermocouple, located beneath an impinging jet,
was used for calibration. The surface was heated to the blue-violet color-play temperature
of the first crystal (R25C1W), and then allowed to cool until the color disappeared. This
procedure was performed for the R30C1W and R35C1W crystals as well. The crystals
must be calibrated separately because heating to the point of the crystal turning clear
(heating past blue-violet) will introduce a bias [Anderson and Baughn (2004)]. The data
acquisition system was used to record the thermocouple temperature as well as capture
successive images from the camera. The images were then processed to find the three
intensity peaks corresponding to the three different crystals. This process will produce
results similar to the below: When the images with the highest liquid crystal intensity
were determined, their associated time values were used to look up the thermocouple
temperature corresponding to the intensity peak.
109
APPENDIX I
Heat Transfer Coefficient Calculator
ht_calculator.xls
110
APPENDIX J
Construction Drawings
111
112
113
114
115
116
117
118
119
120
121
122
123
124
REFERENCES
Acalar, M.S., and Smith, C.R., 1987. A Study of Hairpin Vortices in a Laminar Boundary
Layer. Part 2. Hairpin Vortices Generated by Fluid Injection. Journal of Fluid
Mechanics, Vol. 87, pp. 43-83.
Adavi, K. and Van Treuren, K.W., 2003. MATLAB Code for Analyzing Heat Transfer
Images.
Anderson, M.R., and Baughn, J.W., 2004. Hysteresis in Liquid Crystal Thermography.
Journal of Heat Transfer, Vol. 126, No. 3, pp. 339-346.
Bailey, J.C. and Bunker, R.S., 2002. Local Heat Transfer and Flow Distributions for
Impinging Jet Arrays of Dense and Sparse Extent. ASME paper GT-2002-30473.
Baughn, J.W., and Shimizu, S., 1989. Heat Transfer Measurements From a Surface with
Uniform Heat Flux and an Impinging Jet. ASME Journal of Heat Transfer, Vol.
111, pp. 1096-1098.
Bonnet, P., 1989. Applications of Liquid Crystals in Aerodynamic Testing. D. Phil
Thesis, Department of Engineering Science, University of Oxford, England.
Borns, F.G., 1989. Gas Turbine Engine Mechanical Design Considerations for Turbine
Rotors. Allied-Signal Aerospace Company Garret Engine Presentation at the
United States Air Force Academy.
British Standards, BS1042, 1989. Measurement of Fluid Flow in Closed Conduits.
British Standards Institution, London.
Byerley, A.R., Ireland, P.T., Jones, T.V., and Ashton, S.A., 1988. Detailed Heat Transfer
Measurements Near and Within the Entrance of a Film-Cooling Hole. ASME
paper 88-GT-155.
Cheong, B.C.Y., 2002. Flow and Heat Transfer Characteristics of an Impinging Jet with
Crossflow. D. Phil Thesis, Department of Engineering Science, University of
Oxford, England.
Cincinnati Fan, 2000. Fan Selection and Performance. Manufacturer’s Data.
den Ouden, C. and Hoogendoorn, C.J. 1974. Local Convective Heat Transfer Coefficients
for Jets Impinging on a Plate: Experiments Using Liquid Crystal. 5th International
Heat Transfer Conference.
125
Florschuetz, L.W., Metzger, D.E., and Truman, C.R., 1981. Jet Array Impingement with
Crossflow – Correlation of Streamwise Resolved Flow and Heat Transfer
Distributions. NASA Contractor Report 3373.
Florschuetz, L.W., Metzger, D.E., Su, D.E., and Isoda, Y., 1982. Jet Array Impingement
Flow Distributions and Heat Transfer Characteristics. NASA Contractor Report
3630.
Gao, L., Ekkad, S.V, and Bunker, R.R., 2003. Impingement Heat Transfer Under Linearly
Stretched Arrays of Holes. ASME Paper GT2003-38178.
Gao, X. and Sunden, B. 2002. Experimental Investigation of the Heat Transfer
Characteristics of Confined Impinging Slot Jets. Experimental Heat Transfer,
Vol. 16, pp. 1-18.
Gardon, R. and Akfirat, J.C., 1965. The Role of Turbulence in Determining the HeatTransfer Characteristics of Impinging Jets. Int. J. Heat and Mass Transfer, Vol. 8,
pp. 1261-1272.
Gillespie, D.R.H., 1993. First Year Report.
Goldstein, R.J., Behbahni, A.I., and Heppelmann, K.K., 1986. Streamwise Distribution of
the Recovery Factor and the Local Heat Transfer Coefficient to an Impinging
Circular Air Jet. Int. J. Heat and Mass Transfer, Vol. 29, No. 8, pp. 1227-1235.
Groth, J., 1991. On the Modeling of Homogeneous Turbulence. Tech Rep.. Dep. Of
Mechanics, KTH, SE-100 E Stockholm.
Han, J.C., Dutta, S., and Ekkad, S., 2000, Gas Turbine Heat Transfer and Cooling
Technology. Taylor & Francis Group, New York.
Hay, N., Khaldi, A., and Lampard, D., 1987. Effects of Crossflows on the Discharge
Coefficients of Film Cooling Holes with Rounded Entries or Exits. Proc. 2nd
ASME-JSME Thermal Engineering Joint Conference, Honolulu, HI, Vol. 3,
pp. 369-374.
Hebert, R., Ekkad, S.V., Khanna, V., Abreu, M., and Moon, H.K., 2004. Heat Transfer
Study of a Novel Low-Crossflow Design for Jet Impingement. Proceedings of
ASME International Mechanical Engineering Congress & Exposition. IMECE
paper IMECE2004-60468.
Hippensteele, S.A., Russell, L.M. and Stepka, F.S., 1983. Evaluation of a Method for
Heat Transfer Measurements and Thermal Visualization Using a Composite of a
Heater Element and Liquid Crystals. ASME Journal of Heat Transfer, Vol. 105,
No. 1, pp. 184-189.
Hirschberg, Mike. On the Vertical Horizon: IHPTET – Power for the Future.
7 December 2004. <http://www.vtol.org/IHPTET.HTM>.
126
Hollworth, B.R. and Bowley, W.W., 1975. Heat Transfer Characteristics of an Impinging
Jet in Crossflow. ASME Paper 75-WA/HT-100.
Holman, J.P., 2001. Experimental Methods for Engineers, 7th Ed. McGraw Hill Co., New
York.
Hong, S.K., Rhee, D.H., and Cho, H.H., 2005. Effects of Fin Shapes and Arrangements
on Heat transfer for Impingement/Effusion Cooling with Crossflow. ASME
GT2005-68684.
Ireland, P.T., and Jones, T.V., 1987. The Response Time of a Surface Thermometer
Employing Encapsulated Thermochromatic Liquid Crystals. J. Phys. E: Sci.
Instrum., Vol. 20, pp. 1195-1199.
Ireland, P.T., Wang, Z., and Jones, T.V., 1993. Liquid Crystal Heat Transfer
Measurements. Lectures for the series on Measurement Techniques, von Karman
Institute for Fluid Dynamics, 1992-1993 Lecture Series.
Ireland, P.T., Personal communication, August 31, 2005.
Jambunathan, K., Lai, E., Moss, M.A., and Button, B.L., 1992. A Review of Heat
Transfer Data for Single Circular Jet Impingement. Int. J. Heat and Fluid Flow,
Vol. 13, No. 2, pp. 106-115.
James, A.J., 1961. Flow through a Long Orifice. B.Sc. Thesis, Nottingham University.
Jeong, J., Hussain, F., Schoppa, W., and Kim, J., 1997. Coherent Structures Near the
Wall in a Turbulent Channel Flow. Journal of Fluid Mechanics, Vol. 332,
pp. 185-214.
Jones, T.V., 1992. The Use of Liquid Crystals in Aerodynamic and Heat Transfer
Testing. Proc. 4th Int. Symp. on Transport Phenomena in Heat and Mass Transfer,
Vol. 2, pp. 1242-1273.
Kanokjaruvijit, K., and Martinez-Botas, R.F., 2003. Parametric Effects of Heat Transfer
of Impingement on Dimpled Surface. ASME paper GT2003-53142.
Kercher, D.M., and Tabakoff, W., 1970. Heat Transfer by a Square Array of Round Air
Jets Impinging Perpendicular to a Flat Surface Including the Effect of Air Spent.
ASME Journal of Engineering for Power, Vol. 92, pp. 73-82.
Lee, D.H., Chung, Y.S., and Kim, D.S., 1997. Turbulent Flow and Heat Transfer
Measurements on a Curved Surface with a Fully Developed Round Impinging Jet.
Int. J. of Heat and Fluid Flow, 18, pp. 160-169.
Li, L.G., Zhang, D.L., and Lin, J.L., 1988. The Applications of the Liquid Crystal
Technique to the Experimental Modeling of Impingement Cooling. 2nd
International Symposium on Heat Transfer, Beijing.
127
Lindgren, B., and Johansson, A.V., 2002. Design and Evaluation of a Low-Speed Wind
Tunnel with Expanding Corners. TRITA-MEK 2002:14. Department of
Mechanics, KTH.
Mattingly, J.D., 1996. Elements of Gas Turbine Propulsion. McGraw-Hill , Inc., New
York.
McGrehan, W.F., and Schotsch, M.J., 1988. Flow Characteristics of Orifices with
Rotation and Corner Radiusing. ASME Journal of Turbomachinery, Vol. 110,
pp. 231-237.
Mehta, R.D., and Bradshaw, P. 1979. Design Rules for Small Low Speed Wind tunnels.
The Aeronautical Journal of the Royal Aeronautical Society., pp. 443-449.
Metzger, D.E., Bunker, R.S., and Bosch, G., 1989. Transient Liquid Crystal Measurement
During Local Heat Transfer on a Rotating Disk with Jet Impingement. ASME
paper 89-GT-287.
Moffat, R.J., 1988. Describing the Uncertainties in Experimental Results. Experimental
Thermal and Fluid Science, Vol. 1, pp. 3-17.
Moss, R.W. and Oldfield, M.L.G., 1991. Measurements of Hot Combustor Turbulence
Spectra. ASME paper 91-GT-351.
Munson, B.R., Young, D.F., and Okiishi, T.H., 2002. Fundamentals of Fluid Mechanic,
4th Ed. John Wiley and Sons, Inc., New York.
Nomoto, H., Okamura, T., and Ito, S., 1996. Turbine Cooling Blade Having Inner Hollow
Structure with Improved Cooling. United States Patent 5533864.
Obot, N.T., Majumdar, A.S., Douglas, W.J.M., 1979. The Effect of Nozzle Geometry on
Impingement Heat Transfer Under a Round Turbulent Jet. ASME paper 79WA/HT-53.
Patel, P. and Roy, S., 2003. Heat Transfer for a pair of Rectangular jets Impinging upon
an Inclined Surface. International Journal of Heat and Mass Transfer, Vol. 46,
No. 3, pp. 411-425.
Perry, K.P., 1954. Heat Transfer by Convection from a Hot Gas Jet to a Plane Surface.
Proceedings of the Institute of Mechanical Engineers (London), Vol. 168, pp. 775784.
Prandtl, L., 1932. Herstelluung Einwandfrier Lufstöme (Windkanäle). Handbuch der
Experimentalphysik, Leipzig, Germany, Vol. 4, Part 2, p. 73
Rhee, D.H., Yoon, P.H., Cho, H.H., 2002. Local Heat/Mass Transfer and Flow
Characteristics of Array Impinging Jets with Effusion Holes Ejecting Spent Air.
Int. J. of Heat and Mass Transfer, Vol. 46, pp. 1049-1061.
128
Robertson, P., and Van Treuren, K.W., 2005. “Design of an Impinging Jet Testing
Facility.” Proceedings of the Great International Southwest Region X Graduate
Student Technical Conference, Lubbock, TX.
San, J.Y., and Lai, M.D., 2001. Optimum Jet-to-Jet Spacing of Heat Transfer for
Staggered Arrays of Impinging Air Jets. Int. J. Heat and Mass Transfer, 44,
pp. 3997-4007.
Saxena, V. Nassir, H. and Ekkad, S.V. 2003. Effect of Blade Tip Geometry on Tip Flow
and Heat Transfer for a Blade in a Low Speed Cascade. ASME paper GT200338176.
Schultz, D.L. and Jones, T.V., 1973. Heat Transfer Measurements in Short-Duration
Hypersonic Facilities. AGARD AG-165.
Son, C., Dailey, G., Ireland, P., and Gillespie, D., 2005. An Investigation of the
Application of Roughness Elements to Enhance Heat Transfer in an Impingement
Cooling System. ASME paper GT2005-68504.
Stasiek, J. A., and Kowalewski, T.A., (2002). Thermochromatic Liquid Crystals Applied
for Heat Transfer Research. Opto-Electropnics Review, Vol. 10, No. 1, pp. 1-10.
Van Treuren, K.W., 1994. Impingement Flow Heat Transfer Measurements of Turbine
Blades Using a Jet Array. D. Phil Thesis, Department of Engineering Science,
University of Oxford, England.
Van Treuren, K.W., Wang, Z., Ireland, P., Jones, T.V., and Kohler, S.T., 1996. The Role
of the Impingement Plate in Array Heat Transfer. ASME Paper 96-GT-162.
Van Treuren, K.W., Wang, Z., Ireland, P.T., and Jones, T.V., 1994. Detailed
Measurements of Local Heat Transfer Coefficient and Adiabatic Wall
Temperature Beneath an Array of Impinging Jets. Journal of Turbomachinery,
Vol. 116, pp. 369-374.
Wang, Z., Gillespie, D.R.H., and Ireland, P.T., 1996. Advances in Heat Transfer
Measurements Using Liquid Crystals. Proc Engineering Foundation Turbulent
Heat Transfer Conference, San Diego CA.
Wieghardt, K.E.G., 1953. On the Resistance of Screens. Aero Quarterly, Vol. 4, p. 186.