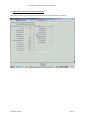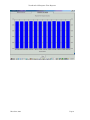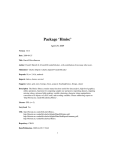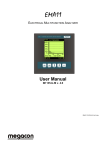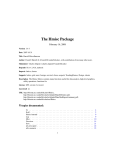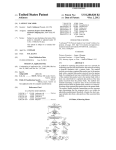
1
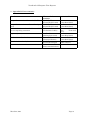
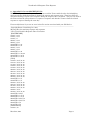
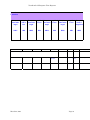
TranScanLAN Response Time Reporter User’s Manual Statistics File V2.0 (Ethertest Platform) TranScan/LAN Response Time Reporter March 20, 2003 Copyright 2001, 2002, 2003 Ontrac Consulting, Inc. 45 Chaucer Court San Ramon, CA 94583 March 20, 2003 Page ii TranScan/LAN Response Time Reporter Preface This document contains principles and procedures for use of the TranScan/LAN Response Time Reporter Module1 to create transaction response time statistic files for import into Excel and calculation of average response time statistics. The Response Time Reporter works in conjunction with TranScan Viewer and TranScan/LAN, identifying the request and response message pairs that constitute a transaction and calculating the transaction response time. The TranScan Viewer and TranScan/LAN are described in the document TranScan Viewer and TranScan/LAN. 1 The Material presented in this publication is copyright-protected by Ontrac Consulting, Inc. and may not be reproduced in any form, by any method for any purpose without the prior written consent of Ontrac. It is against the law to copy the software, except in accordance with the terms of the licensing agreement. March 20, 2003 Page iii TranScan/LAN Response Time Reporter Table of Contents 1. INTRODUCTION TO RESPONSE TIME REPORTER .............................................................................. 1 1.1 RESPONSE TIME REPORTER AND TRANSCAN VIEWER ................................................................................ 1 1.2 REPORTER FUNCTIONALITY ........................................................................................................................ 1 1.2.1 Reporting Interval ................................................................................................................................. 1 1.2.2 Monitor ID ............................................................................................................................................ 1 1.2.3 Accumulation of statistics...................................................................................................................... 2 1.2.4 File Naming........................................................................................................................................... 2 1.2.5 Real Time Reporter ............................................................................................................................... 2 1.2.6 Captured File Reporter ......................................................................................................................... 2 1.2.7 Statistics Details.................................................................................................................................... 2 1.2.8 Statistics File content ............................................................................................................................ 3 1.2.9 Message matching configuration .......................................................................................................... 3 1.3 OPERATIONAL PRINCIPLES. ......................................................................................................................... 3 2. RUNNING THE REPORTER.......................................................................................................................... 3 2.1 2.2 2.3 2.4 CONFIGURATION (SETTING) IN TRANSCAN VIEWER:................................................................................... 3 UNATTENDED RESPONSE TIME CALCULATIONS GATHERING: ....................................................................... 3 STARTING RESPONSE TIME CALCULATION FOR REALTIME:........................................................................... 3 STARTING RESPONSE TIME CALCULATION FOR CAPTURED FILE: .................................................................. 4 3. GENERAL RESPONSE TIME CALCULATION TIPS................................................................................ 4 4. APPENDIX A: FIELDS IN STATISTICS RECORDS ................................................................................. 5 5. APPENDIX B: RECORD OR EVENT TYPES IN STATISTICS FILES .................................................... 7 6. APPENDIX C: REAL TIME STATISTICS DISPLAY ................................................................................. 8 7. APPENDIX D: ERROR STATISTICS.......................................................................................................... 10 8. APPENDIX E: CURRENT MSGKEY.INI FILE ......................................................................................... 11 9. APPENDIX F: CURRENT TEMPLATE...................................................................................................... 15 March 20, 2003 Page iv TranScan/LAN Response Time Reporter 1. Introduction to Response Time Reporter The Response Time Reporter is an optional software module for the TranScan Viewer and TranScan/LAN. 1.1 Response Time Reporter and TranScan Viewer The TranScan Viewer parses and displays application messages. The optional Reporter then matches each request message with its associated response and calculates the time difference between the arrival of the two messages, known as the transaction response time. Each ISO 8583 dialect has its message types and their key specified in the TranScan msgkey.ini file. The Reporter can be invoked to calculate response time statistics in real time, or from previously captured LANWatch32 .dmp or Ethertest .cfa files. Various response time statistics are calculated and written periodically to an ASCII file whose fields are separated by “commas”, (“,”). The name of the statistics file includes the user supplied MonitorID for this copy of the Reporter as well as the date and times of the first and last frames analyzed by the Reporter or the start and end time of the calculating process. The name also indicates whether the file was created in real time or as result of analyzing a previously captured LANWatch or Ethertest file. During real time capture, a new statistics file is begun each day. At the end of the month, these files can be imported into Excel and a monthly Average Response Time can be calculated. Response time statistics calculated from a previously captured file will be written to a single file. Originally, TranScan products were designed to parse and display various dialects of the ISO/8583 Message Format for BankCard Processors. This ISO standard has had a number of different transmission implementations. The TranScan has added support for many of these dialects to support the user base who gateways into the different Bank Card Networks. The TranScan has grown in function and now handles a number of different "higher level" or application level message formats that are not ISO/8583 yet are specifiable in our table driven format. We encourage our users to send us specifications for their message formats for inclusion in their system as a new dialect. So, as on the various screens you see the word "ISO", please substitute "application message" in your mind, as TranScan now handles much more than the ISO/8583 formats. 1.2 Reporter Functionality . 1.2.1 Reporting Interval The Reporter maintains transaction response time statistics or acculmulators for each responding endpoint over a reporting interval. At the end of a reporting interval, a statistics file record is written for each responding endpoint that the Reporter is tracking. The statistics are then cleared and the reporting for the next interval begins. The reporting interval is configurable, with a default value of 60 minutes. 1.2.2 Monitor ID The user will identify each copy of the Reporter by specifying a Monitor ID of up to 9 characters. This ID will be the first n characters of the name for each statistics file created. The default Monitor ID is the serial number of the C drive. March 20, 2003 Page 1 TranScan/LAN Response Time Reporter 1.2.3 Accumulation of statistics A TCP/IP session is a dialog between one two sockets, where each socket can be identified as an IP address and a port number: SocketA(IP addrA, PortA) <-->SocketB(I addrB,PortB). The reporter accumulates response times for each Socket in a session. Thus, if SocketA only sends requests to SocketB, and SocketB only responsds and never sends requests, then only one set of statistics will be kept, those that reflect how SocketB responds while in session with SocketA. If each side of the dialog sends both requests and responses, then two response time accumulators will be kept for the session, one for each sides response statistics. 1.2.4 File Naming The name of a statistics file indicates • Whether it was collected in real time or from captured data • The actual interval starting and ending times are within the file A statistics file is named: [monitor-id].stat-mode. start-year|| start-month|| start-day|| start-hour|| startmin||”.”||”E”|| end-year|| end-month|| end-hour|| end-minute||”.”||”FV”file-ver||”.”||stat-mode||”SF” Stat-mode is either “R” for real time statistics or “C” for captured statistics. It is important to note that the name of each statistics file indicates the reporting time interval present, which Monitor system created the file, the file format version and whether it was created in real time or from previously captured data. 1.2.5 Real Time Reporter When calculating statistics in real time, the Reporter will always append an interval’s statistics to the current .rsf file for today’s date. Thus, if the system was running real time statistics gathering , was booted and statistics gathering re-started, the new statistics intervals would be appended to the previously created file for this date. At midnight, the Reporter will write out the current .rsf file and open a new .rsf file for the new day. 1.2.6 Captured File Reporter When the user specifies calculate response time statistics from a captured file, a .csf statistics file will be created when a .dmp file is loaded in LANWatch or a .cfa file in Ethertest. That .csf file will have as its name [monitor-id].C.S[start-yyyymmddhhmm].E[end-yyymmddhhmm].fv001.csf, where startyyymddhhmm is the date and time of first data frame in the file and end-yyymmddhhmm is the date and time of last data frame in the file. A statics file from a system with a user-supplied Monitor Id of IBM10 looking at a caputured file whose first data frame has a time stamp of 2001-29 June-18:30 and who last data frame has a time stam of 2001-3 July-3:10 would have the name IBM10.C.S2001061830.E200107030310.fv001.csf. Note that .csf files can contain frames of data accumulated over multiple days. 1.2.7 Statistics Details See Appendix A. Reporter. March 20, 2003 See Response Time Report Template.xlt for names of columns created by the Page 2 TranScan/LAN Response Time Reporter Note that the current Interval Transactions count is a count of the pairs of transactions that are listed in msgkey.ini. It does not include other message types, unparseable messages, orphaned or timed out messages. 1.2.8 Statistics File content Each record written to the statistics file will become one line in the summarizing Excel spreadsheet. Each record is identified by a two character event or record type. See Appendix B for a complete list of event or record types. 1.2.9 Message matching configuration The Reporter uses a file msgkey.ini to determine what the matching fields are for each transaction. Both requests and responses will contain each of these fields. Msgkey.ini is organized by dialect. 1.3 Operational Principles. As you use the Reporter, please be aware of the following: • • • • • IF RUNNING LANWATCH, NEVER ALLOW LANWATCH TO BE MINIMIZED ON THE SCREEN. YOU MAY, HOWEVER, ALLOW IT TO BE HIDDEN BY OTHER WINDOWS. IF MINIMIZED, LANWATCH STOPS PASSING MESSAGES TO THE TRANSCAN VIEWER AND THE REPORTER. The Reporter attempts to parse and either match or timeout each application message it sees. Thus, it can challenge a processor. Be sure to provide whatever filtering you can, both for LANWatch or Ethertest. Filtering means that the Reporter will only see the relevant messages that you want it to see. The Reporter was designed to run unattended. If your volumes are low, you may continue to display application messages in the Viewer. When volumes increase, be sure to turn off the display and run in unattended mode. If you are performing Real Time statistics gathering, never go into Examine mode as this will block any data from being presented to the Reporter. The TranScan Viewer will remember which dialect it is analyzing and whether statistics calculation is enabled. If enabled, the Viewer will remember whether to do this in real time or when looking at captured data. 2. Running the Reporter 2.1 Configuration (setting) in TranScan Viewer: - On TranScan Viewer: menu options/options - "ID/License" tab: set Monitor ID The Monitor ID can have a maximum length of 9 characters 2.2 Unattended response time calculations gathering: - On TranScan Viewer: menu options/options... - Statistics tab: check box "Unattended Execution for Reponse Time Calculation" On TranScan Viewer: menu options/options... - Statistics tab: UNcheck box "Display Messages During Response Time Statistics Gathering" 2.3 Starting response time calculation for realtime: 1) Start Ethertest 2) On TranScan Viewer: menu File/Response Time Statistics/Calculate for Realtime March 20, 2003 Page 3 TranScan/LAN Response Time Reporter 2.4 Starting response time calculation for captured file: 1) 2) 3) 4) 5) Start Ethertest On TranScan Viewer: menu File/Response Time Statistics.../Calculate for Captured File Loads On Ethertest, load captured file. Wait for load to complete. On TranScan Viewer: menu File/Response Time Statistics.../Stop and Close Out Response Time Calculations. (This Close Out must be done to cause the last records to be written to the statistics file.) 3. General Response Time Calculation tips • • • • View Response time calculation info as it is running on TranScan Viewer: menu View/Response Time Info... Files, .CSF for captured file, .RSF for realtime, are stored in the svdata\ folder (default installation folder would be c:\program files\transcan viewer\svdata\) TranScanLAN.ini, with additional TranScan LAN filters, goes into shared Windows directory (e.g. c:\windows\ on Windows 95/98 system, c:\WINNT\ on Windows NT/2000) To view additional TranScan LAN filters used by Ethertest, in TranScn Viewer menu Options/Options..., Filters tab. March 20, 2003 Page 4 TranScan/LAN Response Time Reporter 4. Appendix A: Fields in Statistics Records Template Field Name Description Present for these events: File version Format version for this .rsf or .csf file. Initially version 1.0, followed by 1.1 ID of this line in the table / record in the file. See Appendix B Monitor ID of the system that created this file, as set in the View Options of Tranview R= Realtime data being processed C= Capture file being processed Optional information All YYYY MM DD hh mm Number of seconds in this reporting interval. Dialect – ISO or other, taken from Msgkey.ini TCP or SNA All All All All All SR, SC, IR, IC SR,SC SR, SC, IP Address of the responder TCP/IP port of the responder IP Address of the requestor TCP/IP port of the requestor SR, SC SR, SC SR, SC SR, SC Average response time for this interval for measured transactions 01xx, 02xx and 04xx Longest response time in seconds for transactions described above. Shortest response time in seconds for transactions described above. SR, SC Type of event Monitor ID Mode Comment Starting Date and Time Stamp: Starting Year Starting Month Starting Day Starting Hour Starting Minute Interval duration Report Class Protocol TCP/IP Session Info: Response Source IP Response Source Port Request Source IP Request Source Port TCP/IP Session Response Time Statistics: Average Longest Shortest Response Time Percentile Distribution % Response times within range1 Range1 in seconds % Response times within range2 Range2 in seconds % Response times within range3 Range3 in seconds % Response times March 20, 2003 % of all response times for this interval that are >0 and < range1 Number of seconds in range1. nnn.nnn % of all response times for this interval that are => range1 and < range2 Number of seconds in range2. nnn.nnn % of all response times for this interval that are => range2 and < range3 Number of seconds in range3. nnn.nnn % of all response times for this interval that are => range3 and < Page 5 All All All All SR, SC SR, SC TranScan/LAN Response Time Reporter within range4 Range4 in seconds % Response times equal to or greater than range4 TCP/IP Session Interval Counters: Interval Transactions Timed out requests Unparsable frames Duplicate requests Orphaned responses Lost data detected Lost bytes Truncated frames Truncated bytes Retransmission detected Frame buffers full Frame buffer full lost bytes Oldest frame buffer usurped No stats available March 20, 2003 buffers range4 Number of seconds in range4. nnn.nnn % of all response times for this interval that are => range4 Count of request/response pairs from msgkey.ini Count of requests received whose responses didn’t arrive within 35 seconds Count of messages with ISO parse errors Count of request messages with same key received without intervening response Count of responses received with no preceding request Number of times data was lost Total number of bytes not received Number of frames truncated because of too small packet choice Number of bytes lost because of frame truncation Number of times frame re-transmission is detected. Often indicates need for network tuning. Number of times buffers not available for incoming messages. Indicates need for more memory Number of bytes not processed because of lack of buffers Number of times an older active buffer was grabbed for current message. Can indicate too many active sessions with concurrent outstanding transactions Number of times no space to accumulate statistics. May indicate too many outstanding sessions being monitored for available memory Page 6 SR, SC SR, SC SR, SC SR, SC SR, SC SR, SC SR, SC SR, SC SR, SC SR, SC SR, SC SR, SC SR, SC SR, SC TranScan/LAN Response Time Reporter 5. Appendix B: Record or Event types in Statistics Files Record or Event ID Description NC Response time calculation for a previously captured file started FC Response time calculation for a previously captured file ended SC A statistics interval record for a previously captured file written at the end of an interval NR Real time response time calculation started FR Real time response time calculation ended SR A real time statistics interval record written at the end of an interval SOD Record written when a real time statistics file is opened at the start of a new day EOD Record written when a real time statistics file is closed out at the end of day IR Real time interval end IC Captured file interval end March 20, 2003 Page 7 TranScan/LAN Response Time Reporter 6. Appendix C: Real Time Statistics Display Real-time statistics can be displayed while the Response Time Reporter is running. March 20, 2003 Page 8 TranScan/LAN Response Time Reporter March 20, 2003 Page 9 TranScan/LAN Response Time Reporter 7. Appendix D: Error statistics Condition for specific connection: No room in CircBfr, for specific connection: no Frame Descriptors avail no Statistics Accumulator buffers available for new reporting connection gap in seq# < 10,000 Packet size smaller than frame Circular buffer taken by force Retransmissions March 20, 2003 SReturnCodes statistics CircBfrFullCnt (Frame Bfr full count) CircBfrFullCnt (Frame Bfr full count) NoStatsAccCnt (No Statistics buffer) LostDataCnt (Missing data count) TruncatedCnt (Truncated frames) CircBfrError (Frame Bfr usurped) RetransDetectedCnt (Data retransmissions) Statistics file LostData (count & #of bytes) LostData (count & #of bytes) IR record, column after “Truncated bytes” LostData (count & #of bytes) TruncatedFrames (count & #of bytes) n/a need to add Frame buffer usurped n/a Page 10 TranScan/LAN Response Time Reporter 8. Appendix E: Current MSGKEY.INI File MSGKEY.INI provides the Response Time Reporter and the Viewer with the rules for indentifying which are the key fields that uniquely identify the request and response pairs. These key fields are used for matching a request and a response during the response time calculation. They are also used in the Viewer when the user positions to a request or response and asks the Viewer to find the related response or request. Sharing the same key. Please notify Ontrac if you see an error in the file section associated with your ISO dialect. _____________________________________________________________________________________ ;Copyright Ontrac Consulting, Inc. 2001 ;Message Key for matching requests and responses ; NR = Not included in Response Time Calculation [MASTERCARD] 0100=7,11,32 0120=7,11,32 0180=7,11 0200=7,11,32 0220=7,11,32 0300=NR,7,11,33, 0302=NR,7,11,33 0400=7,11,32 0420=7,11,32 0422=NR,7,11,32 0620=NR,7,11,33,100 0800=NR,7,11,33,70 0810=NR,7,11,33,70 [VISA] 0100=11,32,37,41,42 0101=11,32,37,41,42 0110=11,32,37,41,42 0120=11,32,37,41,42 0130=11,32,37,41,42 0200=11,32,37,41,42 0201=11,32,37,41,42 0210=11,32,37,41,42 0220=11,32,37,41,42 0230=11,32,37,41,42, 0300=NR,7,11,37 0302=NR,7,11,37 0400=11,32,37,41,42 0401=11,32,37,41,42 0410=11,32,37,41,42 0420=11,32,37,41,42 0422=11,32,37 0430=11,32,37,41,42 0480=NR,11,32,37 0500=NR,7,11,37,70 0520=NR,7,11,37,70 0600=NR,11,32,37,70 0620=NR,11,32,37,70 0800=NR,11,70 0810=NR,11,70 [AS2805ASCII] 0100=11,32 March 20, 2003 Page 11 TranScan/LAN Response Time Reporter 0101=11,32 0110=11,32 0120=11,32 0130=11,32 0200=11,32 0201=11,32 0210=11,32 0220=11,32 0230=11,32 0400=11,32 0401=11,32 0410=11,32 0420=11,32 0430=11,32 0800=NR,11,32,70 0810=NR,11,32,70 [JCB] 0100=11,32,37 0101=11,32,37 0110=11,32,37 0120=11,32,37 0130=11,32,37 0200=11,32,37 0201=11,32,37 0210=11,32,37 0220=11,32,37 0230=11,32,37 0300=NR,11,37 0302=NR,11,37 0400=11,32,37 0401=11,32,37 0410=11,32,37 0420=11,32,37 0422=NR,11,32,37 0430=11,32,37 0500=NR,11,32,37 0520=NR,11,32,37 0600=NR,11,32,37 0620=NR,11,32,37 0800=NR,11,32,37 [SHAZAM-ASCI] 0100=11,37 0120=11,37 0200=11,37 0220=11,37 0400=11,37 0420=11,37 1100=11,32,37 1110=11,32,37 1120=11,32,37 1130=11,32,37 1200=11,32,37 1210=11,32,37 1220=11,32,37 March 20, 2003 Page 12 TranScan/LAN Response Time Reporter 1230=11,32,37 1400=11,32,37 1410=11,32,37 1420=11,32,37 1422=NR,11,32,37 1430=11,32,37 1604=NR,37 1624=NR,11,32,37 1804=NR,11,37 [SHAZAM-AUTO] 0100=11,37 0120=11,37 0200=11,37 0220=11,37 0400=11,37 0420=11,37 1100=11,32,37 1110=11,32,37 1120=11,32,37 1130=11,32,37 1200=11,32,37 1210=11,32,37 1220=11,32,37 1230=11,32,37 1400=11,32,37 1410=11,32,37 1420=11,32,37 1422=NR,11,32,37 1430=11,32,37 1604=NR,37 1624=NR,11,32,37 1804=NR,11,37 [SHAZAM-XP] 1100=11,32,37 1110=11,32,37 1120=11,32,37 1130=11,32,37 1200=11,32,37 1210=11,32,37 1220=11,32,37 1230=11,32,37 1400=11,32,37 1410=11,32,37 1420=11,32,37 1422=NR,11,32,37 1430=11,32,37 1604=NR,37 1624=NR,11,32,37 1804=NR,11,37 [SHAZAM-NXP] 1100=11,32,37 1110=11,32,37 1120=11,32,37 1130=11,32,37 March 20, 2003 Page 13 TranScan/LAN Response Time Reporter 1200=11,32,37 1210=11,32,37 1220=11,32,37 1230=11,32,37 1400=11,32,37 1410=11,32,37 1420=11,32,37 1422=NR,11,32,37 1430=11,32,37 1604=NR,37 1624=NR,11,32,37 1804=NR,11,37 March 20, 2003 Page 14 TranScan/LAN Response Time Reporter 9. Appendix F: Current Template .xls template showing report format Blue denotes the label. Green denotes the fields to be written by the response time reporter Response Time Report, File version, Type of Monitor ID, Event, Mode Comment, Starting Date and Time Stamp,,,,,, Interval Report duration in Class, secs, , , , , , Starting year, Starting Starting month, day, Starting Starting hour, min Starting min, FV'nnn, aaa, aaaaaaaa, a, aaa,(<132) nnnn, nn, nn, (0..23) nn, nn, (0..59) nnnnn, Protocol, Reponse session ID,, , Response source IP, Response source port, ???, nn.nn.nn.nn, nnnn, Request session ID,, AAAAA, Response Time Statistics,,, Request source IP, Request source port, Average, Longest, Shortest, nn.nn.nn.nn, nnnn, nnnn.nnn, nnnn.nnn, nnnn.nnn, March 20, 2003 , Page 15 TranScan/LAN Response Time Reporter Percentile Distributions % response times within range1 range1 limit in secs NNN% NNN % response range2 limit % response range3 limit % response times within in secs times within in secs times within range2 range3 range 4 NNN% NNN NNN% NNN NNN% range4 limit % response in secs times >= range4 limit NNN NNN% Interval Counters of: ,,,,,,,,, Interval transactions, Timed out requests, Unparsable frames, Duplicate requests, Orphaned responses, Lost data detected, Lost bytes, Truncated frames, Truncated bytes, nnnnnnnnnn, nnnnnnn, nnnnnnn, nnnnnnn, nnnnnnn, March 20, 2003 nnnnnnn, nnnnnnn, nnnnnnn, nnnnnnn, Page 16 TranScan/LAN Response Time Reporter Reporter verson, stats class version, Source filename Config parms nnn, nnn, See naming rules p-name1=nnn, pname2=yyy,... End of Document March 20, 2003 Page 17