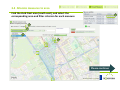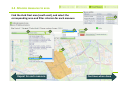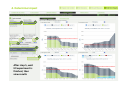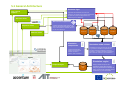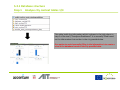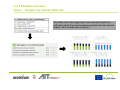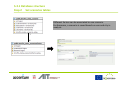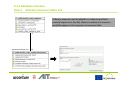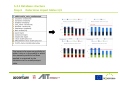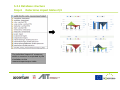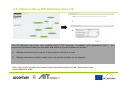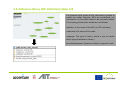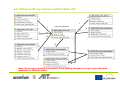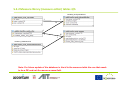
1
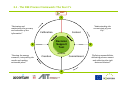
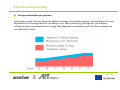
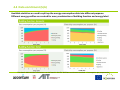
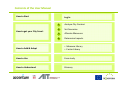
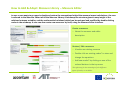
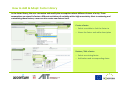
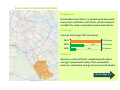
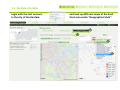
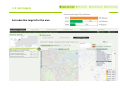
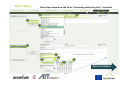
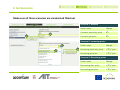
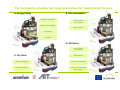
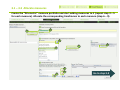
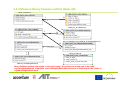
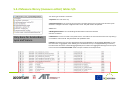
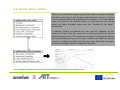
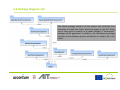
WP3 TRANSFORM Decision Support Environment “Enabling cities to become Smart Energy Cities” Deliverable 3.2 Guidance for the replicable use of the model and/or methodology and recommendations for further development Disclaimer About the Structure of the Deliverables D3.1 and D3.2 The two TRANSFORM WP3 deliverables D3.1 Finalised prototype quantitative decision support model ready for replication in other cities and D3.2 Guidance for the replicable use of the model and/or methodology developed in this work package and recommendations for further development aim at different audiences and have to be seen as separate documents. Where D3.1 describes the tool itself, D3.2 is giving advice to cities which want to adopt the DSE in order to be able to use it in the future, so some content of the deliverables has been duplicated in order to serve the different audiences and should not confuse the readers of the two documents. Since these are public documents the WP3 team tried to make the deliverables as consumable as possible for future external readers. Outline, contents and target audience of deliverable 3.2 Recommendations for Further Development Enabling Context Guide Process Guidebook Data Input Manual User Manual Technical Documentation Content: Document about the preparation process for cities that want to use the DSE. Content: Document about the data input requirements Content: Instructions for using the DSE through the user interface, including a case study. Content: Technical details regarding the development of the DSE software. Content: Suggestions for improvement of the DSE prototype. Content: Document about the required hardware for running the DSE. Content: Description of TRANSFORM city contexts and guidance through enabling measures Audience: Parties interested in preparing the DSE for a new city. Audience: Parties responsible for the city data Audience: Users of the Decision Support Environment. Audience: Technicians/IT specialists interested in the software architecture of the DSE. Audience: (Potential) future developers of the DSE. Audience: Parties interested in installing the DSE on their own servers. Audience: Scientific community Deployment Guide Table of Contents 1. Introduction 5 2. Glossary 6 3. Process Guidebook 7‐16 4. Data Input Manual 17‐26 4. User manual 27‐62 5. Technical Documentation 63‐91 6. Recommendations for further development 92‐96 7. Appendix: Deployment Guide (Word .doc) 97 8. Appendix: Enabling Context Guide 98 (The headlines are clickable hyperlinks!) 1. Introduction WP3 Objectives in TRANSFORM To develop a prototype Decision Support Environment (DSE), which enables decision makers to evaluate the impacts of different transformation plans, under varying scenarios, based on open energy data. In addition to the prototype DSE, documentation materials are developed for dissemination of the DSE to other cities. The Deliverable 3.2 contains all the developed documentation material, required for replication of the Decision Support Environment in other cities. The structure of the document is set up in the form of Guidebooks, which can be used together or separately, depending on the type of audience interested in the DSE. 2. Glossary Smart Energy City The Transform program has set a definition for the Smart Energy City which places the energy targets within the social, economical and ecological context. The Smart Energy City is highly energy and resource efficient, and is increasingly powered by renewable energy sources; it relies on integrated and resilient resource systems, as well as insight‐driven and innovative approaches to strategic planning. The application of information, communication and technology are commonly a means to meet, these objectives. The Smart Energy City, as a core to the concept of the Smart City, provides its users with a livable, affordable, climate‐friendly and engaging environment that supports the needs and interests of its users and is based on a sustainable economy. City Theme A specific subject that a city has chosen to focus on for the duration of the Transform project, e.g. district heating, urban refurbishment, renewables, smart grids etc. Measure A specified intervention applied in a district or on the city level by a stakeholder or a group of stakeholders. Scenario A potential future state of a district and/or city described through a set of factors , e.g. population, gas price, electricity price, economic conditions City Data City specific information that describes the state of the city in accordance with the specified Key Performance Indicators (KPI’s) 3. Process Guidebook 3.1 The DSE Process Framework: The four C’s Content: Document about the preparation process for cities that want to use the DSE. Audience: Parties interested in preparing the DSE for a new city. 3.2 Zoom into the 4 phases with true stories from TRANSFORM cities 3.1 . The DSE Process Framework: The four C’s start 1 “Reviewing and maintaining the accuracy and relevance of the information” Calibration “Running the energy scenarios, interpreting the results and making actionable plans” Context Decision Support Tool 4 “Understanding the current state of your City” 2 feedback Creation Commitment 3 “Defining responsibilities, allocating process owners and collecting the right data and content” 3.2 Zoom into Phase 1. Context 1 Context “Understanding the current state of your City” The first phase serves to define the desired objectives for the Decision Support process, as well as mapping the involved stakeholders and useful data sources. The current status and objectives for the city are analyzed in detail, to assure correct scoping of the Decision Support process and prevent asymmetries of information. Checklist questions How is the city performing on sustainability indicators? How is the city performing with regard to policy insights from data, and informed decision making? What are the city’s climate goals? How is the achievement of these goals measured/tracked presently? What are the main challenges of the city in the energy transition process? Which questions need to be answered by the Decision Support Tool? Who are the relevant decision makers and what information is required for what decisions? What are the current restrictions and barriers to informed decision making? Are there any political commitments or priorities concerning transformational measures? Who are the stakeholders in ownership of necessary data? Which of these data is already openly available? What is the current mindset of data owners with regard to open data? 3.2 True Stories: 1. Context “TRANSFORM project enabled us to invigorate our city networks and put more live into them. At the same time it brought the overarching question of adequate integration of Climate Actions in cities more to the surface. Ulf Skirke is the City Representative and Coordinator of Hamburg “For a successful transformation of a city, it is absolutely necessary to understand existing barriers and to break up established structures. We need to define a common approach, which will open the way for transformation”. Ina Homeier is the City Representative and Coordinator of Vienna. The importance of the stakeholders became very clear during working process in TRANSFORM. These recognitions provided important impulses for further development of Hamburg Master Climate Action Plan. Hamburg Transformation Agenda ‐ the outcome of TRANSFORM project ‐ provides recommendations, which now can be adopted during further work on Hamburg Master Plan. For instance, one of the key recommendations is to place more emphasis on the spatial dimension of urban development, which would enable a better embedding of energy systems in urban areas. TRANSFORM gave a push on acting in our own city environment but from a broadened perspective”. “We managed to get the current status of the city mapped (in terms of energy usage) because ERDF was involved as partner within TRANSFORM and GRDF was interested in following our experimentation; they had a task and a purpose to help realize Grand Lyon’s plans”. Béatrice Couturier is the City Representative and Coordinator of Grand Lyon. 3.2 Zoom into Phases: 2. Commitment 2 Commitment “Defining responsibilities, allocating process owners and collecting the right data and content” The commitment phase is dedicated to setting targets with regard to data acquisition, and appointing the responsibilities for reaching these targets to the right people. It is very important to have commitment from all parties involved, to ensure collective effort and motivation, which is essential for obtaining the required data. Checklist questions Who in your city is responsible for data acquisition? Who is responsible for data integration in the tool? Who is responsible for installation of the tool for the city? Who are the specialists responsible for appropriate creation of scenarios and simulation runs? Who represents the requirements and needs of the city decision makers? How is dealt with political commitments or priorities of the city while creating scenarios and simulation runs? Who is committed to gathering expert information on city‐specific measures? Who is committed to assuring validity of the results? Who is responsible for stakeholder management? Who ensures the continuous flow of new information? 3.2 True Stories: 2. Commitment In order for all the plans to materialize in the city context, we have reorganized the dialogue on the full energy chain. We made it an open choice for stakeholders to decide where to co‐ invest or not to invest at all in new, energy efficient initiatives. This helped spark cooperation on the plans for the South‐ Eastern region of Amsterdam where local businesses (hospital, stadion, utilities) have defined a joint agenda they are committed to work on. Bob Mantel is the City Coordinator of Amsterdam. Elisabeth Kongsmark is the City Coordinator of Copenhagen “Definition and adequate integration of suitable city stakeholders who’d have the understanding and be interested in the local tool application from the very start of the project would be a good point for improvement. Early definition of the target group for the use of the Decision Support Tool.” Else Kloppenborg is a senior adviser for the city of Copenhagen. After the first phase of collecting data to aggregate it in the Energy Atlas, we built 4 scenarios, on the energy efficiency of carriers. The objective was challenging because first we needed to build a methodology, and this required a dedicated effort and a special skillset. It was the first time we proposed energy scenarios, previously we simply did not have the competency or the tooling. Béatrice Couturier is the City Representative and Coordinator of Grand Lyon. 3.2 Zoom into Phases: 3. Creation 3 Creation “Running the energy scenarios, interpreting the results and making actionable plans” Once the first results from data acquisition are successful, insights can be generated from the available data in the creation phase. An appointed team of specialists creates scenarios and transformation plans. Simulation runs are done to answer the city’s questions as specified in the context phase, as objectives for the Decision Support process. Checklist questions What are the most realistic alternatives for transforming the city? Are these alternatives applicable across the whole city, or to certain areas/buildings only? Where are the high potential areas located for each of these alternatives? What are realistic time frames for implementation of the transformation alternatives, in the corresponding areas? How are the impacts of the relevant measures calculated? Which parameters need to be used? What are the costs for realizing these different measures? What are the relevant uncertainty factors that influence the decision making process? What are realistic boundaries to the development of these uncertainty factors? How is ensured that the simulation results provide the desired insights regarding the city’s questions, challenges, and climate goals? 3.2 True Stories: 3. Creation “For the South‐East region of Amsterdam we have used the Decision Support Environment (deliverable of WP3 within TRANSFORM) to simulate the impact of several energy scenario’s, and test the robustness of the energy plans in combination with external factors.” Bob Mantel is the City Coordinator of Amsterdam. Elisabeth Kongsmark is the City Coordinator of Copenhagen “One of the outcomes of working with Transform partners is that we became much more aware of the importance of the political support and commitment in the context of Climate planning and transformation.” Else Kloppenborg is a senior adviser for the city of Copenhagen. “We wanted to be able to make scenario projections for the future energy use in the city; our focal area being the district Part Dieu. After the first phase of collecting data to aggregate it in the Energy Atlas, we built 4 scenarios, on the energy efficiency of carriers. The objective was challenging because first we needed to build a methodology, and this required a dedicated effort and a special skillset. It was the first time we proposed energy scenarios, previously we simply did not have the competency or the tooling. Now with the new stature of Lyon as ‘metropole’, it is part of our direct policy, therefore we have been able to attract the manpower and the competencies to bring scenario planning a step further.” Béatrice Couturier is the City Representative and Coordinator of Grand Lyon. 3.2 Zoom into Phases: 4. Calibration 4 Calibration “Reviewing and maintaining the accuracy and relevance of the information” After the first results have been obtained, collaboration between specialists and city stakeholders is required for reviewing and validating the results. The relevance and reliability of the results needs to be ensured, and additionally required datasets need to be identified. Checklist questions What are the most important insights from the results, for city decision makers? To what extent do the results answer the city’s questions as defined in phase 1? How relevant are the results for overcoming the restrictions and barriers to informed decision making? Are the results reliable and valid? How can the validity of the results be improved? Which additional datasets would improve the quality of the insights from the Decision Support Tool? How can these additional datasets be acquired? What are the most important insights from the results, for revising the city’s questions and objectives? 3.2 True Stories: 4. Calibration Ina Homeier is the City Representative and Coordinator of Vienna. ‘It is always helpful to observe and learn from other cities, taking some best practice examples as inspirations and impulses for our local projects. From my point of view, it is absolutely necessary to take a critical and at the same time open look at internal structure and processes and to work in the most integrative manner possible.’ “To make these insights sustainable, we have worked together the last 2 years and we have prefigured the governance of partners working on the future energy master plan. After the TRANSFORM program ends, it will be continued via new stakeholder mappings and working groups, so the benefits will be continued into the future.” Béatrice Couturier is the City Representative and Coordinator of Grand Lyon. Ulf Skirke is the City Representative and Coordinator of Hamburg “TRANSFORM provided the right framework for the reflection on the own acting and functions within the city and enabled the analysis and assessment of the current situation, it provided space for gaining distance to our current status in order to see things more clearly.” 4. Data Input Manual 4.1 Data requirements Content: Document about the data input requirements Audience: Parties responsible for the city data 4.2 Data components 4.3 Data integration and aggregation 4.4 Data enrichment 4.1 Data requirements There are three criteria for city data to be of maximum value for and to generate the maximum value out of the Decision Support Environment: • Granularity: Data can be available on different resolutions, from a city total value to data on a building level (or even address level). The desired granularity for the Decision Support Environment is building level. This prevents the data from being privacy‐sensitive, but still creates maximum value for analysis of the data. • Date: For valuable analysis, it is important that the data is up‐to‐date. Preferably the latest available dataset (1 year old) is selected for upload in the Decision Support Environment. Data can be easily updated every year. • Coverage: For the data and the insights from the Decision Support Environment to be valuable to city decision makers, it is important that data is available for the whole city. Having limited coverage of the city can provide an opportunity for testing the Decision Support Environment, but real value is captured when the complete city is covered. 4.2 Data components Two components of city data are needed: A Building shapefiles Open data / available within municipalities GIS files that contain information about the shapes and location of buildings within the city. See http://en.wikipedia.org/wiki/Shapefile. B Building attributes Properties of the buildings, that can be saved in two formats: Option 1: .dbf Option 2: .xls As columnar attributes for each shape The .dbf file and .xls must both contain a unique ID column where these IDs refer to the same buildings .shp .shx .dbf .prj .sbn and .sbx Typically available within energy/grid companies Typically available within municipalities • Electricity consumption (kWh/year) • Gas consumption (m3/year) • Other types of energy consumption (kWh/year) • Building function (office/house) • Building floor area (m2) • Construction year • Energy label • Ownership Available within diverse institutions, or not yet available • Roof area suitable for solar panels (m2) • Underground heat storage potential (depths or kWh/year) • Wind potential 4.3 Data integration and aggregation These three steps show how the data integration and aggregation process was done in the case of the city of Amsterdam. Data aggregation serves to avoid privacy issues with the energy data. 1 2 Getting the shape files of buildings The municipality of Amsterdam has a dataset with GIS shape files and data about construction year, intended use of a building, etcetera (basic administrational data). Each building has an identification number; these IDs follow a logical order through the city, i.e. buildings next to each other have a consecutive ID. 3 Integrating the energy consumption data The grid operator Alliander receives the basic administration data from municipality, and uses a GIS program to add the most recent annual energy consumption data as extra columns to the GIS data files. If there are more connections within one building, the consumption data of all connections are summed. The number of connections within a building is also saved as an extra column. Aggregation of energy data All buildings with less than six connections are selected; for privacy reasons the data of these buildings need to be aggregated. A query is run in the GIS program that averages the consumption values of a group of six buildings that lay close to each other, and then gives them all the same average value. Groups of buildings are made based on the identification number (see step 1). 4.4 Data enrichment (1/6) Building attributes When the data is integrated and aggregated, additional effort is required for enriching the data to enable more sophisticated analysis on the impacts of measures. A method was developed for converting 10 data points into 32 data points, by using city statistics. U‐value roof Roof area U‐value façade Façade area U‐value floor Windows area U‐value windows Energy data Electricity consumption for Appliances Building attributes Energy data (kWh/year) GIS Shapefile Electricity consumption Construction year Gas consumption Building function Heat consumption Floor area Energy label Electricity consumption for Cooking Electricity consumption for Lighting Electricity consumption for Heating building Electricity consumption for Heating tap water + Electricity consumption for Showering Electricity consumption for Cooling Electricity consumption for Ventilation systems Gas consumption for Cooking Number of storeys Gas consumption for Heating building Ownership Gas consumption for Heating tap water Gas consumption for Showering Heat consumption for Heating building Heat consumption for Heating tap water Heat consumption for Showering 4.4 Data enrichment (2/6) Energy consumption per purpose Electricity consumption for Appliances This data enrichment method consists of three parts. In each part, a category of data points is estimated from available data: 1. 1 Energy consumption per purpose 2. 2 Current insulation grades (U‐values) Electricity consumption for Cooking Electricity consumption for Lighting Electricity consumption for Heating building Energy consumption Electricity consumption Gas consumption 1 + Electricity consumption for Heating tap water Electricity consumption for Showering Electricity consumption for Cooling Heat consumption Electricity consumption for Ventilation systems Energy label Gas consumption for Cooking Building function Gas consumption for Heating building Gas consumption for Heating tap water 3. 3 Building dimensions Gas consumption for Showering Heat consumption for Heating building Heat consumption for Heating tap water Heat consumption for Showering Building attributes Construction year 2 + Building attributes U‐value Roof U‐value Façade Building attributes U‐value Floor Shapefile U‐value Windows Floor area Building function Number of floors 3 + Building attributes Roof area Façade area Windows area 4.4 Data enrichment (3/6) 1. 1 Energy consumption per purpose City statistics need to be gathered, about the average division of energy consumption between different purposes, and how this differs between building functions. Function Carrier Appliances Cooking Lighting Domestic Domestic Education Education Hotel Hotel Industry Industry Medical Medical Office Office Shop Shop Sport Sport Other Other Elec. Gas Elec. Gas Elec. Gas Elec. Gas Elec. Gas Elec. Gas Elec. Gas Elec. Gas Elec. Gas 60.0% 0.0% 43.2% 0.0% 32.9% 0.0% 60.0% 0.0% 27.3% 0.0% 46.8% 0.0% 19.7% 0.0% 29.6% 0.0% 37.1% 0.0% 5.0% 2.0% 3.9% 0.0% 0.0% 8.8% 0.0% 0.0% 1.3% 1.3% 0.0% 0.0% 0.0% 0.0% 3.1% 0.0% 1.9% 1.7% 16.0% 0.0% 46.4% 0.0% 39.9% 0.0% 30.0% 0.0% 53.2% 0.0% 37.3% 0.0% 67.9% 0.0% 44.2% 0.0% 43.6% 0.0% Heating building 12.0% 79.0% 0.0% 99.6% 0.0% 83.6% 0.0% 90.0% 0.0% 88.0% 0.0% 99.9% 0.0% 100.0% 0.0% 85.3% 1.7% 90.8% Heating tap water 0.6% 3.8% 2.2% 0.4% 0.3% 1.5% 0.0% 10.0% 0.2% 2.1% 0.7% 0.1% 1.0% 0.0% 0.1% 2.9% 0.7% 1.6% Showering Cooling 2.4% 15.2% 0.0% 0.0% 1.0% 6.1% 0.0% 0.0% 0.8% 8.5% 0.0% 0.0% 0.0% 0.0% 0.4% 11.8% 0.7% 5.9% 4.0% 0.0% 0.6% 0.0% 16.0% 0.0% 5.0% 0.0% 5.9% 0.0% 9.4% 0.0% 8.1% 0.0% 0.0% 0.0% 6.3% 0.0% Ventilation systems 0.0% 0.0% 3.7% 0.0% 10.0% 0.0% 5.0% 0.0% 11.2% 0.0% 5.7% 0.0% 3.3% 0.0% 22.6% 0.0% 8.1% 0.0% 4.4 Data enrichment (4/6) 1. 1 Energy consumption per purpose Assumptions need to be set about the different energy consumption purpose, as to whether they are dependent on the energy label of a building or not. Most commonly, and logically, the building‐ related purposes are dependent on energy label (depicted in red below) and the other purposes are not (depicted in blue). 4.4 Data enrichment (5/6) Available statistics are used to split up the energy consumption data into different purposes. Different energy profiles are created for every combination of building function and energy label. The details behind these calculations can be found in the file ‘DSE Data enrichment method – Consumption per purpose.xlsx’ 4.4 Data enrichment (6/6) 1. 2 Current insulation grades (U‐values) The current insulation grades, or U‐values, for every surface of a building are based on averages per construction year and climatic zone. U‐values (W/(m2K)) Built before 1975 Roof Façade Floor Windows 0.50 0.50 0.50 3.00 Roof Façade Floor Windows 1.50 1.50 1.20 3.50 Roof Façade Floor Windows 3.40 2.60 3.40 4.20 Built 1975‐1990 Built 1991‐2002 Cold climatic zone 0.20 0.15 0.30 0.20 0.20 0.18 2.00 1.60 Moderate climatic zone 0.50 0.40 1.00 0.50 0.80 0.50 3.50 2.00 Warm climatic zone 0.80 0.50 1.20 0.60 0.80 0.55 4.20 3.50 Built 2003‐2006 Built after 2006 0.15 0.18 0.18 1.42 0.13 0.17 0.17 1.33 0.25 0.41 0.44 1.84 0.23 0.38 0.41 1.68 0.50 0.60 0.55 3.04 0.43 0.48 0.48 2.71 From http://www.ecofys.com/files/files/ecofys_2005_costeffectiveclimateprotectionbuildingstock.pdf 1. 3 Building dimensions The roof, façade, and window area are calculated from the GIS shapefiles and based on average window‐to‐wall ratios for different building functions. Building function Domestic Education Hotel Industry Medical Office Shop Sport* Other* Window‐to‐wall ratio 0.16 0.22 0.34 0.06 0.27 0.35 0.11 0.22 0.22 4. DSE Full User Manual Link to the tool: http://sbc1.ait.ac.at/web/mfumarola/dst Content: Instructions for using the DSE through the user interface, including a case study. Audience: Users of the Decision Support Environment. Contents of the User Manual How to Start How to get your City Smart Log In 1 Analyze City Context 2 Set Scenarios 3 Allocate Measures 4 Determine Impacts How to Add & Adapt • Measure Library • Factor Library How to Use Case study How to Understand Glossary Contents of the User Manual How to Start How to get your City Smart Log In 1 Analyze City Context 2 Set Scenarios 3 Allocate Measures 4 Determine Impacts How to Add & Adapt • Measure Library • Factor Library How to Use Case study How to Understand Glossary How to Start: Log In The Decision Support Environment can be accessed through the internet, and test accounts are available for new users that want to explore the options and get familiar with the DSE. 1. Access the Decision Support Environment ‒ Go to sbc1.ait.ac.at/web/mfumarola/dst via Google Chrome 2. Type Username and Password ‒ Click on the field, enter your details. If no login details are provided, login with username ‘test’ and password ‘test’. 3. Select the City ‐ City for which the scenario planning will be made 4. Click ‘OK’ ‐ Opens the Decision Support Environment Contents of the User Manual How to Start How to get your City Smart Log In 1 Analyze City Context 2 Set Scenarios 3 Allocate Measures 4 Determine Impacts How to Add & Adapt • Measure Library • Factor Library How to Use Case study How to Understand Glossary How to get your city smart: Outline The Decision Support Environment consist of four main steps. A user can (1) analyse the current energy performance of a city based on the available data, (2) set scenarios containing assumptions about the future state of a city, (3) mimic the transformation of an area by allocating measures, and (4) test the local or city‐wide impact of such a transformation under the various future assumptions (scenarios). 1 Analyze City Context View and analyze the current situation of the city and set targets for the future 2 Set Scenarios Determine the future state of the city by allocating factors of uncertainty that will influence the outcomes over time 3 Allocate Measures Design transformation plans for the city via measure portfolios in certain areas and for certain time frames 4 Determine Impacts Analyze the outcomes of the experiment created in the preceding steps, compare different experiments to each other to assess feasibility 1. Analyze City Context The first step is a representation of the available city data in the Decision Support Environment, that can be viewed in bar charts, and on a map through an interactive geographical interface. This provides a clear insight in the ‘as is’ situation in the corresponding city, and enables the user to identify areas with opportunities for improvement. Next to exploring the current status of a city, the user can set sustainability targets, referring to the ‘to be’ situation of the city. Analyze the city data ‒ Transform Dashboard (Data from Transform) ‒ Extended Dashboard (Data from other sources) ‒ Geographical Data (Selection of city area) Set targets ‒ Future city targets as a function (%) of the current city data 2. Set Scenarios In the second step, different futures for the city can be defined, with regard to the uncertain, uncontrollable factors for a city actor. Examples of these factors are energy prices and interest rate. Set Scenarios ‒ Create new scenario ‒ Select Existing Scenario (follow steps below to validate accuracy) ‒ Delete existing scenario (select scenario from list and ‘remove’) Create New Scenario ‒ Name the Scenario, Add a description This makes the scenario traceable and explicable to others Add factors to the Scenario ‒ Customize by adding under which factors the scenario will be run 3. Allocate Measures (1/3) Step 3 is dedicated to the design of transformation plans, or ‘measure portfolios’. These refer to factors that city actors do have control over. Each measure portfolio contains a set of measures, allocated to certain entities in the city (e.g. buildings) and to a specific time frame for implementation. Create Measure Portfolio ‒ Name the new measure portfolio and add a description Add measures to the portfolio: ‒ Select measures from the dropdown list ‒ Either ‘Add to portfolio’ or ‒ Edit/Create a new measure *Instead of creating a new measure portfolio, an existing measure portfolio can be selected and either edited or applied via the outlined steps. 3. Allocate Measures (2/3) Step 3 is dedicated to the design of transformation plans, or ‘measure portfolios’. These refer to factors that city actors do have control over. Each measure portfolio contains a set of measures, allocated to certain entities in the city (e.g. buildings) and to a specific time frame for implementation. Allocate time and penetration rate ‒ Select a measure and choose Allocate Time ‒ Allocate a start and end date for implementation of this measure ‒ Use slider to set a penetration rate 3. Allocate Measures (3/3) Step 3 is dedicated to the design of transformation plans, or ‘measure portfolios’. These refer to factors that city actors do have control over. Each measure portfolio contains a set of measures, allocated to certain entities in the city (e.g. buildings) and to a specific time frame for implementation. Allocate area ‒ Choose the appropriate level of detail (block / building / network / …) ‒ Select an area for implementation of the measure ‒ End the selection by double‐clicking on the map ‒ Choose a filter criterion to select only certain types of buildings ‒ Press Select to confirm the selection 4. Determine Impacts In the last step, the user can determine the impacts of a measure portfolio (defined in step 3), given a certain scenario (step 2). A combination of measure portfolio and scenario is called an experiment. One experiment basically represents a possible future for the city. The user can view and compare the outcomes of different experiments, measured on four city KPIs. Create experiment ‒ Select Scenario ‒ Select Measure Portfolio ‒ Select simulation start date and simulation end date ‒ Click ‘Add experiment’ The created experiment is now sent to the simulation engine and the results are being calculated. Select experiment(s) to view results ‒ Select the experiment you want to view the results for ‒ Click ‘Total City Impact’, ‘Selected Area Impact’ or ‘Impact’ to view the actual results on KPIs / changes in KPIs ‒ View results in ‘Transform Dashboard’ or as ‘Geographical Data’ Contents of the User Manual How to Start How to get your City Smart Log In 1 Analyze City Context 2 Set Scenarios 3 Allocate Measures 4 Determine Impacts How to Add & Adapt • Measure Library • Factor Library How to Use Case study How to Understand Glossary How to Add & Adapt: Measure Library – KPI Definition In case a user wants to go more in‐depth and review the assumptions behind the calculations of the four KPIs, or change the values of city parameters, the user is referred to the KPI Definition tab of the Measure Library. A mindmap‐ like structure gives an easy insight in the relations between variables, and the mathematical relations behind can be reviewed by double‐clicking nodes in the mindmap. Review KPI definitions ‒ Choose a KPI and see how it is calculated ‒ Double‐click on nodes to view the equations behind ‒ View and modify city parameter values How to Add & Adapt: Measure Library – Measure Editor In case a user wants to go more in‐depth and review the assumptions behind the measure impact calculations, the user is referred to the Measure Editor tab of the Measure Library. A mindmap‐like structure gives an easy insight in the relations between variables, and the mathematical relations behind can be reviewed and modified by double‐clicking nodes in the mindmap. A user can also create new measures by itself, using the Measure Editor interface. Create a measure ‒ Name the measure and add a description Review / Edit a measure ‒ Visualize an existing measure ‒ Double‐click on existing nodes* to view and change the equations ‒ Add new nodes* by clicking on one of the colored buttons in the top menu *See glossary for the meanings of the different types of nodes, or variables How to Add & Adapt: Factor Library In the factor library, the user can review and modify the assumptions about different futures of a city. These assumptions are stored in factors: different evolutions of variables with a high uncertainty. Next to reviewing and customizing these factors, a user can also create new factors itself. Create a factor ‒ Select a variable to link the factor to ‒ Name the factor and add a description Review / Edit a factor ‒ Select an existing factor ‒ Add values and corresponding dates Contents of the User Manual How to Start How to get your City Smart Log In 1 Analyze City Context 2 Set Scenarios 3 Allocate Measures 4 Determine Impacts How to Add & Adapt • Measure Library • Factor Library How to Use Case study How to Understand Glossary Case study: Instructions In the following slides, background information is provided about an area of Amsterdam which will serve as a case study area. This background information is interspersed with specific instructions on how to move through the Decision Support Environment successfully, in order to generate insightful results. Case study: Amsterdam Zuid Oost Background Amsterdam Zuid Oost is a mixed‐used area with low prices and little restrictions, which makes it suitable for urban innovation and experiments. Challenge Current and target CO2 emissions 2012 390 kt/year ‐55% 2025 2040 ‐81% 176 kt/year 74 kt/year Ambition Become a self‐sufficient neighborhood where energy is produced locally, from renewable sources, and where energy losses are minimized. Go to step 1.1 1.1 Analyze city data Login with the test account, in the city of Amsterdam: and look up different maps of the Zuid Oost area under “Geographical data”. 1 2 3 4 Case study: Question Challenge Current and target CO2 emissions 2012 390 kt/year ‐55% 2025 2040 ‐81% 176 kt/year 74 kt/year Question What is the most cost‐effective way for reducing CO2 emissions in this area of the city (taking into consideration the local characteristics of the area)? Go to step 1.2 1.2 Set targets Set reduction targets for the area 1 The municipality considers three scenarios Scenario 1: Baseline Factor name Change Constant electricity price 0% Constant gas price 0% Scenario 2: Increasing prices Factor name Change Increasing electricity price + 2% / year Increasing gas price + 2% / year Scenario 3: Decreasing prices Factor name Change Decreasing electricity price + 2% / year Decreasing gas price + 2% / year No one knows what the future brings, and different futures can mean different outcomes for plans that we make now. We can test the plans we make, under different future scenarios. The aim is to find the most cost‐ effective way for reducing emissions, and this cost‐effectiveness is highly dependent on energy prices. Therefore, the uncertainty in energy prices is where the municipality is most interested in. We create three scenarios that together represent a range of possible future energy prices. Go to step 2 2. Set Scenarios • Start creating a scenario by clicking on “Create” • Give the scenario a name (e.g. “Baseline”) and start adding factors to the scenario • If the factor list is empty, create factors in the factor library (see next slide) • When you’re finished with the Baseline scenario, continue with the “Increasing prices” and “Decreasing prices” scenarios and add the corresponding factors to these scenarios. 1 2 3 4 5 Go to Factor library Factor library These steps show how the factor “Increasing electricity price” is created 2 4 1 3 5 6 7 8 10 9 Return to step 2 2. Set Scenarios Make sure all three scenarios are created and filled out Scenario 1: Baseline 1 2 Factor name Change Constant electricity price 0% Constant gas price 0% Scenario 2: Increasing prices 3 4 5 Factor name Change Increasing electricity price + 2% / year Increasing gas price + 2% / year Scenario 3: Decreasing prices Factor name Change Decreasing elec. price + 2% / year Decreasing gas price + 2% / year The municipality considers four major alternatives for ‘transforming’ the area A: Energy Saving B: Max Renewables Window replacement Solar PV panels roof / façade Shower Heat Exchanger Wind turbines LED lighting Insulation D: All Electric Solar PV panels roof / façade C: City Grids Wind turbines District cooling grid Air source Heat Pump District heating grid Aquifer thermal storage (open system) We will start by testing the All Electric alternative Solar PV panels roof / façade Wind turbines The municipality has provided realistic timeframes and implementation details for the measures within the “All Electric” portfolio: Air source Heat Pump Aquifer thermal storage (open system) Go to steps 3.1 – 3.3 3.1 – 3.3 Allocate measures Create the “All electric” measure portfolio and start adding measures to it (repeat step 3 – 5 for each measure). Allocate the corresponding timeframes to each measure (step 6 – 9). 1 2 3 5 4 6 7 8 9 Go to step 3.4 3.4 Allocate measures to area Find the Zuid Oost area (south east), and select the corresponding area and filter criterion for each measure 1 2 3 4 5 Please continue 3.4 Allocate measures to area Find the Zuid Oost area (south east), and select the corresponding area and filter criterion for each measure 9 8 6 11 10 5 7 Repeat for each measure Continue when done You have now defined the following scenarios and measure portfolio Scenarios Measure portfolio Scenario 1: Baseline All Electric Factor name Change Constant electricity price 0% Constant gas price 0% Solar PV panels roof / façade Factor name Change Wind turbines Increasing electricity price + 2% / year Increasing gas price + 2% / year Scenario 2: Increasing prices Air source Heat Pump Scenario 3: Decreasing prices Factor name Change Decreasing elec. price + 2% / year Decreasing gas price + 2% / year Aquifer thermal storage (open system) Continue with initiating simulation runs and obtaining results Go to step 4 4. Determine Impact 2 1 3 4 5 6 7 After step 5, wait till experiment is finished, then view results Continue with the other measure portfolios, or create your custom experiment! A: Energy Saving B: Max Renewables Window replacement Solar PV panels roof / façade Shower Heat Exchanger Wind turbines LED lighting Insulation Scenario 1: Baseline Factor name Change Constant electricity price 0% Constant gas price 0% Scenario 2: Increasing prices C: City Grids District cooling grid Factor name Change Increasing electricity price + 2% / year Increasing gas price + 2% / year Scenario 3: Decreasing prices District heating grid Factor name Change Decreasing electricity price + 2% / year Decreasing gas price + 2% / year Contents of the User Manual How to Start How to get your City Smart Log In 1 Analyze City Context 2 Set Scenarios 3 Allocate Measures 4 Determine Impacts How to Add & Adapt • Measure Library • Factor Library How to Use Case study How to Understand Glossary How to Understand: Glossary DSE Step Title Terminology Description 1 Analyze City Data City Data Viewing of the city specific data that describes the state of the city on the specified KPI's. Viewing of the city specific data in a maps functionality with the option to select (via 'freehand polygon') specific areas. 2 3 4 Set Scenarios Allocate Measures Determine Impact Scenario A potential future state of a city described through a set of factors, e.g. population, gas price, electricity price, economic conditions. Factor An independent (market) that provides the context for any future city transformation plans (e.g. gas price, oil price, population growth). Measure Specified interventions that are applied by stakeholders to a city. Enabler Technique of method that supports the implementation/effectiveness of a measure. Portfolio A set of measures each allocated to a certain geographic area in time, forming a transformation plan for a city. Experiment The combination of a scenario plus its measures (measure portfolio) on a city or city area resulting in outcomes on the predetermined KPI's. Measure Library Factor Library Area where all measures are stored, made visible and are adaptable. Measure Editor Area for adapting measure, in structure, in values or both. Affected Variable Future / to‐be value of a building attribute Variable Current value of a building attribute Input Variable A constant value that represents an assumption/parameter Auxiliary Variable A node that serves as intermediate step in an equation, used to simplify equations. A node that connects a group of nodes to be used in another node. Area where all factors are stored, made visible and are adaptable. 5. Technical Documentation 5.1 General architecture 5.2 User interface 5.2.1 Database structure Step 1 Analyse city context tables Step 2 Set scenarios tables Content: Technical details regarding the development of the DSE software. Step 3 Allocate measures tables Step 4 Determine impact tables 5.2.2 Measure library tables 5.2.3 Factor library tables 5.3 Package Diagram 5.4 Simulation model Audience: Technicians/IT specialists interested in the software architecture of the DSE. 5.4.1 Conceptual model TRANSFORM 5.4.2 Package overview 5.4.3 Internal data structure 5.4.4 Simulation scheduler 5.1 General Architecture Database layer City context explorer Separates the databases from the user interface. This allows from a flexible architecture in which the system is independent from different types of databases. Scenario editor GIS visual component Sequence editor Creates interactive maps from the city data and geographical database. These maps can be used to visualize data and for the user selections. Sequences Measures City data Scenarios Measure editor Simulation components Simulation model initiator Contains the standard software components to simulate producers, network, and consumers. Instantiates for each record in the city data (e.g. house) a simulation component and connects it through a network to the right producers. In a typical simulation experiment, about 300 000 consumers are instantiated. Simulation engine Output analyzer Output data Using a model as input, the simulation engine will calculate every key performance indicator for every month for the selected period of interest (e.g. 2013 to 2025). 64 5.2 User Interface This part of the documentation provides an overview of the database tables and classes used to create the web user interface. 5.2.1 Database structure Step 1 Analyse city context tables Step 2 Set scenarios tables Step 3 Allocate measures tables Step 4 Determine impact tables 5.2.2 Measure library tables 5.2.3 Factor library tables 65 5.2.1 Database structure Step 1 Analyse city context tables 1/3 This table holds the information which is shown in the high charts in step 1 of the tool (“Transform Dashboard”. It is manually filled based on the information that resides in the city provided data. One option to avoid manually filling in the information is to create a view in the database based on the city provided data. 66 5.2.1 Database structure Step 1 Analyse city context tables 2/3 This table holds the information which is shown in the high charts in step 1 of the tool (“Extended Dashboard”. It is manually filled based on the information that comes from the ARUP data. 67 5.2.1 Database structure Step 1 Analyse city context tables 3/3 This table stores the targets (per user and city).Targets are defined to check if a certain measure portfolio has the desired impact ( this could be seen in step 4 ). 68 5.2.1 Database structure Step 2 Set scenarios tables Different factors can be associated to one scenario. Furthermore, a scenario is saved based on user and city in analysis. 1 N 69 5.2.1 Database structure Step 3 Allocate measures tables 1/2 Different measures can be added to a measure portfolio (named sequence in the db). Measures added to a measure portfolio appear in the sequence to measure table 1 sequenceid=sequence.id N 70 5.2.1 Database structure Step 3 Allocate measures tables 2/2 When allocating a measure to time the information is stored in the sequence planning table. The f_measure attribute is by default set to false and it is not currently used. This attribute might become handy when desiring to achieve certain conditions in the city data (because the city has not provided that data) before applying a measure. For instance, the city of Vienna wanted to test two different scenarios (normal scenario and efficiency) scenario. However, the initial situation data (which was a kind of improvement of the normal scenario) for the efficiency scenario was not provided. In this case you can create a measure and set the f_measure ( fictitious measure ) to true. The simulation will then apply this fictitious measure first to transform the initial data and later the rest of the measures. Note: A check box should be added to the measure portfolio table if it is desired to activate the functionality of the f_measure attribute from the GUI 71 5.2.1 Database structure Step 4 Determine impact tables 1/3 The impact of a measure portfolio on either a city or in the area(s) in which this measure portfolio has been applied is outputted by the simulation to the mainkpioutput table. 72 5.2.1 Database structure Step 4 Determine impact tables 2/3 The individual impact of measures, within a measure is outputted by the simulation to the measureimpactoutput table. 73 5.2.1 Database structure Step 4 Determine impact tables 3/3 Simulation results shown in the maps are stored in the sequence togeometries table. 74 5.2.2 Measure library (KPI definition) tables 1/2 1 2 The KPI definition tap shows how predefined KPI’s (CO2 emissions, renewables and consumption costs ) structured. By double clicking on the nodes two different type of windows can be seen. 1) Window that shows the structure of the equations that form a node 2) Window that shows a table in which some city specific variables can be adapted. are Note: City specific variables are located in the cityvariable table in the db. Their values in the cityvariablevalue table. 75 5.2.2 Measure library (KPI definition) tables 2/2 The formula table stores all the information needed to create the nodes. Because, KPI’s are predefined, the information in this table needs to be manually added. The meaning of the table attributes is as follows: Indicator: Is the name of the KPI (i.e CO2 emissions ) nodename: the name of the node. nodetype: The type of node ( which is use to handle which type of window is shown ) formulacomponent: Equations linked to a specific node 76 5.2.2 Measure library (measure editor) tables 1/5 The measure editor is integrated by 23 tables which relation is shown in the next slides. However, hereby it is introduced some terminology which is needed to further understand the structure of the measure editor. Affected Variable: Affected variable ( dark green in the GUI ) is a variable which informs the simulation about the variables that will change their previous value after a measure is applied at time t. Variable: A variable ( red in the GUI ) which represents a building related variable. Its initial value comes from the city provided data. At the time of applying a measure ( t ) the initial value of this variable is seen by the simulation as (t‐1). That is why in the GUI it has a “t_1” suffix. The name of the variables ( user friendly names) in the GUI differ from the names that appear in the DB. The names given in the db to these variables is as follows: Affected Variables‐> Measure Node Variable ‐> Building Attribute Auxiliary Variable‐> Purpose Node Input Variable ‐>Purpose Node Input Variable: A variable( orange in the GUI ) that serves as input for the calculations. It could be either a table or a constant. Tables are mainly used in the LOOK UP equation types. Factor: Factor ( white in the GUI ) are created in the factor library and could be added to measures as a way to include variation of input variables in time. Auxiliary Variable: Variable used as an auxiliary ( intermediate step in calculations ). Auxiliary variables are most of time connected to other auxiliary variables or to a measure node. Furthermore, they are mainly dependent on input, factor or building attribute variables. 77 5.2.2 Measure library (measure editor) tables 2/5 N 1 1 node_id=basenode.id 1 1 N 1 N N 1 1 N 1 N Note: the group node table is not used ( it was initially thought as a way to give the same equations to different nodes 78 5.2.2 Measure library (measure editor) tables 3/5 Variable_id=CityVariable.id 1 1 N 1 N 1 1 measure_id=Measure.id N Note: For future update of the database is the id in the measure table the one that needs to be a PK and not the measure name field. 79 5.2.2 Measure library (measure editor) tables 4/5 value_id=Value.id N 1 1 Table_key_id=TableKey.id N 1 N 1 Key_id=TableKey.id and attribute_id=buildingattribute.id N 1 1 1 N value_id=Value.id attribute_id=BuildingAttribute.Id Note: Building attribute value table is currently empty. The values are stored now in the table cityTobuildingattribute. In addition, the buildingattribute table serves as a dictionary for the values in citytobuildingattribute table 80 5.2.2 Measure library (measure editor) tables 5/5 The meaning of the fields is as follows: 1.cityname: the name of the city 2.attributerealname: is the name of column found in the table referenced in 5 (every time the name of this attribute is changed in the db or a different table is used. This field needs to be updated. 3.unit: units 4.Buildingattributeid:the id in the building attribute table to which the attribute realname is linked to. Only done for Amsterdam, Lyon and Vienna 5.tablename:The name of a table in the public schema. This table is the one that shall contain the city data ( if a new table is used in the db. This field needs to be updated as well. 6.function: Sometimes the cities give aggregated information (BLOCKS) or disaggregated (BUILDING). In case this information is aggregated, cities need to give a attributerealname ( i.e area/typeofbuilding or function ) from which the calculation could be disaggregated by the simulation and aggregated back again for the ouput. In that case the field measurevariable needs to be put to FALSE. See example below. 81 5.2.3 Factor library tables Factors are assumptions regarding the values that city specific variables will take in the future ( way to take uncertainty into account ). Factors can be created linked to a predefined city variable, or as independent ones to be used in the measure library ( in this case the user should select the [Input Variable] name from the “Variable to link factor” combo box) 1 In addition, factors are defined per user and city. However, at this moment, all users from the same city are able to see/edit the factors defined by other users. This is because measures in the measure library are only defined per city, and if a factor needs to be added to specific measure it needs to be defined in the same way. Otherwise, the same measure could have a different behaviour per user. N Note: Instead of the factor name as a FK in the factor entry table the factor.id should be used. 82 5.3 Package Diagram 1/4 The charts package contains all the classes and JavaScript files necessary to create the charts which are shown in the GUI. Every time a chart type is created ( as a Vaadin Widget) a “component” package will be generated. In addition, the chartqueries package contains all the database queries and which are used to fill in the charts 83 5.3 Package Diagram 2/4 1. 2. 3. 4. 5. 6. 7. 8. 9. 10. 11. Measureporlet_service_impl: Stores all the custom methods used to make queries to the database by using the liferay service builder. Webui_step1: Contains all the classes needed to create the “Analyze city Context” step Webui_step2: Contains all the classes needed to create the “Set scenarios” step. Webui_step3: Contains all the classes needed to create the “Allocate measures” step. Sequenceportlet: It is used by the webui_step3 package and it contains the classes needed to allocate a measure to time Webui_step4: Contains all the classes needed to create the “Determine Impact” step. Measurelib: Contains all the classes needed to create the “Measure Library” MindMap: Contains all the classes needed to create the MindMaps which are shown in the Measure Library. Measurelib_windows: Contains all the pop up windows which are shown when double clicking in any of the nodes of the mindmaps. Webui_factorlib: Contains all the classes need to create the factor library. Charts_windows: Contains the classes which to create the windows in which the charts in step 1 and 4 are shown. 84 5.3 Package Diagram 3/4 Jeval is the library which is used to connect the nodes in the mindmaps from equations.This library is used by the webui_measurelib and mindmap packages respectively. 85 5.3 Package Diagram 4/4 The TransformFrontend package contains the classes to build the main ( parent ) layout of the GUI which will eventually contain the taps step 1 till 4 measurelib and factorlib 86 5.4 Simulation model This part of the documentation provides an overview of the simulation model, its internal data structure and the simulation scheduler. 5.4.1 Conceptual model TRANSFORM 5.4.2 Package Overview 5.4.3 Internal data structure 5.4.4 Simulation scheduler 87 5.4.1 Conceptual model TRANSFORM The model distinguishes consumers, network and producers. Consumers and producers are entities in the system that contain attributes (e.g. consumption values). At each event in time (i.e. scenario change or measure application), a recalculation will be done on the attributes of these entities. The recalculation is done using a calculate that evaluates the formulas that the users input in the measures and assigns the values to the entities. The calculator will eventually calculate the formulas that are made to determine the KPIs, which are finally outputted to the output database. 88 5.4.2 Package overview • Src.nl.macomi.transform.data – • Src.nl.macomi.transform.database – • The internal data structure of the simulation model Src.nl.macomi.transform.model.modelbuilder – • Classes to evaluate equations Src.nl.macomi.transform.model.data – • Classes built from atomic and coupled models that is the actual representation of the simulation model Src.nl.macomi.transform.calculator – • Classes to represent a measure Src.nl.macomi.transform.model – • Classes to represent an equation and its components Src.nl.macomi.transform.measure – • Classes to support database loading and outputting Src.nl.macomi.transform.equations – • A data representation of the data loaded from the database ‐classes that use automatically generate the simulation model from input data Src.nl.macomi.transform.model.utils – Various utils functions that we need in other classes 89 5.4.3 Internal data structure • Src.nl.macomi.transform.data – This package contains the internal representation of the data from the database, it contains the following classes whose name corresponds to the data it contains: • AggregatedEntity • BuildingAttribute • BuildingAttributeValue • Carrier • CityVariable • ConstantValue • Entity: this contains data from the city tables • Equation • Groupnode • KeyValuePair • KPINode • Measure • MeasureApplication • MeasureNode • MeasureUpdatableNode • Node • NodeValue • PurposeNode • TableKey • TableKeyCombination • TablueValue • Value 90 5.4.4 Simulation scheduler The simulation scheduler is a java application that is continuously running and reads the experiments table in the database to check whether there is an experiment that has not been executed yet. As soon as it finds an experiment that has not been executed, it will simply spawn the simulation model with the appropriate sequence and scenario ID. The simulation scheduler consists of 3 classes: • Dataservice: to read the database table containing the experiments • Scheduler: the main class that runs the program that will check the table regularly • Tunnel: a helper class to start a SSH tunnel programmatically 91 6. Recommendations for further development 6.1 Suggested improvements Content: Suggestions for improvement of the DSE prototype. Audience: (Potential) future developers of the DSE. 6.2 Inputs from the testing session questionnaires 6.3 Suggested improvements by the development team 6.1 Suggested Improvements Open and harmonise the city (energy) data throughout Europe! The most important finding of WP3 was the need for harmonised, standardised energy data, preferably delivered via standard (web) protocols (e.g. semantic web technologies (Linked Open Data)) to enable the easy integration of data into applications (like the DSE) and a comparison of measures between the cities. Concerning content of the data: We repeat the three critical criteria for city data to be of maximum value for and to generate the maximum value out of the Decision Support Environment: • Granularity: Data can be available on different resolutions, from a city total value to data on a building level (or even address level). The desired granularity for the Decision Support Environment is building level. This prevents the data from being privacy‐sensitive, but still creates maximum value for analysis of the data. • Date: For valuable analysis, it is important that the data is up‐to‐date. Preferably the latest available dataset (1 year old) is selected for upload in the Decision Support Environment. Data can be easily updated every year. • Coverage: For the data and the insights from the Decision Support Environment to be valuable to city decision makers, it is important that data is available for the whole city. Having limited coverage of the city can provide an opportunity for testing the Decision Support Environment, but real value is captured when the complete city is covered. 6.2 Inputs from the testing session questionnaires (1/2) Selected comments from the city user during the testing session of the DSE in Amsterdam in February 2015. For them the DSE is: • “a highly developed expert tool” • “user friendly, but technical knowledge required is very high. Training for data entry is necessary” (reported 2x) • “useful and simple” (reported 2x) • “a good start and a way to address smart cities, but the cities are not fully ready and the same goes for the tool. Joined development is needed” (DSE <‐> Cities) • “very flexible, outcome and results highly depend on the quality of integrated data” 6.2 Inputs from the testing session questionnaires (2/2) The users attending the DSE testing session in Amsterdam in February 2015 identified the following requirements for/improvements of the tool: • • • • • • • • A clear overview on available measures, their impacts, and parameter values used is needed A Data overview is required: What is available or what would be needed? Instead of renewables in absolute values, have “stacked area graphs” for electricity and heat mix so one can see how the electricity and heat mix change over time Clearer impact graphs of how much is contributed by which measure. Maybe even the option to switch on and off certain measures and see what changes in the result Abatement curves, how much money per ton of CO2 is reduced A tutorial phase in the beginning should be added Data harmonization is needed so a data update will be possible Make clear when a user has finished with a sub‐step ‘Continue to next step’ indications 6.3 Suggested Improvements by the development team The DSE development team identified (at least) these improvements of the tool which could not be implemented during the project itself and need to be considered for future work: • The factor values are not interpolated, yet (i.e. do not change gradually between provided values) • Experiments cannot be deleted through the UI • It should be possible to define more than one filter criterion • Instructions need to be added for hiding carriers in the charts • An Energy balance overview of consumption and potential after selecting an area is needed 7. Deployment Guide 1 Introduction 1.1 Intended audience 2 Glossary Content: Document about the required hardware for running the DSE. 3 Hardware Requirements 4 Software Requirements 4.1 Specification 4.2 Installation 4.3 Data (see attached Word document: DSE Deployment Guide v1.0.docx) Audience: Parties interested in installing the DSE on their own servers. 8. Enabling Context Guide This document is also a supporting document for this deliverable to guide the intended audience through the city context and the enabling measures. It is not part of the official deliverable but is seen by the team as Content: Description of TRANSFORM city contexts and guidance through enabling measures a valuable source of information for cities which are interested in the adoption of WP3 results. The document is still under revision and will be available shortly (before the final project event the latest). Audience: Scientific community