1
Volume
1
ROEHRIG ENGINEERING, INC.
Damper Testing Equipment
2VS / 3VS / 5VS / 10VS / 20VS / 30VS
ROEHRIG ENGINEERING, INC.
Shock Absorber Testing Equipment
User Manual
Roehrig Engineering, INC.
100 Lexington Parkway
Lexington, NC 27292
Phone 336-956-3800 • Fax 336-956-3870
ii
Table of Contents
1. IDENTIFICATION AND MACHINE DESCRIPTION .......................................... 1
1.1 Dynamometer Identification ...................................................................................... 1
1.2 Manufacturer Identification ...................................................................................... 1
1.3 Normal Operation and Usage .................................................................................... 1
1.4 Incorrect Operation and Usage ................................................................................. 2
1.5 Operator Workstation ................................................................................................ 2
2. TECHNICAL DATA ............................................................................... 3
2.1 Machine Weights and Measurements ....................................................................... 3
2.2 Power Requirements and Hookup ............................................................................ 5
Electronics Hookup: .................................................................................................... 5
Main Motor Hookup: ................................................................................................... 6
2.3 Airborne Noise Emission .......................................................................................... 11
2.4 Other Emissions ........................................................................................................ 11
2.5 Machine Features...................................................................................................... 11
2VS Features: ............................................................................................................ 12
3VS Features: ............................................................................................................ 12
5VS Features: ............................................................................................................ 12
10VS Features: .......................................................................................................... 13
20VS Features: .......................................................................................................... 13
2.6 Accessories ................................................................................................................. 14
3. SAFETY............................................................................................... 16
3.1 Safety Notice.............................................................................................................. 16
3.2 Emergency Stop Operation ...................................................................................... 18
3.3 CE Cage / Door Interlock Operation ...................................................................... 18
3.4. Personal Protective Equipment .............................................................................. 19
3.5. Product Specific Warnings ..................................................................................... 19
3.6. Machine Danger Zones............................................................................................ 20
3.7. Other Risks ............................................................................................................... 20
3.8. In Case Of Emergency ............................................................................................. 20
4. DYNAMOMETER FUNCTIONALITY .................................................. 21
4.1 Overview of Dyno Functions .................................................................................... 21
4.2 WHAT IS A SHOCK DYNAMOMETER .............................................................. 21
How It Works ............................................................................................................ 23
Data from an Entire Cycle ......................................................................................... 26
4.2. Overview of Dyno Operation .................................................................................. 28
4.3. Running a Test ......................................................................................................... 28
4.4. Swapping Shocks ..................................................................................................... 32
4.5. Changing Stroke ...................................................................................................... 34
To change stroke: ...................................................................................................... 34
5. COMMISSIONING THE DYNO ........................................................... 35
5.1 Anchoring the Dyno .................................................................................................. 35
5.2. Software Installation ............................................................................................... 36
5.3 Dyno Assembly .......................................................................................................... 37
5.4. Initial Operation ...................................................................................................... 41
6. OPERATING THE DYNO .................................................................... 43
6.1 Becoming Familiar with the dyno ........................................................................... 43
6.2. Getting Started ......................................................................................................... 45
6.3 The Software (Shock6) ............................................................................................. 46
6.3.1 File .................................................................................................................... 47
6.3.2 Edit ................................................................................................................... 52
6.3.3. Graph ............................................................................................................... 63
6.3.4. Test .................................................................................................................. 69
6.3.5. Hardware ......................................................................................................... 80
6.3.6. View ................................................................................................................ 81
6.3.7. Settings ............................................................................................................ 82
6.3.8. Window ........................................................................................................... 83
6.3.9. Help ................................................................................................................. 83
6.4. Creating and Running Tests ................................................................................... 84
6.5. Viewing and Analyzing the Data ............................................................................ 85
Chapter ............................................................................................................................ 89
7. MAINTENANCE PROCEDURE .......................................................... 90
As Needed ........................................................................................................................ 90
Every TWO Months ....................................................................................................... 90
Yearly Maintenance........................................................................................................ 91
8. APPENDIX .......................................................................................... 92
8.1 USB to Serial Adapters ............................................................................................ 92
8.2 Glossary ..................................................................................................................... 93
8.3 Shock 6.0 Math Syntax ............................................................................................. 94
Functions ................................................................................................................... 94
Expression ....................................................................................................................... 95
Description ...................................................................................................................... 95
9. ADDITIONAL DOCUMENTATION .................................................... 101
10. WARRANTY AND SERVICE .......................................................... 102
10.1 Warranty .......................................................................................................... 102
10.2 Technical Support ............................................................................................ 102
10.3 SERVICE POLICY ......................................................................................... 104
Purchase Conditions ................................................................................................ 107
1.0 Payment of Purchase Price ......................................................................... 107
2.0 Delivery and Transportation ....................................................................... 107
3.0 Installation and Operator Training ............................................................. 107
4.0 Warranties and Limitation of Liability ....................................................... 108
5.0 Design Changes ......................................................................................... 109
6.0 Non-Disclosure .......................................................................................... 109
7.0 Entire Agreement / Governing Law / Misc. / Guarantee ........................... 109
8.0 Definitions ................................................................................................. 110
9.0 Software License Agreement ..................................................................... 110
R O E H R I G
E N G I N E E R I N G ,
I N C .
Chapter
1
1. Identification and Machine Description
1.1 Dynamometer Identification
This manual will cover the following Roehrig Crank Dynamometers
2VS – 2HP Crank Dynamometer
3VS – 3HP Crank Dynamometer
5VS – 5HP Crank Dynamometer
10VS – 10HP Crank Dynamometer
20VS – 20HP Crank Dynamometer
30VS – 30HP Crank Dynamometer
1.2 Manufacturer Identification
Roehrig Engineering Inc.
100 Lexington Parkway
Lexington, NC 27295
Phone: +1 336 956-3800
Fax: +1 336 956-3870
1.3 Normal Operation and Usage
The 2, 3, 5VS and the 10, 20, 30VS damper dynamometers are intended for the
sinusoidal testing of linear dampers. Any linear damper which is properly installed with
the correct fixture may be tested by a trained operator. These units are designed for
continuous usage.
1
1.4 Incorrect Operation and Usage
The 2, 3, 5VS and the 10, 20, 30VS damper dynamometers should never be used to
test anything other than a linear damper. The damper must be properly installed using
the correct fixtures. Only trained operators can correctly and safely use these
machines. The dynamometer should only be used if correctly set up and installed by a
professional. The machine may not be run if any safeguards have removed, damaged,
or tampered with.
1.5 Operator Workstation
There is no specified or defined operator workstation, however, it is recommended
that an operator be present at all times while the machine is running and in reach of
the emergency shut off switch.
2
Chapter
2
2. Technical Data
2.1 Machine Weights and Measurements
2VS Weight – 245lbs (111kg)
3VS Weight – 285lbs (129kg)
5VS Weight – 308lbs (140kg)
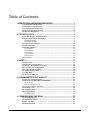
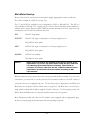
Figure 1: 2VS Dimensioned Drawing
3
Figure 2: 3VS and 5VS Dimensioned Drawing
4
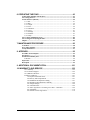
10VS Weight – 650lbs (295kg)
20VS Weight – 710lbs (322kg)
Figure 3: 10VS and 20VS Dimensioned Drawing
2.2 Power Requirements and Hookup
The 2, 3, and 5VS require two power hookups, one powers the electronics, and the other
powers the motor. Make sure that both connections are properly made before using the dyno!
Electronics Hookup:
The electronics power supply is available in three configurations.
2/3/5/10/20/30VS: Internal Wiring with no wall plug
110V Wall Plug
220V Wall Plug
An appropriate surge-protected power strip is recommended!
5
Main Motor Hookup:
Motor horse power is rated based on three phase supply; single phase results in reduction.
The 2VS is available in a 220VAC version only.
The 3 5 and 10VS are available in two configurations, 220V or 380/440VAC. The 20VS is
only available in 380/440 VAC. Supply power is a choice that is determined when machine is
ordered; main voltage changes require a different inverter internal to the unit. Step down/up
transformers can be used in conjunction with unit.
2VS:
220VAC single phase
3VS/5VS:
220VAC US: single or three phase / Europe: single phase or
380/440VAC three phase
10VS:
220VAC US: single or three phase / Europe: single phase or
380/440VAC three phase
20/30VS:
220VAC not available
380/440VAC three phase
Caution
Please review the Yellow Tag attached to the dyno for specific power
requirements. If you have any doubts about wiring the dyno, STOP and
call a Roehrig representative before continuing. Dynos made for
customers in countries other than the U.S. could have different power
requirements and should not be wired without consulting an REI
representative.
REI recommends using a power box with a fuse-protected breaker installed. For your own
convenience, you may want to use the power box in conjunction with an “On/Off” switch, if
your power box is not equipped with one. To wire the power in single-phase, the White and
Black wires are for power and the Green wire is for ground. The Red wire is not used for a
single-phase hookup and should be capped off with a wire-nut. For three-phase power, the
White, Red, and Black wires are for power and the Green wire is for ground.
Most European models and other non-US models come equipped with an appropriate plug.
In this case, simply plug the dynamometer into the matching receptacle.
6
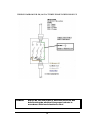
WIRING DIAGRAM FOR SINGLE PHASE POWER HOOK-UP
FOR COUNTRIES WHERE 220V IS MADE USING TWO “HOT” LEGS
DANGER
Always be sure the power is disconnected to the box
before wiring the machine! Use proper lockouts in
accordance with local electrical codes!
7
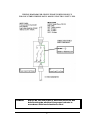
WIRING DIAGRAM FOR SINGLE PHASE POWER HOOK-UP
FOR COUNTRIES WHERE 220V IS MADE USING ONE “HOT” LEG AND A
NEUTRAL
INPUT POWER:
SINGLE PHASE, 200-240 VOLTS, 50/60 Hz
2VS – 10 Amp Service Needed
3VS – 10 Amp Service Needed
5VS – 20 Amp Service Needed
METALLIC SHIELDED CONDUIT
GROUND
GENERAL DUTY FUSIBLE SAFETY SWITCH
GREEN WIRE – GROUND
“HOT” WIRE – BLACK
NEUTRAL WIRE – WHITE
RED WIRE
CAP WITH WIRE NUT
½” LIQUID-TIGHT CONDUIT CONNECTOR
LIQUID-TIGHT FLEXIBLE SHIELDED CONDUIT
FROM DYNAMOMETER
DANGER
Always be sure the power is disconnected to the box
before wiring the machine! Use proper lockouts in
accordance with local electrical codes!
8
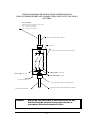
WIRING DIAGRAM FOR 200-240 VAC THREE PHASE POWER HOOK-UP
NOTE: In non-US countries, where three phase power includes a ground and a neutral, the neutral
is not used.
DANGER
Always be sure the power is disconnected to the box
before wiring the machine! Use proper lockouts in
accordance with local electrical codes!
9
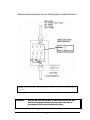
WIRING DIAGRAM FOR 380/440 VAC THREE PHASE POWER HOOK-UP
DANGER
Always be sure the power is disconnected to the box
before wiring the machine! Use proper lockouts in
accordance with local electrical codes!
10
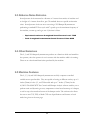
2.3 Airborne Noise Emission
Sound pressure levels measured at a distance of 1 meter from surface of machine and
at a height of 1.6 meters from floor, per CE standard where no specific workstation
exists. Sound pressure levels are worst case using a 5VS Damper Dynamometer
performing a standard PVP test cycle with 7 speeds up to the maximum frequency of
the machine, a warm up, and a gas test. Cycle time is 90sec.
-
Equivalent Continuous A-weighted Sound Pressure Level: 72dB
-
Peak C-weighted instantaneous Sound Pressure Value: 86dB
2.4 Other Emissions
The 2, 3, and 5VS damper dynamometers produce no vibrations which are harmful to
the operator, since the operator is not in contact with the machine while it is running.
There are no other harmful emissions produced by the machine.
2.5 Machine Features
The 2, 3, 5, 10, and 20VS damper dynamometers are fully computer controlled
variable motor speed models. They are capable of testing at different strokes, up to 2
inches (50mm) for the 2, 3, and 5VS models and up to 7 inches (175mm) for the
10/20VS. The SHOCK™ Test Control and Damper Analysis software enables you to
perform static and dynamic gas tests, temperature or time based warm up of a damper,
as well as stop at bottom dead center of the damper stroke. The software also allows
the user to run CVP, PVP, or Multi CVP tests. Specifications and features of each
model are given on the next page.
11
2VS Features:
• 2 Hp Motor, 220V
• Zero Lash Belt Drive
• Precision scotch yoke / wear plate system
• 2 Standard English Strokes: 1.00” and 2.00”
• Standard 48” Steel Columns (28” / 700mm eye to eye test area)
• +/- 2000 lbs. S-Beam Load Cell
• 16 bit resolution USB Data Acquisition standard
• Full Computer Control with SHOCK™ Software
3VS Features:
• 3 Hp Motor, 220V or 380/440V
• Zero Lash Belt Drive
• Precision scotch yoke / wear plate system
• 4 Standard English Strokes: 0.50”, 1.00”, 1.50”, 2.00” or
• 4 Standard Metric Strokes: 15mm, 25mm, 40mm, 50mm
• Non-contact Infra Red style Temperature Transducer
• 48” Bright Nickel columns (28” / 700 mm eye to eye test area)
• +/- 5000 lbs. Pancake Load Cell
• 8 Channel Instrumentation and Signal Conditioning System
• 16 bit resolution USB Data Acquisition standard
• Full Computer Control with SHOCK™ Software
5VS Features:
• 5 Hp Motor, 220V or 380/440V
• Zero Lash Belt Drive
• Precision scotch yoke / wear plate system
• 4 Standard English Strokes: 0.50”, 1.00”, 1.50”, 2.00” or
• 4 Standard Metric Strokes: 15mm, 25mm, 40mm, 50mm
• Non-contact Infra Red style Temperature Transducer
• 48” Bright Nickel columns (28” / 700 mm eye to eye test area)
• +/- 5000 lbs. Pancake Load Cell
• 8 Channel Instrumentation and Signal Conditioning System
• 16 bit resolution USB Data Acquisition standard
• Full Computer Control with SHOCK™ Software
12
10VS Features:
• 10 Hp Motor, 220V or 380/440V
• Zero Lash Belt Drive
• Precision scotch yoke / wear plate system
• 6 Standard English Strokes: 0.75”, 1.0”, 1.5”, 2.0”, 3.0” and 3.90” or
• 6 Standard Metric Strokes: 15mm, 25mm, 40mm, 50mm, 75mm, 100mm
• Non-contact Infra Red style Temperature Transducer
• 48” Bright Nickel columns (28” / 700 mm eye to eye test area)
• +/- 5000 lbs. Pancake Load Cell
• 8 Channel Instrumentation and Signal Conditioning System
• 16 bit resolution USB Data Acquisition standard
• Full Computer Control with SHOCK™ Software
20VS Features:
• 20 Hp Motor, 380/440V
• Zero Lash Belt Drive
• Precision scotch yoke / wear plate system
• 7 Standard English Strokes: 0.75”, 1.0”, 1.5”, 2.0”, 3.0” and 3.90” and 6.0” or
• 7 Standard Metric Strokes: 15mm, 25mm, 40mm, 50mm, 75mm, 100mm and
150mm
• Non-contact Infra Red style Temperature Transducer
• 48” Bright Nickel columns (28” / 700 mm eye to eye test area)
• +/- 5000 lbs. Pancake Load Cell
• 8 Channel Instrumentation and Signal Conditioning System
• 16 bit resolution USB Data Acquisition standard
• Full Computer Control with SHOCK™ Software
13
2.6 Accessories
Roehrig Engineering provides a full line of accessories for your 2, 3, 5 and 10/20VS
Dyno. Please see the list below.
•
•
•
•
•
•
•
•
•
•
•
•
•
•
•
•
IR Temperature Sensor (Standard on 3, 5 10/20VS)
Various Load Cell Configurations Including:
o 500lb
o 1000lb
o 2000lb
o 5000lb
Nickel Plated Columns (Standard on 3VS – 20VS)
Longer Length Columns
Pressure Sensor Harness w/Sensors
USB to serial Adapter
Add on Spring Rater
16 Channel Instrumentation Capability
Quick Open Front Cover
Various Clevis Sets Including:
o Standard Quick Release In ½”, 5/16” and ¼”
o Universal Clevis
o C-clamp Clevis In Any Size
o Motorcycle Fork Fixtures
o Bicycle Tube Fixture
o Custom Clevis
Lista Brand Single or Double Drawer Roller Cabinets
Movement Assisted Crossbar
Ball Screw Actuated Crossbar
Self Clamping Crossbar
Protective Cage Enclosure
CE Cage with power shut off
14
15
Chapter
3
3. Safety
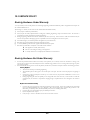
3.1 Safety Notice
THE TEST EQUIPMENT DESCRIBED AND WRITTEN ABOUT WITHIN
THIS MANUAL MUST BE OPERATED USING PROCEDURES THAT
PROVIDE THE MAXIMUM LEVELS OF SAFETY TO PERSONNEL AND TO
THE EQUIPMENT ITSELF.
All local and National Safety Standards, together with company-specific safety
procedures MUST be observed at all times. It is essential that a detailed study of the
information contained within this manual is made before operating the test equipment.
The following guidelines are laid down as MINIMUM recommendations.
Ensure that safety interlocks are fully functional at all times.
Only operate the test equipment after ensuring that no personnel are present in any
areas that may be regarded as potentially hazardous. This includes the area around the
test equipment and its component parts.
All potential work area hazards must be properly guarded and all guards correctly
closed BEFORE the test equipment is operated.
Only trained personnel should operate the test equipment or be allowed to conduct
tests using this equipment. The operators MUST be fully conversant with the Safety
Considerations, Technical Descriptions and Operating Instructions contained within
this manual, before operating the test system.
16
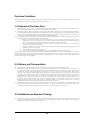
Always ensure that the test equipment is operated within its design limitations.
The test equipment should only be operated when regular maintenance schedules have
been carried out and when it is known that the test equipment is in good working
order.
If the test equipment is producing unusual or excessive noise and/or vibration, stop
the operation of the test equipment until such a time as the systems have been
checked for possible faults.
Maintenance procedures must only be carried out AFTER ensuring that all pneumatic
and electrical power has been dissipated and that the electrical power has been
disconnected from the main supply.
17
3.2 Emergency Stop Operation
All Roehrig damper dynamometers described in this manual are outfitted with an
emergency stop button. The emergency stop button is a large red button located in
plain sight on the front of the machine, and labeled as such. To shut the machine
down using the emergency stop button, simply push the button. To release the
emergency stop button, twist it in the direction indicated on the button. The machine
will not automatically restart when the emergency button is released. The power to the
machine must be shut off for one minute in order to reset the machine.
NOTICE
In case of any emergency, push the emergency stop button!
3.3 CE Cage / Door Interlock Operation
CE compliant dynamometers are outfitted with a protective cage and door interlock
system. The type of cage, door interlock, and relay system used can vary depending on
customer requirements. Supplemental literature is provided for CE dynamometers
describing in detail the functionality of that machines’ specific cage and interlock
system.
18
3.4. Personal Protective Equipment
Operators should always wear required safety gear for the environment in which they are in.
When operating or working near the dynamometer, personnel must always be wearing safety
glasses. No loose fitting clothing should be worn, and long hair should be tied back.
3.5. Product Specific Warnings
Warning
Safety glasses must be worn at all times when operating
or working near the damper dynamometer!
Warning
Always ensure that all guards and shields are properly
installed before operating the machine!
Warning
Always disconnect power before removing front cover
when changing the stroke on the crank!
Warning
Only trained operators are permitted to use the damper
dynamometer!
Caution
Always be sure that the dynamometer is at bottom dead center before
installing the damper. Also be sure that the damper has sufficient travel
for the stroke which the dynamometer is set at.
Caution
Always be sure that the damper is installed securely using proper
fixtures, and that the crossbar is properly tightened before running a
test.
19
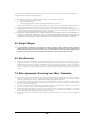
3.6. Machine Danger Zones
There are three danger zones on the damper dynamometer: the drive belt zone in the
back of the machine which is guarded by the rear cover; the scotch yoke mechanism in
the front which is guarded by the front cover; and the testing are between the crossbar
and the actuator shaft which is guarded only on CE machines equipped with a cage.
3.7. Other Risks
The operator should be aware that dampers convert mechanical energy into heat, and
therefore the damper being tested may get very hot. Always use caution when handling
a damper which has been tested. Also, there is the possibility of a damper failure,
which can cause hot oil to be sprayed from the damper itself.
Warning
Dampers may be Extremely Hot after testing. Always
handle tested dampers with caution.
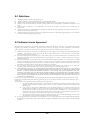
3.8. In Case Of Emergency
In case of emergency, press the emergency stop button and immediately call for help.
20
Chapter
4
4. Dynamometer Functionality
4.1 Overview of Dyno Functions
The 2, 3, 5 and 10, 20, 30VS dynamometers are capable of carrying out standard PVP
(Peak Velocity Plot) or CVP (Continuous Velocity Plot) tests on almost any type of
linear damper. The dyno is also capable of running a warm-up cycle on the damper,
and can measure both gas force and friction force.
The technical paper below
describes in more detail the fundamentals of damper dynamometers and their
function.
4.2 WHAT IS A SHOCK DYNAMOMETER
Dampers produce a force proportional to the speed of shaft movement. If you compress a
damper slowly, it generates less resistant force than if you move it faster. As mentioned
before, a damper on a race car does several very important things including providing a
tunable “feel” for the driver during cornering, controlling wheel travel over road irregularities,
and most important for a ground-effects car, stabilizing the under wing of the car at optimum
ride height and rake.
Since dampers are a critical component of a race car, they should be tested periodically to
make sure they are working correctly. Also, when a race engineer finds a damper set-up that
makes the car faster under certain conditions at a certain racetrack, that engineer will want to
have dampers set up the same way the next time the car runs on that or a similar track. As
21
with any critical component, the race engineer would like to know more about how it works.
The shock dyno is a tool used to test dampers and learn about their behavior.
The force vs. shaft speed graphs you see in this article come from data generated by testing a
damper in what is generally known as a damper dynamometer or shock dyno. This is a
machine that compresses and extends a damper at known speeds and measure the forces
produced by the damper.
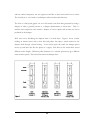
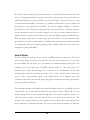
We’ll start out by describing the simplest form of a shock dyno. Figure 1 shows a frame
holding an electric motor with a drive belt and pulleys that spins a crank attached to the
damper shaft through a linear bearing. As the motor spins the crank, the damper piston
moves up and down just like the piston in a engine. Bolt holes in the crank allow several
different stroke lengths. Different pulley diameters or a variable speed motor give different
crank rotation speeds. The load cell measures the damper force.
22
We all know that the speed of a piston connected to a crank varies continuously as the crank
rotates. You might remember from high school math or physics that this type of motion is
called sinusoidal because it varies with the sine of the crank angle. The piston comes to a stop
at bottom dead center (BDC), accelerates to a maximum speed halfway up the cylinder, and
slows down to a stop again at the top (TDC). If you have a damper attached to a crank, its
piston does the same, and the force generated also varies continuously. We know, however,
that the maximum speed of the piston happens only once per stroke, when the piston is
halfway between top and bottom, and that’s also when the damper generates maximum force.
With our simple shock dyno we could change the crank stroke to vary the maximum shaft
speed and/or we could use drive pulleys of different sizes. However both of these methods
are cumbersome and time consuming during testing. Variable speed AC motors allow easy
manipulation of the crank RPM.
How It Works
You put a damper in the dyno, choose a stroke and RPM, and turn on the motor. The crank
turns and the damper shaft moves up and down until you turn off the motor. If you know
the crank RPM, and the stroke, you can calculate the maximum damper shaft speed. For
example, let’s say the crank turns 100 RPM, and the stroke is 1 inch. 100 rpm is 1.67
revolutions per second and the length of 1 revolution is the circumference of the circle
traveled by the crank bolt or Pi times the stroke. 1.67 x 3.14 x 1 inches is about 5 inches per
second.
This is the maximum speed of the damper piston, and it happens twice each
revolution of the crank, once with the piston going up in compression and once again with the
piston going down in rebound.
If we keep this example really simple and connect the damper directly to a weighing scale with
a circular dial, we can stand there and read the scale pointer directly. What we’ll see is the
pointer cycling from 0 to some maximum bump force as the shock compresses, returns to 0,
and then peaks out again at the max rebound force as the piston comes back down. The
needle on our scale goes from plus some number to minus some number as the damper cycles
from compression to rebound and back. We can just write down the numbers at which the
23
needle peaks as it goes back and forth. A commercially available shock dyno uses a computer
to read the load cell and store the data.
Some dampers are set up to give more force in rebound than compression so, as our simple
machine cranks away; we might see the scale peak at 190 pounds in compression and 250
pounds in rebound. So we know that, at a shaft speed of 5 inches per second, the damper
produces 190 pounds in compression (or bump) and 250 pounds in rebound. We’d like
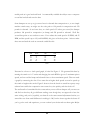
several data points so we can draw a curve. If we reduce the crank speed to 50 RPM, and 25
RPM, and also speed it up to 150, and 200 RPM, this gives us five data points. After we make
these runs and read the scale we can make a table like this:
CRANK MAX SPEED
RPM
IN/SEC
25
1.3
50
2.6
100
5.2
150
7.8
200
10.4
BUMP FORCE
LBS
75
170
190
220
250
REBOUND FORCE
LBS
50
150
250
350
470
Chart 1
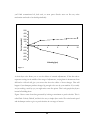
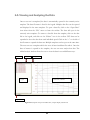
Presented as a force vs. shaft speed graph, it looks like Figure 2. We generated this data by
running the crank at a 1.0” stroke and changing the crank RPM to give us 5 maximum piston
speeds, and we read the bump and rebound forces at those maximum speeds. Then we made
a graph by connecting the dots. If we want data at higher shaft speeds we need to speed up
the crank or lengthen the stroke. Figure 2 shows us that the shock we tested has a pretty steep
rebound curve while the compression curve starts low, rises quickly, and then levels off.
The real benefit of a machine like this comes when you test all four dampers off your race car
and find out that they all give different readings even though they are supposed to have the
same valving, and you’ve, hopefully, set them all to the same external adjustments before you
started the test. Some small difference in readings is OK, but the closer together the better. If
you’ve got the tools and experience, you can overhaul your shocks and test them again. Maybe
24
you’ll find contaminated oil, bad seals, or worn parts. Shocks wear out like any other
mechanism and need to be rebuilt periodically.
500
400
Force (pounds)
300
200
100
0
-100 0
2
4
6
8
10
-200
-300
-400
-500
Velocity (ips)
Figure 2
A shock dyno also allows you to see the effects of external adjustments. If the data above
represents settings in the middle of the range of adjustments, varying them in increments from
full-hard to full-soft will give you curves that show the effect of those changes. That will
happen if your dampers produce changes big enough to be seen by your machine. If you really
are just reading a scale by eye you might miss some fine points. That’s why people buy dynos
instead of building them
Figure 2 above came from data generated by looking at maximum or peak velocities. This is
called Peak Velocity Pickoff, and that’s the way a simple dyno works. We varied crank speed
and the damper stroke to give us peak velocities in our range of interest.
25
Data from an Entire Cycle
You can get more data from a damper by taking data over a complete cycle of compression
and rebound and graphing that. This is called a Continuous Velocity Plot, and there are
commercially available damper dynamometers that do this. Figure 1 has notations around the
crank for Bottom Dead Center (BDC, 0 deg.), Top Dead Center (TDC, 180 deg.), and 90/270
degrees. When the crank pin is at BDC the damper is fully extended. As the crank rotates
clockwise it’s compressing the shock in the bump direction so that the damper piston
accelerates from a stop to maximum speed at 90 degrees and then slows to a stop again at
TDC. Rotation continues and the piston accelerates in rebound direction to maximum speed
at 270 degrees and slows to a stop again at BDC.
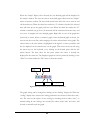
Figure 3 shows force data taken continuously during one revolution of the crank. Shaft speed
in the down direction is positive and compression force is positive. The bottom part of the
curve shows shaft speed and negative force increasing as the crank goes from TDC (180 deg.)
to 270 degrees and then decreasing as the curve goes back toward zero speed and force at
BDC (0 deg.). As rotation continues, speed goes negative (compression) and force increases to
a maximum at 90 degrees and back to 0 at TDC (180 deg.). The speed and force data taken to
produce a graph like this comes from a velocity sensor and a strain-gauge load cell. A data
acquisition system in a personal computer reads these sensors 1,000 times a cycle or more.
Software processes the data and displays it in this form.
This can be confusing and you might have to look at this sketch and the graph a while before
it becomes clear. The important point is the force increases with piston speed. On the lower
section of the curve the piston is accelerating where the curve is headed down and slowing
down as the curve swings back up. It’s the same on the top part. The piston speed and
damping force increase to a maximum and then slow again. This is a lot more data than we
had when we just changed crank RPM and looked at the damper force at maximum piston
speed. So why doesn’t the damper develop the same force when it’s slowing down as it did
when it speeded up? I’m not certain, myself, but remember you’ve got a bunch of oil moving
through the washer stacks and bypass paths, and it has some mass and momentum. Those
washer valves do not necessarily close the same way they open. Also, the fact that the damper
26
piston is always accelerating, slowing down or speeding up, may have something to do with
the shape of this curve.
27
4.2. Overview of Dyno Operation
Operation of the damper dynamometer is very straight forward. The first step is to
power up the dyno and computer system. From the computer, start the Roehrig Shock
software (ensure that the software key is installed on the computer). Install the correct
set of clevises for the shock which is being tested.
1. Hang the shock from the top clevis, making sure that the crossbar is high
enough so that the shock hangs freely above the bottom clevis. Open the test
screen in the software, and zero the load cell.
2.
Once the load cell is zeroed, the shock can be fully installed. Before installing
the shock, ensure that the dyno is at bottom dead center (the actuator shaft is
at its lowest position). Lower the cross bar and fix the shock ends to the upper
and lower clevis. Lower the crossbar in order to compress the shock to the
desired position (Pre-load). Tighten the crossbar.
3. Ensure that the shock has sufficient travel for the given stroke setting on the
dyno. Select the desired test from the test screen and start the test. Once the
test is complete, save the data and remove the shock.
Caution
Always be sure that the dynamometer is at bottom dead center before
installing the damper. Also be sure that the damper has sufficient travel
for the stroke which the dynamometer is set at.
4.3. Running a Test
Once the shock is correctly installed, a test may be selected and run. Select a test from
the list given in the test screen, or you may create your own.
Step by step running a test.
28
1. When you are ready to collect data, click on Test in the pull down menu and then click
Perform test. This will bring up the Perform Test window
2. Select your test profile and click edit if you wish to make any changes.
3. At this time be sure the dyno is at bottom dead center.
4. Hang the shock damper from the upper clevis so that it is not touching lower clevis.
5. Click the "Zero Load Cell" button to zero the load cell and take the weight of the shock
out of the data. You can verify the results by looking at the live force reading.
6. Lower the cross bar and connect the damper to lower clevis.
7. Pull cross bar down a minimum of ¼ inch to pre-load damper and tighten clamps, this
is done to prevent the damper from bottoming out in extension.
8. Tighten the clevis handles by turning clockwise until brass button in clevis seats against
shock eye. This is done to remove any free play in the damper ends.
9. The program, by default, is set to do an automatic gas test to measure and record the gas
force in the shock. If you have changed this setting to do a manual gas test, click "Gas
Test" record the gas force.
10. Connect the temperature sensor to the damper body. Skip this step if you have a noncontact (IR) temperature sensor.
11. Click "Start Test" to begin the test.
12. The File Properties window will now appear. Enter data and valving information that
you want to save with your data. The constants tab allows you to enter constants related to
this damper. This is useful if you are using any math signals (This properties page may
appear at the end of the test, or not at all. This is set in the Test tab of the Preferences
window.)
29
13. Click OK on the File Properties window to continue. The Dyno Starting warning
prompt will appear.
14. Click OK. The dyno will now start to run. If you have selected to perform a warm-up,
it will do that first. It will then run any gas test or seal drag tests that are required. It will
then begin running the test(s). Use the "Skip Step" button to cancel out of the warm-up or
the gas test and proceed to the next step. Use the "Abort" button to cancel the test
completely.
30
15. Depending on the test you have selected, the dyno may run one speed or several
speeds. It may perform additional warm-ups and gas tests. This is all dependant on your
settings for the test. If you have selected to pause between runs, the following window will
appear. Once you are ready to proceed with the testing click "Continue".
31
16. After the test is complete the Save As window will appear, name the file and click
"Save" to save to the hard drive.
Warning
Never try to install or swap a shock while the dynamometer is
running!
The program will display the graph of the last collected data file automatically after a test
has been run and a name given to the file. File names are displayed on the left side of the
main screen.
4.4. Swapping Shocks
Shocks may be swapped on the dyno only when a test cycle is not being run. First,
remove the shock which is currently installed by raising the crossbar to remove any
pre-load in the shock. Tighten the crossbar. Next, remove the shock from the clevises.
Install the correct set of clevises for the new shock which is going to be tested. Hang
32
the shock from the top clevis, making sure that the crossbar is high enough so that the
shock hangs freely above the bottom clevis. Open the test screen in the software, and
zero the load cell. Once the load cell is zeroed, the shock can be fully installed. Before
installing the shock, ensure that the dyno is at bottom dead center (the actuator shaft
is at its lowest position). Lower the cross bar and fix the shock ends to the upper and
lower clevis. Lower the crossbar in order to compress the shock to the desired
position (Pre-load). Tighten the crossbar. Ensure that the shock has sufficient travel
for the given stroke setting on the dyno.
33
4.5. Changing Stroke
To change stroke:
1) Depress the Red Emergency Stop button on the top of the dyno. Once depressed
you will have 4 seconds to loosen the crank bolt.
2) During the 4 second braking period, use a 1-inch socket to remove the crank bolt.
3) Re-set the Emergency Stop button and turn the power off.
4) Remove the square bearing from the crank and replace the bearing in hole with
the desired stroke.
5) Tighten the square bearing until it comes in contact with the crank.
6) Turn the power on.
7) Press the Emergency Stop button and tighten the crank bolt during the 4 second
braking period. Torque crank bolt to 70 ft lbs.
8) Re-set the Emergency Stop button, unplug the machine and wait 30-seconds, plug
the machine back into power. This will re-set the Emergency Stop error.
9) In the software program, go to Hardware / Motor / Yes at the warning. Click
Measure Stroke and allow the software to calculate the new stroke. If the number
matches your desired stroke, begin testing.
For some 10/20VS models, the E-stop will not provide the necessary braking. In this
case, use a physical stop between the yoke and the center actuator shaft block. The
physical stop can be an aluminum bar that will stop the movement of the yoke.
34
Chapter
5
5. Commissioning the Dyno
5.1 Anchoring the Dyno
The 2, 3, 5 and 10, 20, 30VS units require no special anchoring when used at a
stationary facility. Anchoring the dyno is recommended when the dyno is being used
in a ride trailer or other mobile facility. Any type of bracket may be used, as long as it
is attached directly to the dyno’s aluminum frame and is capable of supporting the
loads. Do not attach brackets to either the front or rear cover, or to any moving part
on the dyno. Ensure that the brackets do not interfere with any moving parts on the
dyno.
The 2, 3 and 5VS dynos may be placed on a workbench, cart, or any other type of
stand that can support its weight plus a fluctuating vertical load of +/- 50lbs (+/23kg). The surface on which the dyno is placed must be solid and continuous,
covering the entire bottom of the machine, as there is no lower guard. The dyno may
not be run on its side, unless fitted with special feet and a special lower guard.
The 10/20/30VS units ate designed to sit on a solid floor with the factory installed
isolation feet. Make sure that the floor can support the full weight of the machine +/1,000lbs (46kg).
Warning
The dyno must be placed on a solid continuous surface which
covers the entire base of the machine. The dyno may not be run on
its side unless fitted with special feet and lower guard.
35
5.2. Software Installation
The 2, 3, 5 and 10, 20, 30VS dynos require a PC running Microsoft Windows XP or
win 7. The PC must have a minimum of two USB ports and one serial port. In the
case that the computer has no serial port, a third USB port is required, along with a
USB to serial adapter.
1) To install the Roehrig Shock6 software, first ensure that the USB software key is
NOT inserted.
2) Insert the Roehrig CD provided with the dyno. The software installation wizard
will automatically load. If it does not automatically load, double click on your CD
or DVD drive icon which contains the Roehrig CD under “My Computer”.
Follow the on-screen setup instructions. Do NOT insert the software key until
prompted. Once setup is complete, your system will need to reboot.
3) Once the system is rebooted, locate the *.reg file(s) on the Roehrig CD (Right
click the CD or DVD drive icon which contains the Roehrig CD under “My
Computer” and select “Explore”). The *.reg file(s) will be located under the main
directory on the CD. Double click on the *.reg file(s) to install. You will be
prompted “would you like to add these files to the registry”. Click “Yes”. The
Roehrig software and the calibration for your dyno are now installed.
Note: The *.reg files only need to be installed if the Roehrig software is being installed
for the first time on a particular computer. The *.reg files do not need to be reinstalled
if the software is being updated within Shock6. If upgrading from Shock5 (or older)
to Shock6, new *.reg files will be provided by Roehrig Engineering.
Note: The Roehrig software may be installed on as many computers as desired
allowing users to view and analyze data however, the software key is required in order
to run the dyno.
Figure 5.1: Shock 6 USB Software Key
36
5.3 Dyno Assembly
Step 1a: On the 2, 3 and 5VS, ensure that the columns are fully extended and tightly
clamped. To do this, first remove the front cover on the dyno using a 1/8” allen key.
Ensure that the columns are fully extended upward, i.e. the stop at the bottom of the
column is up against the lower column clamp. If the columns are not fully extended,
unclamp the columns and re-clamp them in the fully extended position. The front
cover may then be re-installed.
Note: Only the bolt on the slit side of the column clamp needs to be loosened using a
1/4” Allen key.
Figure 5.2: Left Column Fully Extended
Figure 5.3: (Slits on Column Clamps)
37
Step 1b: On the 10/20VS, the upper columns will be shipped apart from the machine.
Remove the front cover using a 1/8-inch Allen Key, loosen the side clamping bolts on the
upper column blocks with a 3/16-inch Allen Key (See Number 1 in Figure 6.4). Set the
column in the upper block and tighten until it meets the lower column. Tighten the
column clamping bolts. Re-install the front cover.
Step 1c: On the 10/20VS slide the crossbar assembly on the columns with the handles
facing the operator.
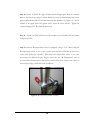
Step 2: Install the IR temperature sensor (if equipped). Using a 3/16” Allen, clamp the
IR temperature sensor to one of the columns such that the red handle can be used to
loosen and tighten the assembly. This allows the temperature sensor to be easily
repositioned for different shocks. Plug the sensor into the “IR Temperature” port on
the electronics board located at the left rear corner of the dyno. Tighten the screws on
the connector using a small flat head screwdriver.
Figure 5.4: IR Temp. Sensor Installed on Column
38
Step 3: Connect the load cell cable. Connect the round screw type connector to the
load cell. Plug the other end of the load cell cable into the “Load Cell” port on the
electronics board. Tighten the screws on the connector using a small flat head
screwdriver.
Figure 5.5: Screw Connector on Load Cell
Step 4: Connect the motor control cable (serial cable) to the computer. If the
computer does not have a serial port, a serial to USB adapter must be used.
Figure 5.6: Motor Control Cable
39
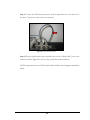
Step 5: Connect the USB cable provided to the data acquisition box at the left rear of
the dyno. Connect the other end to the computer.
Figure 5.7: All Connections Made
Step 6: Plug the cable from the data acquisition box into the “Data Cable” port on the
electronics board. Tighten the screws using a small flat head screwdriver.
NOTE: Setup instructions for 30VS models will be included in the Equipment Installation
Guide
40
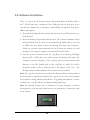
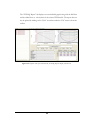
5.4. Initial Operation
Once assembly is complete and the software is installed, the dyno can be operated.
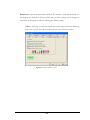
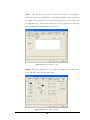
Ensure that the software key is installed. Start the Roehrig Shock program by double
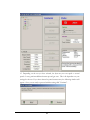
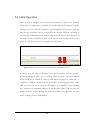
clicking on the icon. Once the software is up and running, the user must verify that
both the motor and data card are recognized by the software. There are two boxes in
the lower right hand corner of the software with the words “motor” and “datacard”. If
the word is shown in a black font, then it is recognized by the software. If the word is
shown in a grey font, then it is not recognized by the software.
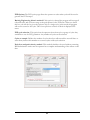
Figure 5.8: Shock6 Lower Right Corner Screen Shot, Motor and Datacard recognized
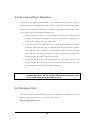
If “motor” is in grey, click on “hardware” in the pull down menu and select “motor”.
A warning will appear. Click “yes” to continue. Click “configure” and ensure that the
correct COM port is selected. If a serial to USB adapter is being used, ensure that it is
assigned to a COM port number less than 8 and that it is always plugged into the same
USB port. Note that not all serial to USB adapters are compatible. Contact Roehrig
for a current list of compatible adapters. If selecting the correct COM port does not
correct the issue, contact Roehrig for technical assistance. See Appendix for more
details on using a serial to USB adapter.
41
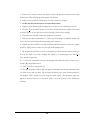
If “datacard” is in grey, click on “hardware” in the pull down menu and select
“datacard”. A warning will appear. Click “yes” to continue. Click “configure”. “Board
0” in the upper left should be selected as the default. Change to “Board 1”. If this
does not correct the issue, contact Roehrig for technical assistance.
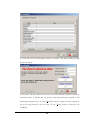
If both “motor” and “datacard” are shown in a black font, click on “hardware” in the
pull down menu and select “motor”. A warning will appear. Click “yes” to continue.
Ensure that there is no shock in the machine, and that the crossbar is raised so that
the actuator shaft cannot come in contact with it when the machine is run. Select
“Measure Stroke”. Once complete, the dyno is ready to run.
Caution
Ensure that there is no shock in the machine, and that the crossbar is
raised so that the actuator shaft cannot come in contact with the load
cell before measuring the stroke.
42
Chapter
6
6. Operating the Dyno
6.1 Becoming Familiar with the dyno
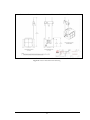
Figure 6.1: 2 /3/5VS (Left) 10 / 20VS (Right)
43
[1]
[2]
[3]
[4]
[5]
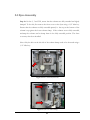
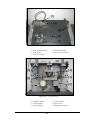
Figure 6.2: Dyno Top View Typical
1 – Data Acquisition Box
3 – Main Power
5 – Motor Controller
2 – Electronics Board
4 – Motor Control Cable
[3]
[1]
[1]
[4]
[2]
[5]
[6]
Figure 3 (Front Cover Removed)
Figure 6.3: 3 / 5VS Damper Dyno
1 – Column Clamps
3 – Actuator Shaft
5 – Square Bearing
2 – Velocity Sensor
4 – Scotch Yoke
6 – Displacement Sensor
44
Figure 6.4: 10 / 20VS Damper Dynamometer
1 – Column Clamps
3 – Actuator Shaft
5 – Square Bearing
2 – Velocity Sensor
4 – Scotch Yoke
6 – Displacement Sensor
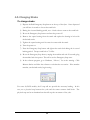
6.2. Getting Started
Once the dyno has been commissioned as described in Section 5, it is now ready for
use. First, power up both the dyno and the computer system. Make sure all
connections to the computer are made. Once the computer has booted, start the
Roehrig Shock program. Load the shock to be tested following the procedure laid out
in Section 4.2. The operator can now create and run a test. The following Section will
describe the functionality of the Roehrig software in greater detail. All operators
should read this manual in its entirety before using the dyno.
45
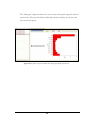
6.3 The Software (Shock6)
The following section will describe the various functions and tasks available within the
Shock6 program. All the functions and tasks can be reached through the drop down
menus at the top of the screen. Some of the more commonly used functions and tasks
can also be found on the toolbar, or can be accessed through hot keys. The toolbar
can be modified using standard windows procedures. The following figure shows the
main program screen.
Drop Down Menus
Legend
Toolbar
Tabbed Analysis Window
Figure 6.3: Shock6 Main Screen
NOTE: Data files saved in Shock96 or Shock5 can be opened and viewed with
Shock6.
46
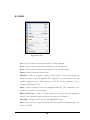
6.3.1 File
Figure 6.4 File Menu
New Template – Creates a new template. Templates allow the user to open, analyze,
and save single or multiple data files in one place. The Legend and Tabbed Analysis
Window make up a template. Multiple templates can be opened at the same time.
Open Template – Opens a previously saved template.
Save Template – Saves the current template.
Save Template As – Saves the current template as a new template with a unique file
name.
Open Data – Opens a previously saved data file and places it in the current template.
A data file is created and saved after running a test. A data file contains all the data for
a single test only.
Open XML Datafile – Opens a previously saved .xml data file.
47
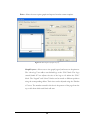
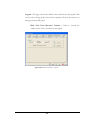
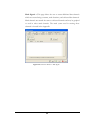
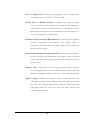
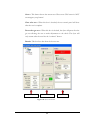
Print – Allows the user to print graphs and reports from the current template.
Figure 6.5: Print Options (Graph Layout)
Graph Layout – Allows user to size graph, legend, and notes on the printout.
The “show logo” box adds a user defined logo to the “Title” block. The “logo
stretch/shrink fit” box adjusts the size of the logo to fit within the “Title”
block. The “Legend” and “Notes” blocks can be moved to different positions
using the corresponding sliders. Their sizes can be adjusted using the “Divider
at” boxes. The number entered in this box is the percent of the page from the
top or left from which each block will start.
48
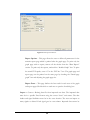
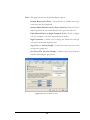
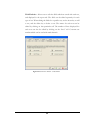
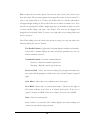
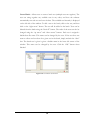
Figure 6.6: Print Options Window
Report Options – This page allows the user to define all parameters for the
numeric report page which is printed after the graph page. To print only the
graph page with no report, remove all the checks from the “Data Report”
section. To print only the reports, uncheck the “Include Graph” box. To print
the actual PVP speeds, enter “0” in the “PVP inc.” box. The graph page and
report page can be printed on the same page by checking the “Partial page
graph” box and adjusting the graph page size.
Report Fonts – This page defines the font used for each area of the graph
and report pages. Double click on each area to open the font dialog box.
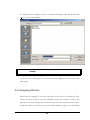
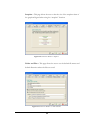
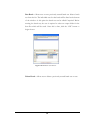
Import – Creates a Roehrig data file from imported user data. The imported data
must be in a specific Excel format using the correct “short” unit names. The data
header and signal definition must be in the exact location. The user can import as
many signals as desired. Each signal gets its own column. Imported data cannot be
49
used for average graphs or data. Always turn off all smoothing when viewing imported
data.
Description
Import Test
Notes
All smoothing must be off!
Displacement
Force
Velocity
In
lbs
In/sec
0
-500
-12
0
-500
-5
0
-300
-3
0
-100
-1
0
0
0
0
29
1
0
42
3
0
69
5
0
108
12
Figure 6.7: Correct Format for Data Import
“Short” unit names for SHOCK6 import
In
m
cm
mm
In/Sec
m/Sec
cm/Sec
mm/Sec
Lbs
N
KGF
F
C
RPM
Hz
Ft
Mi
Km
Sec
Min
Hr
Ft/Sec
MPH
KPH
G
Ft/sec^2
m/sec^2
In*Lbs
Ft*Lbs
N*m
PSI
inches
meters
centimeters
millimeters
inches per second
meters per second
centimeters per second
millimeters per second
pounds
newtons
kilograms force
Fahrenheit
Celsius
revolutions per minute
hertz
feet
mile
kilometer
second
minutes
hours
feet per second
miles per hour
kilometers per hour
grams
feet per second squared
meters per second squared
inch pounds
foot pounds
newton meters
pounds per square inch
50
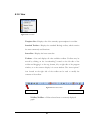
Export – Export is used to export the highlighted data file displayed in the current
template. Data files can be exported as an XML or CSV (comma separated value) file.
Export selected traces will export only the channels displayed on the current graph.
Both options will also export all field data. Raw data may also be exported by using
copy and paste from the signal vs. time graph.
Exit – Used to exit the Roehrig Shock6 program.
51
6.3.2 Edit
Figure 6.8: Edit Menu
Cut – Used to cut the selected item and place it on the clipboard.
Copy – Used to copy the selected item and place it on the clipboard.
Paste – Used to paste the item on the clipboard to the selected location.
Delete – Used to delete the selected item.
Snapshot – Takes a “snapshot” (similar to print screen) of the current graph and
legend and places it on the clipboard. The “snapshot” can then be paste into any
windows program such as Paint, Word, etc. The size of the “snapshot” can be
changed in Preferences (F12).
Show – Click to display/conceal the highlighted data file. This command is also
available as a check box on the legend.
Remove Gas Force – Click to include/exclude the gas force from the highlighted
data file. This command is also available as a check box on the legend.
Line Style – Changes the line style for the highlighted data file.
File – Allows the user to open and edit the data file properties/description page, also
known as “Fields”.
52
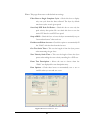
Preferences – Opens the preferences window. The majority of the default settings for
the program are found here. Keep in mind, many of these settings can be changed in
other areas of the program without affecting the default settings.
Colors – This page controls the default colors and order used when displaying
data traces. Left click on the color bring up the color selection window.
Figure 5 Preferences Window - Colors
53
Legend - This page controls the default colors and fonts for the legend. Click
on the color to bring up the color selection window. Click on the font box to
bring up the font dialog box.
Hide “Gas Force/Pressure” Column - Check to conceal the
“Remove Gas Force” check box in the legend.
Figure 6.10: Preferences Window - Legend
54
Data – This page contains the default data display options.
Initially Remove Gas Force – Check this box to initially remove gas
force from data when displayed.
Assume Shock 96 Data has Gas Force removed- Check this box if
importing Shock 96 data which already has the gas force removed.
Filter Shock 96 Data to Single Complete Cycle – Check to display
only one complete cycle when importing Shock 96 data.
Sign Convention – Allows user to change the default axis and sign
convention used when displaying data.
Avg. Force vs. Velocity Graph – Controls the cursor step size on the
average force graph only.
Gas Force/Gas Pressure Display – Default shock shaft diameter
used for calculating the gas pressure.
Figure 6.11: Preferences Window - Data
55
Math Signals – This page allows the user to create additional data channels
which are created using constants, math functions, and collected data channels.
Math channels are treated the same as collected channels and may be graphed
or used in other math channels. The math syntax used in creating these
channels is located in the Appendix.
Figure 6.12: Preferences Window - Math Signals
56
Display – This page contains the default graphing display options.
Display Preferences – Check box options for PVP and CVP data
display defaults.
Default Graph – Allows user to determine the default graph which is
initially displayed in the analysis window.
Manufacturer’s Report – Allows user to determine which two graphs
are displayed in the manufacturer’s report. The manufacturer’s report
is only available for PVP test data.
Figure 6.13: Preferences Window - Display
57
Smoothing – This page is used to place a moving average filter on a selected
channel(s). All collected channels and all math channels are listed here. Use
caution when using smoothing values above 5. Smoothing can cause phase
shifts and attenuation in the data. If using smoothing, it is best to use the same
amount of smoothing on all channels.
Figure 6.14: Preferences Window - Smoothing
58
Field Defaults – Allows user to edit the fields which are stored with each test,
and displayed in the report tab. The fields can be edited separately for each
type of test. When editing the fields for a specific test, use the insert key to add
a row, and the delete key to delete a row. The names for each row can be
edited by clicking on that particular cell. The number of lines displayed for
each row can also be edited by clicking on the “lines” cell. Constants are
number which can be used with math channels.
Figure 6.15: Preferences Window - Field Defaults
59
Snapshot – This page allows the user to alter the size of the snapshot taken of
the graph and legend when using the “snapshot” function.
Figure 6.16: Preferences Window - Snapshot
Folder and Files – This page allows the user to set the default file names and
default directories where the files are saved.
Figure 6.17: Preferences Window - Folders and Files
60
Test – This page allows user to edit default test settings.
Filter Data to Single Complete Cycle – Check this box to display
only one cycle from the data collected. The dyno by default
runs three cycles at each given speed.
Save Only PVP Peak Vel Points – Check this box to save only the
peak velocity data points. Do not check this box to save the
entire CVP data for each PVP test speed.
Stop at BDC – Check this box to have the dyno automatically stop at
“bottom dead center” after each test.
Enable autofill from last run – Check this option to automatically fill
the “Fields” with the data from the last test.
Gas Test Settle Time – This sets the length of time the dyno pauses
when measuring the gas force.
Zero Velocity Settle Time – This sets the length of time the dyno
pauses when taking the zero velocity recording for a PVP test.
Enter Test Description – Allows the user to choose when the
“Fields” are displayed for test description entry.
Data Options – Check these boxes to automatically save a .csv or
.xml file when you run and save a test.
Figure 6.18: Preferences Window - Test
61
Units – This tab allows the user to select the unit type to be displayed.
Custom units are a user defined set of Standard and Metric units; change the
converted units by clicking on the unit and selecting a new conversion from
the drop down list. Unit Precision controls the level of precision for each unit
type; valid precisions are between zero and five.
Figure 6.19: Preferences Window - Units
Graph – This page allows the user to change the default cursor, grid options,
fonts, data trace style, and data trace width.
Figure 6.20: Preferences Window - Graph
62
PVP Options-The PVP option page allows the operator to select what cycles will be used to
generate the PVP compos
Roehrig Engineering historic method-If this option is selected the program will average all
collected cycles and use that average as the peak points for the PVP trace. When you check
this box you will also be given the option to clip to a single cycle, in this mode the program
will use the second to last cycle. This is how previous versions of Shock 6 displayed PVP
traces.
PVP cycle selection- This option lest the operator select what cycle or group of cycles they
would like to use for PVP generation. Any number of cycles can be selected.
Cycles to sample- Defines the number of cycles that dyno will run and the user will have to
select from, increase this number to see more cycles under cycle selection.
Peak force and peak velocity method- This method should not be used without contacting
REI beforehand to make sure the operator has a complete understanding of the effects on the
data.
.
63
6.3.3. Graph
Figure 6.21: Graph Menu
Force vs. Velocity – Changes current graph to force vs. velocity graph.
Depicts a full 360 degree stroke, showing positive and negative velocity
values.
Force vs. Absolute Velocity – Changes current graph to force vs. absolute
velocity graph. Depicts a full 360 degree stroke, however, all velocities
are shown as positive in value.
Compression Open/Rebound Close – Changes current graph to
compression open/rebound close graph. Depicts half of the cycle.
Rebound Open/Compression Close – Changes current graph to rebound
open/compression close graph. Depicts other half of the cycle.
64
Force vs. Displacement – Changes current graph to force vs. displacement.
Commonly known as “football” or “potato” plot.
Average Force vs. Absolute Velocity – Changes current graph to average
force vs. absolute velocity. Depicts the average of the compression
forces and the average of the rebound forces vs. the absolute velocity.
Roehrig Engineering does not recommend the use of this graph, as it is
a poor representation of the shock data.
Absolute Compression Open/Rebound Close – Changes current graph to
absolute
compression
open/rebound
close
graph.
Same
as
compression open/rebound close graph, except all force values are
shown as positive values.
Absolute Rebound Open/Compression Close – Changes current graph to
absolute rebound open/compression close graph. Same as rebound
open/compression close graph, except all force values are shown as
positive values.
Signal vs. Time – Allows user to plot any signal or math channel vs. time. A
menu will appear with a list of all available signals/channels. Select the
channel to be graphed. Hold the “Ctrl” key to select multiple channels.
Signal vs. Signal – Allows user to plot any signal or math channel vs. any
other signal or math channel. The user must first select the units for
the x-axis. Once units are selected, hit “insert plot”. Pull down menus
will appear under the x-axis trace and y-axis trace columns with
available signals/channels.
65
Show Live – Allows user to manually operate dyno while showing the live
data on the current graph. Enter a speed in the “motor speed” panel
and hit enter to start the dyno.
BDC – Moves dyno to “bottom dead center”.
Cycle – Moves dyno one complete cycle at slow speed.
0 Load – Zeros the load cell
Gas Test – Performs a gas test. Result is displayed in “Gas
Force” panel.
Pause – Stops the data collection.
Continue – Starts the data collection.
Color – Changes the line color.
Clear – Clears the data collection.
Stop – Stops the motor.
Done – Exits Show Live.
Figure 6.22: Show Live Screen
66
Toggle Validation – Turns current validation parameters on and off.
Validation Parameters – Allows user to enter a validation table based on a
master shock or manually inputted data. This table is visually displayed on the
graph, and a “green” or “red” box in the legend indicates if the given data file
“passes” or “fails” the validation. Gas force and seal drag can also be included
in the validation. Click “Import PVP” to create a validation table based off of
a master shock file. The user can choose the deviation (tolerance) as a
percentage, absolute, or both. The user can also create a table manually by
using the “Insert Row” button and manually entering the appropriate values.
Validation tables can be saved using the “Save Validation” button, or
previously saved validations can be opened using the “Load Validation”
button.
Figure 6.23: Validation Parameters
67
Validation Color – Allows user to change the color of the displayed
validation parameters.
Validation Attributes – Allows user to change the line style of the displayed
validation parameters.
Insert – Creates another graph inside the current template. User can toggle
between graphs using the tabs displayed on the bottom of the legend.
Delete Graph – Deletes the selected graph from the current template.
68
6.3.4. Test
Figure 6.24: Test Menu
Create – Allows the user to create and save a test. There are three test profiles
which the dyno can perform: CVP (Continuous Velocity Pickoff), PVP (Peak
Velocity Pickoff), and Multi-CVP (Multiple Continuous Velocity Pickoffs).
Figure 6.25: Choose Test Type Screen
69
Select Warm Up Type – Allows user to choose what type of warm up cycle to run
on the shock. There are four types of warm up cycles which the dyno can perform.
Do not perform a warmup – When this option is selected, a warm up cycle is
not performed.
Run the shock at a set speed for a period of time – The user will be
prompted to enter a speed and period of time for the warm up cycle.
Run the shock at a set speed until a particular temperature is reached The user will be prompted to enter a speed and a target temperature for the
warm up cycle.
Specify a set of temperatures to which to warm the shock. Run the specified test once
at each specific warm up temperature. – This warm up cycle can only be used with CVP
tests. The user is prompted to enter a speed and a table of temperatures. The CVP test will
run once at each specified temperature.
Figure 6.26: Select Warmup Window
70
Select Gas Test Type – Allows users to perform a gas test and/or seal drag test after
the warm up cycle is complete. The gas test takes a static force measurement to
determine the rod reaction force due to the gas pressure inside the shock. The seal
drag test is used to determine the friction force due to the seals in the shock.
Do not perform a gas test – When this option is selected, gas force and seal
drag measurements are not taken.
Perform a gas test – The user will be prompted if they would like to override
the zero displacement test position. If this box is not checked, the rod reaction
force will be measured at zero displacement (mid stroke). If the box is
checked, the user will be prompted to enter a new test position. A value of 0
corresponds to mid stroke. Positive or negative values may be entered relative
to the mid stroke position. Values entered which are beyond the maximum
amplitude of the machine will cause the machine to run endlessly during the
gas test cycle.
Perform a seal drag test only – The user will be prompted to enter a test
window and speed for the seal drag test. The test window is the amount of
displacement on either side of 0 displacement (mid stroke) for which the
friction force is measured.
Perform a seal drag test then a gas test – When this option is selected, both
a gas force test and a seal drag test are performed.
Figure 6.27a: Gas Test Window
71
Multi Point Gas Test – Executes a gas test using multiple positions in the
compression and rebound direction.
Build a table surrounding zero
displacement (mid-stroke) using positive and negative displacement values.
Figure 6.27b: Multi Point Gas Test
CVP Test – The user will be prompted to enter the test speed for the CVP
test cycle. The minimum and maximum speeds possible for the dyno at the
current stroke are displayed.
Durability – In this mode, the CVP test will run for the given number of
cycles. The test will collect data on the first cycle only.
Figure 6.28: CVP Test Screen
72
PVP Test – The user will be prompted to enter a table of speeds at which to
run the PVP test. The user may enter the values in the table manually using the
“insert” button, or a table can be automatically generated using the “series”
button. The PVP graph can be generated using one of three methods: peak
velocity pickoff, average values about 0 displacement, or peak force pickoff.
Re-execute gas test prior to each speed – When this option is
checked, a gas force test is performed before each speed.
Include zero velocity sample – When this option is checked, a zero
velocity data point is measured. This is done at mid stroke. The settle
time can be set in “preferences”.
Use peak velocity for each speed to generate PVP trace – When
this option is checked, the data points generated correspond to the
peak velocities seen for each test speed.
Average values in a window centered around zero displacement –
When this option is checked, the data points for each test speed are
generated by taking the average values inside the given window
centered around zero displacement (mid stroke).
Use peak force for each speed to generate PVP trace – When this
option is checked, the data points generated correspond to the peak
force values seen for each test speed.
Figure 6.29: PVP Test Window
73
Multi-CVP – Allows user to run multiple CVP cycles in one test. CVP cycles
may be run at the same speed or at different speeds. The user will be
prompted to enter a table of speeds at which to run the CVP cycles. The
values in the table may be entered manually using the “insert” button, or a
table can be automatically generated using the “series” button. An
“instruction” may be entered after each speed. This “instruction” will be
displayed between cycles if the “Pause after runs” box is checked, and will also
be displayed as part of the cycle name when appearing in the legend.
Pause after runs – When this option is checked, the dyno will pause
between each CVP cycle, allowing the user to make adjustments to the
shock. The test will not resume until the user hits the “continue”
button.
Re-execute warmup – When this box is checked, the warmup cycle
will run again after each CVP cycle.
Re-execute gas test – When this box is checked, a gas test will be
performed after each CVP cycle.
Figure 6.30: Multi-CVP Window
74
Advanced – This button appears in all three types of test profiles. It allows
the user to specify the move to speeds used during the test. Changing the gas
test move to speed may change the gas test results. The gas test move to speed
and the gas test settle time must be adjusted depending on the shock being
tested. The “advanced” button also allows the user to monitor the shock
temperature and automatically shut down the test if a given temperature is
reached.
Figure 6.31: Advanced Properties Window
75
Test – Opens the test control panel. The user can select, create, edit, and run tests
from this screen. The test names appear in the upper left corner of the test screen. To
select a test, simply click on it. To edit a test, double click on it and the edit window
will appear. Right clicking on the test allows the user to delete or rename a test. Tests
may also be organized into folders. Simply right click on the folder in which you wish
to create another folder, and select “new folder”. The tests can be dragged and
dropped into the desired folder. To create a test, right click on an existing folder and
choose “new test”.
Note: When editing a test, the user has the option of saving it as a new test with a new
name by clicking the “save as” button.
Test Profile Column – Upper half of column displays available test hierarchy.
Lower half of column displays the name and major parameters for the test
which is currently selected.
Commands Column – Contains command buttons
Start Test – Starts the currently selected test.
Skip Step – Skips the current step in the test.
Zero Load Cell – Zeros the load cell reading. The program will retain this
zero value until the program is exited or the “zero load cell” button is pressed
again.
Cycle Motor - Moves dyno one complete cycle at slow speed.
Go to BDC - Moves dyno to “bottom dead center”. The box to the right of
this button indicates if the dyno is at bottom dead center. If the box is
“green”, the dyno is at BDC. If the box is “black”, the dyno is not at BDC.
Done – Exits test control panel.
Status Column – Lower half of this column displays live sensor readings and
current test step which is being executed.
76
Abort – This button aborts the current test. Please note: This button is NOT
an emergency stop button!
Close after test – When this box is checked, the test control panel will close
after the test is complete.
Pause after gas test – When this box is checked, the dyno will pause after the
gas test allowing the user to make adjustments to the shock. The dyno will
only resume after the user hits the “continue” button.
Results- This box lists data from the last test run.
Test Profile Column
Commands Column
Figure 6.32: Test Control Panel
77
Status Column
Create Batch – Allows user to create a batch test (multiple tests run together). The
user can string together any available tests in any order, and have the software
automatically run each test and save the data. The available test hierarchy is displayed
on the left side of the window. To add a test to the batch, click on the test, and then
click on the “right arrow” button. The test will be added to the batch. Tests can be
deleted from the batch using the “black X” button. The order of the tests can also be
changed using the “up arrow” and “down arrow” buttons. Each test is assigned a
default data file name. This name can be changed by the user. If the user does not
want to collect and save data for a given test in the batch, simply uncheck the “data”
box. The batch test is given is given a default name in the lower left corner of the
window. This name can be changed by the user. Click the “OK” button when
finished.
Figure 6.33: Create Batch Test Window
78
Run Batch – Allows user to run a previously created batch test. Select a batch
test from the list. The individual tests for that batch will be listed at the bottom
of the window. At this point the batch test can be edited if required. Before
running the batch test, the user is required to select an output folder for the
data files which will be saved. Once this is done, click the “OK” button to
begin the test.
Figure 6.34: Run Batch Test Window
Delete Batch – Allows user to delete a previously created batch test or tests.
79
6.3.5. Hardware
Figure 6.35: Hardware Menu
Datacard – Contains information regarding the datacard including sampling
rate and calibration data for each sensor. Warning: Altering these numbers
will change the calibration of the dyno. Please contact a Roehrig representative
before making changes to the datacard values.
Motor – Contains information regarding the motor, including motor type and
motor parameters. All settings are preset at the factory and should not be
changed by the user, with the exceptation of Measure Stroke. The “Measure
Stroke” option should be run whenever the stroke on the dyno has been
mechanically changed. To measure the stroke, ensure that there is no test
specimen in the machine, then click the “Measure Stroke” button.
Monitor – Displays the live senor readings for the dyno.
80
6.3.6. View
Figure 6.36: View Menu
Template List – Displays a list of the currently open templates in a toolbar.
Standard Toolbar – Displays the standard Roehrig toolbar, which contains
the most commonly used functions.
Status Bar – Displays the lower status bar.
Toolbars – Lists and displays all other available toolbars. Toolbars may be
moved by clicking on the “crosshatching” located on the left side of the
toolbar and dragging it to the top, bottom, left, or right side of the program
window, or to the center to display it in a new window. The “more options”
icon located on the right side of the toolbar can be used to modify the
contents of the toolbar.
Figure 6.37: Standard Toolbar
Crosshatching
More Options Icon
X Offset/Y Offset – Offsets selected trace on currently displayed
graph.
81
6.3.7. Settings
Figure 6.38: Settings Menu
User Settings – Exports or Imports user settings. User settings include all settings
contained in the “preferences”, including all user tests and math channels. It is
recommended that the user export and backup all settings listed under the settings
menu on a regular basis in case of a computer crash.
System Settings – Exports datacard settings, motor settings, or both. These settings
can be used to restore the motor properties and datacard properties (sensor
calibration) in case of a computer crash. To import these settings, simply double click
on the desired system settings file in any Windows Explorer window.
Export all Settings – Exports all user and system settings and saves them as one file.
Math Settings – Exports or Imports only the math channels created in “preferences.”
Can be used to transfer math channels to other computers running SHOCK6. When
importing math channels, the user can choose to replace existing channels with the
new channels or merge the existing channels with the new channels.
Test Settings - Exports or Imports only the user’s tests. Can be used to transfer tests
to other dynos running Shock6. When importing tests, the user can choose to replace
existing tests with the new tests or merge the existing tests with the new tests. Test
settings cannot be transferred between crank dynos and EMAs (Electro Magnetic
Actuators).
82
6.3.8. Window
Figure 6.39: Window Menu
Window Menu – Allows user to arrange templates within the program using
standard Microsoft Windows functions. Also lists currently open templates
and currently selected (active) template.
6.3.9. Help
Figure 6.40: Help Menu
Help Menu – Provides searchable electronic version of this manual, which
can also be listed by its table of contents. E-mail support link and interactive
trouble shooting manual also provided. The “About” option provides
information about the software version, motor, and datacard.
83
6.4. Creating and Running Tests
First, power up both the dyno and the computer system. Make sure all connections to
the computer are made. Once the computer has booted, start the Roehrig Shock
program. Load the shock to be tested following the procedure laid out in Section 4.2.
If the user wishes to create a new test, click on the “Create” icon either from the
“Test” menu or from the toolbar. The create test wizard will appear. Pick the desired
test type, and click next. The wizard will guide the user through the rest of the test
creation procedure. Once finished, the user will be asked to name the test. Enter a
unique name and click OK. Once the test has been created, or if the user wishes to
run a previously created test, click on the “Test” icon either from the “Test” menu or
from the toolbar. The test screen will appear. Click on the desired test in the test
profile column (left side of the test screen). The desired test will now be highlighted.
Click on the “Start Test” button. Depending on the settings in preferences, the user
will be prompted to enter information regarding the test run at this point, after the test
is run, or not at all. The next screen displayed will be the “Dyno Starting” window.
When the user is ready to start the test, click OK. Once the test is completed, the user
will be prompted to save the data. The data is saved as an individual file using standard
Microsoft Windows functions. Once the data is saved, it will automatically open in the
currently active template.
84
6.5. Viewing and Analyzing the Data
Once a test run is completed, the data is automatically opened in the currently active
template. The data file name is listed in the legend. Multiple data files can be opened
and displayed in the same template. To open a data file, click on the “Open Data”
icon either from the “File” menu or from the toolbar. The data will open in the
currently active template. To remove a data file from the template, click on the data
file in the legend, and click on the “Delete” icon in the toolbar. PVP data can be
expanded to show the data from each individual speed. Click on the “+” to the left of
the file name to expand the data tree. Multiple templates can be open at the same time.
The user can save a template which also saves all associated data files with it. Once the
data of interest is opened in the template, the user can now analyze that data. The
tabbed analysis window allows the user to view the data in several different ways.
Show/Hide
File Name
Display
Legend
Tabbed Analysis Window
Graph Tabs
Figure 6.41: Template with open PVP Data File, “Graph” Display Tab Selected
85
When the “Graph” display tab is selected, the user defined graph will be displayed in
the analysis window. The user can choose the desired graph either from the “Graph”
menu or from the toolbar. The show/hide check boxes allow the user to turn on and
off selected traces. When the check box under the “S” column is checked, the selected
trace will show up on the graph, and vice versa. When the check box under the “G”
column is checked, the gas force (if measured) will be subtracted from the trace, and
vice versa. A template can have multiple graphs. Right click on one of the graph tabs
(lower left) to create, delete, or rename a graph. Once the desired graph is chosen, the
user can use the zoom, line, and averaging tools on the selected trace in the graph. The
selected trace is the trace which is highlighted in the legend. A cursor (crosshair) will
also be displayed on the selected trace on the graph. This cursor can be moved using
the arrow keys on the keyboard, or by clicking on the desired point with the left
mouse button. The data values for this point (where the cursor is located) are
displayed in the status bar. The displayed graph can also be printed by clicking on the
“Print” icon either under the “File” menu or from the toolbar.
Zoom
In/Out
Reset
Zoom Box
Line Tool
Averaging Tool
Figure 6.42: Graph Analyzing Tools, Located in the Main Toolbar
The graph scaling can be changed by clicking on the “Scaling” display tab. When the
“scaling” display tab is selected, the scaling preferences are shown for both the x and y
axis. The user has the option of auto scaling by checking the box under “auto”, or
manual scaling. If auto scaling is not checked, the values under “min” and “max” will
be used to manually scale the graph.
86
The “Report” display tab allows the user to view the data from the selected trace in a
tabbed format. The report tabs allow the user to display different information
associated with the selected trace. The measured force vs. velocity data is also shown
in the bottom table. The velocity increment for this table can be changed by clicking
on the “velocity increment” pull down box. The report data can also be printed by
clicking on the “Print” icon either under the “File” menu or from the toolbar.
Figure 6.43: Template with open PVP Data File, “Report” Display Tab Selected
87
The “PVP Mfg. Report” tab displays two user definable graphs along with the field data
and the tabbed force vs. velocity data for the selected PVP data file. The report data can
also be printed by clicking on the “Print” icon either under the “File” menu or from the
toolbar.
Figure 6.44: Template with open PVP Data File, "PVP Mfg. Report" Display Tab Selected
88
The “Histogram” display tab allows the user to create a histogram using data from the
selected trace. The user must define which data channel to display, the bin size, and
the start and end points.
Chapter
Figure 6.45: Template with open PVP Data File, "Histogram" Display Tab Selected
89
Chapter
7
7. Maintenance Procedure
To ensure proper performance of your Roehrig Dynamometer follow these maintenance
procedures
As Needed
Columns
Keep cleaned and lightly oiled to prevent rust. (Un-treated Steel Only)
Check the wear plates for grease. The dimples in the wear plates
should be filled with grease at all times for proper lubrication.
Wear Plates
Wear plates should be greased with Mobil 1 Red Grease or any nonmolybdenum or non-Lithium grease.
Crossbar
Remove the crossbar handles and nuts (if equipped) and apply antiseize to the crossbar studs.
Keep dust and oils away from the electronics board, clean as needed.
General
DO NOT apply cleaners or solvents to the IR Temperature sensor,
chemicals may damage the lens.
Every TWO Months
Your dyno is equipped with dry linear bearings at the actuator shaft
and at the two shafts for the scotch yoke.
These bearings DO NOT require lubrication.
Bearings
Visually inspect the three bearings on the front of the machine. The
bearings should look clean and free of debris.
Note: When the machine is in motion these bearings may move up
and down slightly, this is a normal operating condition.
90
Yearly Maintenance
Check the inner and outer belts of your dyno for excessive wear and
or damage. Also check for lose belts or overly tight belts. The belts
should be able to twist 45-90 degrees on the longest side.
To gain access to the belts:
FIRST TURN THE POWER OFF.
Remove the rear cover by removing the two cap screws from the
back side and loosening the 3 cap screws on each side with a 1/8 inch
Allen tool. The rear belt will be visible
Remove the front cover and unplug the connector from the
Emergency Stop by pushing the tab to the unlock position.
Belts
Remove the 3 flat head cap screws from the top plate and the smaller
button head cap screw from the front of the electronics board.
At this point gently lift the top plate from the front and rear and
move it upward on the columns so that it is out of the way.
Check the condition of the belts and grease the green drive bearings,
see below.
When the maintenance is complete, replace the top plate while
carefully aligning the electronics board to be mated with the
connectors. Attach the Emergency Stop switch and lock the tab in
place. Replace the cap screws in the top plate and electronics board
and install the front / rear covers.
Drive Bearings
There are three drive bearings inside the machine mounted on the
rear plate. Grease the bearings through the grease fitting on each.
See the above instructions for how to gain access to the inner bearing.
91
Chapter
8
8. Appendix
8.1 USB to Serial Adapters
In the case where your computer does not come with a Serial port, the use of a USB to
Serial Adapter will be required. Roehrig Engineering recommends USB to Serial Adapters
from Keyspan for reliability. Model# USA-19HS
Figure 8.1: Keyspan USB to Serial Adapter. Model# USA 19-HS
When installing the drivers for the device, follow the manufacturer’s directions.
92
8.2 Glossary
Automatic Gas Test - The dynamometer automatically measures and removes the gas
force.
Collection - The act of stroking the shock absorber and measuring the forces produced.
Collection Speed - The speed at which the crank rotates. See the “Frequency Versus
Peak Velocity” chart to convert this to shaft speed in inches per second.
Continuous Velocity Pick-off (CVP) - When data is collected over a complete cycle of
compression and rebound. The graph produced is a smooth curve.
Cycle - One revolution of the crank. It is equivalent to the shock being compressed and
extended one time.
Damper - Shock Absorber
Export - Taking data from the shock program and turning it into coma separated ASCII
files that can be used in other programs.
Gas Force - The internal forces in the shock caused be the pressure of the nitrogen gas.
This is why the shock automatically extends itself.
Gas Test - The measuring of the shocks gas force
Keypad - This is not part of the computer, but the square pad attached to the
dynamometer itself. It is used to manually control the machine’s motor.
Live - When a “live” reading of a sensor is referred to, you are not collecting data, but
viewing real time results on the computer monitor.
Load Cell - This is attached to the bottom of the cross bar. It is either a blue or stainless
cylinder, or a steel “S” shaped piece. The top of your shock attaches to it, and it measures
the forces generated by the shock during a collection.
Motor Units - The type of numbers entered in the Test Options screen. This is Hz, RPM,
or (Linear) Velocity. The Velocity is calculated by multiplying the Stroke times the
Frequency Ratio times Pi times the desired crank Hz.
Peak Velocity Pick-off (PVP) - The dynamometer is run at different speeds, and the data
is collected and graphed only at the peak velocity of each cycle. The resulting graph is a
point-to-point line graph.
Seal Drag - The internal friction of the shock caused by seals, o-rings, and binding. This
number is generated during an Automatic Gas Test.
93
Shock Absorber - Damper
Software Key - The small white plastic square connected to the printer port of your
computer. Without this your computer will not talk to your dynamometer.
Temperature Sensor - The black piece of plastic that clips around the damper. It
measures the temperature of whatever it touches.
Valving - The internal parts of the shock (piston, shims, bleeders) which can be changed to
modify the shock curve.
8.3 Shock 6.0 Math Syntax
Functions
The following functions are supported by the Roehrig Math system. All functions, unless
specifically noted operate on all types of signals.
94
Expression
Description
ABS
Returns the absolute value of the ‘expression’.
SGN
Returns the sign of the ‘expression’.
If expression is greater then 0, SGN returns 1.
If expression is equal then 0, SGN returns 0.
If expression is less then 0, SGN returns -1.
SIN
SIN returns the sine value of ‘expression’. ‘expression’ is
assumed to be in radians.
COS
COS return the cosine value of ‘expression’. ‘expression’ is
assumed to be in radians.
TAN
TAN returns the tangent of ‘expression’, ‘expression’ is
assumed to be in radians.
ASIN
ASIN returns the sin-1 of ‘expression’.
ACOS
ACOS returns the cos-1 of ‘expression’.
ATAN
ATAN returns the tan-1 of ‘expression’.
EXP
EXP returns the values of ‘e’ to the ‘expression’ power, or
e‘expression’.
LOG
LOG returns the natural log of ‘expression’.
95
SQRT
SQRT returns the square root of ‘expression’
DIFF
DIFF differentiates ‘expression’ with respect to time. The
sample rate of expression is assumed to be that same of the
data being used to evaluate ‘expression’.
INTG
INTG integrates ‘expression’ with respect to time. The
sample rate of expression is assumed to be that same of the
data being used to evaluate ‘expression’.
POSITIVE
POSITIVE returns the value of ‘expression’ if it is greater then
zero, otherwise POSITIVE returns zero.
NEGATIVE
NEGATIVE returns the value of ‘expression’ if it is less then
zero, otherwise NEGATIVE returns zero.
RAD
RAD converts ‘expression’ from degrees into radians.
DEG
DEG converts ‘expression’ from radians to degrees.
MIN
MIN evaluates each individual expression and then returns the
minimum of all of the expressions.
MAX
MAX evaluates each individual expression and then returns
the maximum of all of the expressions.
AVE
AVE evaluates each individual expression and then returns the
average of all of the expressions.
UNITS
UNITS ensures that ‘symbol’ is returned in ‘measurement’
units. For example, if Displacement may be in inches or
millimeters, UNITS(Displacement, {Mm}) would ensure the
Displacement is in millimeters.
96
TOUNITS
TOUNITS assumes ‘expression’ is in ‘measurement’ units and
forces it to convert to ‘targetmeasurement’ units.
SMOOTH
SMOOTH evaluates expression and averages the values of
‘expression’ for each of the ‘NUMBER’ data points before
and after the each data point.
For example
“SMOOTH(Displacement, 5)” would for each point of
displacement it would average the eleven data points to
generate the value at that data point. (It uses eleven because it
takes 5 points from left, 5 points from the right and the data
point itself.)
CYCLE
CYCLE evaluates ‘expression’ and then clips the data to
contains only the ‘opendirection’ and ‘closedirection’ portions
of the dyno cycle. ‘opendirection’ and ‘closedirection’ can be
qith ~Rebound, ~Compression, or ~Ignore.
97
Syntax
expression: binaryop
|
simpleexpression
|
( expression )
simpleexpression:
|
|
|
|
|
|
number
symbol
function
unaryoperation
conditional
smooth
cycle
number:
|
NUMBER
NAN
symbol
SIGNAL
CONSTANT
function:
|
|
|
|
|
|
|
|
|
|
|
|
|
|
|
|
|
|
|
|
|
ABS ( expression )
SGN ( expression )
SIN ( expression )
COS ( expression )
TAN ( expression )
ASIN ( expression )
ACOS ( expression )
ATAN ( expression )
EXP ( expression )
LOG ( expression )|
SQRT ( expression )
DIFF ( expression )
INTG ( expression )
POSITIVE ( expression )
NEGATIVE ( expression )
RAD ( expression )
DEG ( expression )
MIN ( argumentlist )
MAX ( argumentlist )
AVE ( argumentlist )
UNITS ( symbol , measurement )
TOUNITS ( expression , measurement , measurement )
argumentlist:
|
expression , argumentlist
expression
unaryoperation:
|
- expression
NOT expression
binaryop:
|
|
|
expression
expression
expression
expression
+
*
/
expression
expression
expression
expression
98
|
|
|
|
|
|
|
|
|
|
|
conditional:
|
|
|
|
expression
expression
expression
expression
expression
expression
expression
expression
expression
expression
expression
% expression
^ expression
> expression
>= expression
= expression
!= expression
<= expression
< expression
AND expression
OR expression
XOR expression
expression ? expression : expression
IF ( expression , expression , expression )
IF ( expression , expression )
IF expression THEN expression
IF expression THEN expression ELSE expression
smooth:
SMOOTH ( expression , NUMBER )
direction:
|
|
~COMPRESSION
~REBOUND
~IGNORE
cycle:
CYCLE ( expression , direction , direction )
measurement:
{UNKNOWNUNIT}
{}
{INCH}
{M}
{CM}
{MM}
{IPS}
{INCH/SEC}
{M/SEC}
{CM/SEC}
{MM/SEC}
{LBS}
{NEWTONS}
{KGF}
{F}
{C}
{RPM}
{HZ}
{FT}
{MI}
{KM}
{SEC}
{MIN}
{HR}
{FT/SEC}
{MPH}
{MI/HR}
{KPH}
{K/HR}
99
{G}
{FT/SEC^2}
{MP/SEC^2}
{IN*LBS}
{FT*LBS}
{N*M}
{PSI}
{BAR}
{P}
{V}
{LBS/IN}
{N/MM}
{N/CM}
{N/M}
{KGF/MM}
{KGF/CM}
{KGF/M}
{OZ}
{LBS}
{GM}
{KG}
{FLOZ}
{GAL}
{L}
{DEG}
{RAD}
{IN*LBS/DEG}
{FT*LBS/DEG}
{KGF*MM/DEG}
{KGF*CM/DEG}
{N*MM/DEG}
{N*CM/DEG}
{N*M/DEG}
{NEWTON*CM}
{NEWTON*MM}
{KGF*MM}
{KGF*CM}
{KGF*M}
{KGF*M/DEG}
{%}
100
Chapter
9
9. Additional Documentation
The following pages will contain information specifically related to your
product.
Included are some/all of the following:
•
Detailed Assembly Drawings
•
Exploded Assembly Drawings
•
Electrical Schematics
101
Chapter
10
10. Warranty and Service
10.1 Warranty
For one year from the date of delivery (date equipment leaves REI), Roehrig Engineering,
Inc. will provide, free of charge, parts and service labor to repair or replace any part of the
dynamometer that fails because of a manufacturing defect.
This warranty is extended to the original purchaser and any succeeding owner of the
product within the one year time period.
10.2 Technical Support
Roehrig Engineering, Inc. is committed to providing the best technical support to our
customers. If you have any problems using one of our products, please follow these steps
before contacting our Technical Support Representative:
•
Be sure to read the equipment manuals. Many times the answer is right there.
•
Document the problem you are experiencing. Be as specific as you can. The more
information you have, the easier the problem will be to solve.
•
If you still cannot resolve your problem, have your equipment’s serial number
available before calling.
102
Technical Support hours are 8:00AM to 5:00PM Eastern Time, Monday through Friday. E-mail
[email protected]. You may also fax in your problems or questions 24 hours a day.
Faxes sent outside regular working hours will usually be answered before 10:00AM ET the next
working day. Please be sure to use the Customer Service Request Form found later in this
document. Include your FAX and phone numbers, and the name of the user. Fax support
number (336) 956-3870. Phone support number (336) 956-3800.
103
10.3 SERVICE POLICY
Roehrig Hardware Under Warranty
A one-year warranty comes with the purchase of new Roehrig Engineering manufactured hardware products. Supplemental service plans are
also available at additional cost.
The following is a summary of what service can be obtained under the Standard warranty:
1.
2.
Factory repairs on hardware product defects;
Factory repairs are usually completed within 3 working days of Roehrig Engineering’s receipt of the defective item. The customer is
responsible for returning the hardware to Roehrig Engineering;
3.
Roehrig Engineering will return the hardware via UPS 2 day air service (USA only). If the customer is outside the continental USA, the
customer is responsible for all shipping expenses. Expedited service can be arranged at the customer’s expense;
4.
5.
6.
7.
Free technical support, for technical problems and applications, for all trained users;
Warranties can be renewed annually on Roehrig Engineering products;
A warranty cannot be purchased if the original or renewed warranty has expired.
Warranties are transferable to subsequent owners under certain conditions:
✦
✦
✦
The equipment is currently under warranty
The new owner undergoes training on the equipment
A warranty transfer form is completed, and submitted to Customer Service
Roehrig Hardware Not Under Warranty
•
•
E-mail is the preferred method to address non-warranty service problems, out of warranty e-mail we be answered at no charge, or the
customer may use the Customer Service Request Form for troubleshooting problems via fax at no charge. REI may charge for phone
non-warranty problems
If the initial trouble shooting does not resolve the problem, then all factory assessments and repairs will follow the following procedure:
Factory Repairs
1.
2.
3.
4.
The customer sends the part to Roehrig Engineering.
The estimated repair cost will be given to the customer prior to the repair. The total cost must be paid prior to beginning of
service.
System testing, evaluation and repairs can take up to two weeks. However, the part will be scheduled for a service as soon
as it arrives at the factory.
Roehrig Engineering will return the repaired part via UPS ground service in the USA only. If the customer is outside the
continental USA, the customer is responsible for shipping charges. Expedited service can be arranged at the customer’s
expense.
Repairs at Customers Facility
1.
2.
3.
4.
Customer will pay all travel expenses of Roehrig Engineering service personnel. Travel rate is $0.485 per mile, plus $35.00
per hour, maximum $200.00 per day. If it is necessary to fly to the customers location, customer will pay full cost of the
airline ticket, plus $35.00 per hour, maximum $200.00 per day travel (not including airline ticket).
Customer will pay for all replacement parts plus $100.00 per hour labor.
Payment required at time of repair.
It may take up to 4 weeks to schedule a service call to the customer’s location.
104
Roehrig Engineering Software Under Warranty
•
•
A one-year warranty comes with the purchase of all new Roehrig Engineering developed software.
The warranty includes:
1.
Free telephone, e-mail and fax support for all trained users.
2.
Free updates and new releases of Roehrig Engineering developed software.
Roehrig Engineering Software Not Under Warranty
•
Once the warranty has lapsed on Roehrig Engineering software, the following applies:
1.
REI may charge for telephone support at standard service rates;
2.
Questions may be faxes or e-mailed to Roehrig Engineering’s customer service department at no charge. Please use the
attached form for fax request.
Hardware and Software Training
Roehrig Engineering’s training program is designed to instruct trainees in the operation of the equipment that the customer has purchase.
The training sessions are set up for each trainee to obtain valuable hands on application exposure. This will help the trainees in their everyday
use of the equipment. Training for additional personnel, and advanced training is available at additional expense.
105
ROEHRIG
INC.
100 Lexington Parkway
Lexington NC 27295
336 956 3800
Transfer of Warranty Service Plan Agreement
__________________________________(Seller’s Name) hereby waives all rights under
warranty service policy for:
Dynamometer Serial Number:______________
Purchased originally on:___________________(date).
___________________________________(Buyer’s Name) hereby assumes all rights and
obligations of the Hardware and/or Software Warranty Service Policy from:
_________________________(Date of Transfer).
This transfer is valid only under the following conditions.
1.
2.
3.
The Dynamometer is currently under warranty
New owner undergoes training from Roehrig Engineering
This warranty transfer form is completed, and submitted to Customer Service.
AGREED
________________________________
(Print Seller’s Corporate Name)
_____________________________
(Print Buyer’s Corporate Name)
By X____________________________
By X_________________________
____________________________
(Print Name of Signatory)
_________________________
(Print Name of Signatory)
Roehrig Engineering, Inc.
Approved by X_____________________________
____________________________
106
ENGINEERING
Purchase Conditions
All Purchase Orders (hereafter, the “Order”) for Roehrig Engineering provided products and services (hereafter, the “Product”) are subject
to the following terms and conditions, which are agreed to by the Purchaser.
1.0 Payment of Purchase Price
1.1
Purchaser hereby promises to pay to the order of Roehrig Engineering all deferred portions of the Purchase Price, together with the
interest on late purchase price payments payable at 1.5% per month (18% per annum).
1.2 the Purchaser grants to Roehrig Engineering a security interest in the products sold pursuant to the Order, which may be perfected by
UCC-1 Financing Statements to be recorded in the applicable County of the Purchaser’s business location and filed with the Secretary
of State’s Office, which security interests will remain in effect until payment in full of the purchase price together with the interest on
late purchase price payments payable thereon had been received by Roehrig Engineering.
1.3 If the Purchaser fails to make full payment of the purchase price within the period set out in the Order, Roehrig Engineering shall have
the following remedies, which shall be cumulative and not alternative:
A. the right to cancel the Order and enter the Purchaser’s premises to re-take possession of the Product, in which event the
Purchaser agrees that any down-payment or deposit shall be forfeited to Roehrig Engineering, as liquidated damages and
not as a penalty, and all costs incurred shall be payable by the Purchaser upon written demand.
B. the right to enter the Purchaser’s premises and remove any Software, components of the Product or other items necessary
in order to render the Product inoperative.
C. the right to withhold all services which would otherwise be required to be provided by Roehrig Engineering pursuant to the
Warranties set out in Section 5 hereof.
D. terminate any existing software license agreement
E. pursue any other available remedy, including suing to collect any remaining balance of the purchase price.
No waiver by Roehrig Engineering of its rights under these conditions shall be deemed to constitute a waiver of subsequent breaches or
defaults by the Purchaser. In the event more than one Product is being purchased pursuant to the Order, unless otherwise set forth herein,
each payment received by Roehrig Engineering from Purchaser shall be applied pro rata against the cost of each product rather than being
applied to the purchase price of any product.
2.0 Delivery and Transportation
2.1
2.2
2.3
Delivery dates are estimates and not guarantees, and are based upon conditions at the time such estimate is given.
Roehrig Engineering shall not be liable for any loss of damage, whether direct, indirect or consequential, resulting from late delivery of
the product. The Purchaser’s sole remedy if the Product is not delivered within 90 days of the estimated delivery date, shall be to cancel
the Order and recover from Roehrig Engineering without interest or penalty, the amount of the down-payment or deposit and any
other part of the purchase price which has been paid by the Purchaser. Notwithstanding the foregoing, such right of cancellation shall
not extend to situations where late delivery is occasioned by causes beyond Roehrig Engineering’s control, including, without limitation,
compliance with any rules, regulations, orders or instructions of any federal, state, county, municipal or other government or any
department or agency thereof, force majuere, acts or omissions of the Purchaser, acts of civil or military authorities, embargoes, war or
insurrection, labor interruption through strike or walkout, transportation delays and other inability resulting from causes beyond
Roehrig Engineering’s control to obtain necessary labor, manufacturing facilities or materials from its usual sources. Any delays
resulting from such causes shall extend estimated delivery dates by the length of such delay.
Responsibility for all costs and risks in any way connected with the storage, transportation and installation of the Product shall be borne
entirely by the Purchaser. If any disagreement arises as to whether or not damage to the Product was in fact caused in storage, transit
or installation, the opinion of Roehrig Engineering’s technical advisers, acting reasonably, shall be conclusive.
3.0 Installation and Operator Training
3.1
The Purchaser shall be responsible for installation of the Product, including, without limitation, the preparation of its premises, the
uncrating of the product and setting up of the Product for operation. Purchaser may elect to order contract services from Roehrig
Engineering to perform this service should they elect to do so.
107
4.0 Warranties and Limitation of Liability
4.1
Roehrig Engineering warrants that (subject to Section 4.6), the Product shall be free from defects in workmanship or material affecting
the fitness of the product for its usual purpose under normal conditions of use, service and maintenance.
4.2 Roehrig Engineering warrants that the software shall operate according to specifications and the system shall operate and perform in
the manner contemplated in connection with the usual purpose for which it was designed.
4.3 The warranties set out in paragraphs 4.1 and 4.2 above (together called the “Warranties”) shall expire at the end of the twelve (12)
month period commencing on the first day of the first month after the date of shipment from the Roehrig Engineering factory (the
“Warranty Period”).
4.4 Subject to the limitations contained in Section 4.6, the Warranties shall apply to any defects found by the Purchaser in the operation of
the Dynamometer or the software and is reported to Roehrig Engineering within the Warranty Period. If the Dynamometer or the
software is found by Roehrig Engineering, acting reasonably, to be defective, and if the defect is acknowledged by Roehrig Engineering
to be the result of Roehrig Engineering’s faulty material or workmanship, the Dynamometer or Software will be repaired or adjusted to
the extent found by Roehrig Engineering to be necessary, or at the option of Roehrig Engineering, replaced with a new Dynamometer,
Software, or parts thereof at no cost to the purchaser.
Claims under the Warranties shall be made by delivering written notice to Roehrig Engineering of the defect in the System, Dynamometer, or
the Software. Within a reasonable time of receipt of such service personnel and warranty service will be provided at no cost to the
Purchaser. If in the reasonable opinion of Roehrig Engineering the dynamometer and Software are not defective, the Purchaser shall pay the
cost of service, which shall be the amount that Roehrig Engineering would otherwise charge for that service and shall include, without
limitation, shipping, handling, and an hourly service charge.
4.5 The Warranties do no apply to
A. any defects in any component of a System where, if in the reasonable opinion of Roehrig Engineering, the Dynamometer,
Software or System has been improperly stored, installed, operated, or maintained, or if Purchaser has permitted unauthorized
modifications, additions, adjustments and/or repair to any part of the System, or which might affect the System, or defects caused
or repairs required as a result of causes external to Roehrig Engineering workmanship or the materials used by Roehrig
Engineering. As used herein, “unauthorized” means that which has not been approved and permitted by Roehrig Engineering.
B.
C.
D.
The Warranties shall not cover replacement of expendable items including, but not limited to, fuses, diskettes, printer paper,
printer ink, printing heads, disk cleaning materials, wear plates, or similar items.
The Warranties shall not cover minor preventative and corrective maintenance.
Any equipment or its components which was sold or transferred to any party other than the original Purchaser without the
expressed written consent of Roehrig Engineering.
4.7
Factory Repairs
A. IF SYSTEM IS UNDER WARRANTY: The Purchaser agrees to ship the Product to Roehrig Engineering in the original
packing containers. Roehrig Engineering will return the repaired or replaced Product. Roehrig Engineering will incur the expense
of the needed part and all return shipping charges to the Purchaser. Roehrig Engineering may authorize of a component of the
Product to perform the service.
B. IF SYSTEM IS NOT UNDER WARRANTY: The Purchaser is responsible for the cost of the replacement part or software, and
all shipping charges.
4.8
Nothing herein contained shall be construed as obligating Roehrig Engineering to make service, parts, or repairs for any product
available after the expiration of the Warranty Period.
Limitation of Liability
4.9
Roehrig Engineering shall not be responsible under any circumstances for special, incidental or consequential damages, including, but
not limited to, injury or death of any operator or other person, damage or loss resulting from inability to use the System, increased
operating costs, loss of production, loss of anticipated profits, damage to property, or other special, incidental, or consequential
damages of any nature arising from any cause whatsoever whether based in contract, tort (including negligence), or any other theory of
law. Roehrig Engineering’s only liability hereunder, arising from any cause whatsoever, whether based in contract, tort (including
negligence) or any other theory of law, consists of the obligation to repair or replace defective components in the System or
Dynamometer subject to the limitations set out above in this section.
This disclaimer of liability for consequential damage extends to any such special, incidental or consequential damages which may be
suffered by third parties, either caused directly or indirectly resulting from test results or data produced by the system or any component
thereof and the Purchaser agrees to indemnify and save Roehrig Engineering harmless from any such claims made by third parties.
4.10 The foregoing shall be Roehrig Engineering’s sole and exclusive liability and the Purchaser’s sole and exclusive remedy with respect to
the system.
THE SOLE RESPONSIBILITY OF ROEHRIG ENGINEERING UNDER THE WARRANTIES IS STATED HEREIN AND
ROEHRIG ENGINEERING SHALL NOT BE LIABLE FOR CONSEQUENTIAL, INDIRECT, OR INCIDENTAL DAMAGES,
WHETHER THE CLAIM IS FOR BREACH OF WARRANTY, NEGLIGENCE, OR OTHERWISE.
OTHER THAN THE EXPRESS WARRANTIES HEREIN STATED, ROEHRIG ENGINEERING DISCLAIMS ALL
WARRANTIES INCLUDING IMPLIED WARRANTIES OF MERCHANTABILITY AND FITNESS.
Roehrig Engineering does not authorize any person (whether natural or corporate) to assume for Roehrig Engineering any liability in
connection with or with respect to the Products. No agent or employee of Roehrig Engineering has any authority to make any representation
108
or promise on behalf of Roehrig Engineering, except as expressly set forth herein, or to modify the terms or limitations of the Warranties.
Verbal statements are not binding by Roehrig Engineering.
4.11 The Warranties extend only to the Purchaser and are transferable, only under the following conditions:
A. The Dynamometer is currently under warranty.
B. New owner undergoes training.
C. A Roehrig Engineering warranty transfer is completed, and submitted to customer service.
All claims under the Warranties must originate with the Purchaser, or any subsequent owner, and the Purchaser will indemnify and save
Roehrig Engineering harmless from any claims for breach of warranty asserted against Roehrig Engineering by any third party.
4.13 Oral representations of Roehrig Engineering or its sales representatives, officers, employees or agents cannot be relied upon as correctly
stating the representations of Roehrig Engineering in connection with the system. Refer to this purchase order, any exhibits hereto and
any written materials supplied by Roehrig Engineering for correct representations.
4.14 PURCHASER ACKNOWLEDGES THAT IT HAS PURCHASED THE SYSTEM BASED UPON ITS OWN KNOWLEDGE OF
THE USES TO WHICH THE SYSTEM WILL BE PUT. ROEHRIG ENGINEERING SPECIFICALLY DISCLAIMS ANY
WARRANTY OR LIABILITY RELATED TO THE FITNESS OF THE SYSTEM FOR ANY PARTICULAR PURPOSE OR
ARISING FROM THE INABILITY OF THE PURCHASER TO USE THE SYSTEM FOR ANY PARTICULAR PURPOSE.
5.0 Design Changes
5.1 The Dynamometer, the Software, and the System are subject to changes in design, manufacture and programming
between the date of order and the actual delivery date. Roehrig Engineering reserves the right to implement such
changes without the Purchaser’s consent; however, nothing contained herein shall be construed as obligating Roehrig
Engineering to include such changes in the Dynamometer, Software, or System provided to the Purchaser.
6.0 Non-Disclosure
6.1
All Software including, without limitation, any Roehrig Engineering special user programs, provided to the Purchaser as part of the
system, either at the time of or subsequent to the delivery of the Dynamometer, is the intellectual property of Roehrig Engineering.
The Purchaser shall not reproduce or duplicate, disassemble, decompile, reverse engineer, sell, transfer or assign, in any manner the
Software or permit access to or use thereof by any third party. The Purchaser shall forthwith execute any further assurances in the
form of non-disclosure or licensing agreements which may reasonably be required by Roehrig Engineering in connection with the
software.
7.0 Entire Agreement / Governing Law / Misc. / Guarantee
7.1
7.2
7.3
7.4
7.5
These Purchase conditions constitute the entire agreement between Roehrig Engineering and the Purchaser in respect to the Product.
There are no representations or warranties by Roehrig Engineering, express or implied, except for those herein contained and these
conditions supersede and replace any prior agreements between Roehrig Engineering and the Purchaser.
No representative of Roehrig Engineering has any authority to modify, alter, delete or add to any of the terms or conditions hereof.
Any such modifications shall be absolutely void unless made by instrument in writing properly executed by an actual authorized
employee or agent of Roehrig Engineering.
The terms and conditions hereof shall be binding upon Roehrig Engineering and the Purchaser, and shall not be construed in
accordance with the laws of the State of North Carolina, United States of America.
Roehrig Engineering shall be entitled to recover all of its reasonable fees and costs including, but not limited to, its reasonable
attorney’s fees incurred by Roehrig Engineering in connection with any dispute or litigation arising thereunder or in connection
herewith, including appeals and bankruptcy or creditor reorganization proceeds.
These conditions shall not be construed more strictly against one party that another as a result of one party having drafted said
instrument.
109
8.0 Definitions
8.1
8.2
8.3
8.4
8.5
8.6
8.7
“Roehrig Engineering” means Roehrig Engineering, Inc.
“Purchaser” means the party buying the Product who is legally obligated hereunder.
“Software” means all computer programs, including diskettes containing such computer programs sold pursuant to the Order.
“Product” means the Dynamometer, the Software, operating manuals and any other product or merchandise sold pursuant to the
Order.
“System” means a combination of the Dynamometer, the Software, the Computer, and optional parts associated with the
Dynamometer.
“Purchase Order” means the original document issued from the Purchaser to Roehrig Engineering, listing all parts and/or services to
be purchased and the agreed purchase price.
“Warranty Transfer Form” means a document to be completed for the transfer of the Roehrig Engineering Warranty. This document
is available from Roehrig Engineering upon request.
9.0 Software License Agreement
The Software License Agreement is part of the Operating Manual for the product and software System that you have purchase from Roehrig
Engineering, Inc. (collectively, the “Licenser”). By your use of the software you are agreeing to the terms and conditions of this Software
License Agreement. Throughout this Software License Agreement, the term “Licensee” means the owner of the System.
9.1
The Licenser hereby grants the Licensee the non exclusive right to use the computer software described in this Operating Manual (the
“Software”). The Licensee may sell the software key but may not assign, sub-license, rent or lease the Software to any third party
without the Licenser’s prior written consent.
9.2 The Licenser further grants the Licensee the right to make a backup copies of the Software media and use the software in demo mode.
The Licensee agrees that it will not decompile, disassemble, reverse engineer, copy, transfer, or otherwise use the Software except as
permitted by this section.
9.3 The Licensee is licensed to use the Software only in the manner described in the Operating Manual. Use of the Software in a manner
other than that described in the Operating Manual or use of the Software in conjunction with any non-Licenser product which
decompiles or recompiles the Software or in any other way modifies the structure, sequence or function of the Software code, is not an
authorized use, and further, such use voids the Licenser’s Warranty as set forth below.
9.4 The only warranty with respect to the Software and the accompanying written materials is the warranty, if any, set forth in the
Quotation/Purchase Order and Service Policy pursuant to which the Software was purchased from the Licenser.
9.5 THIS WARRANTY IS IN LIEU OF OTHER WARRANTIES, EXPRESS OR IMPLIED, INCLUDING, BUT NOT LIMITED
TO, THE IMPLIED WARRANTIES OF MERCHANTABILITY AND FITNESS FOR A PARTICLUAR PURPOSE WITH
RESPECT TO THE SOFTWARE AND WRITTEN MATERIALS. IN NO EVENT WILL THE LICENSER BE LIABLE FOR
DAMAGES, INCLUDING ANY LOST PROFITS RO OTHER INCIDENTAL OR CONSEQUENTIAL DAMAGES ARISING
OUT OF THE USE OR INABILITY TO USE THE SOFTWARE, NOTWITHSTANDING THAT THE LICNESER MAY HAVE
BEEN ADVISED OF THE POSSIBILITY OF SUCH DAMAGES, THE LICENSER WILL NOT BE LIABLE FOR ANY SUCH
CLAIM BY ANY OTHER PARTY.
In the event of any breach by the Licensee of this Agreement, the license granted hereby shall immediately terminate and the Licensee shall
return the Software media and all written materials, together with any copy of such media or materials, and the Licensee shall keep no copies
of such items.
The interpretation of this Agreement shall be governed by the following provisions:
A. This agreement shall be construed pursuant to and governed by the substantive laws of the State of North Carolina (and any
provision of North Carolina laws shall not apply if the law of a state or jurisdiction other than North Carolina would
otherwise apply).
B. If any provision of this Agreement is determined by a court of competent jurisdiction to be void and non-enforceable, such
determination shall not affect any other provision of this Agreement, and the remaining provisions of this Agreement shall
remain in full force and effect. If any provision or term of this Agreement is susceptible to two or more constructions or
interpretations, one or more of which would render the provision or term void or non-enforceable, the parties agree that a
construction or interpretation which renders the term of provision valid shall be favored.
C. This Agreement constitutes the entire Agreement, and supersedes all prior agreements and understandings, oral and written,
among the parties to this Agreement with respect to the subject matter hereof.
9.8 If a party engages the service of an attorney or any other third party or in any way initiates legal action to enforce its rights under this Agreement,
the prevailing party shall be entitled to recover all reasonable costs and expenses (including reasonable attorney’s fees before trial and in appellate
proceedin
110