1
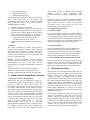
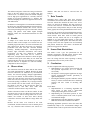
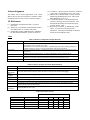
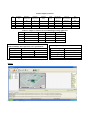
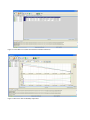
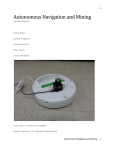
Implementing a Wireless Sensor Network Using MEMSIC’S Professional Kit Stephen Ellis, Lorson Blair and Yenumula B Reddy Department of Computer Science, Grambling state University, LA 71245, USA. Abstract - The research focuses on configuring MEMSICs professional kit to study the temperature, light, and humidity in a specific environment. The study involves the implementation of wireless sensor networks using Motes with specific requirements. We developed custom program application to target specific environmental elements specifically light and temperature (humidity, pressure, and other elements are not provided in this paper). By reconfiguring the database properties and base-station activity, we interact with the MoteView monitoring software and stored the results of incoming data. The experimental results are provided with appropriate tables and figures. Keywords: MEMSIC’S Professional, Wireless Sensor Network, MoteView, monitoring and collection of data. 1. Introduction A Wireless Sensor Network (WSN) is a new technology that is utilized in data collection and monitoring fields. It is defined as a set of nodes that are organized into a cooperative network. In this project, we implemented a wireless sensor network using MEMSICS Professional Kit for Wireless Sensor Networks. The project is divided into two parts. Firstly, we aimed to achieve the network functionality. In achieving network functionality, we studied the operation of the motes (how they collect and transfer data, how they connect to each other and the base station etc) and software used to collect, retrieve, and view data. Further, we studied the interfaces used to program the motes. After initial network setup and collection of data, we developed a system to monitor light and temperature in four rooms in the TL James building, at Grambling State University. As a result, we programmed four of the motes with a custom program that collects and reports only light and temperature (humidity temperature) back to the base station. Visualization software (MoteView) provided by MEMSIC was used to view and analyze the data. The references [1-3] provide the documentation for the MEMSIC professional kit. The sensor network concepts and some of the implementation methodologies are observed in [4-7]. Sensor networks are used flood control, agriculture, forest fire detection, temperature control, and parking identification. Today, sensors are every part of the instrument, war fields, and medical studies. The literature demonstrates the applications of sensors are unlimited. 1.1 Objectives To implement a WSN using MEMSIC motes accomplished by first understanding and setting up a simple network, monitoring and analyzing data transfer and implementing a monitoring system that collects light and temperature (humidity temperature) data and the procedure of the data sent back to the base station. To develop a light and temperature monitoring system using MEMSIC Professional Kit for WSN involves the reprogramming of the motes to get them to collect only light and temperature data (humidity temperature) and transfer the data to the base station. It requires completing three major tasks. We modified the custom programs to collect and transmit only light and humidity temperature to the base station. In the second step, the newly modified programs are compiled and downloaded to all the motes. Finally, we used MoteView to monitor the system. 1.2 Restrictions Implementation of modified data sampling application for a wireless sensor network leads a restriction on the client tier. MoteView, the software used to monitor the system, didn’t allow any new applications to be added to its usable interface or the addition of a new relation in its database for data storage. 2. Hardware and software Requirements 2.1. Hardware The implementation of the sensor network requires specific hardware supplied by MEMSICS. The MEMSICS Professional Kit consists of the following hardware: 6 Sensor Nodes 1 Base Station Processor/Radio Module 1 Data Acquisition Board 1 USB Programming Board The specification of each hardware device is shown in the Table 1. The sensor nodes, the base station, USB programming board along with the additional hardware given below were used to set up of the network. Additional hardware includes: Batteries to power the sensor nodes. A laptop computer to connect the base station and used for data collection and analysis. The laptop was also was used to write the programs for the notes as well as upload these programs to the nodes. It should have the following minimum requirements: - 1 GB of free space in the destination drive. - 550 MB of free space in the C drive. USB extension cables to connect the devices to the laptop. 2.3 Software The sensor networking kit includes several software packages that are needed to connect the motes, collect and analyze data, write and compile programs for the nodes, and upload these programs to the nodes. The list of software and their function (that are of importance to this project) are shown in Table 2. MEMSIC provides additional software packages; however, only those listed above were used in our initial implementation and study of the WSN and the implementation of the light and temperature monitoring system. To install the above software (with the exception of XMesh), the laptop needed to be programmed with Windows XP Professional Service Pack 2 (XP-Pro SP2). 3. Initial Network Setup/Data Collection 3.1 Topology Overview and Background XMesh allows the motes to automatically connect in a mesh network topology. A mesh network is a multi-hop network in which all nodes (sensor motes) can communicate with each other to route data to and from a base station. Mesh networks provide multiple routes for data transfer and are highly fault tolerant. They also allow networks to expand over unlimited distances and allow nodes to converse energy. XMesh provides a TrueMesh networking service that is both self-organizing and selfhealing. It can broadcast within a single area of coverage or arbitrarily between any two nodes or cluster. It offers quality of service (QOS) either by link level acknowledgement (best effort) or by end-to-end acknowledgement (guaranteed delivery). XMesh can also be configured in various power modes including high power (HP), low power (LP), and extended low power (ELP). Other features of XMesh include multiple transport services, health diagnostic, time synchronization, and over-the-air programming (OTAP) [3]. Each wireless sensor is programmed to measure humidity, humidity temperature, present temperature, pressure, light, vertical acceleration (y-axis), and horizontal acceleration (x-axis). These nodes have also been programmed to follow XMesh protocol. 3.2 Configuring the Client Tier 3.2.1 Primary Option To set up the network, the necessary software had to be installed on the laptop computer to provide the interface to communicate with the nodes and collect and analyze data. MoteWorks (and all its components) and MoteView (and all its components) were successfully installed on the laptop with the Windows XP SP2 operating system. 3.2.2 Alternate Option Using a preconfigured version of the OS Windows XP SP2 on a virtual machine such as VMware Player or Virtual Box provides a solution to combine the capability of the needed operating system Windows XP SP2 with newer versions of Windows or Linux simultaneously. 3.3 Network Deployment/Configuring the Mote Tier Only four motes were used for the initial setup. The motes were powered up and placed at different locations. The location of the motes and the approximate distance between each and the base station is given in the Table 3. 4. Collecting Live Data With the motes in their desired location, MoteView was opened, and the “Connect to WSN” button was clicked to collect live data. In the “Mode” option the operation, “Acquire Live Data”, was selected from the “Select Operation Mode” options and “Local” was selected from the “Select Acquisition Mode” options. In the “Gateway” option/tab, the interface board MIB520, the serial port COM4, and the baud rate 56700 were all selected from the relevant drop down menus. Next, in the “Sensor Board” option, XMTS400 was selected as the sensor application. The “Done” button was then clicked and this initiated data collection. Once live data collection was started, the behavior of the network was monitored. A snap shot of the network topology, with present temperature selected as the data being collected is shown in Figure 1. (N.B. Initial data collection can be stopped by simply clicking the “Stop XServe” button on the top MoteView interface. Data collection can be restarted by checking the “Live” checkbox, and clicking the “Start XServe” button.). The different categories of data were being sent from the motes to the base station every 10 seconds. Data was collected over a 30 minute period. The default sampling rate for high power applications is 2 seconds, while the default for low-power applications is 3 minutes. The minimum sampling rate that can be applied to the motes is 300 milliseconds. In addition to collecting data of environmental conditions, the motes also send health information about themselves. The health information includes data on how well the network is performing with respect to radio traffic, battery voltage, and parent’s node Radio Signal Strength Indicator. Nodes also send health information for their neighbors. 5. Results A sample set of results from the first deployment is shown in Table 4 and a sample set of results from our modified program in Table 5. Given the environment, the data collected over the time period was very consistent, predictable and valid. The data collected included humidity, humidity-temperature, current-temperature, pressure, light, horizontal acceleration, and vertical acceleration. All data were displayed in standard engineering units. This result can be viewed in MoteView. A snapshot of this interface is shown in figure 2. MoteView also gives us the ability to view charts and graphs of the data. You can select the data set you want to view the chart for. A snapshot of a chart for humidity temperature is shown in Figure 3. 6. Observations The connections between the motes and the base station were made automatically by XMesh. Because the mesh network connections are influenced by environmental factors, the network topology changed approximately once every two minutes. In some instances, the topology change may lead the motes 7654 and 7653 connected to motes 7651 and 7651 respectively. This frequent change in network topology is XMesh’s way of trying to find the most efficient route for data transfer. The frequency of the change is also due to the fact that the motes are relatively close to each other. Thus, either route connection would not cause a drop in efficiency. Another observation made was that the transfer of data from mote 7653 to mote 7651 then to the base station was relatively efficient, with an average failure rate of 2.5%. Further, the transfer of data from motes directly connected to the base station had an average failure rate 1.5%. Because all the motes were located in the same environment, the data collected over the 30 minute period was very consistent. Data collected were stored in a database. This data can then be retrieved later for analysis. 7. Data Transfer Individual motes collect data from their respective environments and forward these data to the base station. The base station then transfers the data to the server, where it is stored in the database. The data can then be viewed at the client tier via MoteView. MoteView also provides tools to help with the analysis of data, drawing charts, graphs, and viewing the health status of the motes. The motes also generate and forward health data packets. Health data allow us to monitor the health or state of the mesh network. Each mote sends its health packets towards the base station and also to its neighbor. In addition to its own health data packets, a mote also transfers a neighbor health packet. This allows the motes to keep track of the most optimal route for forwarding data packets towards the base station. All health data packets are logged to the database. 8. Sensor Data Restrictions The Tables 6 and 7 give the specification for the humidity, temperature, and light sensors, the three main sensors of importance to our monitoring system. Note: the voltage that the sensor operating is directly proportionate to the accuracy of the results. 9. Conclusions We have completed the following objectives: Implementing a live wireless sensor network and the specified requirements for it to function successfully. Developed a custom program application to target specific environmental elements specifically as light and temperature. Reconfigured database properties and Base station activity to interact with the MoteView monitoring software and store results of incoming data packets. Future Work: Implementation of a Clustering Algorithm and allow fusing of data from a cluster-head consequently cutting down network traffic. Implementing the event-based protocol to force motes to send data packets in the event of specific environmental changes. Implementation of Security Measures to identify Malicious Nodes and avoid them in the WSN. Identifying algorithmic patterns to allow the motes that automatically adapt to the environmental changes and determine drastic events to report back to the base station. [4] J. Stankovic, “Wireless Sensor Networks”, Handbook of Real-Time and Embedded Systems, CRC, 2007. [5] Martin Turon., “MOTE-VIEW: A sensor Network Monitoring and Management Tool”, The Second IEEE Workshop on, pp 11-18 . [6] J. Suh and M. Horton., “Current Hardware and software Technology for sensor Networks”, First International Workshop on Networked Sensing Systems (INNS)”, 2004. [7] R.Szewczyk, J. Polastre, A. MainWaring, and D. Culler., “Lessons from a Sensor Network Expedition”, first Europian Workshop on Wireless Sensor Networks (EWSN), 2004. Acknowledgement The authors wish to express appreciation to Dr. Connie Walton, Provost, and Vice President of Academic Affairs, Grambling State University for their continuous support. 10. References [1] “MoteWorks Getting Started Guide”, Crossbow, April 2007. [2] “MoteView Users Manual”, Document Part Number: 7430-0008-05 Rev A, Crossbow, May 2007. [3] “XMesh MoteConfig USER MANUAL”. MEMSIC, Inc. Document Part Number: 7430-0112-02 Rev A. Tables Table 1 Hardware Components and Specifications Devices Components and Description Sensor Nodes -IRIS Processor Radio Module - modules to enable the low-power wireless sensor networks measurement system. Available in 2.4 GHz. -MTS400 Basic Environmental Sensor Board – MTS400 multi-sensor board including temperature, humidity, barometric pressure, acceleration and ambient light sensing capabilities. -IRIS Processor/Radio Module – module functioning as a base station when connected to the USB PC interface. -MIB520 USB Programming Board – provides a USB Interface for data communications. IRIS Reference Board MDA300 Data Acquisition Board – high performance data acquisition board with up to 11 channels of 12-bit ADC analog input and onboard temperature and humidity sensors. MIB520 USB Programming Board – provides a USB Interface for data communications. Base Station Processor/Radio Module Data Acquisition Board USB Programming Board Table 2 Software Packages used in the implementation. Software XMesh TinyOS and MoteWorks NesC compiler Cygwin XSniffer MoteConfig MoteView Programmer’s Notepad 2 Function Multi hop networking protocol installed on each node. An event-driven OS for wireless sensor networks. It also provides tools for debugging. An extension of the C-language designed for TinyOS. A Linux-like environment for Windows. Network Monitoring Tool for the RF environment GUI environment for Mote Programming and Over the Air Programming (OTAP). An interface between a user and a deployed network of wireless sensors. Provides the tools to simplify deployment and monitoring. A simple IDE for nesC code. Table 3 Placement of nodes Distance from (in meters) Node ID Base Station 7251 7252 7253 7254 Location (Room #) 131 131 132 Lobby Copy Room Base Station 5 15 30 15 7251 5 10 25 10 7252 15 10 15 10 7253 35 15 10 15 7254 15 20 15 15 Table 4 Sample Set of Data ID Humidity (%) 7651 7652 7653 7654 45.65 48.79 48.53 43.97 Humiditytemperature (C) 23.71 24.89 23.07 24.32 Pressuretemperature (C) 23.87 24.91 23.25 24.78 Pressure (mba) Light (Lux) 1006.3 1005.89 1005.69 1005.59 308.89 294.17 514.3 285 Horizontal acceleration (m/s^2) 3.332 20.384 0.196 0 Vertical dacceleration (m/s^2) -30.772 -24.5 -0.196 0 Time 10/24/2011 PM 5:05:06 5:05:06 5:05:06 5:05:06 Table 5 A sample set of data from our modified light sensing application Id 7653 7652 7654 7651 Time 2/29/2012 15:25 2/29/2012 15:25 2/29/2012 15:25 2/29/2012 15:25 parent 0 0 0 0 Table 6 Humidity and temperature sensor specifications Sensor Type Channels Range Accuracy Operating Range Interface Sensirion SHT11 Humidity Temperature 0 to 100% -40°C to 80°C ± 3.5% RH (typical) ± 2°C 3.6 to 2.4 volts Digital interface Figures Figure 1. Network Topology voltage [V] 2.5506 2.5249 2.5454 2.5351 lightc [lux] 8.51 10.35 24.61 11.27 Table7 Light sensor specifications Sensor Type Channels Range Operating Range Interface Taos TSL2550 Light 400 – 1000 nm 3.6 to 2.7 volts Digital interface Figure 2. Tab in Mote-View (Data collected from initial data collection) Figure 3. Mote-View chart for humidity temperature