1
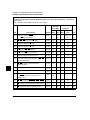
About this Manual
We’ve added this manual to the Agilent website in an effort to help you support
your product. This manual is the best copy we could find; it may be incomplete
or contain dated information. If we find a more recent copy in the future, we will
add it to the Agilent website.
Support for Your Product
Agilent no longer sells or supports this product. Our service centers may be able
to perform calibration if no repair parts are needed, but no other support from
Agilent is available. You will find any other available product information on the
Agilent Test & Measurement website, www.tm.agilent.com.
HP References in this Manual
This manual may contain references to HP or Hewlett-Packard. Please note that
Hewlett-Packard's former test and measurement, semiconductor products and
chemical analysis businesses are now part of Agilent Technologies. We have
made no changes to this manual copy. In other documentation, to reduce
potential confusion, the only change to product numbers and names has been in
the company name prefix: where a product number/name was HP XXXX the
current name/number is now Agilent XXXX. For example, model number
HP8648A is now model number Agilent 8648A.
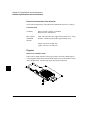
User’s Guide for the Terminal Interface
HP 64751
68340 Emulator and
Emulation Bus Analyzer
Notice
Hewlett-Packard makes no warranty of any kind with regard to this material,
including, but not limited to, the implied warranties of merchantability and
fitness for a particular purpose. Hewlett-Packard shall not be liable for errors
contained herein or for incidental or consequential damages in connection with the
furnishing, performance, or use of this material.
Hewlett-Packard assumes no responsibility for the use or reliability of its software
on equipment that is not furnished by Hewlett-Packard.
© Copyright 1987, 1992, 1993, 1996 Hewlett-Packard Company.
This document contains proprietary information, which is protected by copyright.
All rights are reserved. No part of this document may be photocopied, reproduced
or translated to another language without the prior written consent of
Hewlett-Packard Company. The information contained in this document is subject
to change without notice.
Advancelink, Vectra, and HP are trademarks of Hewlett-Packard Company.
IBM and PC AT are registered trademarks of International Business Machines
Corporation.
MS-DOS is a trademark of Microsoft Corporation.
UNIX is a registered trademark of UNIX System Laboratories Inc. in the U.S.A.
and other countries.
Hewlett-Packard
P.O. Box 2197
1900 Garden of the Gods Road
Colorado Springs, CO 80901-2197, U.S.A.
RESTRICTED RIGHTS LEGEND Use, duplication, or disclosure by the U.S.
Government is subject to restrictions as set forth in subparagraph (c) (1)(ii) of the
Rights in Technical Data and Computer Software Clause at DFARS 252.227-7013.
Hewlett-Packard Company, 3000 Hanover Street, Palo Alto, CA 94304 U.S.A.
Rights for non-DOD U.S. Government Departments and Agencies are as set forth
in FAR 52.227-19(c)(1,2).
2
Printing History
New editions are complete revisions of the manual. The date on the title page
changes only when a new edition is published.
A software code may be printed before the date; this indicates the version level of
the software product at the time the manual was issued. Many product updates and
fixes do not require manual changes, and manual corrections may be done without
accompanying product changes. Therefore, do not expect a one-to-one
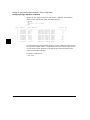
correspondence between product updates and manual revisions.
Edition 1
Edition 2
Edition 3
Edition 4
64751-97000, March 1992
64751-97002, March 1993
64751-97004, December 1993
64751-97006, October 1996
Safety, Certification and Warranty
Safety and certification and warranty information can be found at the end of this
manual on the pages before the back cover.
3
68340 Emulation and Analysis
The HP 64751 68340 Emulator replaces the 68340 microprocessor in your
embedded microprocessor system, also called the target system, so that you can
control execution and view or modify processor and target system resources.
The emulator can be used with the HP 64704 Emulation Bus Analyzer or the
HP 64794 Deep Memory Emulation Bus Analyzer which capture 80 channels of
emulation processor bus cycle information synchronously with the processor’s
clock signal. This analyzer is called the emulation analyzer.
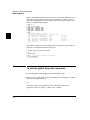
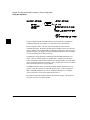
With the Emulator, You Can ...
•
•
•
•
Plug into 68340 target systems with Pin Grid Array (PGA) sockets.
Download programs into emulation memory or target system RAM.
Display or modify the contents of processor registers and memory resources.
Run programs at clock speeds up to 25 MHz (with active probe boards
64751-66508 and higher — up to 16.78 MHz with boards 64751-66506 and
lower), set up software breakpoints, step through programs, and reset the
emulation processor.
With the Analyzer, You Can ...
•
•
•
•
•
•
4
Trigger the analyzer when a particular bus cycle state is captured. You can
also trigger the analyzer after a state has occurred a specified number of times.
States are stored relative to the trigger state.
Qualify which states get stored in the trace.
Prestore certain states that occur before each qualified store state.
Trigger the analyzer after a sequence of up to 8 different events have occurred.
Capture data on signals of interest in the target system.
Cause the emulator to stop program execution when the analyzer finds its
trigger condition.
With the HP 64700 Card Cage, You Can ...
•
•
Use the RS-422 capability of the serial port and an RS-422 interface card on
the host computer (for example, the HP 98659 for the HP 9000 or the
HP 64037 for the PC) to provide upload/download rates of up to 230.4K baud.
Easily upgrade HP 64700 firmware by downloading to flash memory.
With Multiple HP 64700s, You Can ...
•
•
•
Start and stop up to 16 emulators at the same time (up to 32 if modifications
are made).
Use the analyzer in one HP 64700 to arm (that is, activate) the analyzers in
other HP 64700 card cages or to cause emulator execution in other HP 64700
card cages to break.
Use the HP 64700’s BNC connector to trigger an external instrument (for
example, a logic analyzer or oscilloscope) when the analyzer finds its trigger
condition, or you can allow an external instrument to arm the analyzer or break
emulator execution.
5
In This Book
This book describes the HP 64751 68340 emulator and the HP 64704 analyzer. It
is organized into five parts whose chapters are described below.
Part 1. Quick Start Guide
Chapter 1 presents an overview of emulation and analysis and quickly shows
you how to use the emulator and analyzer.
Part 2. User’s Guide
Chapter 2 shows you how to plug the emulator into target systems.
Chapter 3 shows you how to enter Terminal Interface commands and display
HP 64700 system information.
Chapter 4 shows how to use the emulator.
Chapter 5 shows how to use the analyzer in the "easy" configuration.
Chapter 6 shows how to use the analyzer in the "complex" configuration.
Chapter 7 shows how to make coordinated measurements.
Part 3. Reference
Chapter 8 describes Terminal Interface commands.
Chapter 9 describes the error messages that can occur while using the Terminal
Interface and provides recovery information.
Chapter 10 lists the emulator specifications and characteristics.
Part 4. Concept Guide
Chapter 11 contains conceptual (and more detailed) information on various
topics.
Part 5. Installation Guide
Chapter 12 shows you how to install emulator and analyzer boards into the
HP 64700 Card Cage and how to connect the HP 64700 to a host computer or
terminal.
Chapter 13 shows you how to install or update emulator firmware. Follow these
instructions if you have ordered the HP 64751 emulator and the HP 64748C
emulation control card separately.
6
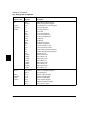
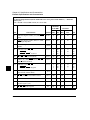
Contents
Part 1 Quick Start Guide
1
Quick Start
The 68340 Emulator — At a Glance 20
Step 1. Log in to the emulator 22
Step 2. Set up the quick start demo program 23
Step 3. Display the memory map 24
Step 4. Display the program symbols 25
Step 5. Display the demo program in memory 26
Step 6. Set up initial values for SSP and PC 27
Step 7. Run the demo program 28
Step 8. Trace demo program execution 29
Step 9. Stop (break from) program execution 32
Step 10. Set a software breakpoint 33
Step 11. Display processor registers 34
Step 12. Step through program execution 35
Step 13. Reset the emulator 36
If the emulator status character is unfamiliar 36
Part 2 User’s Guide
2
Plugging into a Target System
Connecting the Emulator to the Target System
41
Step 1. Turn OFF power 42
Step 2. Unplug probe from demo target system 42
Step 3. Select the emulator clock source 43
Step 4. Plug the 68340 emulator probe into the target system
48
7
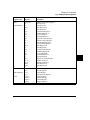
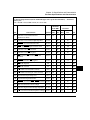
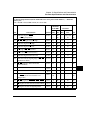
Contents
Connecting to a 68340 PGA package 48
Connecting to a QFP package 49
Connecting to a 144-pin TQFP package 54
Step 5. Turn ON power 56
Configuring for Operation with Your Target System
To select the emulator’s clock source 58
To set the initial SSP and PC values 59
To restrict to real-time runs 59
To turn OFF the restriction to real-time runs
Selecting the Emulation Monitor
60
61
To select the background monitor 63
To select a foreground monitor program 63
To use a custom foreground monitor program
3
66
Using the Terminal Interface
Accessing HP 64700 System Information
73
To access on-line help information 73
To display version information 77
Entering Commands
78
To enter multiple commands on one command line
To recall commands 79
To edit commands 79
To repeat commands 80
To enter multiple commands with macros 81
To use command files over LAN 82
4
Using the Emulator
Initializing the Emulator
85
To initialize the emulator 85
To display emulator status information
87
Using the Emulator Configuration Registers
To view the SIM register differences 91
To synchronize to the 68340 SIM registers
8
78
92
88
57
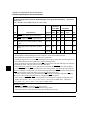
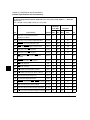
Contents
To synchronize to the emulator configuration registers
Mapping Memory
92
93
To map memory ranges 94
To display the memory map 97
To characterize unmapped ranges 97
To delete memory map ranges 98
To map memory ranges that use function codes
To emulate global chip select operation 100
Loading Absolute Files
98
104
To load absolute files over the serial port 105
To load absolute files over the LAN 105
To load absolute files into memory mapped with function codes
Loading and Using Symbols
109
To load symbol files over the serial port
To load symbols over the LAN 111
To define user symbols 112
To display symbols 112
To remove symbols 114
Executing User Programs
107
109
115
To run (execute) user programs 115
To stop (break from) user program execution
To step through user programs 116
To reset the emulation processor 119
Using Software Breakpoints
116
120
To enable the breakpoints feature 121
To set software breakpoints 121
To display software breakpoints 121
To enable software breakpoints 122
To disable software breakpoints 122
To remove software breakpoints 122
To disable the breakpoints feature 123
Using Break Conditions
To break on writes to ROM
124
124
9
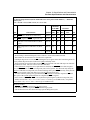
Contents
To break on an analyzer trigger
Accessing Registers
125
126
To display register contents 126
To display a register in expanded format
To modify register contents 129
Accessing Memory
130
To set the display and access modes
To display memory contents 131
To modify memory contents 132
To copy memory contents 133
To search memory 133
5
128
130
Using the Emulation Analyzer - Easy Configuration
Initializing the Analyzer
To initialize the analyzer
To display trace activity
137
137
137
Qualifying the Analyzer Clock
To trace background cycles
139
139
Starting and Stopping Traces
141
To start a trace measurement 142
To display the trace status 143
To halt a trace measurement 144
Displaying Traces
145
To display the trace 145
To change the trace display format
150
Qualifying Trigger and Store Conditions
To qualify the trigger state 156
To trigger on a number of occurrences of some state
To change trigger position in the trace 158
To qualify states stored in the trace 158
To activate and qualify prestore states 159
To change the count qualifier 160
10
151
157
Contents
Using the Sequencer
163
To reset the sequencer 165
To display the sequencer specification 166
To specify primary and secondary branch expressions
To add or insert sequence terms 169
To delete sequence terms 170
6
166
Using the Emulation Analyzer - Complex Configuration
Switching into the Complex Configuration
To switch into the complex analyzer configuration
To switch back into the easy analyzer configuration
Using Complex Expressions
173
173
173
174
To assign state qualifiers to trace patterns 174
To assign state qualifiers to the trace range 175
To combine pattern and range resources 175
Using the Sequencer
178
To reset the sequencer 179
To specify a simple trigger condition 181
To specify primary and secondary branch expressions
To specify the trigger term 183
To specify storage qualifiers 184
To trace windows of activity 185
7
182
Making Coordinated Measurements
Setting Up for Coordinated Measurements
To connect the Coordinated Measurement Bus (CMB)
To connect to the rear panel BNC 197
Starting/Stopping Multiple Emulators
195
195
199
To enable synchronous measurements 199
To start synchronous measurements 200
To disable synchronous measurements 200
11
Contents
Using External Trigger Signals
201
To arm analyzers with external trigger signals 202
To break emulator execution with external trigger signals 203
To send analyzer trigger output signals to external lines 204
Part 3 Reference
8
Commands
<addr> - address specification in the 68340 emulator 209
b - break emulation processor to monitor 211
bc - set or display break conditions 212
bnct - specify control of rear panel BNC signal 214
bp - set, enable, disable, remove or display software breakpoints 216
cf - display or set emulation configuration 218
cl - set or display command line editing mode 223
cmb - enable/disable Coordinated Measurement Bus run/break 225
cmbt - specify control of the rear panel CMB trigger signal 227
cp - copy memory block from source to destination 229
demo - demo program 230
dt - display or set current date and/or time 231
dump - upload processor memory in absolute file format 232
echo - evaluate arguments and display results 234
equ - define, display or delete equates 236
es - display current emulation system status 238
<expr> - analyzer state qualifier expressions 239
help, ? - display help information 243
init - reinitialize system 244
lan - set configuration parameters 246
lanpv - performance verification on LAN interface 247
load - download absolute file into processor memory space 248
m - display or modify processor memory space 250
mac - display, define, or delete current macros 252
map - display or modify the processor memory map 254
mo - set or display current default mode settings 257
po - set or display prompt 258
pv - execute the system performance verification diagnostics 259
12
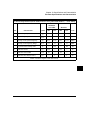
Contents
r - run user code 260
reg - display and set registers 261
rep - repeat execution of the command list multiple times 265
rst - reset emulation processor 266
rx - run at CMB-execute 267
s - step emulation processor 268
ser - search through processor memory for specified data 270
stty - set or display current communications settings 272
sym - define, display or delete symbols 275
sync - synchronize emulator 278
t - start a trace 279
ta - current status of analyzer signals is displayed 280
tarm - specify the arm condition 281
tcf - set or display trace configuration 283
tck - set or display clock specification for the analyzer 285
tcq - set or display the count qualifier specification 287
telif - set or display secondary branch specification 289
tf - specify trace display format 292
tg - set and display trigger condition 294
tgout - specify signals to be driven by the analyzer 296
th - halt the trace 298
tif - set or display primary sequence branch specifications 300
tinit - initialize emulation analyzer to powerup defaults 303
tl - display trace list 305
tlb - define and display trace labels 308
tp - set and display trigger position within the trace 310
tpat - set and display pattern resources 311
tpq - set or display prestore specification 313
trng - set or display range pattern 314
ts - display status of emulation trace 316
tsck - set or display slave clock specification for the analyzer 320
tsq - modify or display sequence specification 322
tsto - set or display trace storage specification 325
tx - enable/disable execute condition 327
<value> - values in Terminal Interface commands 328
ver - display system software and hardware version numbers 330
w - wait for specified condition before continuing 331
x - emit a Coordinated Measurement Bus execute signal 332
9
Error Messages
Emulator Error Messages
334
13
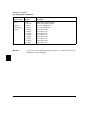
Contents
68340 Emulator Messages 338
General Emulator and System Messages
Analyzer Messages 371
345
10 Specifications and Characteristics
Emulator Specifications and Characteristics
382
Electrical 382
Physical 394
Environmental 396
Part 4 Concept Guide
11 Concepts
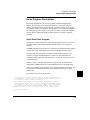
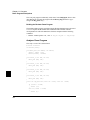
Demo Program Descriptions
401
Quick Start Demo Program 401
Emulator Demo Program 405
Analyzer Demo Program 406
Part 5 Installation Guide
12 Installation
Installation at a Glance 412
Step 1. Connect the Emulator Probe Cables 415
Step 2. Install Boards into the HP 64700 Card Cage 418
Step 3a. Connect the HP 64700 via RS-232/RS-422 431
Step 3b. Connect the HP 64700 via LAN 435
Step 4. Install emulation memory modules on emulator probe 437
Step 5. Plug the emulator probe into the demo target system 441
Step 6. Apply power to the HP 64700 443
14
Contents
If the HP 64700 does not provide the Terminal Interface prompt
To run PV on the LAN interface 450
Step 7. Verify emulator and analyzer performance 451
If performance verification fails 452
448
13 Installing/Updating Emulator Firmware
Step 1. Connect the HP 64700 to a PC host computer
Step 2: Install the firmware update utility 457
Step 3: Run "progflash" to update emulator firmware
Glossary
Index
455
459
463
467
15
16
Part 1
Quick Start Guide
17
Part 1
18
1
Quick Start
19
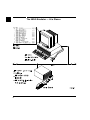
The 68340 Emulator — At a Glance
20
Chapter 1: Quick Start
The 68340 Emulator — At a Glance
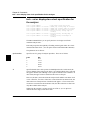
The tutorial examples presented in this chapter make the following assumptions:
•
The HP 64700 is connected to the same LAN as an HP 9000 Series 300 host
computer (refer to the "Installation" chapter).
•
Networking software is installed on your HP 9000 Series 300 host computer
(primarily telnet and ftp software).
•
You have installed the HP 64751 emulator and HP 64704 analyzer into the
HP 64700 card cage, and plugged the emulator probe into the demo target
system.
21
Chapter 1: Quick Start
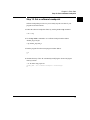
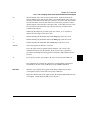
Step 1. Log in to the emulator
Step 1. Log in to the emulator
• Use the telnet command on the host computer to connect to the HP 64700.
$ telnet hostname
Where "hostname" is the name of the emulator. Or, you could use the Internet
Protocol (IP) address (or internet address) in place of the hostname:
$ telnet 15.35.226.210
You should see messages similar to:
Trying...
Connected to 15.35.226.210
Escape character is ’^]’.
After you connect to the emulator, you should see a prompt similar to:
R>
22
Chapter 1: Quick Start
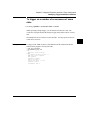
Step 2. Set up the quick start demo program
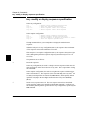
Step 2. Set up the quick start demo program
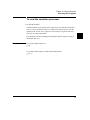
Make sure you begin this tutorial with the emulator in its default, power-up state by
initializing the emulator.
• Initialize all configuration items, define a new memory map, and load the quick
start demo program and its symbols by entering the demo command.
R>demo
R>
Notice that the emulation status character is "R" after the command. This shows
that the emulator is in its reset state.
23
Chapter 1: Quick Start
Step 3. Display the memory map
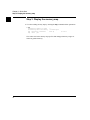
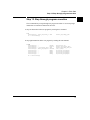
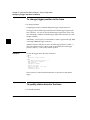
Step 3. Display the memory map
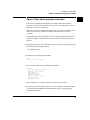
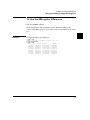
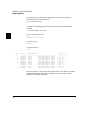
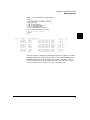
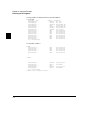
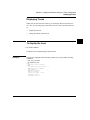
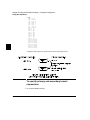
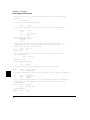
1 View the resulting memory map by entering the map command with no parameters.
R>map
# remaining number of terms
# remaining emulation memory
map 000000000..000000fff
map other grd
: 7
: 40000h bytes
eram dp
# term 1
The "other" term in the memory map specifies that unmapped memory ranges are
treated as guarded memory.
24
Chapter 1: Quick Start
Step 4. Display the program symbols
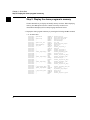
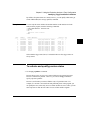
Step 4. Display the program symbols
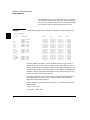
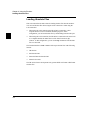
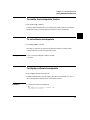
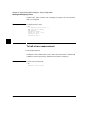
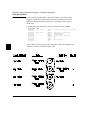
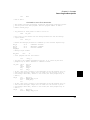
1 Display the symbols with the sym command.
R>sym
sym
sym
sym
sym
sym
sym
sym
sym
sym
sym
sym
sym
sym
sym
sym
sym
sym
sym
sym
Int_Cmd=00000042a
demo:Cmd_Input=000000500
demo:Top_of_Stack=000001000
demo:Loop=00000040e
demo:Main=000000400
demo:Stack=000000f00
demo:EndLoop=000000428
demo:Call_Int=00000041c
handle_msg:Cmd_B=00000044c
handle_msg:Msg_Dest=000000533
handle_msg:Cmd_I=00000045a
handle_msg:Again=00000046e
handle_msg:Fill_Dest=000000474
handle_msg:Msg_A=000000502
handle_msg:End_Msgs=000000533
handle_msg:Msg_B=000000513
handle_msg:Print_Msg=000000468
handle_msg:Cmd_A=00000043e
handle_msg:Msg_I=000000524
25
Chapter 1: Quick Start
Step 5. Display the demo program in memory
Step 5. Display the demo program in memory
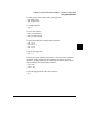
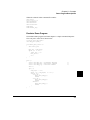
The m command lets you display and modify memory locations. When displaying
memory, the -dm option causes the contents of memory locations to be
disassembled and displayed in assembly language mnemonic format.
• Display the demo program in memory by entering the following m -dm command.
R>m -dm demo:Main..
000000400 demo:Main
000000406 00000040e demo:Loop
000000414 000000418 00000041c demo:Call_Int
000000420 000000428 demo:EndLoop
00000042a Int_Cmd
00000042e 000000432 000000436 00000043a 00000043e andle_msg:Cmd_A
000000444 000000446 00000044a 00000044c andle_msg:Cmd_B
000000452 000000454 000000458 00000045a andle_msg:Cmd_I
000000460 000000462 000000466 000000468 e_msg:Print_Msg
00000046e andle_msg:Again
000000470 000000474 e_msg:Fill_Dest
000000478 00000047c 00000047e -
26
MOVEA.L
MOVE.B
MOVE.B
BNE.W
BRA.W
BSR.W
MOVE.B
BRA.B
CMPI.B
BEQ.W
CMPI.B
BEQ.W
BRA.W
LEA
MOVEQ
BSR.W
RTS
LEA
MOVEQ
BSR.W
RTS
LEA
MOVEQ
BSR.W
RTS
LEA
MOVE.B
DBEQ
MOVE.B
CMPA.W
BNE.B
RTS
#$00001000,A7
#$00,demo:Cmd_Input
demo:Cmd_Input,D0
demo:Call_Int
demo:EndLoop
Int_Cmd
#$00,demo:Cmd_Input
demo:Loop
#$41,D0
handle_msg:Cmd_A
#$42,D0
handle_msg:Cmd_B
handle_msg:Cmd_I
handle_msg:Msg_A,A0
#$00000010,D1
handle_msg:Print_Msg
handle_msg:Msg_B,A0
#$00000010,D1
handle_msg:Print_Msg
handle_msg:Msg_I,A0
#$0000000E,D1
handle_msg:Print_Msg
handle_msg:Msg_Dest,A1
(A0)+,(A1)+
D1,handle_msg:Again
#$00,(A1)+
#$0553,A1
handle_msg:Fill_Dest
Chapter 1: Quick Start
Step 6. Set up initial values for SSP and PC
Step 6. Set up initial values for SSP and PC
After emulator initialization, the "reset values" configuration item (cf rv) sets the
initial values for the supervisor stack pointer and program counter to 1 and
0FFFFFFFFH, respectively. Since you cannot run the emulator when the
supervisor stack pointer and program counter are odd, you must use the cf rv
command to set up appropriate values.
The values you assign to the rv configuration item are placed into the supervisor
stack pointer and program counter on the entrance to the emulation monitor from
an emulation initiated RESET state (the R> prompt).
• Set the supervisor stack pointer to address 1000H and the program counter to 400H
by entering the following commands.
R>cf rv=1000,400
Upon the first transition from emulation reset into the emulation monitor, the
supervisor stack pointer register (A7) is set to 1000H and the program counter (PC)
is set to 400H.
27
Chapter 1: Quick Start
Step 7. Run the demo program
Step 7. Run the demo program
The r <addr> command causes the emulator to run from a particular address. The
entry address of the demo program is 400H and is specified by the symbol
"demo:Main".
• Execute the demo program by entering the r <addr> command.
R>r demo:Main
U>
Before the r command, the emulation status character (in the Terminal Interface
prompt) was "M" indicating that the emulator was in the monitor state. After the r
command, the emulation status character is "U" which indicates the emulator is
running the user program.
28
Chapter 1: Quick Start
Step 8. Trace demo program execution
Step 8. Trace demo program execution
The t (trace) command tells the analyzer to look at the data on the emulation
processor’s bus and control signals at each clock cycle. The information seen at a
particular clock cycle is called a state.
When one of these states matches the "trigger state" you specify, the analyzer stores
states in trace memory. When trace memory is filled, the trace is said to be
"complete."
The default trigger state specification is any state, so the t command will cause the
analyzer to "trigger" on the first state it sees and store the following states in trace
memory.
1 Specify the trigger state as the first instruction in the quick start demo program loop
by entering the following tg command.
U>tg addr=demo:Loop
2 Start the trace by entering the t command.
U>t
Emulation trace started
3 View the status of the trace by entering the ts command.
U>ts
--- Emulation Trace Status --NEW User trace complete
Arm ignored
Trigger in memory
Arm to trigger ?
States 512 (512) 0..511
Sequence term 2
Occurrence left 1
Notice that the trace is complete and that 512 states have been stored.
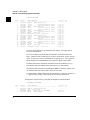
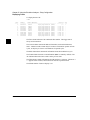
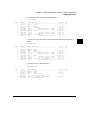
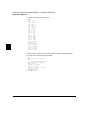
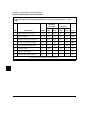
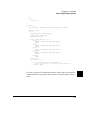
4 List the first twenty states stored in the trace (-t 20), with instructions disassembled
(-d) and symbols and addresses stored in the addr column (-e), by entering the
following tl command.
29
Chapter 1: Quick Start
Step 8. Trace demo program execution
U>tl -e -d -t 20
Line
----0
1
2
3
4
5
6
7
8
9
10
11
12
13
14
15
16
17
18
19
addr,H
-------emo:Loop
00000410
00000412
00000414
md_Input
00000416
00000418
0000041a
:EndLoop
Int_Cmd
emo:Loop
00000410
00000412
00000414
md_Input
00000416
00000418
0000041a
:EndLoop
Int_Cmd
68340 Mnemonic
---------------------------------------MOVE.B
demo:Cmd_Input,D0
$0000
supr prgm word rd (ds16)
$0500
supr prgm word rd (ds16)
BNE.W
demo:Call_Int
$00-supr data byte rd (ds16)
$0006
supr prgm word rd (ds16)
BRA.W
demo:EndLoop
$000E
supr prgm word rd (ds16)
BRA.B
demo:Loop
incomplete instr.: /0C00/????/
MOVE.B
demo:Cmd_Input,D0
$0000
supr prgm word rd (ds16)
$0500
supr prgm word rd (ds16)
BNE.W
demo:Call_Int
$00-supr data byte rd (ds16)
$0006
supr prgm word rd (ds16)
BRA.W
demo:EndLoop
$000E
supr prgm word rd (ds16)
BRA.B
demo:Loop
incomplete instr.: /0C00/????/
count,R
----------0.720 uS
0.720 uS
0.720 uS
0.720 uS
0.680 uS
0.960 uS
0.720 uS
1.080 uS
0.720 uS
0.720 uS
0.720 uS
0.720 uS
0.680 uS
0.720 uS
0.720 uS
0.960 uS
0.720 uS
1.080 uS
0.720 uS
seq
--+
.
.
.
.
.
.
.
.
.
.
.
.
.
.
.
.
.
.
.
The first column in the trace list contains the line number. The trigger state is
always on line number 0.
The second column contains the address information associated with the trace
states. Addresses in this column may be locations of instruction opcodes on fetch
cycles, or they may be sources or destinations of operand cycles. The -e option in
the tl command causes both addresses and symbols to appear in this column.
The third column shows mnemonic information about the emulation bus cycle.
The -d option in the tl command causes instructions to be disassembled.
The fourth column shows the count information (time is counted by default). The
"R" indicates that each count is relative to the previous state.
The fifth column contains information about the analyzer’s sequencer. Whenever a
"+" appears in this column, it means the state caused a sequencer branch.
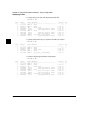
5 Display the dequeued trace by including the -od option in the tl command.
U>tl -od -e -d -t 20
Line
----0
3
6
30
addr,H
-------emo:Loop
=md_Input
00000414
00000418
68340 Mnemonic
---------------------------------------MOVE.B
demo:Cmd_Input,D0
src sdata rd:$00
BNE.W
demo:Call_Int NOT TAKEN
BRA.W
demo:EndLoop
count,R
----------2.160 uS
2.360 uS
seq
--+
.
.
Chapter 1: Quick Start
Step 8. Trace demo program execution
8
10
13
16
18
:EndLoop
emo:Loop
=md_Input
00000414
00000418
:EndLoop
BRA.B
demo:Loop
MOVE.B
demo:Cmd_Input,D0
src sdata rd:$00
BNE.W
demo:Call_Int NOT TAKEN
BRA.W
demo:EndLoop
BRA.B
demo:Loop
1.800 uS
1.440 uS
.
.
2.120 uS
2.400 uS
1.800 uS
.
.
.
The lines in the trace that are prefixed with the equal sign show the data accesses
associated with instructions.
31
Chapter 1: Quick Start
Step 9. Stop (break from) program execution
Step 9. Stop (break from) program execution
The b command switches the emulator from the "running user program" state (or
from the reset state) to the monitor state.
When the emulator is in the monitor state, it can access microprocessor registers
and target system or single-port emulation memory.
• Break emulator execution out of the demo program and into the monitor state by
entering the b command.
U>b
M>
Notice that the emulation status character becomes "M" which indicates that the
emulator is in the monitor state.
32
Chapter 1: Quick Start
Step 10. Set a software breakpoint
Step 10. Set a software breakpoint
Software breakpoints provide a way to accurately stop the execution of your
program at selected locations.
1 Enable the software breakpoints feature by entering the bc -e bp command.
M>bc -e bp
2 Use the bp <addr> command to set a software breakpoint at the address
"handle_msg:Cmd_B".
M>bp handle_msg:Cmd_B
3 Run the program from the current program counter address.
M>r
U>
4 Simulate the entry of the "B" command by modifying the "demo:Cmd_Input"
memory location.
U>m -db demo:Cmd_Input="B"
!ASYNC_STAT 615! Software breakpoint: 00000044c@sp
M>
33
Chapter 1: Quick Start
Step 11. Display processor registers
Step 11. Display processor registers
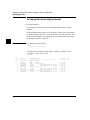
• Display the contents of the basic processor registers by entering the reg command.
M>reg
reg
reg
reg
reg
34
pc=0000044c st=2714 d0=ffffff42 d1=ffffffff d2=ffffffff d3=ffffffff
d4=ffffffff d5=ffffffff d6=ffffffff d7=ffffffff a0=ffffffff a1=ffffffff
a2=ffffffff a3=ffffffff a4=ffffffff a5=ffffffff a6=ffffffff a7=00000ffc
usp=18bc8c1d ssp=00000ffc vbr=00000000 sfc=00 dfc=00
Chapter 1: Quick Start
Step 12. Step through program execution
Step 12. Step through program execution
The s command lets you step through user program execution. You can step single
instructions or a number of instructions at a time.
1 Step one instruction in the user program by entering the s command.
M>s
00000044c@sp andle_msg:Cmd_B
PC = 000000452@sp
LEA
handle_msg:Msg_B,A0
2 Step eight instructions in the user program by entering the s 8 command.
M>s 8
000000452@sp 000000454@sp 000000468@sp e_msg:Print_Msg
00000046e@sp andle_msg:Again
000000470@sp 000000470@sp 000000470@sp 000000470@sp PC = 000000470@sp
MOVEQ
BSR.W
LEA
MOVE.B
DBEQ
DBEQ
DBEQ
DBEQ
#$00000010,D1
handle_msg:Print_Msg
handle_msg:Msg_Dest,A1
(A0)+,(A1)+
D1,handle_msg:Again
D1,handle_msg:Again
D1,handle_msg:Again
D1,handle_msg:Again
35
Chapter 1: Quick Start
Step 13. Reset the emulator
Step 13. Reset the emulator
• Reset the emulator by entering the rst command.
M>rst
R>
Notice that the emulation status character is "R" which shows that the emulator is
being held in a reset state.
If the emulator status character is unfamiliar
The "R", "U", and "M" emulation prompt status characters are described in this
chapter. If you see other emulation status characters, enter the es command for
more information about the emulator status.
• Display the emulator status information by entering the es command.
R>es
M68340--Emulation reset
36
Part 2
User’s Guide
37
Part 2
38
2
Plugging into a Target System
39
Plugging the Emulator into a Target
System
This chapter describes the tasks you perform when plugging the emulator into a
target system. These tasks are grouped into the following sections:
40
•
Connecting the emulator to the target system.
•
Configuring the emulator for operation with your target system.
•
Selecting the emulation monitor.
Chapter 2: Plugging into a Target System
Connecting the Emulator to the Target System
Connecting the Emulator to the Target System
This section describes the steps you must perform when connecting the emulator to
a target system:
CAUTION
1
Turn OFF power.
2
If the emulator is currently connected to the demo target system or a different
target system, unplug the emulator probe.
3
Select the emulator clock source.
4
Plug the emulator probe into the target system.
5
Turn ON power (first the HP 64700, then the target system).
Possible Damage to the Emulator Probe. The emulation probe contains devices
that are susceptible to damage by static discharge. Therefore, precautionary
measures should be taken before handling the microprocessor connector attached to
the end of the probe cable to avoid damaging the internal components of the probe
by static electricity.
We STRONGLY suggest using a ground strap when handling the emulator
probe. A ground strap is provided with the emulator.
41
Chapter 2: Plugging into a Target System
Connecting the Emulator to the Target System
Step 1. Turn OFF power
CAUTION
Possible Damage to the Emulator. Make sure target system power is OFF and
make sure HP 64700 power is OFF before removing or installing the emulator
probe into the target system.
Do not turn HP 64700 power OFF while the emulator is plugged into a target
system whose power is ON.
1 If the emulator is currently plugged into a different target system, turn that target
system’s power OFF.
2 Turn emulator power OFF.
Step 2. Unplug probe from demo target system
•
42
If the emulator is currently connected to a different target system, unplug the
emulator probe; otherwise, disconnect the emulator probe from the demo target
system.
Chapter 2: Plugging into a Target System
Connecting the Emulator to the Target System
Step 3. Select the emulator clock source
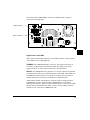
For 64751-66506 and lower numbered active probe printed-circuit boards, the
selection of the internal or external clock source is made with the cf clk
configuration command as described in the "Configuring for Operation with Your
Target System" section of this chapter.
For 64751-66508 and higher numbered active probe printed-circuit boards, the
selection of the internal or external clock source is made by positioning a jumper
module on the board.
If your active probe board number is 64751-66506 or lower, go on to Step 4;
otherwise, perform the following steps.
43
Chapter 2: Plugging into a Target System
Connecting the Emulator to the Target System
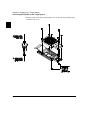
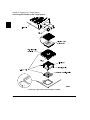
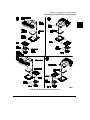
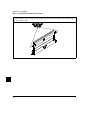
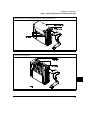
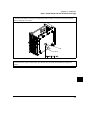
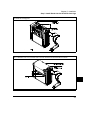
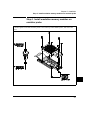
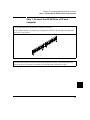
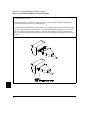
1 Remove plastic rivets that secure the plastic cover on the top of the emulator probe,
and remove the cover.
44
Chapter 2: Plugging into a Target System
Connecting the Emulator to the Target System
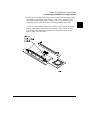
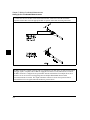
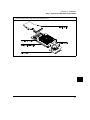
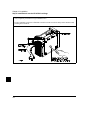
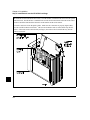
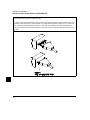
2 To select the 32.768 KHz crystal internal to the emulator, insert the jumper module
such that pin 1 of the module aligns with pin 1 of the socket. The target system
MUST drive MODCK high (or allow a pullup resistor in the emulator to pull it
high) during reset to enable the 68340 VCO and programmable clock mode.
To select an external (target system) TTL oscillator, rotate the jumper module 180
degrees such that pin 8 of the module aligns with pin 1 of the socket. The target
system MUST drive MODCK low during reset to enable the 68340 to use the
EXTAL signal as the clock source.
45
Chapter 2: Plugging into a Target System
Connecting the Emulator to the Target System
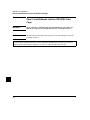
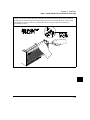
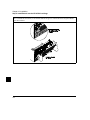
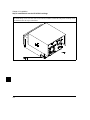
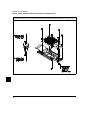
3 Replace the plastic cover, and insert new plastic rivets (supplied with the emulator)
to secure the cover.
46
Chapter 2: Plugging into a Target System
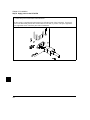
Connecting the Emulator to the Target System
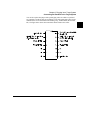
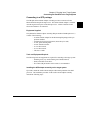
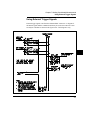
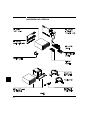
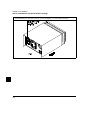
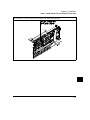
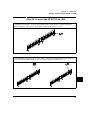
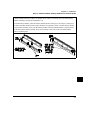
You can also replace the jumper with a prototyping socket on which a crystal and
any capacitors or tank circuitry are assembled. (One such prototyping socket is part
number 20314-36-455 from Electronic Molding Corp., 96 Mill Street, Woonsocket
RI.) The figure below shows the connections that are made to the socket.
47
Chapter 2: Plugging into a Target System
Connecting the Emulator to the Target System
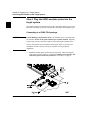
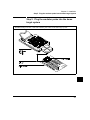
Step 4. Plug the 68340 emulator probe into the
target system
The emulator supports connections to PGA, QFP, and TQFP package types for the
MC64340. The following sections will describe connecting to these package types.
Connecting to a 68340 PGA package
CAUTION
Possible Damage to the Emulator Probe. The emulator probe is provided with a
pin extender. Do not use the probe without a pin extender installed. Replacing
a broken pin extender is much less expensive than replacing the emulator probe.
The use of more than one pin extender is discouraged, unless it is necessary for
mechanical clearance reasons, because pin extenders cause signal quality
degradation.
•
48
Install the emulator probe into the target system socket. Make sure that pin 1
of the connector aligns with pin 1 of the socket. Damage to the emulator will
result if the probe is incorrectly installed. Go on to Step 5 on page 56.
Chapter 2: Plugging into a Target System
Connecting the Emulator to the Target System
Connecting to a QFP package
The HP QFP Surface Mount Adapter Assembly provides a connection for the
Motorola MC68340 QFP microprocessor. The Surface Mount Adapter is soldered
onto the target board in place of the microprocessor. A PGA Transition Socket
allows the emulator to be connected.
Equipment Supplied
The QFP Surface Mount Adapter Assembly (HP part number E2424B option 1CC)
consists of the following:
– A Surface Mount Adapter for the MC68340 QFP package with a pin
protector installed.
– An Extender for increased clearance (must always be used).
– A clear, plastic Bearing Plate.
– A PGA Transition Socket.
– A 3/32 allen wrench.
– A 1/16 allen wrench.
– This User’s Guide
Tools and Equipment Required
The following tools and equipment are required for connecting to the target system:
– Soldering tools (very small soldering iron if hand soldered).
– Small, wide-blade screwdriver.
– Flex Cable (HP part number 64751-61601) is recommended.
Installing the QFP adapter assembly on the target system
If possible, mount the Surface Mount Adapter with normal production-line SMT
processes. The installation procedure for the surface mount adapter assembly
includes the following steps:
49
Chapter 2: Plugging into a Target System
Connecting the Emulator to the Target System
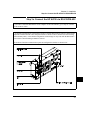
Connecting a QFP surface mount adapter assembly
50
Chapter 2: Plugging into a Target System
Connecting the Emulator to the Target System
CAUTION
Ensure that the microprocessor type shown on the PGA Transition Socket label
matches the microprocessor to be probed.
1
2
CAUTION
Start with a new target board that does not have a microprocessor installed.
Place the board on a stable, flat, horizontal surface, with all power off. Ensure
that the area under the microprocessor pad is fully supported.
Prepare the microprocessor pad on the target board with RMA flux. Allow the
flux to become slightly sticky; the flux will hold the Surface Mount Adapter in
place during soldering.
Incorrect alignment of pin 1 can result in damage to the target board, preprocessor
interface, or emulator.
The orange dot marks the pin 1 location for the QFP pattern; the PGA pin A1 is
not at the same corner (see figure on page 51). Use pin 1 to orient the PGA
Transition Socket with the Surface Mount Adapter and the target system. Use pin
A1 to orient the emulator with the PGA Transition Socket.
3
4
CAUTION
With the pin protector still installed on the Surface Mount Adapter, solder the
Surface Mount Adapter onto the target board in place of the microprocessor,
ensuring that pin 1 is properly aligned. There is a colored dot next to pin 1 on
the Surface Mount Adapter.
To solder the Surface Mount Adapter, carefully align it with the
microprocessor pad (with pin 1 properly oriented), apply a slight pressure and
solder the four corners first. After the corners are soldered, check the
registration to ensure all contacts are aligned, then solder the rest of the pins.
For soldering, it is best to contact the Surface Mount Adapter and PC-board
pad simultaneously with a drop of solder on the iron tip. Draw the solder
down and away from the Surface Mount Adapter, along the PC-board and trace.
After soldering, inspect the connections for solder bridges. Remove any
bridges with ultra-fine solderwick brade.
There are fine traces on top of the Surface Mount Adapter. To avoid damaging
these traces, soften the sharp edges of the screwdriver, and cover the blade with
Avery label or tape.
5
Using a small, wide-bladed screwdriver, gently remove the pin protector from
the Surface Mount Adapter. Apply a slight pressure to each side
consecutively, until the pin protector is free.
51
Chapter 2: Plugging into a Target System
Connecting the Emulator to the Target System
6
Place the plastic Bearing Plate over the pins on the Surface Mount Adapter.
The plastic Bearing Plate provides a surface for the set screws to push against, if
you ever need to remove the Surface Mount Adapter.
CAUTION
Installing the PGA Transition Socket directly on the Surface Mount Adapter will
apply excessive mechanical force and may cause damage.
7
CAUTION
Do not use excessive force. If you encounter resistance, check the pin orientation
and the alignment of the set screw with the PGA Transition Socket.
8
9
CAUTION
Ensure that the four set screws in the Extender are not protruding past either
side of the Extender. Very carefully align the pins on the Extender with the
pins on the Surface Mount Adapter, and gently position the Extender on the
Surface Mount Adapter (over the Bearing Plate), again ensuring that pin 1
(orange dot) is properly aligned. The Extender will be firmly seated when the
PGA Transition Socket is installed. The Extender must always be used.
Extend the center dowel pin on the PGA Transition Socket approximately
1/16" into the top of the PGA Transition Socket. The dowel pin helps align the
PGA Transition Socket with the Extender. Noting the alignment of pin 1 on
the PGA Transition Socket (colored dot) and the Extender, place the PGA
Transition Socket on top of the Extender, using the dowel pin for centering.
Gently press down, seating the PGA Transition Socket pins into the Extender.
As the PGA Transition Socket becomes seated, the Extender will also seat onto
the Surface Mount Adapter.
Electrically check to ensure there are no shorts between Vcc and ground.
Ensure that the emulator probe is aligned with pin A1 when connecting to the PGA
Transition Socket. Pin A1 is used to orient the emulator with the PGA Transition
Socket; the orange dot indicates pin 1 for the QFP pattern, and is not the same as
pin A1 (see figure on page 51).
10 Install the emulator probe into the PGA socket on the PGA Transition Socket.
The Flex Cable is recommended to decrease the stresses associated with the
additional weight. See the figure on page 51 for correct alignment of the
emulator, with respect to pin A1. Go on to Step 5 on page 56.
52
Chapter 2: Plugging into a Target System
Connecting the Emulator to the Target System
Removing the Extender
Removing the Extender at a later time is not recommended, as it may crack the
Surface Mount Adapter. If you do need to remove the Extender, use the following
procedure:
• Gently remove the PGA Transition Board.
• Gently screw the four set screws, about two turns each in consecutive order.
This will create a rocking effect, which will slowly back the Extender off of
the Surface Mount Adapter.
CAUTION
Never pry the Extender off of the Surface Mount Adapter or try to pull it off with a
tool.
•
Always inspect the Surface Mount Adapter connections after the Extender is
removed. If cracks have occurred, you may need to resolder.
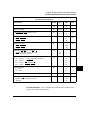
Replaceable Parts for the QFP Surface Mount Adapter Assembly
The table below lists some mechanical parts which may be replaced if they are lost,
damaged, or used up.
Part Number
Description
64751-87603
64751-87604
64751-87605
Surface Mount Adapter Assembly
Extender
Surface Mount Adapter for MC68340 footprint
53
Chapter 2: Plugging into a Target System
Connecting the Emulator to the Target System
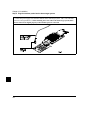
Connecting to a 144-pin TQFP package
You will need to order the following HP Elastomeric Probing System parts to probe
a 144-pin TQFP package:
– E5336A Probe Adapter
– E5338A Flexible Adapter
– E5358A Transition Socket
Use the following steps to connect the emulator to a TQFP on the target system.
CAUTION
Equipment damage. Serious damage to the target system or emulator can result
from incorrect connection. Ensure proper alignment of all parts. The connections
between the emulator probe, probe adapter, and MC6833x microprocessor are
delicate and must be done with care.
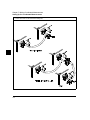
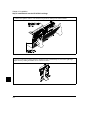
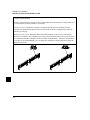
1 Select the orientation (shown on the next page) that best suits your target system.
Note the following indicators on the illustration:
–
–
–
–
–
–
position of Pin 1 on the microprocessor
position of little pin on the retainer
position of little hole on the probe adapter
color/bar code on both ends of the flexible adapter
position of indicator on the transition socket
position of Pin A1 on the emulator
2 Flexible adapters can be installed in one of four orientations as shown in the
following illustration. This allows flexibility in attaching the emulator probe when
target system components interfere.
3 Refer to the installation guide supplied with the HP Elastomeric Probing System to
adhere the retainer to the TQFP and install the adapter. Make sure to follow the
orientation you selected in steps 1 and 2 above.
4 Connect the flexible adapter, transition socket, and emulator following the
orientation selected.
54
Chapter 2: Plugging into a Target System
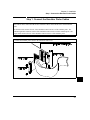
Connecting the Emulator to the Target System
Connecting the HP Elastomeric Probing System
55
Chapter 2: Plugging into a Target System
Connecting the Emulator to the Target System
Step 5. Turn ON power
1 Turn emulator power ON.
2 Turn target system power ON.
56
Chapter 2: Plugging into a Target System
Configuring for Operation with Your Target System
Configuring for Operation with Your Target
System
After you plug the emulator into a target system and turn on power to the
HP 64700, you need to configure the emulator so that it operates properly with your
target system.
Before the emulator can operate in your target system, you must:
Map memory. Because the emulator can use target system memory or
emulation memory (or both), it is necessary to map ranges of memory so that
the emulator knows where to direct its accesses. Refer to the "Mapping
Memory" section in the "Using the Emulator" chapter.
Select the emulator’s clock source.
Also, the emulator needs to know the following things:
Is there circuitry in the target system that requires programs to run in
real-time? Some emulator commands cause temporary breaks to the monitor
state, typically to access microprocessor register values, single-port emulation
memory, or target system memory. If the target system requires that programs
run in real-time, you must restrict the emulator to real-time runs.
Should the emulator respond to target system interrupts when running in
the monitor program? If so, you must use a foreground monitor program
since target system interrupts are always ignored during background operation
(refer to the "Selecting the Emulation Monitor" section later in this chapter). If
it’s not important that the emulator respond to target system interrupts when
running in the monitor, you can use the background monitor.
57
Chapter 2: Plugging into a Target System
Configuring for Operation with Your Target System
This section shows you how to:
•
Select the emulator’s clock source.
•
Set the initial value of the supervisor stack pointer (SSP) and program counter
(PC) after emulation reset.
•
Restrict to real-time runs.
•
Turn OFF the restriction to real-time runs.
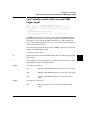
To select the emulator’s clock source
For 64751-66508 and higher numbered active probe printed-circuit boards, the
selection of the internal or external clock source is made by positioning a jumper
module on the board as described in the "Connecting the Emulator to the Target
System" section of this chapter.
For 64751-66506 and lower numbered active probe printed-circuit boards, the
selection of the internal or external clock source is made with the cf clk
configuration command.
• Enter the cf clk=ext command to select the external target system crystal or TTL
oscillator.
• Enter the cf clk=int command to select the internal 32.768 KHz crystal.
If clk=int, the emulator will use the internal 32.768 KHz crystal. The target system
MUST drive MODCLK high (or allow a pullup resistor in the emulator to pull it
high) during reset to enable the 68340 voltage-controlled oscillator (VCO).
If clk=ext, the emulator will use the crystal or TTL oscillator in the target system.
MODCLK should be driven appropriately.
58
Chapter 2: Plugging into a Target System
Configuring for Operation with Your Target System
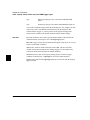
To set the initial SSP and PC values
• Enter the cf rv=<ssp_value,pc_value> command.
The supervisor stack pointer must be set to an address in emulation or target system
RAM in order for the emulator to transition into the run state, to step, or to perform
other functions after emulation reset.
The cf rv=<ssp_value,pc_value> command sets the initial SSP and PC values after
emulation reset. Upon the transition from emulation reset into the emulation
monitor, the supervisor stack pointer register and the program counter are set to the
32-bit hexadecimal even address values specified.
If a run from reset command is given, this configuration item has no affect and the
initial supervisor stack pointer and program counter will be retrieved from reset
vector in the vector table.
If a target system reset occurs while running in the background monitor, the
supervisor stack pointer and program counter are unaffected.
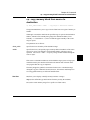
To restrict to real-time runs
• Enter the cf rrt=en command.
While running programs, temporary breaks to the monitor state are not allowed.
The emulator refuses the following commands:
•
reg (register display/modification).
•
m (memory display/modification), bp (software breakpoints), cp (copy
memory block), load (load memory), dump (dump memory), or ser (search
memory for data) commands that access single-port emulation memory and
target system memory.
The emulator contains one 4 Kbyte block of dual-port emulation memory
which can be accessed while runs are restricted to real-time. This block of
dual-port emulation memory is reserved for foreground monitor programs
when they are used.
59
Chapter 2: Plugging into a Target System
Configuring for Operation with Your Target System
•
CAUTION
sync (synchronize emulator configuration registers).
Target system damage could occur! If your target system circuitry is dependent
on constant execution of program code, the following commands still cause breaks
from running programs even when you have restricted the emulator to real-time
runs:
•
rst (reset).
•
r (run).
•
b (break to monitor).
•
s (step).
Use caution in executing these commands.
To turn OFF the restriction to real-time runs
• Enter the cf rrt=dis command.
Temporary breaks to the monitor while running programs are allowed, and the
emulator accepts commands normally.
60
Chapter 2: Plugging into a Target System
Selecting the Emulation Monitor
Selecting the Emulation Monitor
This section shows you how to:
•
Select the background monitor (implemented with the 68340 Background
Debug Mode (BDM)).
•
Select a foreground monitor program.
•
Use a custom foreground monitor program.
When you power up the emulator, or when you initialize it, the background monitor
is selected. You can also configure the emulator to use a foreground monitor.
Before the background and foreground monitors are described, you should
understand the foreground and background emulator modes as well as the function
of the emulation monitor.
Background
Background is the emulator mode in which emulation processor execution is
suspended.
Foreground
Foreground is the mode in which the emulator executes as if it were a real
microprocessor. The emulator is in foreground when it is running user programs or
is running in the foreground monitor.
Function of the Monitor
The monitor is the interface between the emulation system controller (which
accepts and executes emulation commands) and the target system. The monitor
uses the emulation microprocessor because that’s the only way to access registers,
single-port emulation memory, and target system memory.
When the emulation system controller recognizes that a command requires the
monitor, it writes a command code to a communications area and "breaks" emulator
execution into the monitor. The monitor reads this command (and any associated
parameters), makes the appropriate accesses, places the values in the
communication area, and returns emulator execution to its previous state.
61
Chapter 2: Plugging into a Target System
Selecting the Emulation Monitor
Background Monitor
When a background monitor is selected, the Background Debug Mode (BDM) of
the 68340 processor is used. The BKPT line is asserted to enter the monitor.
Foreground Monitor
The foreground monitor is an assembly language program that is executed by the
68340 emulation microprocessor in its normal operating mode.
When a foreground monitor is selected, the foreground monitor or downloaded
custom monitor is loaded into dual-ported emulation memory and consumes a 4K
byte block of the 68340’s address range.
The foreground monitor program is included with the emulator on a floppy disk: it
can be assembled with the HP AxLS 68000/10/20 Assembler/Linker/Librarian or
with the Microtec Research 68000 assembler and linker.
You may customize the foreground monitor if necessary; however, you must
maintain the basic communications protocol between the monitor and the emulation
system controller. Comments in the monitor program source file detail sections
that cannot be changed.
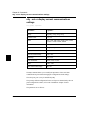
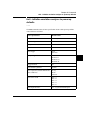
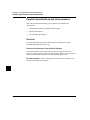
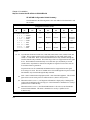
Comparison of Background and Foreground Monitor Programs
Monitor Program Characteristic
Background
Foreground
Takes up processor memory space
No
Yes, 4 Kbytes
Allows the emulator to respond to target system
interrupts during monitor execution
No
Yes
Can be customized
No
Yes
68340 emulation
processor’s BDM
Yes, (custom monitor
must be assembled,
linked, and loaded)
Resident in emulator firmware
62
Chapter 2: Plugging into a Target System
Selecting the Emulation Monitor
To select the background monitor
1 Enter the cf mon=bg command.
2 Re-map memory.
When a background monitor is selected, the Background Debug Mode (BDM) of
the 68340 processor is used. The BKPT line is asserted to enter the monitor.
During background monitor operation, there will be no bus cycle activity except for
memory reads and writes that result from memory display or modify commands.
Changing the monitor configuration resets the memory map, so you must re-map
memory.
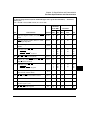
To select a foreground monitor program
1 Enter the cf mon=fg command to select a foreground monitor.
2 Enter the cf monaddr=<addr> command to select the base address of the monitor
program.
3 Enter the cf mondsi command to specify whether monitor cycles should be
synchronized to the target system.
4 Enter the cf monintr=<0..7> command to select the interrupt priority level for the
monitor program.
5 Re-map memory.
6 Set the initial supervisor stack pointer and program counter values.
7 Load the user program absolute file.
63
8 Modify the TRACE exception vector to point to the TRACE_ENTRY symbol in
the monitor program so the emulator can single-step.
Selecting the Foreground Monitor
Entering the the cf mon=fg command causes the current memory map to be
deleted, and a new map term is added for the monitor program. The starting
address of the monitor block is set with the monaddr configuration item, and the
mondsi configuration item determines whether the dsi (/DSACK interlock)
memory attribute is added.
When you select a foreground monitor, the emulator automatically loads the default
program, resident in emulator firmware, into dual-ported emulation memory. The
foreground monitor is reloaded every time the emulator breaks into the monitor
state from the reset state.
Unlike the background monitor, the foreground monitor runs within the same
address space as the target program consuming a 4 Kbyte block of the 68340’s
address range. The foreground monitor can run with target interrupts enabled (see
"Selecting the Interrupt Priority Level").
The emulator breaks into the foreground monitor by using the emulation
processor’s background debug mode (BDM) except for single-stepping, which uses
the trace exception. The time spent in BDM is approximately 350 microseconds.
An exception stack frame of 7 to 13 words will be temporarily pushed onto the
user’s master and/or interrupt stack(s) during monitor entry.
Selecting the Monitor’s Base Address
The cf monaddr=<addr> command defines the starting address of the 4 Kbyte
block of dual-ported emulation memory reserved for the foreground monitor. The
address must reside on a 4 Kbyte boundary (in other words, an address ending in
000H) and must be specified in hexadecimal. Also, the foreground monitor’s base
address must have no function code specified.
When you enter the cf monaddr=<addr> command, the current memory map will
be deleted, and a new map term is added for the monitor.
This configuration item has no meaning when a background monitor is selected.
64
Chapter 2: Plugging into a Target System
Selecting the Emulation Monitor
Specifying Target Synchronization
If you wish to synchronize monitor cycles to the target system (that is, interlock the
emulation and target system /DSACK on accesses to the monitor memory block),
enter the cf mondsi=en command; otherwise, enter the cf mondsi=dis command.
When interlocking is enabled, cycle termination of accesses to foreground monitor
memory will not occur until the target system provides a /DSACK. If the monitor
is placed in an address range for which the target system does not generate a
/DSACK, the emulator will be unable to break into the monitor and a "CPU in wait
state" status will result.
When interlocking is disabled, accesses to foreground monitor memory will be
terminated by a /DSACK signal generated by the emulator. Any cycle termination
signals generated by the target system during monitor memory accesses, including
/BERR, will be ignored.
Modifying this configuration item will reset the processor and controls whether the
dsi (/DSACK Interlock) memory attribute is used in the foreground monitor
memory map term.
This configuration item has no meaning when a background monitor is selected.
Selecting the Interrupt Priority Level
The default foreground monitor can be configured to run at a lowered interrupt
priority level to allow critical target system interrupts to be processed during
monitor execution.
At the point it is safe to lower the interrupt priority level, the foreground monitor
will set the interrupt priority mask to the value of monintr or the interrupt level that
was in effect before monitor entry, whichever is greater.
During background monitor operation, all target system interrupts, including level 7
non-maskable interrupts, are blocked.
Modifying this configuration item will reset the processor.
Re-Mapping Memory
When you configure the emulator for a foreground monitor program, the memory
map is reset, and a 4 Kbyte block of emulation memory is automatically mapped
for the monitor program. You must re-map other memory ranges before loading
user programs.
65
Chapter 2: Plugging into a Target System
Selecting the Emulation Monitor
Modifying the TRACE Exception Vector
In order for single stepping to operate with the foreground monitor, the trace vector
in the target system’s exception table (VBR plus 24H) must point to the
TRACE_ENTRY address in the monitor. This address is equal to the value of
monaddr plus 800h in the default foreground monitor.
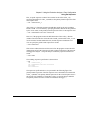
To use a custom foreground monitor program
1 Edit the monitor program source file, and locate its base address on a 4 Kbyte
boundary.
2 Assemble and link the foreground monitor program.
3 Enter the cf mon=fg command to select a foreground monitor.
4 Enter the cf monaddr=<addr> command to select the base address of the monitor
program.
5 Enter the cf mondsi command to specify whether monitor cycles should be
synchronized to the target system.
6 Enter the cf monintr=<0..7> command to select the interrupt priority level for the
monitor program.
7 Re-map memory.
8 Set the initial supervisor stack pointer and program counter values.
9 Load the custom monitor program.
10 Load the user program absolute file.
11 Modify the TRACE exception vector to point to the TRACE_ENTRY symbol in
the monitor program so the emulator can single-step.
66
Chapter 2: Plugging into a Target System
Selecting the Emulation Monitor
Using a custom foreground monitor program is the same as selecting the default
foreground monitor, except that the customized monitor program must be
assembled, linked, and loaded into emulation memory.
A custom foreground monitor must be assembled and linked starting at the 4 Kbyte
boundary specified as the monitor’s base address (see the monaddr configuration
item). An ORG statement in the foreground monitor source file defines the base
address. Refer to the foreground monitor source provided with the emulator for
more information.
A custom foreground monitor is downloaded using the load -f command. The
custom foreground monitor is saved in the emulator (until the monitor type is
changed) and reloaded every time the emulator breaks into the monitor state from
the reset state.
Examples
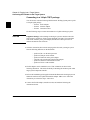
The following examples of how to set up and use a custom foreground monitor
program make the following assumptions:
•
The HP 64700 is connected to the same LAN as an HP 9000 Series 300 host
computer.
•
The HP AxLS 68000/10/20 Assembler/Linker/Librarian and the HP 64855
RS-232 Transfer products are installed on the HP 9000 Series 300 host
computer.
•
The foreground monitor program source file exists on the host computer.
To edit the monitor program source file to specify its base address, 2000H in this
example, you must modify the ORG statement near the top of the file:
ORG $00002000H
; link monitor on 4k boundary
Notice that the ORG statement is indented from the left margin; if it is not indented,
the assembler will interpret the ORG as a label and will generate an error when
processing the address portion of the statement.
To assemble and link the monitor program, enter the following commands:
$ as68k -Lh fm64751.s > fm64751.lis <RETURN>
$ ld68k -c fm64751.k -Lh > fm64751.map <RETURN>
Where the "fm64751.k" linker command file contains:
67
Chapter 2: Plugging into a Target System
Selecting the Emulation Monitor
name fm64751
load fm64751.o
end
To configure the emulator to use a foreground monitor program:
R>cf mon=fg
To specify the monitor’s base address:
R>cf monaddr=2000
To disable synchronization of accesses to the monitor memory block with the target
system:
R>cf mondsi=dis
The memory map is reset and a 4 Kbyte block of emulation memory (range 2000H
through 2FFFH) is mapped for the foreground monitor program.
To configure the foreground monitor to run at the lowest interrupt priority level:
R>cf monintr=0
To map memory for the emulator demo program:
R>map 0..0fff erom
R>map 40000..47fff eram
R>map 60000..64fff eram
To set the value of the supervisor stack pointer and program counter after emulation
reset:
R>cf rv=48000,400
68
Chapter 2: Plugging into a Target System
Selecting the Emulation Monitor
To load the monitor program and user program absolute files, enter the
following commands from the host computer:
$ ftp 15.35.226.210
Connected to 15.35.226.210.
220 User connected to HP64700
Name (15.35.226.210:guest): <RETURN>
Password (15.35.226.210:guest): <RETURN>
ftp> binary
200 Type set to I
ftp> put fm64751.X -h
200 Port
ok
150
226R>
226 Transfer completed
3332 bytes sent in 0.20 seconds (16.27 Kbytes/sec)
ftp> put cmd_rdr.X -h
200 Port
ok
150
226R>
226 Transfer completed
3332 bytes sent in 0.20 seconds (16.27 Kbytes/sec)
ftp> quit
221 Goodbye
$
To modify the TRACE exception vector to point to the TRACE_ENTRY
symbol in the monitor program (so that the emulator can single-step):
M>m -dl 24=2800
Now, you are ready to use the emulator.
69
Chapter 2: Plugging into a Target System
Selecting the Emulation Monitor
70
3
Using the Terminal Interface
71
Using the Terminal Interface
This chapter describes general tasks you may wish to perform while using the
Terminal Interface, in other words, tasks that don’t necessarily relate to using the
emulator or the analyzer. These tasks are grouped into two sections:
72
•
Accessing HP 64700 system information.
•
Entering commands.
Chapter 3: Using the Terminal Interface
Accessing HP 64700 System Information
Accessing HP 64700 System Information
The HP 64700’s Terminal Interface provides access to two types of system-wide
information:
•
Help information for the Terminal Interface commands.
•
Software version number information for the products installed in the
HP 64700 Card Cage.
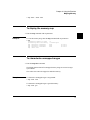
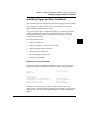
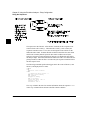
To access on-line help information
• Use the help or ? commands.
The HP 64700’s Terminal Interface provides an on-line help command to provide
you with quick information on the various commands and command syntax. From
any system prompt, you can enter help or ? as shown below.
Commands are grouped into various classes. To see the commands grouped into a
particular class, you can use the help command with that group. Viewing the group
help information in short form will cause the commands or the grammar to be listed
without any description.
Help information exists for each command. Additionally, there is help information
for each of the emulator configuration items. For example, to access the help
information for the rrt configuration item, you can enter the help cf rrt command).
73
Chapter 3: Using the Terminal Interface
Accessing HP 64700 System Information
Examples
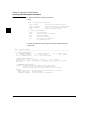
To display information on the help command:
M>help
help
- display help information
help <group>
help -s <group>
help <command>
help
-
print
print
print
print
help for desired group
short help for desired group
help for desired command
this help screen
--- VALID <group> NAMES --gram
- system grammar
proc
- processor specific grammar
sys
emul
trc
*
-
system commands
emulation commands
analyzer trace commands
all command groups
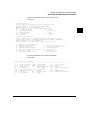
To display information on the grammar used in the Terminal Interface:
M>help gram
gram - system grammar
------------------------------------------------------------------------------- SPECIAL CHARACTERS --# - comment delimiter
; - command separator
Ctl C - abort signal
{} - command grouping
"" - ascii string
‘‘
- ascii string
Ctl R - command recall
Ctl B - recall backwards
--- EXPRESSION EVALUATOR --number bases: t-ten
y-binary
q-octal
o-octal
h-hex
repetition and time counts default to decimal - all else default to hex
operators:
() ~ * / % + - << <<< >> >>> & ^ | &&
--- PARAMETER SUBSTITUTION --&token& - pseudo-parameter included in macro definition
- cannot contain any white space between & pairs
- performs positional substitution when macro is invoked
Example
Macro definition: mac getfile={load -hbs"transfer -t &file&"}
Macro invocation: getfile MYFILE.o
Expanded command: load -hbs"transfer -t MYFILE.o"
74
Chapter 3: Using the Terminal Interface
Accessing HP 64700 System Information
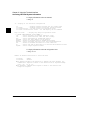
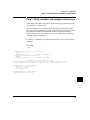
To display information specific to the 68340 processor:
M>help proc
--- Address format --32 bit address for memory with optional function codes
address format is either XXXXXXXX or XXXXXXXX@fc
where XXXXXXXX is a 32 bit address and
where fc may be any of the following function codes
x - no function codes
cpu - CPU
sp - supervisor program
s
- supervisor
sd - supervisor data
u
- user
up - user program
p
- program
ud - user data
d
- data
--- Address range format --32 bit address thru 32 bit address with optional function codes
address range format is XXXXXXXX..XXXXXXXX or XXXXXXXX..XXXXXXXX@fc
where XXXXXXXX is a 32 bit address and
where fc may be any of the Address format function codes
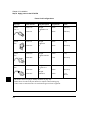
--R
U
M
W
w
?
Emulation Status Characters --- emulator in reset state
- running user program
- running monitor program
- waiting for CMB to become ready
- CPU in wait state
- No monitor communication
c
r
h
b
g
p
-
no target system clock
target system reset active
processor halted
no bus cycles
bus granted
no target power
To display information on the emulator commands:
M>help emul
emul - emulation commands
----------------------------------------------------------------------------b......break to monitor demo...demo program
r......run user code
bc.....break condition
dump...dump memory
reg....registers
bp.....breakpoints
es.....emulation status rst....reset
cf.....configuration
io.....input/output
rx.....run at CMB execute
cim....copy target image load...load memory
s......step
cmb....CMB interaction
m......memory
ser....search memory
cov....coverage
map....memory mapper
sync...synchronize emulator
cp.....copy memory
mo.....modes
75
Chapter 3: Using the Terminal Interface
Accessing HP 64700 System Information
To display information on the cf command:
M>help cf
cf - display or set emulation configuration
cf
- display current settings for all config items
cf <item>
- display current setting for specified <item>
cf <item>=<value> - set new <value> for specified <item>
cf <item> <item>=<value> <item> - set and display can be combined
help cf <item>
--- VALID
clk
lfc
mon
monaddr
mondsi
monintr
rrt
rv
regfmt
- display long help for specified <item>
CONFIGURATION <item> NAMES --- select internal or external emulation clock
- select 68340 function codes for file loading
- select foreground or background monitor
- select the base address of the monitor
- enable or disable monitor /DSACK interlocking
- select interrupt priority level for foreground monitor
- enable or disable restriction to real-time runs
- select SSP and PC when monitor is entered from emulation reset
- select single register format
To display information on the rrt configuration item:
M>help cf rrt
Enable or disable restriction to real-time runs
cf rrt=en
cf rrt=dis
enable
disable
When enabled and while the emulator is running the user program, any
command that requires a break to the monitor will be rejected except
’rst’, ’b’, ’r’ or ’s’.
When disabled, commands that require a break to the monitor will
always be accepted.
76
Chapter 3: Using the Terminal Interface
Accessing HP 64700 System Information
To display version information
• Use the ver command.
The Terminal Interface provides the ver command if you need to check the
software version numbers of the HP 64700 system and other products in the
HP 64700.
Examples
To display version information:
M>ver
Copyright (c) Hewlett-Packard Co. 1987
All Rights Reserved. Reproduction, adaptation, or translation without prior
written permission is prohibited, except as allowed under copyright laws.
HP64700B Series Emulation System
Version:
B.01.00 20Dec93
Location: Flash
System RAM:1 Mbyte
HP64751A Motorola 68340 Emulator
Version:
A.00.00 21Apr92
Control:
HP64748C Emulation Control Board
Speed:
16.7 MHz
Memory:
260 Kbytes
Bank 0: HP64171A 256 Kbyte 35ns Memory Module
HP64740 Emulation Analyzer
Version:
A.02.02 13Mar91
77
Chapter 3: Using the Terminal Interface
Entering Commands
Entering Commands
This section describes tasks that are related to entering commands. Entering
commands is easy: use the keyboard to type in the command and press the carriage
return key. However, the Terminal Interface provides other features that make
entering commands even easier. For example, you can:
•
Enter multiple commands on one line.
•
Recall commands.
•
Edit commands.
•
Repeat commands.
•
Define macros, which save a set of commands for later execution.
•
Use command files over LAN.
To enter multiple commands on one command
line
• Separate the commands with semicolons (;).
More than one command may be entered in a single command line if the commands
are separated by semicolons (;).
Examples
To step the next instruction and display the registers:
M>s;reg
000000a00@sp NOP
PC = 000000a02@sp
reg pc=00000a02 st=2714 d0=00000000 d1=0000ffff d2=00000000 d3=00000000
reg d4=00000000 d5=00000000 d6=00000000 d7=00000000 a0=00047fe3 a1=00000ac5
reg a2=00000984 a3=00000000 a4=00000000 a5=00068054 a6=00047fe4 a7=00047f78
reg usp=00000001 ssp=00047f78 vbr=00000000 sfc=00 dfc=00
78
Chapter 3: Using the Terminal Interface
Entering Commands
To recall commands
• Press <CTRL>r.
You can press <CTRL>r to recall the commands that have just been entered. If you
go past the command of interest, you can press <CTRL>b to move forward through
the list of saved commands.
Examples
To recall and execute the last command press <CTRL>r and then press
<RETURN>.
To edit commands
1 Use the cl -e command to enable the command line editor.
2 Use <CTRL>r to recall previous commands, or if you wish to edit the current
command or search for a previous command, press <ESC> to enter the editing
mode.
The Terminal Interface provides a command line editing feature. The editing mode
commands are as follows.
79
Chapter 3: Using the Terminal Interface
Entering Commands
Command
Description
<ESC>
i
a
x
r
dd
D
A
$
0
^
h
l
k
j
/<string>
n
N
enter command editing mode
insert before current character
insert after current character
delete current character
replace current character
delete command line
delete to end of line
append to end of line
move cursor to end of line
move cursor to start of line
move cursor to start of line
move left one character
move right one character
fetch previous command
fetch next command
find previous command in history matching <string>
fetch previous command matching <string>
fetch next command matching <string>
To repeat commands
• Use the rep command.
The rep command is helpful when entering commands repetitively. You can repeat
the execution of macros as well as commands.
80
Chapter 3: Using the Terminal Interface
Entering Commands
Examples
To cause the s and reg commands to be executed two times.
M>rep 2 {s;reg}
000000a08@sp BEQ.B
$00000A00
PC = 000000a00@sp
reg pc=00000a00 st=2714 d0=00000000 d1=0000ffff d2=00000000 d3=00000000
reg d4=00000000 d5=00000000 d6=00000000 d7=00000000 a0=00047fe3 a1=00000ac5
reg a2=00000984 a3=00000000 a4=00000000 a5=00068054 a6=00047fe4 a7=00047f78
reg usp=00000001 ssp=00047f78 vbr=00000000 sfc=00 dfc=00
000000a00@sp NOP
PC = 000000a02@sp
reg pc=00000a02 st=2714 d0=00000000 d1=0000ffff d2=00000000 d3=00000000
reg d4=00000000 d5=00000000 d6=00000000 d7=00000000 a0=00047fe3 a1=00000ac5
reg a2=00000984 a3=00000000 a4=00000000 a5=00068054 a6=00047fe4 a7=00047f78
reg usp=00000001 ssp=00047f78 vbr=00000000 sfc=00 dfc=00
To enter multiple commands with macros
1 Define the macro with the mac command.
2 Execute the defined macro.
If you wish to enter the same set of commands at various times while you use the
emulator, you can assign these commands to a macro and enter the macro instead of
the set of commands.
Examples
To define a macro that will display registers after every step, enter the following
command.
M>mac st={s;reg}
To execute the macro, enter it as you would any other command.
M>st
# s ; reg
000000a02@sp MOVE.B
Cmd_Input,D2
PC = 000000a08@sp
reg pc=00000a08 st=2714 d0=00000000 d1=0000ffff d2=00000000 d3=00000000
reg d4=00000000 d5=00000000 d6=00000000 d7=00000000 a0=00047fe3 a1=00000ac5
reg a2=00000984 a3=00000000 a4=00000000 a5=00068054 a6=00047fe4 a7=00047f78
reg usp=00000001 ssp=00047f78 vbr=00000000 sfc=00 dfc=00
81
Chapter 3: Using the Terminal Interface
Entering Commands
To use command files over LAN
1 Using ftp -in and the ftp command "cd <parameter>", copy information from the
HP 64700 to the host computer.
2 Using ftp -in and the ftp command "cd <parameter>", copy information from the
host computer to the HP 64700.
The ftp software in the HP 64700 responds to the ftp command "cd <parameter>"
by executing the parameter as a Terminal Interface command.
By using ftp -in (refer to the ftp documentation for option details), you can send
multiple Terminal Interface commands to a HP 64700 on the LAN.
For example, when entered from a UNIX workstation on the same LAN as the
HP 64700 named hostname, the following command will display emulator version
information:
$ echo "open hostname\nverbose\ncd ver\nquit" | ftp -in
If the Terminal Interface command you wish to execute has arguments, you must
enclose the command and its arguments in quotes. For example:
$ echo "open hostname\nverbose\ncd \"help ver\"\nquit" | ftp -in
In order for these commands to work properly, there must not be an open telnet
connection to the HP 64700.
Examples
The following example assumes the HP 64700 is connected to the same LAN as the
UNIX host computer.
To save the emulator configuration, memory map, and other emulator settings,
create a configuration file by entering the following commands on the UNIX
workstation:
$ echo "open hostname" > cfg_file
$ echo "open hostname\nverbose\ncd cf\ncd map\ncd equ\ncd mac\nquit"
| ftp -in | grep ’^ ’ | awk ’{printf "cd \"%s\"\n", $0}’ >> cfg_file
$ echo "quit" >> cfg_file
To restore the emulator configuration information saved in "cfg_file", enter the
following command:
$ ftp -in < cfg_file
82
4
Using the Emulator
83
Using the Emulator
This chapter describes general tasks you may wish to perform while using the
emulator. These tasks are grouped into the following sections:
84
•
Initializing the emulator.
•
Using the emulator configuration registers.
•
Mapping emulation and target system memory.
•
Loading absolute files.
•
Loading and using symbols.
•
Executing user programs (starting, stopping, stepping, and resetting the
emulator).
•
Using software breakpoints.
•
Enabling and disabling break conditions.
•
Accessing registers.
•
Accessing memory.
Chapter 4: Using the Emulator
Initializing the Emulator
Initializing the Emulator
This section shows you how to:
•
Initialize the emulator.
•
Display emulator status information.
To initialize the emulator
• Enter the init command.
The init command with no options causes a limited initialization. A limited
initialization does not affect system configuration. However, the init command
will reset emulator and analyzer configurations. The init command:
•
Resets the memory map.
•
Resets the emulator configuration items.
•
Resets the break conditions.
•
Clears breakpoints.
The init command does not:
•
Clear any macros.
•
Clear any emulation memory locations; mapper terms are deleted, but if you
re-specify the mapper terms, you will find that the emulation memory contents
are the same.
The -c option specifies a complete initialization (except system verification tests are
not run).
The -p option specifies a complete initialization with system verification tests. The
-p initialization sequence includes emulator, analyzer, system controller,
communications port, LAN interface, and flash EPROM initialization.
85
Chapter 4: Using the Emulator
Initializing the Emulator
The -r option specifies a complete initialization with system verification tests (as
with -p), but all optional products are ignored. Do not use flash ROM.
Examples
To perform a limited initialization:
R>init
# Limited initialization completed
86
Chapter 4: Using the Emulator
Initializing the Emulator
To display emulator status information
• Enter the es command.
or
• Enter the help proc command.
The Terminal Interface prompt displays an emulator status character. You can find
the meaning of the emulator status character in one of two ways: with the help proc
command or with the es command.
Examples
To use the help proc command:
R>help proc
.
.
.
--R
U
M
W
w
?
Emulation Status Characters --- emulator in reset state
- running user program
- running monitor program
- waiting for CMB to become ready
- CPU in wait state
- No monitor communication
c
r
h
b
g
p
-
no target system clock
target system reset active
processor halted
no bus cycles
bus granted
no target power
.
.
.
To use the es command:
R>es
M68340--Emulation reset
87
Chapter 4: Using the Emulator
Using the Emulator Configuration Registers
Using the Emulator Configuration Registers
The 68340 processor contains a System Integration Module (SIM) which has the
external bus interface, four chip selects, input/output ports, and other circuitry to
reduce external logic in a typical microprocessor system. The SIM can be
programmed or configured in a variety of ways to suit the need of various systems.
The HP 64751A emulator contains circuitry that accommodates the flexibility of
the 68340 SIM and maintains consistent emulation features.
88
Chapter 4: Using the Emulator
Using the Emulator Configuration Registers
In the previous figure, there is a block labeled DE-SIM module. It receives as
inputs from the 68340:
•
•
Port A which can be address lines 31-24, interrupt acknowledge inputs, or
general purpose I/O lines.
Port B which can be interrupt requests, chip selects, or general purpose I/O
lines.
The DE-SIM module provides as outputs:
•
•
Address lines A31-A24 to the memory mapper and the analyzer.
A qualified chip select 0 (CS0) to the memory mapper.
The 68340 SIM is configured through the registers in the sim register class; these
registers control how the 68340 uses external signal lines to access memory.
The emulator’s DE-SIM module is configured through the registers in the cf_sim
register class. The DE-SIM module controls how the emulator interprets the
signals from the 68340 when accessing emulation memory and passing information
to the analysis trace.
Normally, the sim and cf_sim registers should be programmed with the same
values so they will be working together.
One of the primary functions of the DE-SIM is to provide A31-A24 to the memory
mapper and analyzer so they will have the complete 32-bit address bus. This is
easy if Port A of the 68340 is programmed as address lines; however, if it’s
programmed as an input port, for example, the upper address lines are not available
external to the 68340 (this is the case following reset). The four chip selects,
however, have access to the full 32 bit address inside the 68340. You can therefore
locate memory using a chip select at an address that is not possible to decode
externally. If properly programmed, the DE-SIM can use information in the
programming of the chip selects to re-create the upper address lines. This provides
the ability to map emulation memory at these addresses and also provides a correct
address in the analysis trace so that symbolic debugging is possible.
Normally, the DE-SIM would be programmed through the cf_sim registers to
match the programming of the 68340 SIM as it will exist after all of the boot-up
configuration is complete. This can be done before the boot-up code is run. In fact,
the programming of the cf_sim registers is part of the configuration and will be
loaded along with the memory map and other configuration items when a
configuration file is loaded.
89
Chapter 4: Using the Emulator
Using the Emulator Configuration Registers
The default programming of the DE-SIM matches the reset values of the 68340
SIM (refer to the Motorola MC68340 Integrated Processor User’s Manual for
specific values).
If desired, the programming of the DE-SIM can be transferred into the 68340 SIM
with the sync cf command. This happens automatically each time a break to the
monitor from emulation reset occurs. This ensures that the 68340 is prepared to
properly access memory when a program is downloaded to the emulator.
Alternatively, the emulator’s DE-SIM can be programmed from the 68340 SIM
with the sync sim command. This is useful if initialization code that configures the
68340 SIM exists, but you don’t what its values are. In this case, you can use the
default configuration, run from reset (either r rst or rst followed by r) to execute
the initialization code, and use the sync sim command to configure the emulator to
match the 68340 SIM.
At any time, you can verify if the SIM and DE-SIM are programmed the same with
the sync diff command. Any differences between the two register sets will be
listed.
It should be noted that the DE-SIM module is programmed solely from the cf_sim
register set and is therefore static with respect to the application program. No
attempt is made to update the programming of the DE-SIM by tracking instructions
that will program the 68340 SIM.
This section shows you how to:
90
•
View the SIM register differences.
•
Synchronize to the 68340 SIM registers.
•
Synchronize to the emulator configuration registers.
Chapter 4: Using the Emulator
Using the Emulator Configuration Registers
To view the SIM register differences
• Enter the sync diff command.
Before displaying the SIM configuration register differences, make sure the
contents of the mbar register is valid (in other words, its least significant bit should
be 1).
Examples
To display the SIM register differences:
M>sync diff
!ERROR 149! Register
M>reg mbar=40001
M>sync diff
mbar
=
40001
cs0mask = ffffffff
cs0addr = 18515e60
cs1mask = fffffffb
cs1addr = 8830fcc8
cs2mask = fff7ffff
cs2addr = e41cff24
cs3mask = fffffffd
cs3addr = 54005ca0
mbar valid bit not set
cf_mbar
cf_cs0mask
cf_cs0addr
cf_cs1mask
cf_cs1addr
cf_cs2mask
cf_cs2addr
cf_cs3mask
cf_cs3addr
=
=
=
=
=
=
=
=
=
100001
0000fffd
ff000000
00000000
00000000
00000000
00000000
00000000
00000000
91
Chapter 4: Using the Emulator
Using the Emulator Configuration Registers
To synchronize to the 68340 SIM registers
• Enter the sync sim command.
The contents of the 68340 SIM registers are copied to the emulator’s configuration
registers. The contents of the mbar register must be valid (that is, its least
significant bit should be 1).
To synchronize to the emulator configuration
registers
• Enter the sync cf command.
The contents of the emulator’s configuration registers are copied to the 68340 SIM
registers. The contents of the cf_mbar register must be valid (that is, its least
significant bit should be 1).
92
Chapter 4: Using the Emulator
Mapping Memory
Mapping Memory
Because the emulator can use target system memory or emulation memory (or
both), it is necessary to map ranges of memory so that the emulator knows where to
direct its accesses.
Up to 7 ranges of memory can be mapped, and the resolution of mapped ranges is
256 bytes (that is, the memory ranges must begin on 256 byte boundaries and must
be at least 256 bytes in length).
The emulator contains 4 Kbytes of dual-port emulation memory and provides two
slots for additional emulation memory modules:
•
HP 64171A 256 Kbyte Memory Modules or HP 64171B 1 Mbyte Memory
Modules (0 wait state emulation memory through 16.7 MHz, 1 wait state
above 16.7 MHz).
•
HP 64172A 256 Kbyte Memory Modules or HP 64172B 1 Mbyte Memory
Modules (0 wait state emulation memory through 25 MHz).
•
HP 64173A 4 Mbyte Memory Modules (0 wait state emulation memory
through 22 MHz, 1 wait state above 22 MHz).
(The 68340 processor is programmed for the correct number of wait states by user
code.) If memory modules are mixed, the performance characteristics of the slower
module should be used.
Emulation memory is made available to the mapper in blocks. When you map an
address range to emulation memory, at least one block is assigned to the range.
When a block of emulation memory is assigned to a range, it is no longer available,
even though part of the block may be unused.
Emulation memory in bank 0 of the emulator probe is divided into 4 equal blocks,
and memory in bank 1 is divided into 2 equal blocks. The 4 Kbyte block of
dual-port emulation memory is 1 block.
When you map ranges of emulation memory, blocks are allocated so as to leave the
greatest amount of emulation memory available. For example, if you map the range
0 through 0FFH as emulation memory, the 4 Kbyte block of dual-port memory is
used if possible; if that block has already been used, the next smallest available
block is used.
93
Chapter 4: Using the Emulator
Mapping Memory
You should map all memory ranges used by your programs before loading
programs into memory.
Using Emulation Memory to Substitute for 8-Bit Memory
Emulation memory is 16-bit wide memory. However, you can use emulation
memory to substitute for 8-bit memory by using one of the chip selects and
generating internal DSACKx signals for an 8-bit port. You must place the
appropriate values into the emulator configuration (cf_sim) versions of the chip
select address and mask registers so that emulation memory is accessed correctly.
Using Chip Selects to Access Emulation Memory
When using chip selects to access emulation memory, the DSACKx signals can be
generated internally or externally.
If the DSACKx signals are generated externally (as defined by the cf_csxmask
register), emulation memory must be interlocked with the target system (use the dsi
attribute when mapping the emulation memory range); otherwise, there will be no
DSACKx response.
Fast Termination Mode
Emulation memory does not support the fast termination mode (-1 wait state) that
can be defined in the chip select registers. If a chip select is programmed for this
mode, it will override the mapper and force access to the target system.
External DMA Access to Emulation Memory
External direct memory access (DMA) to emulation memory is not permitted.
The HP 64751 emulator supports operation of the two 68340 on-chip DMA
channels in both single- and dual-address modes. Dual-address transfers can access
emulation memory; single-address transfers must be between peripherals and
memory in the target system only.
To map memory ranges
• Use the map <range> <type> <attrib> command.
94
Chapter 4: Using the Emulator
Mapping Memory
The <type> parameter allows you to characterize the memory range as emulation
RAM, emulation ROM, target system RAM, target system ROM, or as guarded
memory.
Guarded memory accesses will cause emulator execution to break into the monitor
program.
Writes to locations characterized as ROM will cause emulator execution to break
into the monitor program if the rom break condition is enabled (bc -e rom).
Even though execution breaks into the monitor, the memory location is modified if
it’s in emulation ROM or target system RAM mapped as ROM.
The <attrib> parameter can be:
dp
Dual-port emulation memory.
One emulation memory range, up to 4 Kbytes in length, can be
given the dp attribute. The dp attribute specifies that the range
be mapped to the 4 Kbyte block of dual-port emulation
memory. If a foreground monitor program is selected, the dp
attribute is automatically assigned to the memory range
reserved for the monitor program.
dsi
Interlock emulation memory and target system /DSACK.
The dsi attribute specifies that accesses in that range of
emulation memory be synchronized with the target system.
This means the termination of accesses in the range will not
occur until the target system provides a /DSACK. If the target
system does not generate a /DSACK, the emulator will be
unable to break into the monitor and a "CPU in wait state"
status will result.
When interlocking is disabled, accesses to emulation memory
will be terminated by a /DSACK signal generated by the
emulator. Any cycle termination signals generated by the target
system during emulation memory accesses, including /BERR,
will be ignored.
cs0
Use 68340 chip select 0.
95
Chapter 4: Using the Emulator
Mapping Memory
The cs0 attribute allows you to emulate the 68340’s global chip
select operation. One memory range, either target or emulation,
can be given this attribute. Refer to the "To emulate global chip
select operation" task description at the end of this section.
Examples
Consider the following section summary from the linker load map output listing.
SECTION SUMMARY
--------------SECTION
0
env
prog
const
lib
libc
libm
mon
stack
envdata
data
idata
udata
libdata
libcdata
mondata
heap
ATTRIBUTE
START
END
LENGTH
ALIGN
ABSOLUTE DATA
NORMAL
NORMAL CODE
NORMAL CODE
NORMAL ROM
NORMAL CODE
NORMAL CODE
00000000
00000030
00000400
0000097E
00000A62
00000AC6
00000E28
00000E7C
00000E7C
00040000
00060000
00060054
00060075
00060075
00060078
0006007C
00060108
0006012C
0000002F
00000030
0000097C
00000A61
00000AC4
00000E27
00000E7B
00000E7C
00000FC5
00047FFF
00060053
00060074
00060075
00060075
0006007B
00060106
0006012B
00064129
00000030
00000000
0000057D
000000E4
00000063
00000362
00000054
00000000
0000014A
00008000
00000054
00000021
00000000
00000000
00000004
0000008B
00000024
00003FFE
0
2
2
2
2
2
2
0
2
4
4
2
0
0
4
2
2
4
NORMAL
NORMAL
NORMAL
NORMAL
CODE
DATA
DATA
DATA
NORMAL
NORMAL
NORMAL
NORMAL
DATA
DATA
DATA
DATA
(BYTE)
(WORD)
(WORD)
(WORD)
(WORD)
(WORD)
(WORD)
(BYTE)
(WORD)
(LONG)
(LONG)
(WORD)
(BYTE)
(BYTE)
(LONG)
(WORD)
(WORD)
(LONG)
Notice the ABSOLUTE DATA, CODE, and ROM sections occupy locations 0
through 0FC5H. Because the contents of these sections will eventually reside in
target system ROM, this area should be characterized as ROM when mapped. This
will prevent these locations from being written over accidentally. If the rom break
condition is enabled, instructions that attempt to write to these locations will cause
emulator execution to break into the monitor.
Also, notice the DATA sections occupy locations 40000H through 47FFFH and
60000H through 64129H. Since these sections are written to, they should be
characterized as RAM when mapped.
To map emulation memory for the above program, you would enter the following
map commands.
R>map 0..0fff erom
R>map 40000..47fff eram
96
Chapter 4: Using the Emulator
Mapping Memory
R>map 60000..64fff eram
To display the memory map
• Enter the map command with no parameters.
Examples
To view the memory map, enter the map command with no parameters.
R>map
# remaining number of terms
# remaining emulation memory
map 000000000..000000fff
map 000040000..000047fff
map 000060000..000064fff
map other tram
: 4
: 20000h bytes
erom
eram
eram
# term 1
# term 2
# term 3
To characterize unmapped ranges
• Enter the map other command.
The default characterization for unmapped memory ranges are treated as target
system RAM.
The "other" term cannot be mapped as emulation memory.
Examples
To characterize unmapped ranges as target RAM:
R>map other tram
To characterize unmapped ranges as guarded memory:
R>map other grd
97
Chapter 4: Using the Emulator
Mapping Memory
To delete memory map ranges
• Enter the map -d command.
Note that programs should be reloaded after deleting mapper terms. The memory
mapper may re-assign blocks of emulation memory after the insertion or deletion of
mapper terms.
Examples
To delete term 1 in the memory map:
R>map -d 1
To delete all map terms:
R>map -d *
To map memory ranges that use function codes
• Specify function codes with address ranges when mapping memory.
The function code can be:
x (no function code is used — absolute files are loaded into memory ranges
that have been mapped without function codes).
s (supervisor space).
u (user space).
p (program space).
d (data space).
sp (supervisor program space).
sd (supervisor data space).
up (user program space).
ud (user data space).
If you specify a function code when mapping a range of memory, you must include
the function code when referring to locations in that range. If you don’t include the
function code, an "ambiguous address" error message is displayed.
98
Chapter 4: Using the Emulator
Mapping Memory
If you use different function codes, it’s possible to map address ranges that overlap.
When address ranges with different function codes overlap, you must load a
separately linked module for the space associated with each function code. The
modules are linked separately because linker errors occur when address ranges
overlap.
When address ranges are mapped with different function codes, and there are no
overlapping ranges, your program modules may exist in one absolute file.
However, you have to use multiple load commands—one for each function code
specifier. This is necessary to load the various sections of the absolute file into the
appropriate function code qualified memory ranges. When you do this, be sure that
all address ranges not mapped (that is, the "other" memory mapper term) are
mapped as target RAM. When "other" is mapped as guarded, guarded memory
access errors (from the attempt to load the absolute file sections that are outside the
specified function code range) can prevent the absolute file sections that are inside
the specified function range from being loaded.
Examples
Suppose you’re developing a system with the following characteristics:
•
Input port at 100 hex.
•
Output port at 400 hex.
•
Supervisor program from 1000 through 1fff hex.
•
Supervisor data from 2000 through 2fff hex.
•
User program from 3000 through 3fff hex.
•
User data from 3000 through 3fff hex.
Notice that the last two terms have address ranges that overlap. You can use
function codes to cause these terms to be mapped to different blocks of memory.
99
Chapter 4: Using the Emulator
Mapping Memory
Suppose also that the only things that exist in your target system at this time are the
input and output ports and some control logic; no memory is available. You can
reflect this by mapping the I/O ports to target system memory space and the rest of
memory to emulation memory space:
R>map -d *
R>map 0..0fff tram
R>map 1000..1fff@sp erom
R>map 2000..2fff@sd eram
R>map 3000..3fff@up eram
R>map 3000..3fff@ud eram
R>map
# remaining number of terms
# remaining emulation memory
map 000000000..000000fff
map 000001000..000001fff@sp
map 000002000..000002fff@sd
map 000003000..000003fff@up
map 000003000..000003fff@ud
map other tram
: 2
: 10000h bytes
tram
erom
eram
eram
eram
#
#
#
#
#
term
term
term
term
term
1
2
3
4
5
Notice that the mapper reserved two different spaces for the user program and user
data areas even though the addresses are the same.
To display a byte of memory at 1000H:
R>b
M>m -db 1000
!ERROR 312! Ambiguous address: 000001000
M>m -db 1000@sp
000001000@sp 00
To emulate global chip select operation
1 Use the cs0 attribute when mapping the boot ROM address range.
2 Make sure the cf_mbar register is valid, and modify the cf_cs0addr and cf_cs0mask
registers to the appropriate values.
Or:
Load a previously saved configuration from a command file that has the
appropriate values of cf_mbar, cf_cs0addr, and cf_cs0mask.
100
Chapter 4: Using the Emulator
Mapping Memory
3 If the you’re emulating boot ROM with emulation memory, load the boot ROM
code.
4 Run from reset.
The advantages are:
•
You can put the boot ROM contents in emulation memory.
•
The base address of the boot ROM does not have to be at address 0 to fetch
vectors from reset.
•
If boot ROM is already in the target system, you can prevent guarded memory
accesses when running from reset.
Limitations:
The maximum amount of emulation memory that can be mapped is half the amount
of memory installed in bank 1 or one quarter the amount of memory installed in
bank 0, whichever is larger.
Examples
This example shows how to use the cs0 memory map attribute to emulate the
68340’s global chip select operation. First, initialize the emulator:
R>init
# Limited initialization complete
To map the boot ROM address range in emulation memory:
R>map 80000..8ffff erom cs0
You can map all other addresses as guarded memory to show that the fetches of the
supervisor stack pointer and program counter values after reset really come from
the boot ROM address range.
R>map other grd
To modify the emulator configuration registers so appropriate information is sent to
the analyzer:
R>reg cf_mbar=100001
R>reg cf_cs0addr=80001
R>reg cf_cs0mask=0fffd
101
Chapter 4: Using the Emulator
Mapping Memory
To load the supervisor stack pointer and program counter values that will be
fetched from the boot ROM after reset:
R>m -dl 80000=0,81000
M>
To load the boot ROM program into emulation memory (NOP, NOP, BRA.B
81000H):
M>m -dw 81000=4e71,4e71,60fa
To trace execution after reset:
M>t
Emulation trace started
To run from reset:
M>r rst
To display the trace:
U>tl
Line
----0
1
2
3
4
5
6
7
8
9
addr,H
-------00000000
00000002
00000004
00000006
00081000
00081002
00081004
00081006
00081000
00081002
68340 Mnemonic
---------------------------------------$0000
supr prgm long rd (ds16)
$0000
supr prgm word rd (ds16)
$0008
supr prgm long rd (ds16)
$1000
supr prgm word rd (ds16)
$4E71
supr prgm word rd (ds16)
$4E71
supr prgm word rd (ds16)
$60FA
supr prgm word rd (ds16)
$0000
supr prgm word rd (ds16)
$4E71
supr prgm word rd (ds16)
$4E71
supr prgm word rd (ds16)
count,R
----------0.720 uS
0.720 uS
0.720 uS
0.840 uS
0.720 uS
0.720 uS
0.720 uS
0.680 uS
0.720 uS
seq
--+
.
.
.
.
.
.
.
.
.
Notice the supervisor stack pointer and program counter values that were loaded at
80000H and 80004H are fetched from memory locations 0 through 7 and the
program begins running at 81000H.
102
Chapter 4: Using the Emulator
Mapping Memory
Suppose your boot ROM is at a higher address:
U>init
# Limited initialization complete
R>map 0ff000000..0ff00ffff erom cs0
R>map other grd
R>reg cf_mbar=100001
R>reg cf_cs0addr=0ff000001
R>reg cf_cs0mask=0fffd
R>m -dl 0ff000000=0,0ff001000
M>m -dw 0ff001000=4e71,4e71,60fa
M>t
Emulation trace started
M>r rst
U>tl
Line
----0
1
2
3
4
5
6
7
8
9
addr,H
-------ff000000
ff000002
ff000004
ff000006
ff001000
ff001002
ff001004
ff001006
ff001000
ff001002
68340 Mnemonic
---------------------------------------$0000
supr prgm long rd (ds16)
$0000
supr prgm word rd (ds16)
$FF00
supr prgm long rd (ds16)
$1000
supr prgm word rd (ds16)
$4E71
supr prgm word rd (ds16)
$4E71
supr prgm word rd (ds16)
$60FA
supr prgm word rd (ds16)
$0000
supr prgm word rd (ds16)
$4E71
supr prgm word rd (ds16)
$4E71
supr prgm word rd (ds16)
count,R
----------0.720 uS
0.720 uS
0.720 uS
0.840 uS
0.680 uS
0.720 uS
0.720 uS
0.720 uS
0.720 uS
seq
--+
.
.
.
.
.
.
.
.
.
Notice the supervisor stack pointer and program counter values that were loaded at
0FF000000H appear to be fetched from memory locations 0FF000000H through
0FF000007H when they are really fetched from locations 0 through 7. This is
because the upper 8 bits of the cf_cs0addr register are sent to the analyzer instead
of A31-A24 (this is true even if Port A is set up to be address lines).
103
Chapter 4: Using the Emulator
Loading Absolute Files
Loading Absolute Files
This section describes the tasks related to loading absolute files into the emulator.
You can load absolute files when using the serial connection or when using the
LAN connection:
•
When using the serial connection, the HP 64700 is connected to a host
computer and accessed via a terminal emulation program. In this
configuration, you can load absolute files by downloading from the same port.
•
When using the LAN connection, the HP 64700 is connected to the same LAN
as a computer that has the ARPA Services File Transfer Protocol (ftp)
software. In this configuration, you can use the ftp command to load absolute
files over the LAN.
The Terminal Interface’s load command will accept absolute files in the following
formats:
•
HP absolute.
•
Intel hexadecimal.
•
Extended Tektronix hexadecimal.
•
Motorola S-records.
The HP AxLS software development tools generate IEEE-695 format or HP format
absolute files.
104
Chapter 4: Using the Emulator
Loading Absolute Files
To load absolute files over the serial port
• Load the file over the "command" port.
If the emulator is connected to a host computer, and you are accessing the emulator
from the host computer via a terminal emulation program, you can also download
files with the load command. However, in the remote configuration, files are
loaded from the same port that commands are entered from.
Examples
To download a Tektronix hexadecimal file from a Vectra personal computer:
R>load -t <RETURN>
After you have entered the load command, exit from the terminal emulation
program to the MS-DOS operating system. Then, copy your hexadecimal file to
the port connected to the emulator, for example:
C:\copy thexfile com1: <RETURN>
Now you can return to the terminal emulation program and verify that the file was
loaded (for example, by displaying memory in mnemonic format).
To load absolute files over the LAN
• Use the ftp command on your local host computer to transfer files to the remote
HP 64700.
When connecting to the HP 64700’s ftp interface, you can use either the
HP 64700’s hostname or the Internet Protocol (IP) address (or internet address).
When you use the HP 64700’s hostname, the ftp software on your computer will
look up the internet address in the hosts table, or perhaps a name server will return
the internet address.
105
Chapter 4: Using the Emulator
Loading Absolute Files
Examples
To connect to the emulator’s ftp interface, enter the following command (use any
name and password):
$ ftp 15.35.226.210
Connected to 15.35.226.210.
220 User connected to HP64700
Name (15.35.226.210:guest):
Password (15.35.226.210:guest):
230NOTICE
This utility program is unsupported. It is provided at no cost.
Hewlett-Packard makes no warranty on its quality or fitness for
a particular purpose.
FTP on the HP64700 serves as a means for downloading absolute files to the
emulation environment. The file transfer can be be performed as follows:
1. The data mode type must be set to IMAGE (binary)
2. Store the file using options to indicate the file format. The following
example uses PUT as the host command for sending the file. This may be
different for your ftp implementation.
put <file_name> <options>
<file_name> - host file to be loaded.
<options>
- The options are preceeded by a minus (-). The available
options vary for individual emulators. All support HP OLS, Intel hex,
Motorola S-records, and Extended Tek Hex. Emulator specific options can
be viewed by issuing a Terminal Mode help for the load command.
put
put
put
put
hpfile.X
intelfile
motfile
tekfile
-h
-i
-m
-t
#to
#to
#to
#to
download
download
download
download
an HP OLS file
an Intel Hex file
a Motorola S-record file
an Extended Tek Hex file
230
To set up ftp for binary file transfers:
ftp> binary
200 Type set to I
To download the HP 64000 format absolute file into the emulator:
ftp> put cmd_rdr.X -h
200 Port
ok
150
226R>
226 Transfer completed
3332 bytes sent in 0.20 seconds (16.27 Kbytes/sec)
106
Chapter 4: Using the Emulator
Loading Absolute Files
To exit out of the ftp interface:
ftp> quit
221 Goodbye
$
To load absolute files into memory mapped with
function codes
1 Enter the cf lfc=<function_code> command.
2 Load the absolute file.
3 Repeat steps 1 and 2 for each range mapped with a different function code.
Absolute files are only loaded into the address ranges that are mapped with the
function code specified. For example, if you enter the cf lfc=s command,
subsequent load commands only load the absolute file into memory ranges
designated as "supervisor" space (that is, mapped with map
<address>..<address>@s commands).
The function code can be:
x (no function code is used — absolute files are loaded into memory ranges
that have been mapped without function codes).
s (supervisor space).
u (user space).
p (program space).
d (data space).
sp (supervisor program space).
sd (supervisor data space).
up (user program space).
107
Chapter 4: Using the Emulator
Loading Absolute Files
ud (user data space).
Refer to the previous "To load absolute files ..." task descriptions for more
information on loading absolute files.
To simplify loading of many modules, you can include the above sequence in
macros defined with the mac command or in host computer resident command files.
Examples
To load the portions of the absolute file that reside in supervisor memory space:
M>cf lfc=s
M>load -hbs "transfer -tb absfile.X"<ESC>g
108
Chapter 4: Using the Emulator
Loading and Using Symbols
Loading and Using Symbols
The emulator supports the use of symbolic references. The symbols can be loaded
from an ASCII text file on a host computer or defined with the sym command.
This section describes the tasks related to loading ASCII symbol files into the
emulator. ASCII symbol files must be loaded from a host computer.
Symbols will be shown when you display memory in mnemonic format. Also, you
can use the -s or -e options to the trace list command (tl) to have symbolic
information included in the trace list.
You can typically use symbol table information from a linker map file when
creating the ASCII symbol file; however, you need to make sure the information is
in the following format.
#
:global_sybmol
module:local_symbol
.
.
.
#
This section describes how to:
•
Load symbol files over the serial port.
•
Load symbol files over the LAN.
•
Define user symbols.
•
Display symbols.
•
Remove symbols.
To load symbol files over the serial port
• Use the load -S command.
109
Chapter 4: Using the Emulator
Loading and Using Symbols
ASCII symbol files are loaded into the emulator with the load -S command.
Examples
Suppose the "cmd_rdr.sym" file below exists on a Vectra personal computer.
#
:Cmd_Input
:Msg_Dest
:Write_Msg
:main
atexit:__exec_funcs
atexit:__top_of_func_stack
atexit:_atexit
cmd_rdr:_Cmd_Input
cmd_rdr:_Msg_Dest
cmd_rdr:_Write_Msg
cmd_rdr:_main
crt1:__exit
crt1:_exit
crt1:entry
data_gen:__infinity
data_gen:__malloc_init
data_gen:__rand_seed
data_gen:_errno
disp_msg:XEnv_68k_except
disp_msg:__display_message
disp_msg:end_of_program
fperror:__fp_control
fperror:__fp_error
fperror:__fp_errorf
fperror:__fp_errori
fperror:__fp_status
getmem:__getmem
getmem:nextblk
mon_stub:JSR_ENTRY
mon_stub:MONITOR_MESSAGE
sysheap:TopOfHeap
sysheap:heap
sysstack:TopOfStack
sysstack:stack
systrap:trap
#
00060054
00060055
00000984
000009B0
00000E54
000600FC
00000E28
00060054
00060055
00000984
000009B0
0000047E
0000046A
00000400
00000E74
00060106
000600FE
00060102
0006002E
000004FA
00000528
0006007A
00000AC6
00000AC6
00000AC6
00060078
000005BA
00060030
00000FC2
00060128
0006412A
0006012C
00048000
00040000
000005E4
To load symbols from the ASCII file above:
R>load -S <RETURN>
110
Chapter 4: Using the Emulator
Loading and Using Symbols
After you have entered the load command, exit from the terminal emulation
program to the MS-DOS operating system. Then, copy your symbols file to the
port connected to the emulator, for example:
C:\copy cmd_rdr.sym com1: <RETURN>
To load symbols over the LAN
• Use the ftp command on your local host computer to transfer files to the remote
HP 64700.
Loading symbol files over the LAN is the same as loading absolute files over the
LAN, except that a different option is used with the "put" command in ftp.
Examples
To connect to the emulator’s ftp interface, enter the following command (use any
name and password):
$ ftp 15.35.226.210
Connected to 15.35.226.210.
220 User connected to HP64700
Name (15.35.226.210:guest):
Password (15.35.226.210:guest):
230NOTICE
This utility program is unsupported. It is provided at no cost.
Hewlett-Packard makes no warranty on its quality or fitness for
a particular purpose.
.
.
.
To set up ftp for binary file transfers:
ftp> binary
200 Type set to I
To download the symbol file into the emulator:
ftp> put cmd_rdr.sym -S
200 Port
ok
150
226R>
111
Chapter 4: Using the Emulator
Loading and Using Symbols
226 Transfer completed
1789 bytes sent in 4.78 seconds (0.37 Kbytes/sec)
To exit out of the ftp interface:
ftp> quit
221 Goodbye
$
To define user symbols
• Use the sym <name>=<addr> command.
You can use the sym command to define new symbols.
Examples
To define the symbol "while_statement" for the address 0A00H:
M>sym while_statement=0a00
To display symbols
• Use the sym command.
After symbols are loaded, you can use the sym command to display and delete
symbols, as well as to define new symbols.
Examples
To display all the symbols:
M>sym
sym
sym
sym
sym
sym
sym
sym
sym
112
while_statement=000000a00
Cmd_Input=000060054
Msg_Dest=000060055
Write_Msg=000000984
main=0000009b0
atexit:__exec_funcs=000000e54
atexit:__top_of_func_stack=0000600fc
atexit:_atexit=000000e28
Chapter 4: Using the Emulator
Loading and Using Symbols
sym
sym
sym
sym
sym
sym
sym
sym
sym
sym
sym
sym
sym
sym
sym
sym
sym
sym
sym
sym
sym
sym
sym
sym
sym
sym
sym
sym
cmd_rdr:_Cmd_Input=000060054
cmd_rdr:_Msg_Dest=000060055
cmd_rdr:_Write_Msg=000000984
cmd_rdr:_main=0000009b0
crt1:__exit=00000047e
crt1:_exit=00000046a
crt1:entry=000000400
data_gen:__infinity=000000e74
data_gen:__malloc_init=000060106
data_gen:__rand_seed=0000600fe
data_gen:_errno=000060102
disp_msg:XEnv_68k_except=00006002e
disp_msg:__display_message=0000004fa
disp_msg:end_of_program=000000528
fperror:__fp_control=00006007a
fperror:__fp_error=000000ac6
fperror:__fp_errorf=000000ac6
fperror:__fp_errori=000000ac6
fperror:__fp_status=000060078
getmem:__getmem=0000005ba
getmem:nextblk=000060030
mon_stub:JSR_ENTRY=000000fc2
mon_stub:MONITOR_MESSAGE=000060128
sysheap:TopOfHeap=00006412a
sysheap:heap=00006012c
sysstack:TopOfStack=000048000
sysstack:stack=000040000
systrap:trap=0000005e4
To display all the global symbols:
M>sym
sym
sym
sym
sym
-g
Cmd_Input=000060054
Msg_Dest=000060055
Write_Msg=000000984
main=0000009b0
To display all the local modules:
M>sym
sym
sym
sym
sym
sym
sym
sym
sym
sym
sym
sym
-l
atexit:
cmd_rdr:
crt1:
data_gen:
disp_msg:
fperror:
getmem:
mon_stub:
sysheap:
sysstack:
systrap:
To display all the user-defined symbols:
M>sym -u
sym while_statement=000000a00
113
Chapter 4: Using the Emulator
Loading and Using Symbols
To remove symbols
• Use the sym -d command.
You can use the sym -d command to delete symbols.
Examples
To delete all user symbols:
R>sym -du
To delete all global symbols:
R>sym -dg
To delete all local symbols in all modules:
R>sym -dl
To delete all symbols:
R>sym -d
114
Chapter 4: Using the Emulator
Executing User Programs
Executing User Programs
This section describes how to:
•
Start the emulator running the user (target system) program.
•
Stop (break from) user program execution.
•
Step through user programs.
•
Reset the emulation processor.
To run (execute) user programs
• Use the r command.
The run command causes the emulator to execute the user program. When the
emulator is executing the user program, the "U" emulator status character is shown
in the Terminal Interface prompt.
The r command by itself runs from the current program counter value.
The r rst (run from reset) command resets the emulation processor and lets the
emulator run and fetch its stack pointer and program counter value from memory.
A rst (reset) command followed by a r command will load the
cf rv=<ssp_value>,<pc_value> values into the emulation processor and run from
the loaded program counter value. This is true for both background and foreground
monitors.
Examples
To run from the current program counter:
M>r
U>
115
Chapter 4: Using the Emulator
Executing User Programs
To run from address 400H:
M>r 400
U>
To stop (break from) user program execution
• Use the b command.
You can use the break command (b) command to generate a break to the monitor.
If the user program executes a STOP or LPSTOP instruction, you cannot break to
the emulator’s monitor state while the processor is in the stopped state. The break
command uses the emulation processor background debug mode (BDM), and the
processor must be executing instructions in order to enter the BDM. An interrupt
from the target system will cause the 68340 to exit the stopped state; then, the break
command will work normally.
The "Using Software Breakpoints" section of this chapter describes how to stop
execution at particular points in the user program.
Examples
To break execution into the monitor:
U>b
M>
To break from reset into the monitor:
R>b
M>
To step through user programs
• Use the s command.
116
Chapter 4: Using the Emulator
Executing User Programs
The emulator allows you to step through the user program. You can step from the
current program counter (in other words, instruction pointer) or from a particular
address. You can step a single instruction or a number of instructions.
A step count of 0 will cause the stepping to continue "forever" (until some break
condition, such as "write to ROM", is encountered, or until you enter <CTRL>c).
If a foreground monitor is selected, the target system trace vector must point to
TRACE_ENTRY in the foreground monitor code for single step to function
properly.
Examples
To step one instruction from the current program counter:
M>s
000000a08@sp PC = 000000a00@sp
BEQ.B
$00000A00
To step a number of instructions from the current program counter:
M>s 8
000000a00@sp 000000a02@sp 000000a08@sp 000000a00@sp 000000a02@sp 000000a08@sp 000000a00@sp 000000a02@sp PC = 000000a08@sp
NOP
MOVE.B
BEQ.B
NOP
MOVE.B
BEQ.B
NOP
MOVE.B
Cmd_Input,D2
$00000A00
Cmd_Input,D2
$00000A00
Cmd_Input,D2
117
Chapter 4: Using the Emulator
Executing User Programs
To step a number of instructions from a specified address:
M>s 16 main
0000009b0 main
0000009b4@sp 0000009b6@sp 0000009b8@sp 0000009be@sp 0000009c2@sp 0000009c8@sp 0000009ca@sp 0000009cc@sp 0000009cc@sp 0000009cc@sp 0000009cc@sp 0000009cc@sp 0000009cc@sp 0000009cc@sp 0000009cc@sp PC = 0000009cc@sp
LINK.W
A6,#$FF9C
MOVE.L
A2,-(A7)
MOVE.L
D2,-(A7)
MOVEA.L #$00000984,A2
LEA
($FF9C,A6),A0
MOVEA.L #$00000A62,A1
MOVEQ
#$00000020,D1
MOVE.B
(A1)+,(A0)+
DBF
D1,$000009CA
DBF
D1,$000009CA
DBF
D1,$000009CA
DBF
D1,$000009CA
DBF
D1,$000009CA
DBF
D1,$000009CA
DBF
D1,$000009CA
DBF
D1,$000009CA
To step until <CTRL>c:
M>s 0
0000009cc@sp
0000009cc@sp
0000009cc@sp
0000009cc@sp
0000009cc@sp
.
.
.
-
DBF
DBF
DBF
DBF
DBF
D1,$000009CA
D1,$000009CA
D1,$000009CA
D1,$000009CA
D1,$000009CA
MOVE.B
BEQ.B
NOP
MOVE.B
BEQ.B
Cmd_Input,D2
$00000A00
<CTRL>c
.
.
.
000000a02@sp 000000a08@sp 000000a00@sp 000000a02@sp 000000a08@sp PC = 000000a02@sp
!STATUS 685! Stepping aborted
118
Cmd_Input,D2
$00000A00
Chapter 4: Using the Emulator
Executing User Programs
To reset the emulation processor
• Use the rst command.
The rst command causes the processor to be held in a reset state until a b (break), r
(run), or s (step) command is entered. A CMB execute signal will also cause the
emulator to run if reset. Also, a request to access memory or registers while reset
will cause a break into the monitor.
The -m option to the rst command specifies that the emulator begin executing in
the monitor after reset.
Examples
To reset the emulation processor:
U>rst
R>
To reset the emulation processor and break into the monitor:
U>rst -m
M>
119
Chapter 4: Using the Emulator
Using Software Breakpoints
Using Software Breakpoints
Software breakpoints provide a way to accurately stop the execution of your
program at selected locations.
When you set a software breakpoint at an address, the instruction at that address is
replaced with a BGND instruction. When the BGND instruction is executed, the
emulator enters its monitor state, and the original instruction is restored in the user
program.
In order to successfully set a software breakpoint, the emulator must be able to
write to the memory location specified. Therefore, software breakpoints cannot be
set in target ROM.
Another way to break user program execution at a certain point is to break on the
analyzer trigger.
This section shows you how to:
Caution
120
•
Enable the breakpoints feature.
•
Set software breakpoints.
•
Display software breakpoints.
•
Enable software breakpoints.
•
Disable software breakpoints.
•
Remove software breakpoints.
•
Disable the breakpoints feature.
Software breakpoints should not be set, cleared, enabled, or disabled while the
emulator is running user code. If any of these commands are entered while the
emulator is running user code, and the emulator is executing code in the area where
the breakpoint is being modified, program execution may be unreliable.
Chapter 4: Using the Emulator
Using Software Breakpoints
To enable the breakpoints feature
• Enter the bc -e bp command.
Currently defined breakpoints are not automatically enabled when you enable the
breakpoints feature; you must explicitly enable the software breakpoints.
To set software breakpoints
• Use the bp <addr> command.
Note that you must only set software breakpoints at memory locations which
contain instruction opcodes (not operands or data).
Examples
To set a software breakpoint at address 0A00H:
M>bp 0a00
To display software breakpoints
• Enter the bp command with no options.
The bp command with no options displays the software breakpoints list. Also, it
shows whether the breakpoint feature is enabled or disabled.
Examples
To display the software breakpoint list:
M>bp
### BREAKPOINT FEATURE IS ENABLED ###
bp 000000a00 # enabled
121
Chapter 4: Using the Emulator
Using Software Breakpoints
To enable software breakpoints
• Use the bp -e <addr> command.
When a breakpoint is hit, it becomes disabled. You can use the -e option to the bp
command to re-enable the software breakpoint.
Examples
To enable the software breakpoint at 0A00H:
M>bp -e 0a00
To enable all software breakpoints:
M>bp -e *
To disable software breakpoints
• Use the bp -d <addr> command.
When a breakpoint is hit, it becomes disabled. You can also disable breakpoints
before they are hit (while they are enabled) by using the -d option to the bp
command.
Examples
To disable the software breakpoint at 0A00H:
M>bp -d 0a00
To remove software breakpoints
• Use the bp -r <addr> command.
122
Chapter 4: Using the Emulator
Using Software Breakpoints
You can remove existing breakpoints by using the -r option to the bp command.
Examples
To remove the software breakpoint at 0A00H from the breakpoint list:
M>bp -r 0a00
To disable the breakpoints feature
• Enter the bc -d bp command.
All breakpoints are disabled, but they remain defined.
123
Chapter 4: Using the Emulator
Using Break Conditions
Using Break Conditions
Break conditions allow you to specify breaks in the user program when certain
events occur during emulation processor execution. (You can also break user
program execution when certain events occur in another HP 64700; these break
conditions are described in the "Making Coordinated Measurements" chapter.)
The bc command lets you enable or disable breaks on the following conditions:
•
Writes to ROM.
•
Analyzer trigger.
To break on writes to ROM
• Enter the bc -e rom command.
When the rom break condition is enabled, the emulator will break from user
program execution when a write occurs to a memory location mapped as ROM.
Even though execution breaks into the monitor, the memory location is modified if
it’s in emulation ROM or target system RAM mapped as ROM.
Examples
To enable breaks on writes to ROM:
M>bc -e rom
To disable breaks on writes to ROM:
M>bc -d rom
124
Chapter 4: Using the Emulator
Using Break Conditions
To break on an analyzer trigger
1 Specify internal signal for analyzer to drive.
2 Enable the emulator break on the internal signal.
Use the tgout (trigger output) command to specify which signal is driven when the
emulation analyzer triggers.
Either the "trig1" or the "trig2" internal signals can be driven on the trigger.
Note that the actual break may be several cycles after the analyzer trigger.
After the break occurs, the analyzer will stop driving the trig line that caused the
break. Therefore, if trig2 is used both to break and to drive the CMB TRIGGER
(for example), TRIGGER will go true when the trigger is found and then will go
false after the emulator breaks. However, if trig2 is used to cause the break and
trig1 is used to drive the CMB TRIGGER, TRIGGER will stay true after the
trigger until the trace is halted or until the next trace starts.
Examples
To break on the emulation analyzer trigger (over the internal trig2) signal:
M>tg any
M>tgout trig2
M>bc -e trig2
M>r 400
U>t
Emulation trace started
!ASYNC_STAT 619! trig2 break
M>
To disable breaks on the internal trig2 signal:
M>bc -d trig2
125
Accessing Registers
This section describes tasks related to displaying and modifying emulation
processor registers.
You can display the contents of an individual register or of all the registers.
This section shows you how to:
•
Display register contents.
•
Display a register in expanded format.
•
Modify register contents.
Refer to the reg command description in the "Commands" chapter for a description
of the 68340 registers.
To display register contents
• Use the reg command.
When displaying registers, you can display classes of registers and individual
registers.
When register values are shown as asterisks (*), it means the register is a
"write-only" register and that its contents cannot be displayed.
The least significant bit of the emulation processor’s mbar register must be a 1
(which means the mbar contents are valid) before you can display or modify
registers in the sim, dma1, dma2, serial, timer1, or timer2 register classes.
126
Chapter 4: Using the Emulator
Accessing Registers
Examples
To display the basic register contents:
M>reg
reg
reg
reg
reg
pc=00000a08 st=2704 d0=00000000 d1=0000ffff d2=0000ff00 d3=00000000
d4=00000000 d5=00000000 d6=00000000 d7=00000000 a0=00047fe3 a1=00000ac5
a2=00000984 a3=00000000 a4=00000000 a5=00068054 a6=00047fe4 a7=00047f78
usp=00000001 ssp=00047f78 vbr=00000000 sfc=06 dfc=00
To display the 68340 system integration module (SIM) register contents:
M>reg sim
!ERROR 149! Register mbar valid bit not set
!ERROR 631! Unable to read registers in class: sim
M>reg mbar=100001
M>reg sim
reg
reg
reg
reg
reg
mbar=00100001 sim_mcr=608f syncr=3f08 avr=00 rsr=80 porta=ff ddra=00
ppara1=ff ppara2=00 portb=ff portb1=ff ddrb=00 pparb=ff swiv=0f sypcr=00
picr=000f pitr=0000 swsr=00 cs0mask=0000fffd cs0addr=ff000000
cs1mask=00000000 cs1addr=00000000 cs2mask=00000000 cs2addr=00000000
cs3mask=00000000 cs3addr=00000000
To display the DMA module 1 register contents:
M>reg dma1
reg dma_mcr1=0080 intr1=000f ccr1=8080 csr1=00 fcr1=80 sar1=ffffffe0
reg dar1=dff4e821 btc1=ffffffe1
To display the serial module register contents:
M>reg serial
reg serial_mcr=0080 ilr=00 ivr=0f mr1a=00 sra=00 csra=** cra=** rba=00 tba=**
reg ipcr=33 acr=** isr=00 ier=** mr1b=00 srb=00 csrb=** crb=** rbb=00 tbb=**
reg ip=03 opcr=** op_set=** op_rst=** mr2a=00 mr2b=00
Notice that asterisks (*) appear for "write-only" registers.
To display the timer module 2 register contents:
M>reg timer2
reg timer_mcr2=0080 ir2=000f cr2=0000 sr2=00ff cntr2=0000 prel12=ffff
reg prel22=ffff com2=0000
To display the emulator’s system integration module (SIM) register contents:
M>reg cf_sim
reg
reg
reg
reg
cf_mbar=00000000 cf_sim_mcr=608f cf_ppara1=ff cf_ppara2=00
cf_cs0mask=00000000 cf_cs0addr=00000000 cf_cs1mask=00000000
cf_cs1addr=00000000 cf_cs2mask=00000000 cf_cs2addr=00000000
cf_cs3mask=00000000 cf_cs3addr=00000000
127
Chapter 4: Using the Emulator
Accessing Registers
To display a register in expanded format
1 Enter the cf regfmt=exp command.
2 Use the reg command to display the contents of a single register.
The cf regfmt=exp command causes some individual register displays to contain
expanded information about the fields within the register. The fields are decoded,
and the contents of the bits or fields within the register are described.
The cf regfmt=norm command returns to the default register displays which show
only the hexadecimal contents of the register.
Refer to the 68340 microprocessor users manual for complete information about
fields within individual registers and their meanings.
Examples
To display the SIM module configuration register:
M>cf regfmt=exp
M>reg mbar=100001
M>reg sim_mcr
reg sim_mcr=0608f
FRZ1 SW DIS, FRZ0 INTR DIS, FIRQ 4 INTR 4 EXT CS
SHEN1-0 DIS, SUPV, IARB3-0=0f
To modify the SIM module configuration register and display it again:
M>reg sim_mcr=600f
M>reg sim_mcr
reg sim_mcr=0600f
FRZ1 SW DIS, FRZ0 INTR DIS, FIRQ 4 INTR 4 EXT CS
SHEN1-0 DIS, USER, IARB3-0=0f
Notice that the expanded information now contains USER instead of SUPV due to
the change in bit 7 of the register.
To return to the normal register display:
M>cf regfmt=norm
M>reg sim_mcr
reg sim_mcr=0600f
128
Chapter 4: Using the Emulator
Accessing Registers
To modify register contents
• Use the reg <reg>=<value> command.
Examples
To modify register d7 to contain the value 0FFFF1234H:
M>reg d7=0ffff1234
129
Chapter 4: Using the Emulator
Accessing Memory
Accessing Memory
This section describes the tasks related to displaying, modifying, copying, and
searching the contents of memory locations.
You can display and modify the contents of memory in byte, word, and long word
lengths. You can also display the contents of memory in assembly language
mnemonic format.
When displaying memory, the display mode specifies the format of the memory
display. When modifying memory, the display mode specifies the size of the
location to be modified.
When accessing target memory locations, the access mode specifies the type of
microprocessor cycles that are used to read or write the value(s).
This section describes the following tasks:
•
Setting the display and access modes.
•
Displaying memory contents.
•
Modifying memory contents.
•
Copying memory contents.
•
Searching memory for data.
To set the display and access modes
• Use the mo command.
When displaying memory, the display mode specifies the format of the memory
display.
When modifying memory, the display mode specifies the size of the memory
location that gets accessed. For example, suppose you modify a memory location
with the value 41H; in the byte display mode, the value is 41H, but in the word
130
Chapter 4: Using the Emulator
Accessing Memory
display mode, the value is 0041H, and in the long word display mode the value is
00000041H.
When accessing target system memory locations, the access mode specifies the type
of microprocessor cycles that are used to read or write the value(s). For example,
when the access mode is byte and a target system location is modified to contain
the value 12345678H, byte instructions are used to write the byte values 12H, 34H,
56H, and 78H to target system memory.
You can also specify the display mode in the m command, which is used to display
and modify memory locations.
Examples
To display the display and access mode settings:
M>mo
mo -ab -dw
To specify the long word display mode:
M>mo -dl
To specify the word access mode:
M>mo -aw
To display memory contents
• Use the m command.
The m command displays the contents of the address or address range specified.
Also, you can specify the display mode with the -d option.
For viewing code in memory, the m -dm command displays memory contents in
disassembled mnemonic format.
131
Chapter 4: Using the Emulator
Accessing Memory
Examples
To display the byte contents of a memory location:
M>m -db Msg_Dest
000060055 00
To display the contents of a range of memory locations:
M>m -dw Msg_Dest..Msg_Dest+1f
000060055 0000 0000 0000 0000 0000 0000 0000 0000
000060065 0000 0000 0000 0000 0000 0000 0000 0000
To display the range "main" through "main+7" in mnemonic format:
M>m -dm main..main+7
0000009b0 main
0000009b4 0000009b6 -
LINK.W
MOVE.L
MOVE.L
A6,#$FF9C
A2,-(A7)
D2,-(A7)
To modify memory contents
• Use the m <addr>=<value> command.
You can modify the contents of a memory location or a range of memory locations.
Also, you can specify the display mode with the -d option.
You cannot modify odd memory locations with word or long values because the
68340 doesn’t support misaligned operand transfers.
Examples
To modify the location "Cmd_Input" with a byte value of 41H:
M>m -db Cmd_Input=41
M>m -db Cmd_Input
000060054 41
To modify the range of locations from "Msg_Dest" through "Msg_Dest+1FH" with
byte values of 41H, 42H, 43H, and 44H:
M>m -db Msg_Dest..Msg_Dest+1f=41,42,43,44
M>m -db Msg_Dest..Msg_Dest+1f
000060055 41 42 43 44 41 42 43 44 41 42 43 44 41 42 43 44
000060065 41 42 43 44 41 42 43 44 41 42 43 44 41 42 43 44
132
Chapter 4: Using the Emulator
Accessing Memory
To copy memory contents
• Use the cp command.
The cp (copy memory) command gives you the ability to copy the contents of one
range of memory to another.
Examples
To copy the range of memory locations from 400H through 0FC5H to 1000H:
R>cp 1000=400..0fc5
To search memory
• Use the ser command.
The ser command allows you to search for data in a range of memory locations. If
any part of the data specified in the ser command is not found, no match is
displayed.
Examples
To search the range of memory from 60000H through 64FFFH for the ASCII string
"Command A Entered":
M>ser 0..0fff="Command A Entered"
pattern match at address: 000000a62
M>ser 0..0fff="Command A EntereD"
M>
Notice that if the string is not found, no information is returned.
133
134
5
Using the Emulation Analyzer - Easy
Configuration
135
Using the Emulation Analyzer - Easy
Configuration
This chapter describes tasks you may wish to perform while using the emulation
analyzer in its "easy" configuration (the "Using the Emulation Analyzer - Complex
Configuration" chapter describes how to access and use the full capability of the
analyzer). These tasks are grouped into the following sections:
136
•
Initializing the analyzer.
•
Qualifying the analyzer clock.
•
Starting and stopping trace measurements.
•
Displaying trace lists.
•
Qualifying trigger and store conditions.
•
Using the sequencer.
Chapter 5: Using the Emulation Analyzer - Easy Configuration
Initializing the Analyzer
Initializing the Analyzer
This section describes how to:
•
Initialize the analyzer.
•
Display trace activity.
To initialize the analyzer
• Enter the tinit command.
The tinit command initializes the analyzer to its default or power-up state.
Examples
To initialize the analyzer:
U>tinit
To display trace activity
• Enter the ta command.
The ta (trace activity) command allows you to display the current status of the
analyzer trace signals. The trace activity display shows the status of trace signals at
any time, regardless of whether a pending trace is completed or not.
The trace signals are displayed in sets of sixteen. Pod 1 represents emulation
analyzer trace signals 0 through 15 (the least significant bit is on the right). Pod 2
represents emulation analyzer trace signals 16 through 31, and so on.
A trace signal is displayed as a low (0), high (1), or moving (?).
137
Chapter 5: Using the Emulation Analyzer - Easy Configuration
Initializing the Analyzer
Examples
To display the activity on the analyzer trace signals:
U>ta
Pod
Pod
Pod
Pod
Pod
138
5
4
3
2
1
=
=
=
=
=
00??1111
11111111
????????
00000000
0???????
1???1??1
11111110
????????
00000??0
????????
Chapter 5: Using the Emulation Analyzer - Easy Configuration
Qualifying the Analyzer Clock
Qualifying the Analyzer Clock
The emulator/analyzer interface looks at the data on the emulation processor’s bus
and control signals at each clock cycle. This interface generates clocks to the
analyzer. Address, data, and status fields which are then clocked into the analyzer.
You can qualify the analyzer clock so that the analyzer only looks at background
cycles.
This section describes how to:
•
Qualify the analyzer clock to trace background cycles.
To trace background cycles
• Enter the tck -b command.
By default, the analyzer traces foreground cycles; this is specified by the -u option
to the tck command. However, when using the background monitor it is possible to
trace the memory cycles used by the 68340 background debug mode (BDM); this is
specified by the -b option to the tck command.
You can trace both user and background code by specifying the -ub option in a
single tck command.
Examples
To trace background cycles:
U>tck -b
U>tck
tck -r L -b -s S
Notice that the user/background option is a switch in the clock specification.
Changing the option as shown above does not affect the rest of the trace clock
specification.
139
Chapter 5: Using the Emulation Analyzer - Easy Configuration
Qualifying the Analyzer Clock
To trace foreground and background cycles:
U>tck -ub
U>tck
tck -r L -ub -s S
To return to tracing foreground execution:
U>tck -u
U>tck
tck -r L -u -s S
140
Chapter 5: Using the Emulation Analyzer - Easy Configuration
Starting and Stopping Traces
Starting and Stopping Traces
This section describes the tasks that relate to starting and stopping trace
measurements.
When you start a trace measurement, the analyzer begins looking at the data on the
emulation processor’s bus and control signals on each analyzer clock signal. The
information seen on a particular clock is called a state.
When one of these states matches the "trigger state" you specify, the analyzer stores
states in trace memory. When trace memory is filled, the trace is said to be
"complete."
The default trigger state specification is "any state," so when you start a trace
measurement after initializing the analyzer, the analyzer will "trigger" on the first
state it sees and store the following states in trace memory.
Once you start a trace measurement, you can view the progress of the measurement
by displaying the trace status.
In some situations, for example, when the trigger state is never found or when the
analyzer hasn’t filled trace memory, the trace measurement does not complete. In
these situations, you can halt the trace measurement.
This section describes how to:
•
Start trace measurements.
•
Display the trace status.
•
Halt trace measurements.
141
Chapter 5: Using the Emulation Analyzer - Easy Configuration
Starting and Stopping Traces
To start a trace measurement
• Enter the t command.
The t (trace) command tells the analyzer to begin monitoring the states which
appear on the trace signals. You will see a message which confirms that a trace is
started.
After the emulator is powered-up or initialized, the analyzer is in its simplest
configuration. The default condition will trigger on any state, and store all captured
states. You can simply issue a trace command (t) to trace the states currently
executing.
Examples
To start a trace measurement after analyzer initialization:
U>tinit
U>t
Emulation trace started
To trace a program as it starts up:
U>rst
R>t
Emulation trace started
R>r crt1:entry
U>
142
Chapter 5: Using the Emulation Analyzer - Easy Configuration
Starting and Stopping Traces
To display the trace status
• Enter the ts command.
The ts (trace status) command lets you view what the analyzer is doing (or what the
analyzer has done if the trace has completed).
The first line of the emulation trace status display shows whether the user trace has
been "completed"; other possibilities are that the trace is still "running" or that the
trace has been "halted". The word "NEW" indicates that the most recent trace has
not been displayed. The word "User" indicates that the trace was taken in response
to a t command; the other possibility is that a "CMB" execute signal started the
trace.
The second line of the ts display contains information on the arm condition. If the
tarm condition is specified as always, the message "Arm ignored" is displayed. If
the tarm condition is specified as one of the internal signals, either the message
"Arm not received" or "Arm received" is displayed. The display indicates if the
arm condition happened any time since the most recent trace started, even if it
happened after the trace was halted or became complete.
When an arm condition has been specified with the tarm command, the "Arm to
trigger" line displays the amount of time between the arm condition and the trigger.
The time displayed will be from -0.04 microseconds to 41.943 milliseconds, less
than -0.04 microseconds, or greater than 41.943 milliseconds. If the arm signal is
ignored or the trigger is not in memory, a question mark (?) is displayed.
The "States" line shows the number of states that have been stored (out of the
number that is possible to store) and the line numbers that the stored states occupy.
(The trigger state is always stored on line 0.)
The "Sequence term" line of the trace status display shows the number of the term
the sequencer was in when the trace completed. Because a branch out of the last
sequence term constitutes the trigger, the number displayed is what would be the
next term (2 in the example below) even though that term is not defined. If the
trace is halted, the sequence term number just before the halt is displayed;
otherwise, the current sequence term number is displayed. If the current sequence
term is changing too quickly to be read, a question mark (?) is displayed.
The "Occurrence left" line of the trace status display shows the number of
occurrences remaining before the primary branch can be taken out of the current
143
Chapter 5: Using the Emulation Analyzer - Easy Configuration
Starting and Stopping Traces
sequence term. If the occurrence left is changing too quickly to be read, a question
mark (?) is displayed.
Examples
To display the trace status:
U>ts
--- Emulation Trace Status --NEW User trace complete
Arm ignored
Trigger in memory
States 512 (512) 0..511
Sequence term 2
Occurrence left 1
To halt a trace measurement
• Enter the th command.
The th (trace halt) command allows you to halt a trace measurement. When the th
command is entered, the message "Emulation trace halted" is displayed.
Examples
To halt a trace measurement:
U>th
Emulation trace halted
144
Chapter 5: Using the Emulation Analyzer - Easy Configuration
Displaying Traces
Displaying Traces
When states are stored in trace memory, you can display these states in the trace
list. Also, you can change the format of the trace list. This section describes how
to:
•
Display the trace list.
•
Change the format of the trace list.
To display the trace
• Use the tl command.
The tl (trace list) command displays the trace data.
Examples
The trace list displayed in the following examples was set up with the following
commands.
U>sym for_loop=0a7a
U>tg addr=for_loop
U>t
Emulation trace started
U>ts
--- Emulation Trace Status --NEW User trace complete
Arm ignored
Trigger in memory
Arm to trigger ?
States 512 (512) 0..511
Sequence term 2
Occurrence left 1
145
Chapter 5: Using the Emulation Analyzer - Easy Configuration
Displaying Traces
To display the trace list:
U>tl
Line
----0
1
2
3
4
5
6
7
8
9
addr,H
-------00000a7a
00000a7c
00000a7e
00000a80
00000a82
00000a84
00047fd0
00047fd2
00001052
00001054
68340 Mnemonic
---------------------------------------$2605
supr prgm word rd (ds16)
$2A02
supr prgm word rd (ds16)
$4EB9
supr prgm word rd (ds16)
$0000
supr prgm word rd (ds16)
$1052
supr prgm word rd (ds16)
$2400
supr prgm word rd (ds16)
$0000
supr data long wr (ds16)
$0A84
supr data word wr (ds16)
$2039
supr prgm word rd (ds16)
$0006
supr prgm word rd (ds16)
count,R
----------0.720 uS
0.720 uS
0.720 uS
0.720 uS
0.720 uS
0.680 uS
0.720 uS
0.720 uS
0.720 uS
seq
--+
.
.
.
.
.
.
.
.
.
The first column in the trace list contains the line number. The trigger state is
always on line number 0.
The second column contains the address information associated with the trace
states. Addresses in this column may be locations of instruction opcodes on fetch
cycles, or they may be sources or destinations of operand cycles.
The third column shows mnemonic information about the emulation bus cycle.
The fourth column shows the count information (time is counted by default). The
"R" indicates that each count is relative to the previous state.
The fifth column contains information about the analyzer’s sequencer. Whenever a
"+" appears in this column, it means the state caused a sequencer branch.
The default number of states to display is 10.
146
Chapter 5: Using the Emulation Analyzer - Easy Configuration
Displaying Traces
To display the top 10 states in disassembled format:
U>tl -d -t 10
Line
----0
1
2
3
4
5
6
7
8
9
addr,H
-------00000a7a
00000a7c
00000a7e
00000a80
00000a82
00000a84
00047fd0
00047fd2
00001052
00001054
68340 Mnemonic
---------------------------------------MOVE.L
D5,D3
MOVE.L
D2,D5
JSR
$00001052
$0000
supr prgm word rd (ds16)
$1052
supr prgm word rd (ds16)
MOVE.L
D0,D2
$0000
supr data long wr (ds16)
$0A84
supr data word wr (ds16)
MOVE.L
$000604DA,D0
$0006
supr prgm word rd (ds16)
count,R
----------0.720 uS
0.720 uS
0.720 uS
0.720 uS
0.720 uS
0.680 uS
0.720 uS
0.720 uS
0.720 uS
seq
--+
.
.
.
.
.
.
.
.
.
To display the top 10 states with symbols and absolute addresses in the address
column:
U>tl -e -t 10
Line
----0
1
2
3
4
5
6
7
8
9
addr,H
-------for_loop
00000a7c
00000a7e
00000a80
00000a82
00000a84
00047fd0
00047fd2
nd:_rand
00001054
68340 Mnemonic
---------------------------------------MOVE.L
D5,D3
MOVE.L
D2,D5
JSR
rand:_rand
$0000
supr prgm word rd (ds16)
$1052
supr prgm word rd (ds16)
MOVE.L
D0,D2
$0000
supr data long wr (ds16)
$0A84
supr data word wr (ds16)
MOVE.L
data_gen:__rand_seed,D0
$0006
supr prgm word rd (ds16)
count,R
----------0.720 uS
0.720 uS
0.720 uS
0.720 uS
0.720 uS
0.680 uS
0.720 uS
0.720 uS
0.720 uS
seq
--+
.
.
.
.
.
.
.
.
.
count,R
----------0.720 uS
0.720 uS
seq
--+
.
.
To display the top 10 states dequeued:
U>tl -od -t 10
Line
----0
1
2
8
addr,H
-------for_loop
00000a7c
00000a7e
=00047fd0
nd:_rand
=and_seed
68340 Mnemonic
---------------------------------------MOVE.L
D5,D3
MOVE.L
D2,D5
JSR
rand:_rand
stck sdata wr:$00000A84
MOVE.L
data_gen:__rand_seed,D0
src sdata rd:$9F5E2001
4.280 uS
.
147
Chapter 5: Using the Emulation Analyzer - Easy Configuration
Displaying Traces
To display the top 10 states with dequeuing turned OFF:
U>tl -on -t 10
Line
----0
1
2
3
4
5
6
7
8
9
addr,H
-------for_loop
00000a7c
00000a7e
00000a80
00000a82
00000a84
00047fd0
00047fd2
nd:_rand
00001054
68340 Mnemonic
---------------------------------------MOVE.L
D5,D3
MOVE.L
D2,D5
JSR
rand:_rand
$0000
supr prgm word rd (ds16)
$1052
supr prgm word rd (ds16)
MOVE.L
D0,D2
$0000
supr data long wr (ds16)
$0A84
supr data word wr (ds16)
MOVE.L
data_gen:__rand_seed,D0
$0006
supr prgm word rd (ds16)
count,R
----------0.720 uS
0.720 uS
0.720 uS
0.720 uS
0.720 uS
0.680 uS
0.720 uS
0.720 uS
0.720 uS
seq
--+
.
.
.
.
.
.
.
.
.
To display instructions only (no operands) from the top 10 states:
U>tl -oi -t 10
Line
----0
1
2
5
8
addr,H
-------for_loop
00000a7c
00000a7e
00000a84
nd:_rand
68340 Mnemonic
---------------------------------------MOVE.L
D5,D3
MOVE.L
D2,D5
JSR
rand:_rand
MOVE.L
D0,D2
MOVE.L
data_gen:__rand_seed,D0
count,R
----------0.720 uS
0.720 uS
2.160 uS
2.120 uS
seq
--+
.
.
.
.
count,R
----------0.720 uS
0.720 uS
0.720 uS
0.720 uS
0.720 uS
0.680 uS
0.720 uS
0.720 uS
0.720 uS
seq
--+
.
.
.
.
.
.
.
.
.
To return to displaying instructions and operands:
U>tl -oa -t 10
Line
----0
1
2
3
4
5
6
7
8
9
148
addr,H
-------for_loop
00000a7c
00000a7e
00000a80
00000a82
00000a84
00047fd0
00047fd2
nd:_rand
00001054
68340 Mnemonic
---------------------------------------MOVE.L
D5,D3
MOVE.L
D2,D5
JSR
rand:_rand
$0000
supr prgm word rd (ds16)
$1052
supr prgm word rd (ds16)
MOVE.L
D0,D2
$0000
supr data long wr (ds16)
$0A84
supr data word wr (ds16)
MOVE.L
data_gen:__rand_seed,D0
$0006
supr prgm word rd (ds16)
Chapter 5: Using the Emulation Analyzer - Easy Configuration
Displaying Traces
To display the states at line 100:
U>tl 100
Line
----100
101
102
103
104
105
106
107
108
109
addr,H
-------00047fbc
00047fbe
00060324
00060326
000009a0
000009a2
00047fb4
00047fb6
000009a4
00047fb8
68340 Mnemonic
---------------------------------------$0000
supr data long rd (ds16)
$0A9A
supr data word rd (ds16)
$0000
supr data long wr (ds16)
$0A9A
supr data word wr (ds16)
$4E5E
supr prgm word rd (ds16)
$4E75
supr prgm word rd (ds16)
$0004
supr data long rd (ds16)
$7FC4
supr data word rd (ds16)
$4E71
supr prgm word rd (ds16)
$0000
supr data long rd (ds16)
count,R
--------0.720 uS
0.680 uS
0.720 uS
0.720 uS
0.720 uS
0.720 uS
0.720 uS
0.720 uS
0.720 uS
0.680 uS
seq
--.
.
.
.
.
.
.
.
.
.
149
Chapter 5: Using the Emulation Analyzer - Easy Configuration
Displaying Traces
To change the trace display format
• Use the tf command.
You can change the format of the trace information with the tf (trace format)
command.
The tf command primarily allows you to arrange the columns of trace information
in a different manner. However, you can include any trace label in the trace. Also,
the trace label information can be displayed in various number bases, and counts
can be displayed relative or absolute.
Examples
To view the trace display format:
U>tf
tf addr,H mne count,R seq
To change the trace format so that the address column is 11 characters wide:
U>tf addr,h,11 mne count,r seq
U>tl -t
Line
----0
1
2
3
4
5
6
7
8
9
150
addr,H
----------for_loop
00000a7c
00000a7e
00000a80
00000a82
00000a84
00047fd0
00047fd2
rand:_rand
00001054
68340 Mnemonic
---------------------------------------MOVE.L
D5,D3
MOVE.L
D2,D5
JSR
rand:_rand
$0000
supr prgm word rd (ds16)
$1052
supr prgm word rd (ds16)
MOVE.L
D0,D2
$0000
supr data long wr (ds16)
$0A84
supr data word wr (ds16)
MOVE.L
data_gen:__rand_seed,D0
$0006
supr prgm word rd (ds16)
count,R
----------0.720 uS
0.720 uS
0.720 uS
0.720 uS
0.720 uS
0.680 uS
0.720 uS
0.720 uS
0.720 uS
seq
--+
.
.
.
.
.
.
.
.
.
Chapter 5: Using the Emulation Analyzer - Easy Configuration
Qualifying Trigger and Store Conditions
Qualifying Trigger and Store Conditions
This section describes tasks relating to the qualification of trigger and storage states.
You can trigger on, or store, specific states or specific values on a set of trace
signals (which are identified by trace labels).
Also, you can prestore states. The prestore qualifier is a second storage qualifier
used for storing states that occur before the normally stored states. Prestore is
useful for capturing entry points to procedures or for identifying where global
variables are accessed from.
This section describes how to:
•
Qualify the trigger state.
•
Trigger on a number of occurrences of some state.
•
Change the trigger position in the trace.
•
Qualify states stored in the trace.
•
Activate and qualify prestore states.
•
Change the count qualifier.
Expressions in Trace Commands
Expressions are used in commands which qualify the trace. Expressions may be
specified in the following forms (the pound sign, #, appears before comments):
any/all
never/none
arm
label=<value>
label!=<value>
label=<value> and label=<value> ...
label!=<value> or label!=<value> ...
label=<value>..<value>
label!=<value>..<value>
# special tokens
#
#
#
#
this condition
not this condition
this range
not this range
Note that if you wish to specify an expression such as "label=<value> and
label!=<value>", you must configure the analyzer so that you have access to its full
capability (refer to the "Using the Emulation Analyzer - Complex Configuration"
chapter).
151
Chapter 5: Using the Emulation Analyzer - Easy Configuration
Qualifying Trigger and Store Conditions
Note also that only one range resource is available. You can, however, use this
range (or "not this range") in more than one trace command.
Tokens The tokens any or all specify any or all conditions; you can use these
tokens interchangeably. The tokens never or none specify false conditions; they
are used to turn off qualifiers. The never and none tokens may also be used
interchangeably. The arm token represents a condition external to the analyzer.
Arm conditions are described in the "Making Coordinated Measurements" chapter.
Trace Labels Labels may be predefined trace labels or labels which you define
with the tlb (trace label) command. Trace labels can be up to 31 characters long.
When you define a trace label, you assign trace signals to the label name. The
emulation analyzer trace signals are described in the table that follows.
152
Chapter 5: Using the Emulation Analyzer - Easy Configuration
Qualifying Trigger and Store Conditions
Emulation Analyzer Trace Signals
Trace
Signals
Signal
Name
Signal
Description
0-31
A0-A31
Address Lines 0-31.
32-47
D0-D15
Data Lines 0-15.
64
BKG_L
Background Debug Mode (BDM) active. This signal is used to qualify
the analyzer clock for tracing only foreground or only background cycles.
65
66
67
FC0
FC1
FC2
Function Codes 0-2. These lines to the analyzer are derived from the
68340 processor’s function code lines. The function code meanings are:
001 - User Data Space
010 - User Program Space
101 - Supervisor Data Space
110 - Supervisor Program Space
111 - CPU Space
68
R/*W
Read/write signal.
69
70
SIZ0
SIZ1
Number of bytes remaining to be transferred.
71
CS_BYTE_L
Chip select byte/word signal.
72
73
DS0_L
DS1_L
Data size acknowledge. Note that the 68340 SIM can be programmed to
internally generate the DSACKx signals for external accesses; in this
case, the DSACKx values do not show up on these trace signals.
74
BERR_L
Bus error active.
75
HALT_L
Halt active.
76
CODE_L
Instruction execution active.
77
FLUSH_L
Instruction pipeline flush active.
78
FC3
Function code 3. This can be set by the 68340 DMA controller for
DMA transfers; however
79
CS0_L
Chip select 0 active.
153
Chapter 5: Using the Emulation Analyzer - Easy Configuration
Qualifying Trigger and Store Conditions
Predefined Trace Labels To see the trace labels which have been predefined,
enter the tlb (trace label) command with no options.
U>tlb
#### Emulation trace labels
tlb addr 0..31
tlb data 32..47
tlb stat 64..79
These predefined trace labels represent emulation processor signals as described
below.
addr
Represents the trace signals (0 through 31) which monitor the
emulation processor’s address pins.
data
Represents the trace signals (32 through 47) which monitor the
emulation processor’s data pins.
stat
Represents the trace signals (64 through 79) which monitor
other emulation processor signals.
Values Values can be numeric constants (in several bases), symbols, or equates.
Values can also be constants, symbols, and equates combined with operators.
(Refer to the <value> description in the "Commands" chapter for information on
constants and operators.)
Predefined Equates The equ (specify equates) command allows you to equate
values with names. Equates for common trace label values are predefined. To
view the equates, enter the equ command with no options. (These status equates
are also listed in the help proc information.)
154
Chapter 5: Using the Emulation Analyzer - Easy Configuration
Qualifying Trigger and Store Conditions
Predefined Equates for Analyzer Status
Equate
Value
Description
berr
code
code_tfr
cpu
csx_byte
0xxxx x0xx xxxx xxxxy
0xxx0 xxxx xxxx xxxxy
0xx00 xxxx xxxx xxxxy
0xxxx xxxx xxxx 111xy
0xxxx xx11 0xxx xxxxy
csx_word
0xxxx xx11 1xxx xxxxy
data
dma
0x0xx xxxx xxxx x01xy
0x1xx xxxx xxxx xxxxy
ds_byte
ds_word
prog
read
rerun
siz_3byte
siz_byte
siz_long
siz_word
sup
supdata
supprog
user
userdata
userprog
write
0xxxx xx10 xxxx xxxxy
0xxxx xx01 xxxx xxxxy
0x0xx xxxx xxxx x10xy
0xxxx xxxx xxx1 xxxxy
0xxxx 00xx xxxx xxxxy
0xxxx xxxx x11x xxxxy
0xxxx xxxx x01x xxxxy
0xxxx xxxx x00x xxxxy
0xxxx xxxx x10x xxxxy
0x0xx xxxx xxxx 1xxxy
0x0xx xxxx xxxx 101xy
0x0xx xxxx xxxx 110xy
0x0xx xxxx xxxx 0xxxy
0x0xx xxxx xxxx 001xy
0x0xx xxxx xxxx 010xy
0xxxx xxxx xxx0 xxxxy
/BERR active
code execution cycles
first instruction following a pipeline flush
CPU space function code
byte data transfer, chip select active (DSACKx not
internally generated)
word data transfer, chip select active (DSACKx
not internally generated)
data cycle
DMA space function code (if used by DMA
controller module)
byte data transfer
word data transfer
program space function code
memory read
/BERR and /HALT active (retry)
3 byte access
byte access
long word access
word access
supervisor space function code
supervisor data space function code
supervisor program space function code
user space function code
user data space function code
user program space function code
memory write
These predefined equates may be used to specify values for the stat trace label
when qualifying trace conditions. For example:
stat=write
is the same as:
stat=0xxxxxxxxxxx0xxxxy
155
Chapter 5: Using the Emulation Analyzer - Easy Configuration
Qualifying Trigger and Store Conditions
Equates, either predefined or user-defined, are translated to their actual values when
used. Re-defining an equate will not affect commands in which the equate was
previously used. For example, if you enter the commands equ count=100; tg any
count; equ count=5, the occurrence count in the trigger specification is still 100.
To qualify the trigger state
• Use the tg command.
The tg (specify simple trigger) command allows you to specify when the analyzer
should begin storing states.
Examples
Suppose you want to look at the execution of the analyzer demo program after the
branch to the first instruction in the demo program’s "for" loop (0A7AH), and,
therefore, you would like to begin storing states after address 0A7AH occurs. To
do this you could enter the commands shown below.
U>tinit
U>sym for_loop=0a7a
U>tg addr=for_loop
U>t
Emulation trace started
U>ts
--- Emulation Trace Status --NEW User trace complete
Arm ignored
Trigger in memory
Arm to trigger ?
States 512 (512) -1..510
Sequence term 2
Occurrence left 1
U>tl -de
Line
-----1
0
1
2
3
4
5
6
7
8
156
addr,H
-------00000b12
for_loop
00000a7c
00000a7e
00000a80
00000a82
00000a84
00047fd0
00047fd2
nd:_rand
68340 Mnemonic
---------------------------------------incomplete instr.: /FF68/????/
MOVE.L
D5,D3
MOVE.L
D2,D5
JSR
rand:_rand
$0000
supr prgm word rd (ds16)
$1052
supr prgm word rd (ds16)
MOVE.L
D0,D2
$0000
supr data long wr (ds16)
$0A84
supr data word wr (ds16)
MOVE.L
data_gen:__rand_seed,D0
count,R
----------1.040 uS
0.720 uS
0.720 uS
0.720 uS
0.720 uS
0.720 uS
0.720 uS
0.720 uS
0.680 uS
seq
--.
+
.
.
.
.
.
.
.
.
Chapter 5: Using the Emulation Analyzer - Easy Configuration
Qualifying Trigger and Store Conditions
To trigger on a number of occurrences of some
state
• Use the tg <qualifier> <occurrence count> command.
When specifying a simple trigger, you can include an occurrence count. The
occurrence count specifies that the analyzer trigger on the Nth occurrence of some
state.
The default base for an occurrence count is decimal. You may specify occurrence
counts from 1 to 65535.
Examples
To trigger on the 100th occurrence of the branch to the first instruction after the
analyzer demo program’s for loop (0A7AH):
U>sym for_loop=0a7a
U>tg addr=for_loop 100
U>t
Emulation trace started
U>ts
--- Emulation Trace Status --NEW User trace complete
Arm ignored
Trigger in memory
Arm to trigger ?
States 512 (512) -1..510
Sequence term 2
Occurrence left 1
157
Chapter 5: Using the Emulation Analyzer - Easy Configuration
Qualifying Trigger and Store Conditions
To change trigger position in the trace
• Use the tp command.
The tp (trigger position) command changes the trigger position in the trace.
The trigger position default is tp s, which specifies that the trigger appears at the
start of the trace. You can also specify that the trigger appear in the center of the
trace with the tp c command, or that the trigger appear at the end of the trace with
the tp e command.
Additionally, you can specify a certain number of states to appear before (tp -b 10)
or after (tp -a 1014) the trigger in the trace.
When the analyzer counts time or states, the actual trigger position is within +/- 1
state of the number specified. When counts are turned OFF, the actual trigger
position is within +/- 3 states of the number specified.
Examples
To place the trigger state in the center of the trace:
U>tp c
U>t
Emulation trace started
U>ts
--- Emulation Trace Status --NEW User trace complete
Arm ignored
Trigger in memory
Arm to trigger ?
States 512 (512) -257..254
Sequence term 2
Occurrence left 1
Notice in the trace status information that states are stored before and after the
trigger.
To qualify states stored in the trace
• Use the tsto command.
158
Chapter 5: Using the Emulation Analyzer - Easy Configuration
Qualifying Trigger and Store Conditions
By default, all captured states are stored; however, you can qualify which states get
stored with the tsto (trace storage qualifier) command.
Examples
To store only the states which write random numbers to the Results area in the
analyzer demo program, enter the following commands.
U>tsto addr=Results..Results+3ff
U>tg any
U>t
Emulation trace started
U>tl
Line
----0
1
2
3
4
5
6
7
8
9
addr,H
-------00001068
000602f0
000602f2
0006016c
0006016e
00060184
00060186
0006035c
0006035e
0006041c
68340 Mnemonic
---------------------------------------$0006
supr prgm word rd (ds16)
$0000
supr data long wr (ds16)
$7E4C
supr data word wr (ds16)
$0000
supr data long wr (ds16)
$1BC2
supr data word wr (ds16)
$0000
supr data long wr (ds16)
$1CF2
supr data word wr (ds16)
$0000
supr data long wr (ds16)
$7172
supr data word wr (ds16)
$0000
supr data long wr (ds16)
count,R
----------69.84 uS
0.720 uS
109.0 uS
0.720 uS
109.3 uS
0.720 uS
109.0 uS
0.720 uS
109.0 uS
seq
--+
.
.
.
.
.
.
.
.
.
Notice that the trigger state (line 0) is included in the trace list; trigger states are
always stored.
To activate and qualify prestore states
• Use the tpq <qualifier> command.
Prestore allows you to save up to two states which precede a normal store state.
Prestore is turned off by default. However, you can use the tpq command to
specify a prestore qualifier.
Prestore is useful when you want to find the cause of a particular state. For
example, if a variable is accessed from many different places in the program, you
can qualify the trace so that only accesses of that variable are stored. Then, you can
turn on prestore to find out from where accesses of that variable originate.
159
Chapter 5: Using the Emulation Analyzer - Easy Configuration
Qualifying Trigger and Store Conditions
States which satisfy the prestore qualifier and the storage qualifier at the same time
are stored as normal states.
The analyzer uses the same resource to save prestore states as it does to save count
tags. Consequently, the "prestore" string is shown in the "count" column of the
trace list. Notice that the time counts are relative to the previous normal storage
state. Turning off the count qualifier does not turn off prestore: however, the
"prestore" string cannot be seen in the "count" column of the trace list.
Examples
To prestore LINK A6,#0 instructions (which is the first instruction in the Caller
functions and whose opcode is 4E56H) on writes to the range Results through
Results+3ff:
U>tsto addr=Results..Results+3ff
U>tpq data=4e56
U>tg any
U>t
Emulation trace started
U>tl -de
Line
----0
1
2
3
4
5
6
7
8
9
addr,H
-------00000a80
Caller_0
rite_Num
0006040c
0006040e
Caller_0
rite_Num
000603f4
000603f6
Caller_1
68340 Mnemonic
---------------------------------------incomplete instr.: /0000/????/
incomplete instr.: /4E56/????/
incomplete instr.: /4E56/????/
$0000
supr data long wr (ds16)
$5B00
supr data word wr (ds16)
incomplete instr.: /4E56/????/
incomplete instr.: /4E56/????/
$0000
supr data long wr (ds16)
$24D1
supr data word wr (ds16)
incomplete instr.: /4E56/????/
To turn off prestore states:
U>tpq none
To change the count qualifier
• To count time, use the tcq time command.
• To count states, use the tcq <qualifier> command.
160
count,R
----------prestore
prestore
87.04 uS
0.720 uS
prestore
prestore
109.3 uS
0.680 uS
prestore
seq
--+
.
.
.
.
.
.
.
.
.
Chapter 5: Using the Emulation Analyzer - Easy Configuration
Qualifying Trigger and Store Conditions
• To turn OFF counting, use the tcq none command.
After initializing the analyzer, the default count qualifier is time, which means that
the time between states is saved. When time is counted, up to 512 states can be
stored in the trace.
When you count states, the counter is incremented each time the state is captured
(not necessarily stored) by the analyzer. When a state is counted, up to 512 states
can be stored in the trace.
When you turn OFF counting, up to 1024 states can be stored in the trace.
Examples
Suppose you want to know how many loops of the program occur between writes
to the memory location Results+0C4H. You can use the tcq command to count a
state that occurs once for each loop of the program.
First, set up the analyzer so that only writes to Results+0C4H are stored:
U>tsto addr=Results+0c4 and stat=write
Next, specify the count qualifier as the first instruction after the analyzer demo
program’s "for" loop (0A7AH):
U>sym for_loop=0a7a
U>tcq addr=for_loop
161
Chapter 5: Using the Emulation Analyzer - Easy Configuration
Qualifying Trigger and Store Conditions
Finally, set up to trigger on any state, start the trace, change the trace format to
display relative and absolute counts, and display the trace:
U>tg any
U>t
Emulation trace started
U>tl
Line
----0
1
2
3
4
5
6
7
8
9
addr,H
-------00060151
00060118
00060118
00060118
00060118
00060118
00060118
00060118
00060118
00060118
68340 Mnemonic
---------------------------------------$--00
supr data byte rd (ds16)
$00-supr data byte wr (ds16)
$00-supr data byte wr (ds16)
$00-supr data byte wr (ds16)
$0000
supr data long wr (ds16)
$0000
supr data long wr (ds16)
$0000
supr data long wr (ds16)
$0000
supr data long wr (ds16)
$0000
supr data long wr (ds16)
$0000
supr data long wr (ds16)
count,R
----------0
0
0
37
471
81
16
1106
61
seq
--+
.
.
.
.
.
.
.
.
.
The trace listing above shows that the program executes a different number of times
for each time a random number is written to Results+0C4H. Where counts of 0 are
seen, the analyzer demo program is executing the qsort function which sorts the
values written to the results area.
To return to counting time:
U>tcq time
162
Chapter 5: Using the Emulation Analyzer - Easy Configuration
Using the Sequencer
Using the Sequencer
By using the sequencer, you can trigger after a sequence of states instead of just one
state. The sequencer has several levels, called sequence terms.
Each sequence term can search for two states at a time: a primary state and a
secondary state. The primary state may have an occurrence count specified. If the
primary state occurs the number of times specified, the sequencer branches to the
next term. If the secondary state is found before the primary state occurs the
number of times specified, the sequencer branches back to the first term.
The same secondary branch condition is used for all sequence terms, and secondary
branches are always back to the first term; therefore, the secondary branch is called
the global restart.
The last sequence term defines the trigger state. A branch out of this term
constitutes the trigger.
This section describes how to:
•
Reset the sequencer.
•
Display the sequencer specification.
•
Specify primary and secondary branch conditions.
•
Add or insert sequence terms.
•
Delete sequence terms.
The Default Sequencer Specification
After power-up, initialization, or sequencer reset, the sequencer consists of one
term.
163
Chapter 5: Using the Emulation Analyzer - Easy Configuration
Using the Sequencer
It may be helpful to think of the tif (primary branch expression) command as a
conditional statement. For example, "If (some state occurs), then branch".
Because sequence term 1 is the last term and a branch out of the last term
constitutes the trigger, the primary branch expression (any) of term 1 specifies the
trigger condition. The expression any says that any captured trace state will cause
a branch. Therefore, the trigger will occur immediately after the t (trace) command
is issued (if instructions are being executed).
The tsto (trace storage qualifier) command specifies that all captured states are
stored. The trace storage qualifier is a global; that is, it applies to all sequence
terms. In addition to states which satisfy the trace storage qualifier, any state which
causes a branch is stored in trace memory. Also, prestore states can be saved before
states which satisfy the trace storage qualifier.
The telif command is used to specify the secondary branch expression for every
sequence term; this expression is called the global restart. It may be helpful to
think of the telif command as an "else if" conditional statement. For example,
"Else if (some state occurs before) then branch to term 1".
The global restart in the default sequencer specification is never. This means no
trace state can cause a secondary branch.
164
Chapter 5: Using the Emulation Analyzer - Easy Configuration
Using the Sequencer
Simple Trigger and the Sequencer
The simple trigger command used previously in this chapter has the following
effect on the sequencer:
U>sym for_loop=0a7a
U>tinit
U>tg addr=for_loop
U>tsq
tif 1 addr=for_loop
tsto all
telif never
Notice that only the primary branch expression of the first sequence term (the
trigger condition) is different than the default sequencer specification. The address
0A7AH is the first address inside the demo program’s "for" loop. An address value
of 0AE8H will trigger the analyzer, causing trace memory to be filled with states
and stop.
When the tg command is entered with no options, the primary branch expression of
the first sequence term is displayed. This is the trigger condition only when one
term exists in the sequencer.
To reset the sequencer
• Enter the tsq -r command.
To reset the sequencer to its default, power-up state use the -r option to the tsq
(trace sequencer) command.
Examples
To reset the sequencer:
U>tsq -r
165
Chapter 5: Using the Emulation Analyzer - Easy Configuration
Using the Sequencer
To display the sequencer specification
• Enter the tsq command with no options.
To display the sequencer specification, enter the tsq command with no options.
Examples
U>tsq
tif 1 any
tsto all
telif never
The tif 1 any part of the sequencer specification says that any state will cause a
branch out of term 1. The tsto all says all states will be stored, and the telif never
says that the global restart is turned off.
To specify primary and secondary branch
expressions
• Use the tif and telif commands.
The tif command lets you qualify the states searched for by sequence terms.
The telif command lets you qualify the state that will cause a global restart
(sequencer branch back to term 1).
Examples
166
You can use sequence terms to trace a specific combination of events. For
example, Caller_3 can be used to write any random number, but suppose you want
to trace only the situation where Caller_3 is used to write a random number to
address Results+0C4H.
Chapter 5: Using the Emulation Analyzer - Easy Configuration
Using the Sequencer
First, set up the sequencer so that it first searches for the call to Caller_3 by
specifying the address of Caller_3 (0A04H) as the primary branch expression of the
first sequence term.
U>tif 1 addr=Caller_3
After Caller_3 is found, the sequencer should then search for the write to address
Results+0C4H. You can do this by specifying the address Results+0C4H, qualified
by the "write" status, as the primary branch expression of the second sequence term.
U>tif 2 addr=Results+0c4 and stat=write
However, if the program executes the RTS instruction of the Caller_3 function
(address 0A1AH) before the write to Results+0C4H, you know that Caller_3 is not
used to write the random number this time, and the sequencer should start over.
You can specify the global restart expression to do this.
U>telif addr=0a1a
If the write to address Results+0C4H occurs before the program executes the RTS
instruction at 0A1AH, the sequencer will take a primary branch out of the last term
and trigger the analyzer. Set up the analyzer so that only sequencer branches are
stored.
U>tsto never
The resulting sequencer specification is shown below.
U>tsq
tif 1 addr=Caller_3
tif 2 addr=Results+0c4 and stat=write
tsto never
telif addr=0a1a
The sequencer specification above is represented in the following figure. The
primary branch expression of the first sequence term is the address associated with
Caller_3 (0A04H). The primary branch expression for the second sequence term is
the specific write condition we would like to trace; it is also the trigger condition.
The primary branch out of the second term constitutes the trigger.
167
Chapter 5: Using the Emulation Analyzer - Easy Configuration
Using the Sequencer
The sequencer works like this: After the trace is started, the first sequence term
searches for the call to Caller_3. When the call to Caller_3 state is found, the
sequencer branches to term 2. Now, the second sequence term searches for the
address Results+0C4H. If address Results+0C4H is found before the state which
satisfies the secondary branch expression (the return at address 0A1AH), the
analyzer is triggered, causing the analyzer memory to be filled with states before
the analyzer stops. If the RTS instruction at address 0A1AH is executed before the
primary branch (in either the first or second terms), the sequencer branches back to
the first sequence term.
The following commands position the trigger state in the center of the trace, start
the trace, and display the trace status.
U>tp c
U>t
Emulation trace started
U>ts
--- Emulation Trace Status --NEW User trace running
Arm ignored
Trigger in memory
Arm to trigger ?
States 258 (512) -257..0
Sequence term 3
Occurrence left 1
The "seq" column in the trace list contains information about the sequencer. A "+"
in the "seq" column indicates the state satisfied a branch condition.
168
Chapter 5: Using the Emulation Analyzer - Easy Configuration
Using the Sequencer
Listing the trace will result in the following display.
U>tl -de -7
Line
-----7
-6
-5
-4
-3
-2
-1
0
1
addr,H
-------Caller_3
00000a1a
Caller_3
00000a1a
Caller_3
00000a1a
Caller_3
00060118
68340 Mnemonic
---------------------------------------incomplete instr.: /4E56/????/
RTS
incomplete instr.: /4E56/????/
RTS
incomplete instr.: /4E56/????/
RTS
incomplete instr.: /4E56/????/
$0000
supr data long wr (ds16)
count,R
--------834.6 uS
44.00 uS
615.0 uS
44.00 uS
725.1 uS
44.00 uS
175.8 uS
35.28 uS
seq
--+
+
+
+
+
+
+
+
Remember, the primary branch out of the last term constitutes the trigger.
Also, a primary branch always advances to the next higher term. A secondary
branch from any term is always made back to the first sequence term (global
restart).
To add or insert sequence terms
• Use the tsq -i command.
The sequencer may have a total of 4 terms. You can add or insert sequence terms
with the tsq (trace sequencer) command using the -i (insert) option. If the term
number specified already exists, the new sequence term is inserted before the
existing term; otherwise, the new sequence term is added.
Examples
To insert a second sequence term:
U>tsq
tif 1 addr=Caller_3
tif 2 addr=Results+0c4 and stat=write
tsto never
telif addr=0a1a
U>tsq -i 2
U>tsq
tif 1 addr=Caller_3
tif 2 any
tif 2 addr=Results+0c4 and stat=write
tsto never
telif addr=0a1a
169
Chapter 5: Using the Emulation Analyzer - Easy Configuration
Using the Sequencer
To delete sequence terms
• Use the tsq -d command.
You delete sequence terms using the -d option to the tsq (trace sequencer
specification) command.
After a term is deleted, the remaining terms are renumbered.
Examples
To delete the second sequence term:
U>tsq
tif 1 addr=Caller_3
tif 2 any
tif 2 addr=Results+0c4 and stat=write
tsto never
telif addr=0a1a
U>tsq -d 2
U>tsq
tif 1 addr=Caller_3
tif 2 addr=Results+0c4 and stat=write
tsto never
telif addr=0a1a
170
6
Using the Emulation Analyzer Complex Configuration
171
Using the Emulation Analyzer Complex Configuration
This chapter describes how to use the emulation analyzer in its "complex"
configuration (the "Using the Emulation Analyzer - Easy Configuration" chapter
describes how to use the emulation analyzer in its easy-to-use configuration).
The basic differences between the easy configuration and the complex
configuration are in the sequencer and the expressions used to qualify states.
Therefore, this chapter describes the following tasks:
172
•
Switching into the complex configuration.
•
Using complex expressions.
•
Using the sequencer.
Chapter 6: Using the Emulation Analyzer - Complex Configuration
Switching into the Complex Configuration
Switching into the Complex Configuration
This section describes how to:
•
Switch into the complex configuration
•
Switch back into the easy configuration
To switch into the complex analyzer configuration
• Enter the tcf -c command.
To enter the "complex" analyzer configuration, use the -c option to the tcf (trace
configuration) command. This will cause the analyzer to be initialized to its default
"complex" configuration state.
To switch back into the easy analyzer
configuration
• Enter the tcf -e command.
The tcf -e command will place the analyzer back into the "easy" configuration.
Changing the analyzer configuration to "easy" will reset the trace pattern
specifications, the trigger position, and the count and prestore qualifiers.
173
Chapter 6: Using the Emulation Analyzer - Complex Configuration
Using Complex Expressions
Using Complex Expressions
In the "complex" configuration, up to eight pattern resources and one range
resource may be used in trace commands wherever state qualifier expressions were
used in the "easy" configuration. In fact, state qualifiers are assigned to the pattern
and range resources.
The additional capability allowed in the "complex" configuration is that these
patterns may be used in combinations to specify more complex qualifiers. The
pattern and range resources are divided into two sets, and you can combine
resources with the set operators.
This section describes how to:
•
Assign state qualifiers to trace patterns.
•
Assign state qualifiers to the trace range.
•
Combine pattern and range qualifiers.
To assign state qualifiers to trace patterns
• Use the tpat command.
Up to eight trace patterns can be specified with the tpat (trace pattern) command.
The trace pattern names are p1, p2, ..., p8.
The expression associated with a trace pattern can be the keywords all, any, none,
or never, or the expression may be trace labels equated to values (which can be
ANDed together) or trace labels not equal to values (which can be ORed together).
Consider whether or not you will be using global set operators (and or or) with any
of the patterns; if so, make sure those patterns are in different sets.
174
Chapter 6: Using the Emulation Analyzer - Complex Configuration
Using Complex Expressions
Examples
To assign to pattern p1 the state where the address value equals 520H, the data
value equals 0XXAA1234H, and the status is a memory write:
U>tpat p1 addr=520 and data=0xxaa1234 and stat=write
To assign to pattern p1 any state except where the address value equals 5C2H, the
data value equals 0XX3X5678H, and the status is a memory write:
U>tpat p1 addr!=5c4 or data!=0xx3x5678 or stat!=write
To assign state qualifiers to the trace range
• Use the trng command.
One trace range can be specified with the trng (trace range) command. The range
name is r, and !r specifies "not in range".
The expression associated with a trace range can be the keywords all, any, none, or
never, or the expression may be a trace label equated to a range of values.
Examples
To assign the address range 500H through 5FFH to the range resource:
U>trng addr=500..5ff
To assign the data range 80H through 8FH to the range resource:
U>trng data=0080..008f
To combine pattern and range resources
• Use the set operators.
175
Chapter 6: Using the Emulation Analyzer - Complex Configuration
Using Complex Expressions
The eight patterns (p1..p8), the range (r for "in range" or !r for "not in range"), and
the arm qualifier (described in the "Making Coordinated Measurements" chapter)
are grouped into the two sets shown below.
Set 1: p1, p2, p3, p4, r, and !r.
Set 2: p5, p6, p7, p8, and arm.
Resources within a set may be combined using one of the intraset operators, | (OR)
or ~ (NOR).
The two sets can be combined with the and and or interset (between set) operators.
Interset operators are also called global set operators.
The intraset (within a set) operators (~, |) are evaluated first; then, the interset
operators are evaluated. You cannot use interset operators on patterns in the same
set.
Though only the OR (|) and NOR (~) logical operators are available as intraset
operators, you can create the AND and NAND operators by applying DeMorgan’s
law (the "/" character is used to represent a logical NOT):
AND
NAND
Examples
A and B = /(/A and /B)
/(A and B) = /A or /B
NOR
OR
Some valid intraset combinations follow.
U>tsto p1 | p2 | p3 | r
U>tsto p5 ~ p6 ~ arm
The following expression is invalid because you cannot use both | (OR) and ~
(NOR) operators within the same set.
U>tsto p1 | p2 ~ p3
!ERROR 1249! Invalid qualifier expression: ~ p3
176
Chapter 6: Using the Emulation Analyzer - Complex Configuration
Using Complex Expressions
The following expression is invalid because you cannot combine resources from
different sets with the | (OR) or ~ (NOR) operators.
U>tsto p1 ~ p2 ~ p5
!ERROR 1249! Invalid qualifier expression: p5
Some valid combinations of the two sets follow.
U>tsto p1 ~ p2 and p5 | p6
U>tsto p3 | p4 | !r or p7
U>tsto p8 ~ arm and p1 ~ p2
The following set combination is invalid because p1 and p2 are in the same set.
U>tsto p1 and p2
!ERROR 1249! Invalid qualifier expression: p2
Note that "p1 ~ p1" is allowed; this type of expression may occasionally be useful
if you are running out of pattern resources and wish to specify a logical NOT of
some existing pattern. For example, consider the following commands:
tpat p1 addr=0
tif 1 p1
tif 2 p1 ~ p1
The primary branch of term 2 will be taken when "addr!=0".
An example of using DeMorgan’s law to create the AND operator follows.
Suppose you want to specify the following storage qualifier:
U>tsto p1 & p2 or p5 & p6
!ERROR 1241! Invalid qualifier resource or operator: &
The error occurs because the & operator is not a valid intraset operator. If the
specifications for the trace patterns are:
tpat
tpat
tpat
tpat
p1
p2
p5
p6
addr=5f0
data=39xxxxxx and stat=write
addr=500
data=0xx39xxxx and stat=write
you can enter an equivalent expression to the one which caused the error by making
the following changes to the trace patterns and using the NOR (~) operator in the
tsto command.
U>tpat
U>tpat
U>tpat
U>tpat
U>tsto
p1
p2
p5
p6
p1
addr!=5f0
data!=39xxxxxx or stat!=write
addr!=500
data!=0xx39xxxx or stat!=write
~ p2 or p5 ~ p6
177
Chapter 6: Using the Emulation Analyzer - Complex Configuration
Using the Sequencer
Using the Sequencer
This section describes how to use the sequencer in the "complex" configuration.
The differences between using the sequencer in the "easy" configuration and in the
"complex" configuration are summarized in the following table.
Differences Between the "Easy" and "Complex" Analyzer Configurations
Analyzer Feature In the "easy" configuration . . .
In the "complex" configuration . . .
sequence terms
and the trigger
(tsq)
You can insert or delete terms from the
sequencer, and the branch out of the last
sequence term constitutes the trigger.
There are always eight terms in the
sequencer. Any of the sequence terms
except the first may be specified as the
trigger term. Entry into the trigger term
constitutes the trigger.
simple trigger
(tg)
The simple trigger command (tg) sets up
a one term sequencer, and the expression
specified with the tg command becomes
the primary branch expression of the first
sequence term.
The simple trigger command (tg) sets the
primary branch expression of sequence
term 1, and specifies the second
sequence term as the trigger term.
primary branch
expressions
(tif)
Primary branches are always made to the
next higher sequence term.
Primary branches may be made to any
sequence term.
secondary branch
expressions
(telif)
The secondary branch expression is a
global restart. In other words, the
secondary branch expression applies to
all sequence terms, and the branch is
always back to the first sequence term.
Secondary branch expressions may be
specified for each sequence term. Also,
secondary branches can be made to any
sequence term.
storage qualifiers
(tsto)
The trace storage qualifier is "global"
and applies to all sequence terms.
A storage qualifier is associated with
each sequence term; however, the tsto
command still allows you to specify
storage qualifiers globally.
178
Chapter 6: Using the Emulation Analyzer - Complex Configuration
Using the Sequencer
In the complex configuration, you perform the same tasks as are performed in the
easy configuration. However, in the complex configuration, you have more
sequence terms, you can specify destination terms for primary and secondary
branches, and you can specify storage qualifiers for each sequence term.
This section describes how to:
•
Reset the sequencer.
•
Specify a simple trigger condition.
•
Specify primary and secondary branches.
•
Specify the trigger term.
•
Specify storage qualifiers.
•
Trace windows of execution.
To reset the sequencer
• Enter the tsq -r command.
After entering the "complex" analyzer configuration, the sequencer is in its default
reset state.
If the analyzer is already in the "complex" configuration, you can reset the
sequencer to its default state with the tsq -r command.
Examples
To reset the sequencer:
U>tsq -r
To display the default sequencer specification:
U>tsq
tif
tif
tif
tif
tif
tif
tif
1
2
3
4
5
6
7
any
any
any
any
any
any
any
2
3
4
5
6
7
8
179
Chapter 6: Using the Emulation Analyzer - Complex Configuration
Using the Sequencer
tif 8 never
tsq -t 2
tsto 1 all
tsto 2 all
tsto 3 all
tsto 4 all
tsto 5 all
tsto 6 all
tsto 7 all
tsto 8 all
telif 1 never
telif 2 never
telif 3 never
telif 4 never
telif 5 never
telif 6 never
telif 7 never
telif 8 never
There are eight terms in the "complex" configuration sequencer. By default, the
primary branch expression for each term (except term 8) is any, the secondary
branch expression for each term is never, and the storage qualifier for each term is
all. The trigger term is the second sequence term. This sequencer specification
will result in the same trace data as the default sequencer specification in the "easy"
configuration (except that there will be more sequencer branches after the trigger).
A diagram of the default sequencer specification is shown in the figure below.
180
Chapter 6: Using the Emulation Analyzer - Complex Configuration
Using the Sequencer
If the tsq information scrolls off your screen, you may wish to display the
sequencer specifications with a combination of other display commands; for
example, you could enter the tif, telif, tsto, and tsq -t commands to display the
same information.
To specify a simple trigger condition
• Use the tg command.
Using the tg (simple trigger) command in the "complex" configuration will cause
the first two sequence terms to be modified. The pattern specified in the tg
command becomes the primary branch expression of the first sequence term. The
primary and secondary branch expressions of the second sequence term are set to
never, and this term is specified as the trigger term. The secondary branch
expression of the first sequencer term is also set to never.
The result of the tg command in the "complex" configuration is the same as in the
"easy" configuration, and equivalent tg commands (where the pattern is the same as
the "easy" configuration expression, and the storage qualifiers are the same) will
yield identical traces in each of the trace configurations.
As in the "easy" configuration, the tg command with no options will display the
primary branch expression of the first sequence term. This will only be the trigger
condition when the second sequence term is the trigger term.
Examples
To set up a simple trigger on the branch to the first instruction in the demo
program’s "for" loop (0A7AH):
U>sym for_loop=0a7a
U>tpat p1 addr=for_loop
U>tg p1
181
Chapter 6: Using the Emulation Analyzer - Complex Configuration
Using the Sequencer
U>tsq
tif 1 p1 2
tif 2 never
tif 3 any 4
tif 4 any 5
tif 5 any 6
tif 6 any 7
tif 7 any 8
tif 8 never
tsq -t 2
tsto 1 all
tsto 2 all
tsto 3 all
tsto 4 all
tsto 5 all
tsto 6 all
tsto 7 all
tsto 8 all
telif 1 never
telif 2 never
telif 3 never
telif 4 never
telif 5 never
telif 6 never
telif 7 never
telif 8 never
A diagram of this sequencer specification is shown in the figure below.
To specify primary and secondary branch
expressions
• Use the tif and telif commands.
182
Chapter 6: Using the Emulation Analyzer - Complex Configuration
Using the Sequencer
In the "easy" configuration, primary branches are always to the next sequence term.
In the "complex" configuration, primary branches may be to any sequence term.
Therefore, the number of the destination term must be specified before the
occurrence count.
In the "easy" configuration, the secondary branch expression is a "global restart". It
applies to all sequence terms and causes branches back to the first sequence term.
In the "complex" configuration, you can specify secondary branch expressions for
each sequence term and the branch may be to any sequence term. Therefore, the
number of the destination term must be specified.
Examples
To specify a primary branch from sequence term 2 to sequence term 5 when the
pattern p2 is found:
U>tif 2 p2 5
To specify a secondary branch from sequence term 2 to sequence term 3 when the
pattern p3 is found:
U>telif 2 p3 3
To specify that the sequencer never branch out of term 5:
U>tif 5 never
U>telif 5 never
To specify the trigger term
• Use the tsq -t command.
In the "easy" configuration, the branch out of the last sequence term constitutes the
trigger. In the "complex" configuration there are always eight terms in the
sequencer, and any of the sequence terms except the first may be specified as the
trigger term. Entry into the trigger term constitutes the trigger. The trigger term is
specified with the tsq -t command.
Examples
To specify that entry into the fifth term constitutes the trigger:
183
Chapter 6: Using the Emulation Analyzer - Complex Configuration
Using the Sequencer
U>tsq -t 5
To specify storage qualifiers
• Use the tsto command.
In the "easy" configuration, the trace storage qualifier is global, that is, it applies to
all sequence terms. In the "complex" configuration, storage qualifiers are
associated with each sequence term (though you can specify that one storage
qualifier applies to all terms).
Prestore qualifiers still apply to all normal storage states; however, in the
"complex" configuration, you specify pattern or range resources with the tpq
command.
Examples
To store states matching pattern p4 while searching for the branch expressions of
sequence term 7:
U>tsto 7 p4
184
Chapter 6: Using the Emulation Analyzer - Complex Configuration
Using the Sequencer
To store states matching the range resource while searching for the branch
expressions of sequence term 5:
U>tsto 5 r
To store all states when searching for branch expressions, except when searching
for the branch expressions of sequence term 1:
U>tsto all
U>tsto 1 none
To trace windows of activity
1 Set up one sequence term as the window enable term.
2 Set up one sequence term as the window disable term.
3 Set up a trigger term.
4 Do not store states while searching for the window enable condition.
5 Store all states while searching for the window disable condition.
One common use for the "complex" configuration sequencer is to trace "windows"
of execution or, perhaps, to eliminate "windows" of execution from traces.
For example, suppose you wish to trace only the execution within a certain range of
addresses. These addresses could be a subroutine or perhaps they are just the
addresses of instructions in which you are interested.
A simple windowing sequencer specification would consist of a window enable
term, a window disable term, and perhaps a trigger term (if you wish to trigger on a
condition other than the enable or disable terms). Only the states which occur
between the window enable condition and the window disable condition are stored.
185
Chapter 6: Using the Emulation Analyzer - Complex Configuration
Using the Sequencer
Examples
To trace only the execution of the "rand" library routine, you would set up the
sequencer specification so that the call to the "rand" subroutine is the window
enable term and the return at the subroutine’s "ret" instruction is the window
disable term.
To display the "rand" subroutine in memory, enter the following command.
U>m -dm 1048..1077
000001048 rand:_srand
000001050 000001052 rand:_rand
000001058 000001060 000001066 00000106c 00000106e 000001070 000001076 -
MOVE.L
RTS
MOVE.L
MULS.L
ADDI.L
MOVE.L
CLR.W
SWAP
ANDI.L
RTS
($0004,A7),data_gen:__rand_seed
data_gen:__rand_seed,D0
#$41C64E6D,D0
#$00003039,D0
D0,data_gen:__rand_seed
D0
D0
#$00007FFF,D0
Suppose that you wish to trigger on the instruction at 1066H. The diagram of the
sequencer to do this is shown in the figure below.
186
Chapter 6: Using the Emulation Analyzer - Complex Configuration
Using the Sequencer
To define symbols for the enable, disable, and trigger states:
U>sym enable=1052
U>sym disable=1076
U>sym trigger=1066
To reset the sequencer:
U>tsq -r
To specify trace patterns:
U>tpat p1 addr=enable
U>tpat p2 addr=disable
U>tpat p3 addr=trigger
To specify the primary and secondary branch expressions:
U>tif 1
U>tif 2
U>telif
U>tif 3
U>tif 4
p1 2
p3 3
2 p2 1
p2 4
p1 3
To specify the trigger term:
U>tsq -t 3
To specify the storage qualifiers so that states are stored only while searching for
the window disable condition (the first command below specifies all storage
qualifiers to be none, and the second command specifies that all states be stored
while searching for the window disable condition):
U>tsto none
U>tsto 2 all
U>tsto 3 all
To place the trigger position at the center of the trace:
U>tp c
187
Chapter 6: Using the Emulation Analyzer - Complex Configuration
Using the Sequencer
To display the sequencer specification.
U>tsq
tif 1 p1 2
tif 2 p3 3
tif 3 p2 4
tif 4 p1 3
tif 5 any 6
tif 6 any 7
tif 7 any 8
tif 8 never
tsq -t 3
tsto 1 none
tsto 2 all
tsto 3 all
tsto 4 none
tsto 5 none
tsto 6 none
tsto 7 none
tsto 8 none
telif 1 never
telif 2 p2 1
telif 3 never
telif 4 never
telif 5 never
telif 6 never
telif 7 never
telif 8 never
Starting the trace, waiting for the measurement to complete, and displaying the
trace will result in the following information.
U>t
Emulation trace started
U>ts
--- Emulation Trace Status --NEW User trace complete
Arm ignored
Trigger in memory
Arm to trigger ?
States 268 (268) -12..255
Sequence term 4
Occurrence left 1
U>tl -de -t 30
188
Chapter 6: Using the Emulation Analyzer - Complex Configuration
Using the Sequencer
Line
-----12
-11
-10
-9
-8
-7
-6
-5
-4
-3
-2
-1
0
1
2
3
4
5
6
7
8
9
10
11
12
13
14
15
16
17
addr,H
-------enable
00001054
00001056
00001058
and_seed
000604dc
0000105a
0000105c
0000105e
00001060
00001062
00001064
trigger
00001068
0000106a
0000106c
0000106e
and_seed
000604dc
00001070
00001072
00001074
disable
enable
00001054
00001056
00001058
and_seed
000604dc
0000105a
68340 Mnemonic
---------------------------------------MOVE.L
data_gen:__rand_seed,D0
$0006
supr prgm word rd (ds16)
$04DA
supr prgm word rd (ds16)
MULS.L
#$41C64E6D,D0
$3304
supr data long rd (ds16)
$31B3
supr data word rd (ds16)
$0800
supr prgm word rd (ds16)
$41C6
supr prgm word rd (ds16)
$4E6D
supr prgm word rd (ds16)
ADDI.L
#$00003039,D0
$0000
supr prgm word rd (ds16)
$3039
supr prgm word rd (ds16)
MOVE.L
D0,data_gen:__rand_seed
$0006
supr prgm word rd (ds16)
$04DA
supr prgm word rd (ds16)
CLR.W
D0
SWAP
D0
$E35F
supr data long wr (ds16)
$E370
supr data word wr (ds16)
ANDI.L
#$00007FFF,D0
$0000
supr prgm word rd (ds16)
$7FFF
supr prgm word rd (ds16)
RTS
MOVE.L
data_gen:__rand_seed,D0
$0006
supr prgm word rd (ds16)
$04DA
supr prgm word rd (ds16)
MULS.L
#$41C64E6D,D0
$E35F
supr data long rd (ds16)
$E370
supr data word rd (ds16)
$0800
supr prgm word rd (ds16)
count,R
----------0.720 uS
0.680 uS
0.720 uS
0.720 uS
0.720 uS
0.720 uS
0.720 uS
0.720 uS
0.720 uS
0.720 uS
5.240 uS
0.720 uS
0.680 uS
0.720 uS
0.720 uS
0.720 uS
0.720 uS
0.720 uS
0.720 uS
0.720 uS
0.680 uS
0.720 uS
89.76 uS
0.680 uS
0.720 uS
0.720 uS
0.720 uS
0.720 uS
0.720 uS
seq
--+
.
.
.
.
.
.
.
.
.
.
.
+
.
.
.
.
.
.
.
.
.
+
+
.
.
.
.
.
.
189
190
7
Making Coordinated Measurements
191
Making Coordinated Measurements
When HP 64700 Card Cages are connected together via the Coordinated
Measurement Bus (CMB), you can start and stop up to 32 emulators at the same
time.
You can use the analyzer in one HP 64700 to arm (that is, activate) the analyzers in
other HP 64700 Card Cages or to cause emulator execution in other HP 64700 Card
Cages to break into the monitor.
You can use the HP 64700’s BNC connector (labeled TRIGGER IN/OUT on the
lower left corner of the HP 64700 rear panel) to trigger an external instrument (for
example, a logic analyzer or oscilloscope) when the analyzer finds its trigger
condition. Also, you can allow an external instrument to arm the analyzer or break
emulator execution into the monitor.
The coordinated measurement tasks you can perform are grouped into the
following sections:
192
•
Setting up for coordinated measurements.
•
Starting and stopping multiple emulators.
•
Using external trigger signals.
The location of the CMB and BNC connectors on the HP 64700 rear panel is
shown in the following figure.
CMB Connector
BNC Connector
Signal Lines on the CMB
There are three bi-directional signal lines on the CMB connector on the rear panel
of the emulator. These CMB signals are:
TRIGGER The CMB TRIGGER line is low true. This signal can be driven or
received by any HP 64700 connected to the CMB. This signal can be used to
trigger an analyzer. It can be used as a break source for the emulator.
READY The CMB READY line is high true. It is an open collector and performs
an ANDing of the ready state of enabled emulators on the CMB. Each emulator on
the CMB releases this line when it is ready to run. This line goes true when all
enabled emulators are ready to run, providing for a synchronized start.
When CMB is enabled, each emulator is required to break to background when
CMB READY goes false, and will wait for CMB READY to go true before
returning to the run state. When an enabled emulator breaks, it will drive the CMB
READY false and will hold it false until it is ready to resume running. When an
emulator is reset, it also drives CMB READY false.
193
EXECUTE The CMB EXECUTE line is low true. Any HP 64700 on the CMB
can drive this line. It serves as a global interrupt and is processed by both the
emulator and the analyzer. This signal causes an emulator to run from a specified
address when CMB READY returns true.
BNC Trigger Signal
The BNC trigger signal is a positive rising edge TTL level signal. The BNC trigger
line can be used to either drive or receive an analyzer trigger, or receive a break
request for the emulator.
Comparison Between CMB and BNC Triggers The CMB trigger and BNC
trigger lines have the same logical purpose: to provide a means for connecting the
internal trigger signals (trig1 and trig2) to external instruments. The CMB and
BNC trigger lines are bi-directional. Either signal may be used directly as a break
condition.
The CMB trigger is level-sensitive, while the BNC trigger is edge-sensitive. The
CMB trigger line puts out a true pulse following receipt of EXECUTE, despite the
commands used to configure it. This pulse is internally ignored.
Note that if you use the EXECUTE function, the CMB TRIGGER should not be
used to trigger external instruments, because a false trigger will be generated when
EXECUTE is activated.
194
Chapter 7: Making Coordinated Measurements
Setting Up for Coordinated Measurements
Setting Up for Coordinated Measurements
This section describes how to:
•
Connect the Coordinated Measurement Bus.
•
Connect the rear panel BNC.
To connect the Coordinated Measurement Bus
(CMB)
CAUTION
Be careful not to confuse the 9-pin connector used for CMB with those used by
some computer systems for RS-232C communications. Applying RS-232C signals
to the CMB connector is likely to result in damage to the HP 64700 Card Cage.
To use the CMB, you will need one CMB cable for the first two emulators and one additional cable for
every emulator after the first two. The CMB cable is orderable from HP under product number
HP 64023A. The cable is four meters long.
You can build your own compatible CMB cables using standard 9-pin D type subminiature connectors
and 26 AWG wire.
Note that Hewlett-Packard does not ensure proper CMB operation if you are using a self-built cable!
195
Chapter 7: Making Coordinated Measurements
Setting Up for Coordinated Measurements
1 Connect the cables to the HP 64700 CMB ports.
196
Chapter 7: Making Coordinated Measurements
Setting Up for Coordinated Measurements
Number of HP 64700 Series
Emulators
Maximum Total Length of
Cable
Restrictions on the CMB
Connection
2 to 8
100 meters
None.
9 to 16
50 meters
None.
9 to 16
100 meters
Only 8 emulators may have rear
panel pullups connected. *
17 to 32
50 meters
Only 16 emulators may have rear
panel pullups connected. *
* A modification must be performed by your HP Customer Engineer.
Emulators using the CMB must use background emulation monitors.
At least 3/4 of the HP 64700-Series emulators connected to the CMB must be powered up before proper
operation of the entire CMB configuration can be assured.
To connect to the rear panel BNC
CAUTION
The BNC line on the HP 64700 accepts input and output of TTL levels only. (TTL
levels should not be less than 0 volts or greater than 5 volts.) Failure to observe
these specifications may result in damage to the HP 64700 Card Cage.
197
Chapter 7: Making Coordinated Measurements
Setting Up for Coordinated Measurements
1 Connect one end of a 50 ohm coaxial cable with male BNC connectors to the HP 64700 BNC
receptacle and the other end to the appropriate BNC receptacle on the other measuring instrument.
The BNC connector is capable of driving TTL level signals into a 50 ohm load. (A positive rising edge is
the trigger signal.) It requires a driver that can supply at least 4 mA at 2 volts when used as a receiver.
The BNC connector is configured as an open-emitter structure which allows for multiple drivers to be
connected. It can be used for cross-triggering between multiple HP 64700Bs when no other
cross-measurements are needed. The output of the BNC connector is short-circuit protected and is
protected from TTL level signals when the emulator is powered down.
198
Chapter 7: Making Coordinated Measurements
Starting/Stopping Multiple Emulators
Starting/Stopping Multiple Emulators
When HP 64700 Card Cages are connected together via the Coordinated
Measurement Bus (CMB), you can start and stop up to 32 emulators at the same
time. These are called synchronous measurements. This section describes how to:
•
Enable synchronous measurements.
•
Start synchronous measurements.
•
Disable synchronous measurements.
To enable synchronous measurements
• Enter the cmb -e command.
You can enable the emulator’s interaction with the CMB by using the cmb -e
command. When the EXECUTE signal is received, the emulator will run at the
address specified by the rx command. (Specifying an address with the rx
command will automatically enable interaction with the CMB.)
The tx -e command enables the analyzer to start a measurement when the
EXECUTE signal is received. If trace at execute is disabled (tx -d), the analyzer
ignores the CMB EXECUTE signal.
Note that the cmb command does not affect the operation of analyzer
cross-triggering.
Examples
To enable synchronous measurements with the cmb -e command:
U>cmb -e
To enable synchronous measurements with the rx <address> command:
U>rx 920
199
Chapter 7: Making Coordinated Measurements
Starting/Stopping Multiple Emulators
To start synchronous measurements
• Enter the x command.
The x command causes the EXECUTE line to be pulsed, thereby initiating a
synchronous measurement. CMB interaction does not have to be enabled (cmb -e)
in order to use the x command. (The cmb -e command only specifies how the
emulator will react to the CMB EXECUTE signal.)
All emulators whose CMB interaction is enabled will break into the monitor when
any one of those emulators breaks into its monitor.
Note that when the CMB is being actively controlled by another emulator, the step
command (s) does not work correctly. The emulator may end up running in user
code (NOT stepping). Disable CMB interaction (cmb -d) while stepping the
processor.
U>x
To disable synchronous measurements
• Enter the cmb -d command.
You can disable the emulator’s interaction with the CMB by using the cmb -d
command. When interaction is disabled, the emulator ignores the CMB EXECUTE
and READY lines.
200
Chapter 7: Making Coordinated Measurements
Using External Trigger Signals
Using External Trigger Signals
External trigger signals come from the CMB and BNC connectors. A diagram of
the internal signals and the commands which may be used to drive them or to arm
an analyzer with them are shown in the figure below. This diagram is only
201
Chapter 7: Making Coordinated Measurements
Using External Trigger Signals
intended to show logical connections, and does not represent actual circuitry inside
the emulator.
This section describes how to:
•
Arm analyzers with external trigger signals.
•
Break emulator execution with external trigger signals.
•
Send analyzers’ trigger output signals to external lines.
To arm analyzers with external trigger signals
1 Use the cmbt -d or bnct -d commands to have the rear panel drive an internal
trigger signal.
2 Use the tarm command to arm the analyzer on the internal signal.
By default, the analyzers are always armed. This means that the analyzers arm
conditions are always true.
The tarm (trace arm condition) command is used to specify or display the
emulation analyzer arm condition.
There are two internal signals, trig1 and trig2, which may be specified as the arm
condition. You can specify that the arm condition be true when one of these two
signals is true (=trig1 or =trig2).
By using !=trig1 or !=trig2, you can specify that the analyzer be armed or never
armed, depending on the state of the internal signal when the trace is started. .
The keyword arm may be used to specify primary and secondary branch qualifiers,
as well as storage or prestore qualifiers.
It is often important to start the analyzer which receives a signal before the analyzer
which drives the signal. For example, if you start the analyzer which drives a
signal first, the signal may already be driven before you start the analyzer which
receives the signal. The receiving analyzer will most likely capture states which
execute long after the condition which caused the signal to be driven.
202
Chapter 7: Making Coordinated Measurements
Using External Trigger Signals
Examples
To arm the emulation analyzer when the external CMB trigger signal is true:
M>cmbt -d trig1
M>tarm =trig1
If you enter the following commands:
M>bnct -d trig2
M>tarm !=trig2
If the trig2 signal is asserted when the analyzer is started, the analyzer can never be
armed. If the trig2 signal is not asserted when the analyzer is started, the analyzer
is armed immediately.
To break emulator execution with external trigger
signals
• Use the bc -e cmbt or bc -e bnct commands.
You can use the bc -e cmbt or bc -e bnct commands to enable emulator execution
to break into the monitor when a trigger signal is received.
Examples
To enable breaks on the CMB TRIGGER signal:
R>bc -e cmbt
To enable breaks on the BNC TRIGGER signal:
R>bc -e bnct
203
Chapter 7: Making Coordinated Measurements
Using External Trigger Signals
To send analyzer trigger output signals to
external lines
1 Use the cmbt -r or bnct -r commands to have the rear panel receive an internal
trigger signal.
2 Use the tgout commands to drive the trigger output to the internal signal.
The default condition of the analyzer specifies that the emulation analyzer does not
drive the internal trig1 or trig2 signals when the trigger is found.
The tgout command is used to specify that one of the internal signals be driven
when the emulation analyzer trigger is found. The tgout command with no options
will display the signal which is currently being driven when the trigger is found (or
none if no signal is driven when the trigger is found).
The signals which may be driven when the trigger is found are the internal signals
trig1 and trig2. The trig1 and trig2 signals may drive the CMB or BNC TRIGGER
lines or the emulator break.
Note that you should not set up an analyzer to both drive and receive the same
trigger signal. For example, if you issue the commands tg arm; tarm =trig1;
tgout trig1; bnct -d trig1 -r trig1, the analyzer trig1 signal will become latched in
a feedback loop and will remain latched until the loop is broken. To break the loop,
you must first disable the signal’s source, then momentarily disable either the drive
or receive function. In this case, the commands tgout none and bnct -d none will
break the loop.
Examples
To send the emulation analyzer trigger output to the CMB trigger line over the
internal trig1 signal:
M>cmbt -r trig1
M>tgout trig1
To send the emulation analyzer trigger output to the BNC trigger line over the
internal trig2 signal:
M>bnct -r trig2
M>tgout trig2
204
Part 3
Reference
205
Part 3
206
8
Commands
207
Commands
This chapter describes:
208
•
The Terminal Interface commands.
•
Analyzer state qualifier expressions.
•
Values that that can be specified in commands.
Chapter 8: Commands
<addr> - address specification in the 68340 emulator
<addr> - address specification in the 68340
emulator
XXXXXXXX
XXXXXXXX@<fc>
XXXXXXXX..XXXXXXXX
XXXXXXXX..XXXXXXX@<fc>
XXXXXXXX..
XXXXXXXX@<fc>..
- 32 bit address
- 32 bit address with function code specifier
- address range, 32 bit address through
32 bit address
- address range with function code specifier
- 128 byte address range
- 128 byte address range with function code
specifier
The 68340 emulator allows you to specify function code information in addition to
the numerical address. This allows you to map separate regions of memory for user
and supervisor program and data space.
The parameters are as follows:
<fc>
The function code may be any one of the following:
u — User
s — Supervisor
d — Data
p — Program
ud — User Data
up — User Program
sd — Supervisor Data
sp — Supervisor Program
cpu — CPU space
x — don’t care
Examples
To map address ranges:
R>map 0..0fff erom
R>map 10000..1ffff@sp erom
R>map 10000..1ffff@up erom
R>map 20000..2ffff@d eram
R>map
# remaining number of terms
# remaining emulation memory
map 000000000..000000fff
map 000010000..00001ffff@sp
map 000010000..00001ffff@up
map 000020000..00002ffff@d
map other tram
: 3
: 10000h bytes
erom
erom
erom
eram
#
#
#
#
term
term
term
term
1
2
3
4
209
Chapter 8: Commands
<addr> - address specification in the 68340 emulator
Notice that you can map the same address range to different blocks of memory by
using function code specifiers.
To display the contents of memory locations in these ranges:
R>m -db 10000..1000f@sp
000010000@sp 00 00 57 00 ff ff ff ff ff ff ff ff ff ff ff ff
M>m -db 10000..1000f@up
000010000@up ff ff ff ff ff ff ff ff ff ff ff ff ff ef ff ff
M>m -db 20000..2000f@d
000020000@d 00 08 00 09 00 01 09 ff ff ff ff 63 45 ff 00 ff
M>m -db 20000..2000f@ud
000020000@ud 00 08 00 09 00 01 09 ff ff ff ff 63 45 ff 00 ff
M>m -db 20000..2000f@sd
000020000@sd 00 08 00 09 00 01 09 ff ff ff ff 63 45 ff 00 ff
M>m -db 20000..2000f
!ERROR 312! Ambiguous address: 000020000
M>m -db 10000..1000f@p
!ERROR 312! Ambiguous address: 000010000@p
The "Ambiguous address" error message occurs because the address range exists in
different blocks of memory (mapped with different function codes). If you don’t
use a function code specifier with the address range, the emulator doesn’t know
which block of memory you’re referring to.
See Also
m (allows you to display or modify memory locations or ranges)
map (used to define the type and location of memory used by the emulator)
210
Chapter 8: Commands
b - break emulation processor to monitor
b - break emulation processor to monitor
b
The b command issues a break to the emulator, causing it to stop executing the user
program and enter the monitor state. If the emulator is in the reset state when a
break occurs, it will be released from reset into the monitor state.
See Also
r (runs the user program from the current pc or a specified address)
s (steps the user program a number of instructions from the current pc or a specified
address)
211
Chapter 8: Commands
bc - set or display break conditions
bc - set or display break conditions
bc
- display current setting for all break conditions
bc -e <condition>
- enable specified break condition(s)
bc -d <condition>
- disable specified break condition(s)
bc -d <condition> <condition>
- multiple <condition>s allowed
The bc command allows you to set break conditions for the emulation system. This
allows you to have the emulator break to the monitor upon error conditions (such as
write to ROM), emulation processor trace events, or break to the monitor when a
trigger signal is received.
The parameters are as follows:
-e
Enables the indicated break conditions (which must be specified immediately
following the -e on the command line).
-d
Disables the indicated break conditions (which must be specified immediately
following the -d on the command line).
<condition>
You can enable or disable the following break conditions:
212
bp
Software breakpoints and breakpoint registers. Software
breakpoints and the processor breakpoint registers can not be
configured independently. The "bp" condition enables or
disables them both.
rom
Writes to ROM memory locations, as characterized when
mapping memory.
bnct
Assertion of the rear panel BNC TRIGGER signal. Note that
this signal may also drive either of the internal trig1 or trig2
signals or both.
cmbt
Assertion of the CMB (Coordinated Measurement Bus)
TRIGGER signal. Note that the CMB trigger signal may also
drive either of the internal trig1 or trig2 signals or both.
trig1
Assertion of the internal trig1 signal. Refer to the tgout, bnct,
and cmbt commands for information on specifying drivers and
receivers of the trig1 signal.
Chapter 8: Commands
bc - set or display break conditions
trig2
Assertion of the internal trig2 signal. Refer to the tgout, bnct,
and cmbt commands for information on specifying drivers and
receivers of the trig2 signal.
When you use the bc command, the emulator may break into the monitor while
each enable/disable is being executed. If the emulator was executing your program
when the bc command was received, it will return to your program when finished
executing the command. If you request only a display of the current break
conditions, the emulator does not break to the monitor.
When a hardware reset occurs during processing of the bc command, the result may
be that a particular break condition is left in an unknown state. If this occurs, a
display of the break conditions will show a question mark "?" instead of -e or -d
next to the break condition.
See Also
bnct (specify drivers and receivers of the rear panel BNC signal)
cmbt (specify drivers and receivers of the CMB trigger signal)
bp (set/delete software breakpoints)
map (specify whether memory locations are mapped as RAM or ROM)
tgout (specify whether the trig1 and/or trig2 signals are to be driven when the
analyzer finds the trigger condition)
213
Chapter 8: Commands
bnct - specify control of rear panel BNC signal
bnct - specify control of rear panel BNC signal
bnct
bnct -d <dtype>
bnct -r <rtype>
- display current bnct set up
- rear panel BNC drives trig(1,2) signal(s)
- rear panel BNC receives trig(1,2) signal(s)
--- NOTES --All option combinations are accepted:
’bnct -d trig1,trig2 -r trig1,trig2’
is a valid command
The bnct command allows you to specify which of the internal trig1 or trig2
trigger signals will drive and/or receive the rear panel BNC trigger. You can
specify the signals individually, as an ORed condition for drive, or as an ANDed
condition for receive; or, you can specify that the signals are not to be driven or
received.
Upon powerup, bnct is set to bnct -d none -r none.
The parameters are as follows:
-d
Specifies that the rear panel BNC port drives the internal trigger signals, trig1 and
trig2.
-r
Specifies that the rear panel BNC port receive the internal trigger signals, trig1 or
trig2, and send them out the BNC port.
<dtype>
The valid drive options are:
<rtype>
trig1
When the BNC signal is received, drive trig1 signal.
trig2
When the BNC signal is received, drive trig2 signal.
none
When the BNC signal is received, drive neither signal.
The valid receive options are:
trig1
When trig1 signal goes true, send out the BNC signal.
trig2
When trig2 signal goes true, send out the BNC signal.
none
Neither trig1 or trig2 will send the BNC signal out.
Normally, you would use this command to cross-trigger instruments. For example,
you may wish to trigger a digitizing oscilloscope hooked to various timing signals
214
Chapter 8: Commands
bnct - specify control of rear panel BNC signal
when the emulation analyzer finds a certain state, or, you may wish to do the
converse and trigger the HP 64700’s analyzer when an oscilloscope finds its trigger.
See Also
bc (break conditions; can be used to specify that the emulator will break into the
emulation monitor upon receipt of one of the trig1/trig2 signals)
cmbt (coordinated measurement bus trigger; used to specify which internal signals
will be driven or received by the HP 64700 coordinated measurement bus)
tarm (analyzer trace arm; used to specify arming (begin to search for trigger)
conditions for the analyzer -- trig1/trig2 can be used to arm the analyzer)
tgout (specifies which of the trig1/trig2 signals are to be driven when the analyzer
trigger is found)
215
Chapter 8: Commands
bp - set, enable, disable, remove or display software breakpoints
bp - set, enable, disable, remove or display
software breakpoints
bp
bp
bp
bp
bp
bp
bp
bp
bp
<addr>
-e *
-e <addr>
-d *
-d <addr>
-r *
-r <addr>
<addr> <addr>
-
display current breakpoints
set breakpoint at <addr>
enable all breakpoints
enable breakpoint at <addr>
disable all breakpoints
disable breakpoint at <addr>
remove all breakpoints
remove breakpoint at <addr>
more than one <addr> may be given
Upon powerup or init initialization, the breakpoint table is cleared and the
breakpoint feature is disabled.
The parameters are as follows:
<addr>
Specifies the address location where the software breakpoint is to be inserted. If
you specify options -e, -d, or -r, the address specifies the location of the software
breakpoint to be enabled, disabled, or removed.
-e
Enables (activates) the breakpoint(s) at the address(es) specified. This installs the
necessary breakpoint instruction in memory. If the breakpoint is already enabled,
no action is taken.
-d
Disables (deactivates) the software breakpoint(s) at the address(es) specified.
When the software breakpoint is disabled, the original memory contents are
restored if the breakpoint was enabled. The software breakpoint address(es) remain
in the breakpoint definition table and can be reset by using the bp -e <ADDRESS>
command.
-r
Removes the software breakpoint(s) at the addresses specified. When the software
breakpoint is removed, the original memory contents are restored if the breakpoint
was enabled; then, the address is removed from the breakpoint table.
Note that when the breakpoint table is displayed with the bp command, the
enable/disable status of each breakpoint is tested by reading the memory locations
in question. If a software break instruction is found, the breakpoint is displayed as
"enabled"; if not, the breakpoint is displayed as "disabled". If the software
breakpoint is in target RAM and emulator is running under the real-time restriction,
the breakpoint is displayed as "status unknown".
216
Chapter 8: Commands
bp - set, enable, disable, remove or display software breakpoints
If the emulator executes a BGND instruction that was placed by you (either through
your compiler or via memory modification) and not by the bp command, an
"undefined breakpoint" error message is generated.
If the emulator is executing in the user program when you define or modify
breakpoints, it will break into the monitor for each breakpoint that is defined or
modified. The emulator will return to user program execution after breakpoint
definition or modification.
Remember that any operation which modifies memory or the memory map will
alter the existing breakpoints. For example, if you load a new program in the same
address range where breakpoints reside, the breakpoints will be destroyed.
Changing the memory map will prevent the emulator from placing new breakpoints
or enabling existing breakpoints.
If you disable the breakpoints break condition with the bc -d bp command, the
software breakpoints currently defined will remain in the breakpoint table, but will
be disabled and will remain in that state until the breakpoint feature is reenabled
and the specified breakpoints are reenabled (bc -e bp and bp -e <addr>).
See Also
bc (enable/disable breakpoint conditions (including bp))
mo (defines memory access and display modes; the bp command uses the currently
defined modes when writing software breakpoints into memory)
217
Chapter 8: Commands
cf - display or set emulation configuration
cf - display or set emulation configuration
cf
- display current settings for all config items
cf <item>
- display current setting for specified <item>
cf <item>=<value> - set new <value> for specified <item>
cf <item> <item>=<value> <item> - set and display can be combined
The parameters are as follows:
<item>
Configuration item. The valid HP 64751 emulator configuration items are:
clk
Select internal or external emulation clock.
If cf clk=int, the emulator will use the internal 32.768 KHz
crystal. The target system MUST drive MODCLK high (or
allow a pullup resistor in the emulator to pull it high) during
reset to enable the 68340 VCO.
If cf clk=ext, the emulator will use the crystal or TTL oscillator
in the target system. MODCLK should be driven appropriately.
rrt
Enable or disable restriction to real-time runs.
When cf rrt=en and while the emulator is running the user
program, any command that requires a break to the monitor will
be rejected except rst, b, r, or s.
When cf rrt=dis, commands that require a break to the monitor
will always be accepted.
rv
Select SSP and PC when monitor is entered from emulation
reset.
The cf rv=<SSP_value>,<PC_value> command defines initial
values for the supervisor stack pointer and program counter
when the monitor is entered from either emulation or target
system reset. This is true for both background and foreground
monitors. The SSP and PC must be set to an even address.
If a run from reset command is given, this configuration item
has no affect and the initial supervisor stack pointer and
218
Chapter 8: Commands
cf - display or set emulation configuration
program counter will be retrieved from reset vector in the user’s
vector table.
lfc
Select 68340 function codes for file loading.
The cf lfc=<function_code> command specifies the function
code range that the load command uses to load files. This
configuration item must be used if 68340 function codes are
part of the memory map. The function codes can be:
x function codes unmapped
s load file in supervisor space
u load file in user space
p load file in program space
d load file in data space
sp load file in supervisor program space
sd load file in supervisor data space
up load file in user program space
ud load file in user data space
mon
Select foreground or background monitor.
When a background monitor is selected (cf mon=bg), the
Background Debug Mode (BDM) of the 68340 processor is
used. The BKPT line is asserted to enter the monitor.
During background monitor operation, there will be no bus
cycle activity except for memory reads and writes that result
from memory display or modify commands. The 68340
processor will not respond to interrupts.
If a target system reset occurs, the 68340 will be reset and the
background monitor will be re-entered when reset is released.
The reset values of SSP and PC will be loaded from the rv
configuration item. The values in the cf_sim register set will
also be loaded.
When a foreground monitor is selected (cf mon=fg), the default
foreground monitor or downloaded custom monitor is loaded
into dual-ported emulation memory. Unlike the background
monitor, the foreground monitor runs within the same address
219
Chapter 8: Commands
cf - display or set emulation configuration
space as the target program consuming a 4 Kbyte block of the
68340’s address range. The foreground monitor can run with
target interrupts enabled (see the monintr configuration item).
Modifying this configuration item deletes the current memory
map and adds a map term if a foreground monitor is selected.
The starting address of the foreground monitor block is set with
the monaddr configuration item and the mondsi configuration
item determines whether the dsi (/DSACK interlock) memory
attribute is added.
A custom monitor is downloaded using the load -f command
and must be assembled and linked starting at the 4K byte
boundary specified by the monaddr configuration item. Refer
to the foreground monitor source provided with the emulator for
more information.
Except for single stepping, the foreground monitor uses BDM
as the method of breaking to the monitor.
In order for single stepping to operate with the foreground
monitor, the trace vector in the target system’s exception table
must point to the TRACE_ENTRY address in the monitor.
This address is equal to the value of monaddr plus 800H in the
default foreground monitor. An exception stack frame of 7 to
13 words will be temporarily pushed onto the user’s stack
during monitor entry.
See related configuration items monaddr, mondsi, and
monintr.
monaddr
Select the base address of the monitor.
When a background monitor is selected, this configuration item
has no meaning.
When a foreground monitor is selected, the
cf monaddr=<address> command defines the starting address
of the 4 Kbyte block of dual-ported emulation memory. The
address must reside on a 4 Kbyte boundary (an address ending
in 000H) and must be specified in hexadecimal. The current
220
Chapter 8: Commands
cf - display or set emulation configuration
memory map will be deleted and a new map term added for the
monitor.
monintr
Select interrupt priority level for foreground monitor.
When a background monitor is selected, this configuration item
has no meaning. During background monitor operation, all
target system interrupts, including level 7 non-maskable
interrupts, are blocked.
The cf monintr=<level> command configures the default
foreground monitor to run at a lowered interrupt priority level
to allow critical target system interrupts to be processed during
monitor execution. At the point it is safe to lower the interrupt
priority level, the foreground monitor will set the interrupt
priority mask to the value of monintr or the interrupt level that
was in effect before monitor entry, whichever is greater.
mondsi
Enable or disable foreground monitor /DSACK interlocking.
When interlocking is enabled (cf mondsi=en), cycle
termination of accesses to foreground monitor memory will not
occur until the target system provides a /DSACK. If the
monitor is placed in an address range for which the target
system does not generate a /DSACK, the emulator will be
unable to break into the monitor and a "CPU in wait state"
status will result.
When interlocking is disabled (cf mondsi=dis), accesses to
foreground monitor memory will be terminated by a /DSACK
signal generated by the emulator. Any cycle termination signals
generated by the target system during monitor memory
accesses, including /BERR, will be ignored.
Modifying this configuration item will reset the processor and
controls whether the dsi (/DSACK Interlock) memory attribute
is used in the foreground monitor memory map term.
regfmt
Specifies, when displaying single registers, whether expanded
information about the fields within the register are displayed.
221
Chapter 8: Commands
cf - display or set emulation configuration
The cf regfmt=exp command causes the expanded information
to be displayed. The fields are decoded, and the contents of the
bits or fields within the register are described.
The cf regfmt=norm command returns to the default register
displays which show only the hexadecimal contents of the
register.
Refer to the 68340 microprocessor users manual for complete
information about fields within individual registers and their
meanings.
See Also
222
help (you can get an on line display of the configuration items for a particular
emulator by typing help cf. To obtain more information regarding a particular
configuration item, type help cf <config_item>).
Chapter 8: Commands
cl - set or display command line editing mode
cl - set or display command line editing mode
cl
cl -e
cl -d
cl -l <columns>
-
display command line edit mode
enable command line editing
disable command line editing
number of columns for command line
The cl command allows you to enable or disable command line editing. Command
line editing has two typing modes. The normal command entry is input mode. The
input mode functions like normal (canonical) command entry. The control mode
allows command modification.
The parameters are as follows:
-e
Enables command line editing.
-d
Disables command line editing.
-l <columns>
This option allows you to set the column length for the command line. The
<columns> value can be from 40 to 132 columns.
223
Chapter 8: Commands
cl - set or display command line editing mode
The editing mode commands are as follows.
224
Command
Description
<ESC>
i
a
x
r
dd
D
A
$
0
^
h
l
k
j
/<string>
n
N
enter command editing mode
insert before current character
insert after current character
delete current character
replace current character
delete command line
delete to end of line
append to end of line
move cursor to end of line
move cursor to start of line
move cursor to start of line
move left one character
move right one character
fetch previous command
fetch next command
find previous command in history matching <string>
fetch previous command matching <string>
fetch next command matching <string>
Chapter 8: Commands
cmb - enable/disable Coordinated Measurement Bus run/break
cmb - enable/disable Coordinated Measurement
Bus run/break
cmb
cmb -e
cmb -d
- display current setting
- enable CMB run/break interaction
- disable CMB run/break interaction
The cmb command allows you to enable or disable interaction on the CMB
(Coordinated Measurement Bus). The CMB allows you to make measurements
involving cross-triggering of multiple HP 64700 analyzers, and to synchronously
run and break multiple emulators.
The cmb command only affects the ability for multiple emulators to run or break in
a synchronized fashion. The analyzer trigger capability is unaffected by the cmb
command.
If no options are supplied, the current state of CMB enable/disable is displayed.
The parameters are as follows:
-e
Enables interaction between the emulator and the Coordinated Measurement Bus.
-d
Disables interaction between the emulator and the Coordinated Measurement Bus.
When interaction is enabled via the cmb -e command, the emulator will run code
beginning at the address specified via the rx command when the CMB /EXECUTE
(/ means active low) pulse is received.
The CMB READY line is driven false while the emulator is running in the monitor.
The line goes to the true state whenever execution switches to the user program.
Notice that if the rx command is given, CMB interaction is enabled just as if a cmb
-e command was issued. Refer to the syntax pages for the rx command for further
information.
When interaction is disabled via the cmb -d command, the emulator ignores the
actions of the /EXECUTE and READY lines. In addition, the emulator does not
drive the READY line.
See Also
rx (allows you to specify the starting address for user program execution when the
CMB /EXECUTE line is asserted)
225
Chapter 8: Commands
cmb - enable/disable Coordinated Measurement Bus run/break
tx (controls whether or not the emulation analyzer is started when the /EXECUTE
line is asserted)
x (pulses the /EXECUTE line, initiating a synchronous execution among emulators
connected to the CMB and enabled)
Also, refer to the "Making Coordinated Measurements" for further information on
CMB operation.
226
Chapter 8: Commands
cmbt - specify control of the rear panel CMB trigger signal
cmbt - specify control of the rear panel CMB
trigger signal
cmbt
cmbt -d <dtype>
cmbt -r <rtype>
- display current cmbt set up
- rear panel CMB drives trig(1,2) signal(s)
- rear panel CMB receives trig(1,2) signal(s)
--- NOTES --All option combinations are accepted:
’cmbt -d trig1,trig2 -r trig1,trig2’
is a valid command
The cmbt command allows you to specify which of the internal trig1/trig2 trigger
signals will drive and/or receive the rear panel CMB (Coordinated Measurement
Bus) trigger. You can specify the signals individually, as an ORed condition for
drive, or as an ANDed condition for receive; or, you can specify that the signals are
not to be driven and/or received.
If no options are specified, the current setting of cmbt is displayed. Upon powerup,
cmbt is set to cmbt -d none -r none.
The parameters are as follows:
-d
Specifies that the rear panel CMB TRIGGER line drives the internal trigger signals,
trig1 and trig2.
-r
Specifies that the rear panel CMB receive the internal trigger signals, trig1 or trig2,
and send them out on the CMB TRIGGER line.
<dtype>
The valid drive options are:
<rtype>
trig1
When the CMB TRIGGER signal is received, drive trig1 signal.
trig2
When the CMB TRIGGER signal is received, drive trig2 signal.
none
When the CMB TRIGGER signal is received, drive neither
signal.
The valid receive options are:
trig1
When trig1 signal goes true, send out the CMB TRIGGER
signal.
227
Chapter 8: Commands
cmbt - specify control of the rear panel CMB trigger signal
trig2
When trig2 signal goes true, send out the CMB TRIGGER
signal.
none
Neither trig1 or trig2 will send the CMB TRIGGER signal out.
You use this command to trigger other HP 64700 analyzers. For example, you may
wish to start a trace on another HP 64700 analyzer when the analyzer in this
emulator finds its trigger; or, you may wish to do the opposite and trigger the
analyzer in this emulator when another emulation analyzer finds its trigger.
See Also
bc (break conditions; can be used to specify that the emulator will break into the
emulation monitor upon receipt of one of the trig1/trig2 signals)
bnct (BNC trigger; used to specify which internal signals will be driven or received
by the rear panel BNC connector)
cmb (Used to enable or disable interaction on the CMB. This does not affect
whether measurement instruments can exchange triggers over the CMB; it only
controls run/break interaction between multiple emulators)
tarm (analyzer trace arm; used to specify arming (begin to search for trigger)
conditions for the analyzer -- trig1/trig2 can be used to arm the analyzer)
tgout (specifies which of the trig1/trig2 signals are to be driven when the analyzer
trigger is found)
228
Chapter 8: Commands
cp - copy memory block from source to destination
cp - copy memory block from source to
destination
cp <dest_addr>=<addr>..<addr>
- copy range to destination address
The cp command allows you to copy a block of data from one region of memory to
another.
When cp is executed, the data from the specified range is copied to the destination
address, with the lower boundary data going to the destination address, lower
boundary + 1 to destination + 1, and so on until the upper boundary of the source
range is copied.
The parameters are as follows:
<dest_addr>
Specifies the lower boundary of the destination range.
<addr>
Specifies the lower, and possibly upper, memory address boundaries of the source
range to be copied. The default is a hexadecimal number; other bases may be
specified. You can use "<addr>.." to specify a range from the address through the
next 127 bytes.
If the source or destination addresses reside within the target system or single-port
emulation memory, the emulator will break to the monitor and will return to the
user program after the copy is completed.
If memory mapped as guarded is encountered in the source or destination range
during the copy, the command is aborted; however, all locations modified prior to
accessing guarded memory are left in the modified state.
See Also
m (allows you to display or modify memory locations or ranges)
map (used to define the type and location of memory used by the emulator)
ser (used to search memory ranges for a specific set of data values)
229
Chapter 8: Commands
demo - demo program
demo - demo program
demo - load demo program with symbols
This command loads the quick start demo program and its symbols for use with the
tutorial presented in the "Quick Start" chapter.
The demo command resets the processor, initializes all configuration items, and
defines a new memory map.
230
Chapter 8: Commands
dt - display or set current date and/or time
dt - display or set current date and/or time
dt
dt <yymmdd>
dt <hh:mm:ss>
dt <yymmdd> <hh:mm:ss>
-
display current date and time
set current date
set current time
set current date and time
The dt command allows you to set or display the current date and time stored by
the HP 64700 series emulators.
Note that the emulator system date & time clock is reset when power is cycled.
If no parameters are specified, the current date and time settings are displayed.
The parameters are as follows:
<yymmdd>
Current date in year, month, day format.
<hh:mm:ss>
Current time in hour:minute:second format.
Examples
To display the current date and time settings at emulator powerup:
M>dt
January 01, 1988
0:00:21
To set the date to August 18, 1987:
M>dt 870818
To set the date to August 18, 1987 and the time to 11:05:00 (the order of the two
arguments is not significant):
M>dt 870818 11:05:00
Note that if yy is greater than 50, the year is assumed to be in the 20th century (in
other words, 19yy). If yy is less than 50, the year is assumed to be in the 21st
century (in other words, 20yy).
231
Chapter 8: Commands
dump - upload processor memory in absolute file format
dump - upload processor memory in absolute file
format
dump
dump
dump
dump
dump
dump
dump
-i
-m
-t
-h
-b
-x
-c
<addr>..<addr> - upload intel hex format
<addr>..<addr> - upload motorola S-record format
<addr>..<addr> - upload extended tek hex format
<addr>..<addr> - upload hp format (requires transfer protocol)
<addr>..<addr> - send data in binary (valid with -h option)
<addr>..<addr> - send data in hex ascii (valid with -h option)
<hex char> <addr>..<addr> - after uploading a hex ascii
format file send this character
to close the file
The dump command allows a host interface program to dump the contents of
emulation and/or target system memory to a host file. The contents can be dumped
in HP, Tektronix hex, Intel hex, and Motorola S-record formats by specifying
various options on the command line.
When uploading the file in HP file format using the HP 64000 transfer software,
record checking is performed automatically by the transfer protocol.
The parameters are as follows:
-i
Specifies in Intel hex record format. Note that the various options for HP file
format transfer (such as -x, -b, and -e) are invalid with this format.
-m
Specifies the Motorola S-record format.
-t
Specifies the Tektronix extended hexadecimal format.
-h
Indicates that the memory contents will be dumped in HP absolute file format.
-b
Indicates that the records will be sent in binary; this is only valid with -h (HP file
format).
-x
The records will be sent in hexadecimal; this is only valid with the -h option (HP
file format).
-c <hex char>
Indicates that the ASCII hexadecimal character specified should be sent to the host
at the end of the file upload.
<addr>
Specifies the lower, then upper, address boundaries of the memory range to be
dumped. The default is a hexadecimal number; other bases may be supplied.
232
Chapter 8: Commands
dump - upload processor memory in absolute file format
Note that the HP 64000 format ".X" file created with a "dump -hx" command has
records that contain 136 fewer bytes of data than the file format standard allows.
Because of this, HP 64000 format ".X" files which are created with the dump
command may take longer to be processed by consumers of the ".X" file
(depending on how the consumer processes sequential records).
See Also
load (used to load emulation memory from a host computer file)
233
Chapter 8: Commands
echo - evaluate arguments and display results
echo - evaluate arguments and display results
echo "string"
echo ‘string‘
echo expression
- echo string to output
- echo string to output
- evaluate expression and display results in
hex
echo \<value>
- echo character equal to value
echo expression \<value> - multiple arguments may be evaluated
The echo command allows you to display ASCII strings or the results of evaluated
expressions on the standard output device. You must enclose strings in single open
quote marks (‘) (ASCII 60 hex) or double quotation marks (") (ASCII 22 hex). A
string not enclosed in delimiters will be evaluated as an expression and the result
will be echoed. In addition, you may supply a backslash with a two digit hex
constant; the corresponding ASCII character(s) will be echoed.
Echoing strings or ASCII characters is particularly useful within macros, command
files, and repeats where you wish to prompt the user to perform some action during
a "wait for any keystroke" command (see description for w). The expression
capability is useful as a quick calculator.
Note that all options may combined within the same echo command as long as they
are separated by spaces.
The parameters are as follows:
string
Any set of ASCII characters enclosed between single open quote marks (‘), or
double quotes ("). Since the command buffer is limited to 256 characters, the
maximum number of characters in a string is 248.
Note that many keyboards (and printers) represent the single open quote mark as an
accent grave mark. In any case, the correct character is ASCII 60 hexadecimal.
The correct double quote character is ASCII 22 hexadecimal.
Note that a character which is used as a delimiter cannot be used within the string.
For example, the string "Type "C"" is incorrect and will return an error. The
string ‘Type "C"‘ is correct.
expression
A valid expression. The expression will be evaluated and the result will be echoed.
<value>
Is the hex code for any valid ASCII character. More than one character can be
echoed with a single command; each "nn" must be preceded by a backslash. A total
of 62 ASCII characters can be represented within a single echo command.
234
Chapter 8: Commands
echo - evaluate arguments and display results
This capability is particularly useful for sending non-displaying control characters
to a terminal; refer to the examples below.
Examples
To echo the string "Set S1 to OFF" to the standard output, type the following:
M>echo "Set S1 to OFF"
Set S1 to OFF
A useful application of the backslash option is to send a terminal control characters:
M>echo \1b "H" \1b "J" \1b "&dBSet S1 to OFF"
The above command sends "<ESC>H<ESC>J<ESC>&dB Set S1 to OFF" to the
terminal. On an HP 2392A terminal this homes the cursor, clears the screen, sets
the video mode to inverse video, and writes the message "Set S1 to OFF".
Therefore, the user would see the message "Set S1 to OFF" in inverse video at the
upper left hand corner of an otherwise blank screen.
You might combine this with a macro command as part of a procedure. For
example, type:
M>mac PROMPT={echo "Set S1 to OFF";w}
M>PROMPT
You will see:
Set S1 to OFF
Waiting for any keystroke...
To calculate the value of the expression (1f + 1e), type:
M>echo 1f+1e
03dh
See Also
mac (grouping a set of commands under a label for later execution)
rep (grouping a set of commands for immediate repetition)
w (wait command, allows user specified delays)
235
Chapter 8: Commands
equ - define, display or delete equates
equ - define, display or delete equates
equ
equ
equ
equ
equ
equ
equ
name=<value>
name
-d name
-d *
*
name1=<value> name2
-
equate name to number or pattern
display named equate
delete named equate
delete all equates
list all equates
list all equates
multiple operands allowed
The equ command allows you to equate arithmetic values with names that you can
easily remember; these names can then be used in other commands to reference the
value.
A number of equates have been predefined for common analyzer status values. The
equates are present after the emulator is powered up or initialized.
The parameters are as follows:
name
A character string that names the equate to be displayed, deleted, or assigned a
value. The name must be an alphanumeric designator no greater than 31 characters
in length, beginning with an alpha character or underscore and including only
alphanumeric characters or underscores thereafter.
<value>
An arithmetic expression to be assigned to the equate name.
-d
Deletes the named.
Note that each equate is translated to its actual value at the time of command entry.
For example, if you specify an equate count=21h; and an expression start=2000h,
then the command tg addr=start count will be entered into the system as tg
addr=start 33. At this point, redefining the value of addr or count would not
change the address expression or the occurrence counter for the trigger.
Note that the combination of a single equ command with all names and expressions
cannot exceed 255 characters. The number of equates and symbols that may be
defined is limited only by available system memory; thus, it is dependent on the
number of equates, symbols, macros, etc. defined.
236
Chapter 8: Commands
equ - define, display or delete equates
See Also
tg, tpat, tif, telif, and others. (equ provides an easy way to name expressions to
use in setting up trigger or branch conditions)
r, m, bp (equates may be used to specify run addresses, memory addresses, or
breakpoint addresses)
237
Chapter 8: Commands
es - display current emulation system status
es - display current emulation system status
es
The es command displays the current status of emulation activity. The following
types of information may be displayed:
R - emulator in reset state
U - running user program
M - running monitor program
W - waiting for CMB to become ready
w - CPU in wait state
? - No monitor communication
c - no target system clock
r - target system reset active
h - processor halted
b - bus idle
g - bus granted
p - no target power
The emulator will not break to the monitor to obtain information. Therefore, any
information that can only be obtained while in the monitor will not be displayed if
the emulator is not in the monitor.
See Also
ta (allows you to display activity on emulation analyzer lines)
ts (allows you to display the current status of the emulation analyzer)
238
Chapter 8: Commands
<expr> - analyzer state qualifier expressions
<expr> - analyzer state qualifier expressions
In the easy configuration:
any/all
none/never
arm
<label>=<value>
<label>!=<value>
<label>=<value> and <label>=<value> ...
<label>!=<value> or <label>!=<value> ...
<label>=<value>..<value>
<label>!=<value>..<value>
-
always true set
always false set
external qualifier
define state qualifier
define state qualifier
state and state
state or state
define state range
define notstate range
In the complex configuration:
any/all
none/never
<set1>
<set2>
<set1> and <set2>
<set1> or <set2>
-
always true set
always false set
single set
single set
set global and set
set global or set
Analyzer state qualifier expressions are used in specifying triggers, time qualifiers,
primary and secondary branch conditions, prestore qualifiers, and other analyzer
setup items.
There are two types of analyzer expressions, simple and complex.
The parameters are as follows:
<label>
A trace label that is currently defined with the tlb command.
<value>
Values are numeric constants, equates, or symbols. Also, values can be the result
of constants, equates, and symbols combined with operators. Refer to the <value>
description.
<set1>
Consists of: p1, p2, p3, p4, r, !r. The pattern resources are assigned values with the
tpat command and the range resource is assigned a value with the trng command.
<set2>
Consists of: p5, p6, p7, p8, arm. The pattern resources are assigned values with the
tpat command. The "arm" keyword specifies the arm condition as specified in the
tarm command.
Resources within a set can be combined with intraset operators. Resources between
the two sets can be combined with the interset operators.
239
Chapter 8: Commands
<expr> - analyzer state qualifier expressions
Intraset Operators
You use intraset operators to form relational expressions between members of the
same set. The operators are:
~ (intraset logical NOR)
| (intraset logical OR)
The operators must remain the same throughout a given intraset expression.
Interset Operators
You use interset operators to form relational expressions between members of set 1
and set 2. The operators are:
and (interset logical AND)
or (interset logical OR)
You can then form the following types of expressions:
(set 1 expression) and (set 2 expression)
(set 1 expression) or (set 2 expression)
The order of sets does not matter:
(set 2 expression) and (set 1 expression)
Combining Intraset and Interset Operators
You can use both the intraset and interset operators to form very powerful
expressions. For example:
p1~p2 and p5|arm
p3 or p6~p7~p8
However, you cannot repeat different sets to extend the expression. The following
is invalid:
p1~p2 and p5 and p3 and p7
DeMorgan’s Theorem and Complex Expressions
At first glance, it seems that you only have a few operators to form logical
expressions. However, using the combination of the simple and complex
expression operators, along with a knowledge of DeMorgan’s Theorem, you can
240
Chapter 8: Commands
<expr> - analyzer state qualifier expressions
form virtually any expression you might need in setting up an analyzer
specification.
DeMorgan’s theorem in brief says that
A NOR B = (NOT A) AND (NOT B)
and
A NAND B = (NOT A) OR (NOT B)
The NOR function is provided as an intraset operator. However, the NAND
function is not provided directly. Suppose you wanted to set up an analyzer trace
of the condition
(addr=2000) NAND (data=23)
This can be done easily using the simple and complex expression capabilities.
First, you would define the simple expressions as the inverse of the values you
wanted to NAND:
tpat p1 addr!=2000
tpat p2 data!=23
Then you would OR these together using the intraset operators:
p1|p2
This is effectively the same as:
(NOT addr=2000) OR (NOT data=23) = (addr=2000) NAND (data=23)
If you need an intraset AND operator, you can use the same theory. Suppose you
actually wanted:
(addr=2000) AND (data=23)
First, define the simple expressions as the inverse values:
tpat p1 addr!=2000
tpat p2 data!=23
Then you would NOR these together using the intraset operators:
p1~p2
This is effectively the same as:
(NOT addr=2000) NOR (NOT data=23) = (addr=2000) AND (data=23)
Examples
Some easy configuration examples include:
tg addr=2000
241
Chapter 8: Commands
<expr> - analyzer state qualifier expressions
tif 1 data=20..30
telif addr!=3000 or data!=5
Some complex configuration examples include:
First, to assign values to pattern names:
tpat p1 addr=2000
tpat p2 addr!=3000
tpat p5 data!=5
trng data=20..30
Next, to create complex expressions within the analyzer commands:
tg p1
tif 1 r
telif 1 p2 or p5 3
To use intraset operators:
To store pattern 1 NOR pattern 2 NOR range:
tsto p1~p2~r
To trigger on pattern 2 OR (NOT range):
tg p2 | !r
242
Chapter 8: Commands
help, ? - display help information
help, ? - display help information
help <group>
help -s <group>
help <command>
help
-
print
print
print
print
help for desired group
short help for desired group
help for desired command
this help screen
The help (?) command lets you display syntax, description and examples for any
HP 64700 emulator Terminal Interface command. You may display a brief
description for anything from a single command to command groups or the entire
command set. Detailed information is available for single commands.
You may enter a question mark ? instead of typing help; it performs the same
function.
The parameters are as follows:
<group>
The valid group names are:
gram
System grammar.
proc
Processor specific grammar.
sys
System commands.
emul
Emulation commands.
trc
Analyzer trace commands.
*
All command groups.
-s
Switches to the abbreviated help mode; only the expanded name of each command
is displayed next to the command.
<command>
Detailed help information is displayed for the named command.
Note that if you specify "*" for <command> or <group>, information for all
commands will be displayed.
243
Chapter 8: Commands
init - reinitialize system
init - reinitialize system
init
init -c
init -p
init -r
- limited initialization; resets emulation and analysis
products
but not environment (macros, equates, date & time, etc..)
- complete initialization; does not run system memory
integrity tests
- powerup initialization; run from reset with complete
system verification tests
- powerup initialization; run from reset with complete
system verification tests
ignore all optional products
do not use flash ROM
The init command allows you to re-initialize the emulator. Powerup, complete, and
limited initializations are available through various options. In most cases you
should only use this command if the emulator is not responsive to other commands.
If no options are specified, a limited initialization sequence is performed. The
operating system and data communications are not affected but all of the emulation
and analysis boards are reset. For example, a limited initialization would not
change macro definitions, system date and time, or the data communications
parameters, but the emulation memory map and breakpoint list would be reset to
their default states.
The parameters are as follows:
-p
Specifies a powerup initialization sequence. This initializes the operating system,
data communications, emulation and analyzer boards, and runs extensive
performance verification.
-c
Specifies a complete initialization sequence. Everything is initialized as defined by
the powerup sequence with the exception of the performance verification.
-r
Specifies a complete initialization with system verification tests (as with -p), but
optional products and the flash ROM are ignored.
Note that the init -c, init -p, or init -r commands cause a loss of system memory.
If these commands are used in macros, commands that follow them will not be
executed.
See Also
244
cf (change emulation configuration)
Chapter 8: Commands
init - reinitialize system
dt (set system date and time)
map (define the emulation memory map)
stty (set data communications parameters)
tinit (reset the analyzer to powerup defaults)
245
Chapter 8: Commands
lan - set configuration parameters
lan - set configuration parameters
lan
lan
lan
lan
lan
lan
lan
-l
-b
-a
-i <ip_addr>
-g <ip_addr>
-p <port>
-
display the current lan configuration
startup lan if not already started
enable BNC
enable AUI
set Internet Protocol address
set Internet Protocol Gateway address
set TCP service port number
The parameters are as follows:
-l
Selects the LAN interface without having to change the HP 64700 configuration
switch settings. Note that the serial interface is always active.
-b
Selects the LAN interface’s BNC connector without having to change the
HP 64700 configuration switch settings.
-a
Selects the LAN interface’s AUI connector without having to change the HP 64700
configuration switch settings.
-i <ip_addr>
Internet Address in dot notation (for example, 192.6.94.2).
-g <ip_addr>
Gateway Address in dot notation (for example, 192.6.94.2).
-p <port>
Any number that is likely to be unused (for example, 6470).
246
Chapter 8: Commands
lanpv - performance verification on LAN interface
lanpv - performance verification on LAN interface
lanpv -b
lanpv -a
lanpv -v
- testing performed through BNC connector
- testing performed through AUI connector
- print the error code value
To run performance verification, the connector under test must be removed from
the network and capped with a terminator.
The parameters are as follows:
-b
Tests the LAN interface through its BNC connector.
-a
Tests the LAN interface through its 15-pin AUI connector.
-v
Prints the error code value. The error codes and their meanings are:
247
Chapter 8: Commands
load - download absolute file into processor memory space
load - download absolute file into processor
memory space
load
load
load
load
load
load
load
load
load
load
load
load
load
-i
-m
-t
-S
-h
-a
-e
-u
-f
-b
-x
-q
-p
-
download intel hex format
download motorola S-record format
download extended tek hex format
download symbol file
download hp format (requires transfer protocol)
reserved for internal hp use
write only to emulation memory
write only to target memory
download foreground monitor code
data sent in binary (valid with -h option)
data sent in hex ascii (valid with -h option)
quiet mode
record ACK/NAK protocol (valid with -imt options)
The load command lets you load program code into emulation or target memory.
Various file formats are supported via options to the load command. The
destination of the program code is determined by the information contained in the
program file. Additional options allow you to load only target memory or
emulation memory as desired.
If a load error occurs, the current load procedure is aborted. However, records
which were successfully loaded will remain in memory.
Note that at least one dash (-) must be included before any parameters are specified.
It is optional to include or omit dashes for succeeding parameters. At least one file
format option must be specified.
The parameters are as follows:
-i
Specifies that the program code will be in Intel hex file format.
-m
Specifies that the program code will be in Motorola S-record file format.
-t
Specifies that the program code will be in extended Tektronix hexadecimal file
format.
-h
Specifies that the program code will be in HP file format. In this case, the file is
expected to be transferred using the HP 64000 Hosted Development System
transfer protocol.
-e
Load only those portions of program code which would reside in memory mapped
to emulation memory space. (Refer to the map command.)
248
Chapter 8: Commands
load - download absolute file into processor memory space
-u
Load only those portions of program code which would reside in memory mapped
to target memory space. (Refer to the map command.)
-f
Download customized foreground monitor code into reserved block of memory.
(Refer to the cf mon command.)
-q
The program code will be transferred in quiet mode. If -q is not specified, the
emulator controller will write a "#" to stdout for each record successfully received
and processed.
S
This allows you to download a symbol file from the host computer into the
emulator.
-b
When using the HP file format, the program is expected to be in binary.
-x
When using the HP file format, the program is expected to be in hex.
-p
When using Intel, Motorola or Tektronix file formats, this option sets up a protocol
checking scheme using ASCII ACK/NAK characters. If using this option, the host
should send one record at a time and wait for the emulator to return an ASCII ACK
character between records. If the emulator returns an ASCII NAK instead, there
has been an error in data transmission. When the emulator receives the EOF
character, it will return only the normal emulator prompt since data transmission is
complete.
If, during the transfer, the host receives a NAK for a record, it should retransmit the
record until an ACK is received or until a timeout value is reached, whichever
occurs first.
Note that when you load an absolute file, the incoming data is examined for valid
records (in the specified format). If the data being sent does not contain any valid
records, the emulator will wait forever looking for valid records. The process must
be terminated be entering a <CTRL>c.
See Also
dump (allows you to transfer emulation memory contents to a host)
249
Chapter 8: Commands
m - display or modify processor memory space
m - display or modify processor memory space
m
m
m
m
m
m
m
m
m
<addr>
- display memory at address
-d<dtype> <addr>
- display memory at address with display option
<addr>..<addr>
- display memory in specified address range
-dm <addr>..<addr>
- display memory mnemonics in specified range
<addr>..
- display 128 byte block starting at address A
<addr>=<value>
- modify memory at address to <value>
-d<dtype> <addr>=<value>
- modify memory with display option
<addr>=<value>,<value>
- modify memory to data sequence
<addr>..<addr>=<value>,<value> - fill range with repeating sequence
The m command allows you to display and modify emulation and target system
memory. Options allow you to specify the display mode, specific address or
addresses for display or modification, and the data values to be inserted.
At least one address must be specified. If no display mode is specified the display
mode set by the mo command is used. Data items specified in memory
modification are repeated as a group to fill the address range specified. The
memory display defaults to the last value specified, or the default format for the
emulator in use upon powerup initialization (varies dependent on the
microprocessor being emulated).
If the selected address range for display or modification includes memory within
the user’s target system, emulator execution must break to the monitor in order to
perform the access. After the command is complete, the processor will be returned
to foreground execution if no errors occurred.
The parameters are as follows:
-d<dtype>
<addr>
250
The -d option allows you to set the display mode for memory accesses. The valid
display modes are:
b
display size is 1 byte(s)
s
display size is 2 byte(s)
w
display size is 4 byte(s)
m
display processor mnemonics
Specifies the address to be displayed or modified. As noted in the syntax, an
address followed by two periods and another address specifies a range of addresses
to display or modify. The address default representation is a hexadecimal number.
Chapter 8: Commands
m - display or modify processor memory space
<value>
Data value to which a particular location is to be modified. If a range of locations
is to be modified to a sequence of data values, the values must be separated by
commas. Note that data may be specified in decimal, octal, or binary in addition to
the hexadecimal default.
Note that the way the data item is handled depends on the display mode in effect.
For example, if the display mode is byte, and the value entered is 1a3f66, the
location specified will be modified to 66 hex. If the display mode is short, the
location will be modified to 3f66 hex. And if the display mode is word, the
location will be modified to 1a3f66.
Conversely, if you specify the value 33 hex for modification in byte mode, the
value 33 is entered; in word mode, the value 0033 is entered; in long word mode,
the value 000033 is entered. In other words, if the value supplied is shorter than the
mode in effect, it is padded with leading zeros.
See Also
map (specify mapping of memory to emulation or user memory and to RAM or
ROM)
mo (specify global access and display modes)
251
Chapter 8: Commands
mac - display, define, or delete current macros
mac - display, define, or delete current macros
mac
mac
mac
mac
mac
mac
mac
<name>
<name>={<cmd_list>}
-d <name>
-d *
-q
-v
-
display currently defined macros
display macro <name>
define macro <name> as list of commands
delete macro <name>
delete all macros
set expansion echo to quiet mode
set expansion echo to verbose mode
The mac command allows you to save a group of commands under a name of your
choice. This allows you to instantly recall that command group by typing in the
assigned name. The emulator will then preprocess the macro to expand the
commands stored in it to a normal command line. Then, the command line is then
executed.
The parameters are as follows:
-d
The -d parameter, in conjunction with the macro <NAME>, deletes the macro
defined by <NAME>. If <NAME> is given as the character "*" then all macros are
deleted.
<name>
This represents the name you assign to the macro definition. Names can be any
combination of alphanumeric characters; however, you cannot define a macro that
has a name identical to that of another HP 64700 Terminal Interface command.
If you specify a name which is the same as a currently defined macro, that macro
will be overwritten by the new macro you define.
<cmd_list>
This represents one or more emulator commands, including names which are used
to define other macros. Commands in <cmd_list> must be separated from other
commands by a semicolon (;).
When using command substitution, you can include pseudo-parameters in the form
of "&token&" in the macro definition. Do not include any white space between the
two "&" symbols. When you execute the macro, include the string to be substituted
for &token& as a parameter on the command line. The macro will execute using
the command expanded with the string you substituted.
-q
Sets the macro expansion echo to quiet mode. In this mode, any macro that you run
will be executed without displaying the expanded command string.
-v
Sets the macro expansion echo to verbose mode. In this mode, any macro that you
run will first display the expanded command string as a comment, and then will
execute the macro.
252
Chapter 8: Commands
mac - display, define, or delete current macros
Nested macro calls are permitted and limited only by constraints of system memory.
The commands within the macro definition are not checked for correct syntax until
the macro is executed; therefore, it is advisable to test the command string before
defining the macro.
The number of macros that can be created is limited to 100, but may be less
depending on the complexity of the macros defined.
The length of the macro name combined with the macro definition is limited only
by the maximum HP 64700 command length of 255 characters; thus, the macro
name and definition can be a maximum of 251 characters.
A command within a macro definition cannot contain the pound sign character (#)
unless the command is enclosed in a quoted string. (Otherwise, text following the #
is interpreted as a comment.) This means there can be no matching brace at the end
of the command. Use the echo command to place comments in a macro definition.
Command line substitution is possible when invoking a macro. During the macro
definition, you may include pseudo-parameters which allow you to substitute
parameters, such as file names, when invoking the macro.
See Also
rep (repeat; allows you to repeat any command, including macros)
253
Chapter 8: Commands
map - display or modify the processor memory map
map - display or modify the processor memory
map
map
map
map
map
map
- display current map structure
<addr>..<addr> <type> <attrib> - map address range as memory type
other <type>
- map other range as memory type
-d <term #>
- delete specified map term
-d *
- delete all map terms
Because the emulator can use target system memory or emulation memory (or
both), it is necessary to map ranges of memory so that the emulator knows where to
direct its accesses.
Up to 16 ranges of memory can be mapped, and the resolution of mapped ranges is
256 bytes (that is, the memory ranges must begin on 256 byte boundaries and must
be at least 256 bytes in length).
The parameters are as follows:
<addr>
Specifies the address range to be mapped.
other
Specifies unmapped address ranges. Only the trom, tram, or grd types can be
specified for unmapped memory. The "other" range is unaffected when all mapper
terms are deleted with the map -d * command.
<type>
The valid types are:
254
eram
Indicates that the given address range is to reside in emulation
address space and act as RAM (read/write).
erom
Indicates that the given address range resides in emulation
address space; it is to act as ROM (read only).
tram
Indicates that the given address range lies within target system
RAM space. When the emulation processor accesses an address
within this range, the target system data buffers will be enabled
by a mapper signal to complete the transaction.
trom
Indicates that the given address range lies within target system
ROM space.
Chapter 8: Commands
map - display or modify the processor memory map
grd
<attrib>
The grd parameter indicates the given address range is to be
"guarded". An emulation system break will be generated upon
accesses to guarded memory.
The valid attributes are:
dp
Dual-port emulation memory.
One emulation memory range, up to 4 Kbytes in length, can be
given the dp attribute. The dp attribute specifies that the range
be mapped to the 4 Kbyte block of dual-port emulation
memory. If a foreground monitor program is selected, the dp
attribute is automatically assigned to the memory range
reserved for the monitor program.
dsi
Interlock emulation memory and target system /DSACK.
The dsi attribute specifies that accesses in that range of
emulation memory be synchronized with the target system.
This means the termination of accesses in the range will not
occur until the target system provides a /DSACK. If the target
system does not generate a /DSACK, the emulator will be
unable to break into the monitor and a "CPU in wait state"
status will result.
When interlocking is disabled, accesses to emulation memory
will be terminated by a /DSACK signal generated by the
emulator. Any cycle termination signals generated by the target
system during emulation memory accesses, including /BERR,
will be ignored.
cs0
Use 68340 chip select 0.
The cs0 attribute allows you to emulate the 68340’s global chip
select operation. One memory range, either target or emulation,
can be given this attribute. Refer to the "To emulate global chip
select operation" task description in the "Using the Emulator"
chapter.
255
Chapter 8: Commands
map - display or modify the processor memory map
-d <term #>
Delete the mapped address range. The emulation system assigns a term number to
each mapped address range. Term numbers are assigned in ascending order of
address range.
When any map term is added or deleted the emulation processor will be reset and
held in the reset state until a break or run command is issued. The processor
remains reset in recognition of the fact that returning to execution directly after
mapper modification is most likely invalid.
Be sure to disable all software breakpoints (bc -d bp) before changing the map.
Software breakpoints are not cleared when the memory map is changed. After the
new map and the program are set up, you can re-enable the breakpoints break
condition (bc -e bp) and enter the bp -e * command to reenable the defined
software breakpoints.
Note that the memory mapper re-assigns blocks of emulation memory after the
insertion or deletion of mapper terms.
Note that if you map the same address range to different blocks of memory by
using function code specifiers, all further references to addresses in that range must
be fully specified with a function code. Otherwise, the emulator will return an
"Ambiguous address" error message.
See Also
bc (break conditions; determines whether emulator breaks to monitor upon write to
space mapped as ROM)
m (memory display/modify)
bp (set/delete software breakpoints)
256
Chapter 8: Commands
mo - set or display current default mode settings
mo - set or display current default mode settings
mo
mo -d<dtype>
mo -a<atype>
- display current mode settings
- set display mode to specified type
- set access mode to specified type
The mo command allows you to modify the global access and display modes.
Access mode is defined as the type of processor data cycles used by the emulation
monitor to access a portion of user memory. Display mode is defined as the
method used to display or modify data resident in memory.
The parameters are as follows:
-a<atype>
-d<dtype>
The -a option allows you to set the access mode. The valid access modes are:
d
the same as the display mode
b
byte, display size is 1 byte(s)
w
word, display size is 2 byte(s)
The -d option allows you to set the display mode. The valid display modes are:
b
byte, display size is 1 byte(s)
w
word, display size is 2 byte(s)
l
long, display size is 4 byte(s)
m
display processor mnemonics
At powerup or after init, the default access mode is set to b (byte), and the default
display mode is set to w word.
See Also
m (memory display/modify)
257
Chapter 8: Commands
po - set or display prompt
po - set or display prompt
po
- display the current port settings
po -p "string" - change the prompt string
The po command allows you to change the system prompt characters.
The parameters are as follows:
-p
Allows you to change the emulator’s command prompt to one specified by
<STRING>.
string
Any group of ASCII characters enclosed by single open quotes (‘) or double (")
quote marks.
258
Chapter 8: Commands
pv - execute the system performance verification diagnostics
pv - execute the system performance verification
diagnostics
pv
- display pv warning message
pv <repeat_count> - execute diagnostics <repeat_count> number of times
CAUTION
The pv command performs a system powerup initialization after all pv execution is
completed. Therefore, all equates, macros, memory map, configuration settings,
system clock, software breakpoints, trace specifications, and other configuration
items you have altered will be cleared.
The pv command runs performance verification on the emulator and analyzer. The
performance verification exercises all the emulator hardware and software to high
confidence level.
You should only run performance verification when the emulation probe is plugged
into the demo target system.
The parameters are as follows:
<repeat_count>
Specifies the number of times to repeat the performance verification.
If pv reports failures, first check your hardware installation as described in the
"Installation" chapter. If the failures persist, call your local HP Sales and Service
office for assistance. A list of offices is provided in the Support Services guide.
Note that providing multiple commands such as pv 1;r is invalid; the second
command will not execute due to the system reset.
Typing in <CTRL>c to abort the pv command may result in incorrect failure
messages.
See Also
init (reinitializes the emulator)
259
Chapter 8: Commands
r - run user code
r - run user code
r
r $
r <addr>
r rst
-
run
run
run
run
from
from
from
from
current Program Counter
current Program Counter
address <addr>
processor reset
The r command starts an emulation run. Execution begins at the address specified
by the <addr> parameter; if no address is specified, execution begins at the address
currently present in the program counter.
The parameters are as follows:
<addr>
Specifies the address where execution is to begin. If you specify $, the processor
runs from the current program counter value.
rst
Specifies that the emulation processor runs from reset.
See Also
s (step; allows controlled stepping through program instructions)
rx (run only when CMB (Coordinated Measurement Bus) execute pulse is received)
x (pulse the CMB execute line if resident on the CMB)
260
Chapter 8: Commands
reg - display and set registers
reg - display and set registers
reg
reg
reg
reg
reg
reg
- display all basic register contents
*
- display all basic register contents
<reg>
- display contents of the named reg
<regclass>
- display contents of the named reg class
<reg>=<value>
- modify contents of the named reg
<reg> <reg>=<value> <regclass>
- display and set may be combined
The reg command allows you to display and modify emulation processor register
contents. Individual registers may be displayed or modified; related groups of
registers may be displayed; combinations of display and modify are permitted on
the same command line.
The parameters are as follows:
<reg>
<regclass>
Refer to the following table.
<value>
A numeric value.
Register Class
Register
Description
*
pc
st
usp
ssp
d0 - d7
a0 - a7
vbr
sfc, dfc
Program Counter
Status Register
User Stack Pointer
Supervisor Stack Pointer
Data Registers 0 through 7
Address Registers 0 through 7
Vector Base Register
Alternate Function Code Registers
(General
Registers)
261
Chapter 8: Commands
reg - display and set registers
Register Class
Register
Description
sim
mbar
sim_mcr
syncr
avr
rsr
porta
ddra
ppara1
ppara2
portb
portb1
ddrb
pparb
swiv
sypcr
picr
pitr
swsr
cs0mask
cs0addr
cs1mask
cs1addr
cs2mask
cs2addr
cs3mask
cs3addr
Module Base Address Register
Module Configuration Register
Clock Synthesizer Control Register
Autovector Register
Reset Status Register
Port A Data
Port A Data Direction
Port A Pin Assignment 1
Port A Pin Assignment 2
Port B Data
Port B Data
Port B Data Direction
Port B Pin Assignment
Software Interrupt Vector
System Protection Control
Periodic Interrupt Control Register
Periodic Interrupt Timing Register
Software Service
Address Mask CS0
Base Address CS0
Address Mask CS1
Base Address CS1
Address Mask CS2
Base Address CS2
Address Mask CS3
Base Address CS3
dma_mcr1/2
intr1/2
ccr1/2
csr1/2
fcr1/2
sar1/2
dar1/2
btc1/2
Module Configuration Register
Interrupt Register
Channel Control Register
Channel Status Register
Function Code Register
Source Address Register
Destination Address Register
Byte Transfer Counter
(System
Integration
Module)
dma1/2
(DMA
Controller
Module
s1 and 2)
262
Chapter 8: Commands
reg - display and set registers
Register Class
Register
Description
serial
serial_mcr
ilr
ivr
mr1a
sra
csra
cra
rba
tba
ipcr
acr
isr
ier
mr1b
src
csrb
crb
rbb
tbb
ip
opcr
op_set
op_rst
mr2a
mr2b
Module Configuration Register
Interrupt Level
Interrupt Vector
Mode Register 1A
Status Register A
Clock-Select Register A
Command Register A
Receiver Buffer A
Transmitter Buffer A
Input Port Change Register
Auxiliary Control Register
Interrupt Status Register
Interrupt Enable Register
Mode Register 1B
Status Register B
Clock-Select Register B
Command Register B
Receiver Buffer B
Transmitter Buffer B
Input Port Register
Output Port Control Register
Output Port Bit Set
Output Port Bit Reset
Mode Register 2A
Mode Register 2B
timer_mcr1/2
ir1/2
cr1/2
sr1/2
cntr1/2
prel11/2
prel21/2
com1/2
Module Configuration Register
Interrupt Register
Control Register
Status/Prescaler Register
Counter Register
Preload 1 Register
Preload 2 Register
Compare Register
(Serial Module)
timer1/2
(Timer Modules
1
and 2)
263
Chapter 8: Commands
reg - display and set registers
Register Class
Register
Description
cf_sim
cf_mbar
cf_sim_mcr
cf_ppara1
cf_ppara2
cf_cs0mask
cf_cs0addr
cf_cs1mask
cf_cs1addr
cf_cs2mask
cf_cs2addr
cf_cs3mask
cf_cs3addr
Module Base Address Register
Module Configuration Register
Port A Pin Assignment 1
Port A Pin Assignment 2
Address Mask CS0
Base Address CS0
Address Mask CS1
Base Address CS1
Address Mask CS2
Base Address CS2
Address Mask CS3
Base Address CS3
(Emulator
Configuration
Registers)
See Also
264
s (step; allows you to step through program execution — combination with the reg
command is useful in debugging)
Chapter 8: Commands
rep - repeat execution of the command list multiple times
rep - repeat execution of the command list
multiple times
rep <value> {<cmd_list>}
rep 0 {<cmd_list>}
- execute the command list <value> number
of times
- execute the command list forever
<cmd_list> - list of valid commands separated by semicolons
The rep command allows you to repeat a group of commands and macros a
specified number of times.
No other command input will be accepted until the command group has executed
the indicated number of repetitions.
The parameters are as follows:
<value>
An integer value specifying how many times the command list should be executed.
A count of zero is a special case, meaning "repeat forever" (the repetition can be
terminated by entering <CTRL>c, which issues a break signal to the emulator).
<cmd_list>
Any valid HP 64700 command, including previously defined macros, may be
specified with the options appropriate to the command. The list of commands must
be preceded by an opening brace and followed by a closing brace. Also, the
commands must be separated by semicolons. The commands will be executed in
the same order as they are specified on the command line.
See Also
mac (allows assignment of a name to a command group for easy recall of a
specified command sequence)
265
Chapter 8: Commands
rst - reset emulation processor
rst - reset emulation processor
rst
rst -m
- reset and stay in reset state
- reset, then enter monitor
The rst command resets the emulation microprocessor. An option allows you to
specify that the emulator should enter the monitor immediately after the reset. If
-m is not specified, the emulation processor remains in the reset state. Note that
any commands which require the monitor for command processing will not execute
while the processor is in the reset state; these include commands such as reg.
Commands or hardware signals which will take the emulator out of a reset state
include b, r, s, and the CMB /EXECUTE pulse.
The parameters are as follows:
-m
266
Causes the emulator to enter the monitor immediately after the reset.
Chapter 8: Commands
rx - run at CMB-execute
rx - run at CMB-execute
rx
rx $
rx <addr>
- display run-at-CMB-execute address
- when CMB-execute occurs, use the PC value at that time
- set run-at-CMB-execute address
The rx command allows you to set the starting address for synchronous CMB
(Coordinated Measurement Bus) execution.
The parameters are as follows:
<addr>
Specifies where to start program execution when the CMB EXECUTE pulse is
detected. If $ is specified for address, the current program counter value is used
(default).
If the HP 64700 emulator is connected to the CMB, and the CMB-EXECUTE pulse
is detected, followed by the CMB-READY line in the true state, the emulator will
begin execution at the address specified by the rx command. If no rx command
has been issued, execution begins at the current program counter value (same as rx
$).
Execution will begin at the address specified by rx every time the conditions listed
above are met. For example, if you type the command rx 100, the emulator will
start executing at address 100 hex every time the CMB-EXECUTE line is pulsed.
The rx command automatically turns on CMB interaction by effectively
performing the equivalent of a cmb -e command whether or not you have done so.
See Also
cmb (enables or disables CMB interaction)
x (initiates a synchronous CMB interaction by pulsing the CMB-EXECUTE line)
267
Chapter 8: Commands
s - step emulation processor
s - step emulation processor
s
s
s
s
s
s
<count>
<count> $
<count> <addr>
-q <count> <addr>
-w <count> <addr>
-
step
step
step
step
step
step
one from current PC
<count> from current
<count> from current
<count> from <addr>
<count> from <addr>,
<count> from <addr>,
PC
PC
quiet mode
whisper mode
The s command allows you to single-step the emulation processor through a
program. You can specify the number of steps to execute at a single time; or, you
can direct the emulator to step continuously. In addition, you may specify the
starting address for stepping.
The parameters are as follows:
<count>
Specifies the number of steps to execute in sequence before returning command
control.
The default base for <decimal> is decimal; however, other number bases may be
specified.
If you do not specify a value for <count>, then a value of one (1) is assumed. If
you specify a step count of zero (0), the emulator interprets this as "step
continuously". Continuous stepping can be aborted with the <CTRL>c command;
or, it will be terminated upon receipt of an emulation break condition such as a
write-to ROM.
<addr>
Specifies the starting address for stepping. If you substitute $ for the <addr>
parameter, the current program counter value will be used as the <addr> value. The
same will occur if no address parameter is specified.
Note that if you specify a value for <addr>, then you must specify a value for
<count>. Otherwise, the address value will be interpreted as a step count; the
emulator will step the number of locations specified.
-q
Stepping will occur in quiet mode; that is, the instructions and program counter are
not displayed upon execution of each step.
-w
Stepping will be done in whisper mode; only the final program counter value is
displayed after the step is executed.
268
Chapter 8: Commands
s - step emulation processor
If the emulator was in the run state (U> prompt) executing a user program when
you request the step, it will break to the monitor before executing the step.
Note that when the Coordinated Measurement Bus (CMB) is being actively
controlled by another emulator, the step command (s) does not work correctly. The
emulator may end up running in user code (NOT stepping). Disable CMB
interaction (cmb -d) while stepping the processor.
See Also
r (run emulation processor from a specified address)
reg (view or modify processor register contents)
269
Chapter 8: Commands
ser - search through processor memory for specified data
ser - search through processor memory for
specified data
ser <addr>..<addr>=<value>
- search for data value in range
ser -d<dtype> <addr>..<addr>=<value> - search with display option
ser <addr>..<addr>=<value>,<value>
- search for data sequence in
range
ser <addr>..<addr>="CDE"
- search for string "CDE" in
range
The ser command allows you to search memory for a data value, a character string,
or a combination of both. For every pattern match, the starting address of the
match is displayed.
Using the -d (display mode) option, the method of interpreting the pattern supplied
by the user can be altered. If no option is given, the display mode used is taken
from global default set by the mo command.
The parameters are as follows:
<addr>
Specifies first the lower, and possibly the upper, address boundaries of the memory
range to search for the given data pattern. You can use "<addr>.." to specify the
range from the address through the next 127 bytes.
<value>
Either a numeric expression or a string to be used as a reference pattern in the
search.
Strings must be bounded by single open quote marks (‘) or double quotes (").
Note that many keyboards (and printers) represent the single open quote mark as an
accent grave mark. In any case, the correct character is ASCII 60 hexadecimal.
The correct double quote character is ASCII 22 hexadecimal.
Note that if the character string you are searching for contains double quotes, you
must delimit the string with single open quotes and vice versa. For example, the
string "Type "C"" will return an error; the string ‘Type "C"‘ is correct.
-d<dtype>
270
Allows you to specify the display mode used for the search. The valid display
modes are:
b
display size is 1 byte(s)
s
display size is 2 byte(s)
Chapter 8: Commands
ser - search through processor memory for specified data
w
display size is 4 byte(s)
If addresses specified in the search reside in target system memory, the emulator is
broken to the monitor and returned to the user program when the command is
completed.
Note that you can concatenate various combinations of values to form more
complex search patterns by separating the parameters with commas (,).
See Also
cp (used to copy the contents of one memory range to another)
m (used to display/modify memory locations)
271
Chapter 8: Commands
stty - set or display current communications settings
stty - set or display current communications
settings
stty <port> <options>
Parameter
<options>
Parity
noparity, evenp, onep, zerop
Character Size
cs7, cs8
Baud
300, 1200, 2400, 4800, 9600, 19200, 38400,
57600, 115200, 230400, 460800
Protocol
rs232, rs422
Stop Bits
1stopb, 2stopb
Request/Clear to Send
crts, -crts
Data Set/Terminal Rdy
cdsr, -cdsr
Start/Stop
xon, -xon
Line Terminator
onlcr, ocrnl, ocr, onl
Echo
echo, -echo
Data Term/Comm Equip
dte, dce
The stty command allows you to modify the parameters of the serial data
communications port without changing the configuration switch settings.
The serial port, port A, may be modified by stty.
The powerup default configuration for the serial port are determined by the rear
panel configuration switches; refer to the "Installation" chapter for more
information.
The parameters are as follows:
272
Chapter 8: Commands
stty - set or display current communications settings
rs232
rs422
RS-422 utilizes balanced transmission lines and therefore can achieve much higher
data rates with reliability over long distances than RS-232. Otherwise, the
interfaces are similar.
dte
dce
The serial port may be set to operate either as Data Communications Equipment
(DCE) or as Data Terminal Equipment (DTE). This configures the handshake lines
and transmit/receive lines for the proper signal to pin relationships on the interface.
onlcr
Generate new-line and carriage-return on output.
ocrnl
Generate carriage-return and new-line on output.
ocr
Generate carriage-return on output.
onl
Generate new-line on output.
crts
-crts
The option crts enables the Request To Send/Clear To Send handshake. Specifying
-crts disables this handshake.
cdsr
-cdsr
The option cdsr enables exchange and recognition of the Data Set Ready/Data
Terminal Ready status lines. Specifying -cdsr disables the exchange.
xon
-xon
If you specify xon, the system generates XON/XOFF (DC1/DC3 characters)
software handshaking to control the amount of data received at a given time.
Specifying -xon disables this handshake sequence.
(When the emulator’s receive buffer is full, it will send a DC3 (XOFF) character to
the host to stop transmission; when it is ready for more data, it will send a DC1
(XON) character to restart transmission.)
Note that if you toggle the xon parameter when running at 1200 baud and below,
the stty command will return invalid characters. The PC Interface attempts to do
this when starting up and fails with a datacomm error. To get around this problem,
set switch 13 on the emulator’s back panel (enable xon) to allow the PC Interface to
start up successfully. In the Terminal Interface, just enter another carriage return to
regain proper communications.
echo
-echo
If you specify echo, all characters received by the emulator datacomm are echoed
back to the sending system. Specifying -echo means the system will not echo back
characters received.
You will normally use this in conjunction with the echo settings required by your
host computer and your terminal. Most Hewlett-Packard systems will require that
you enable the echo feature, as HP host computers automatically echo characters
back to data terminal devices.
273
Chapter 8: Commands
stty - set or display current communications settings
For further information on the meanings of various data communications
parameters, you may refer to the book entitled Touring Datacomm: A Data
Communications Primer. This book is orderable from HP’s Direct Marketing
Division under the part number 5957-4622. Another book which may be helpful is
The RS-232 Solution, orderable from HP under the product number 92234X. You
also may need to refer to the hardware and software reference manuals that are
supplied with your terminal and/or host computer for further information on
required data communications parameters for links to those devices.
Examples
To display the current data communications settings:
M>stty
stty A 9600 cs8 1stopb noparity dce rs232 -crts cdsr -xon onlcr echo
To set the baud rate to 1200 baud:
M>stty 1200
M>stty
stty A 1200 cs8 1stopb noparity dce rs232 -crts cdsr -xon onlcr echo
274
Chapter 8: Commands
sym - define, display or delete symbols
sym - define, display or delete symbols
sym
sym
sym
sym
sym
sym
sym
sym
sym
sym
sym
sym
<name>
-g <name>
-u <name>
-l
-l <name>
<name>=<addr>
-d
-du
-du <name>
-dg
-dl
-dl <name>
-
display all or named symbols
display all or named global symbol
display all or named user symbol
display all local modules
display symbols in local module
define user symbol
delete all symbols
delete all user symbols
delete named user symbol
delete all global symbols
delete all local symbols in all modules
delete all local symbols in module
The sym command defines, displays, or deletes symbols in the emulator. The sym
command without any parameters displays all of the symbols currently defined.
Three types of symbols are supported: global, local, and user. Global symbols
reference addresses anywhere in memory using an absolute reference. Local
symbols also use absolute addressing but are grouped within a "module." User
symbols are defined at the command line. Global and local symbols cannot be
defined at the command line.
The definition of a module for grouping local symbols depends on the environment
being used. For local symbols created by a high-level language, a module might be
a function, a procedure, or a separately compilable source file. When you define
local symbols through the use of a symbol file, a module, in effect, becomes a
technique to manage the symbols. It can be a mnemonic device to refer to modules,
or it can be a simple way to group local symbols into a set for display and deletion
purposes since the sym command facilitates manipulation of local symbols by their
module name.
Symbols are used like equated variables. When using symbols in expressions, only
the + and - operators can be used immediately before and after the symbol name.
The expression can contain literals and equated (equ) labels, but not other symbols.
When using symbols, if a symbol and an equated value have the same name, the
equated value will be used.
The symbol table can be updated in three ways:
•
You can enter user symbols at the command line.
•
You can update it from an external "symbol file" using the load -So command.
275
Chapter 8: Commands
sym - define, display or delete symbols
•
You can load an absolute file (such as an IEEE-695 file) which can contain
symbols as well as program code.
A "symbol file" is a text file containing user-specified symbols.
The parameters are as follows:
<name>
This represents the symbol label to be defined or referenced. The format of the
symbol name reference is determined by the type of symbol, where:
name
Is a user symbol or module name.
:name
Is a global symbol name.
name:
Is a local module name.
module:name
Is a symbol name in a local module.
In addition, symbols can be referenced using a "wild card" expression when
displaying and deleting names. Only one wildcard character can appear in a
symbol name. An asterisk ("*") character is used to represent zero or more
characters at the end of a symbol name. A wildcard can be used in any of the
following symbol types:
name*
Represents a user symbol name followed by zero or more of
any character or characters.
:name*
Represents a global symbol name followed by zero or more of
any character or characters.
module:name*
Represents a local module:symbol followed by zero or more of
any character or characters.
<addr>
Specifies the value to assign to a user symbol.
-d
Deletes all symbols.
-du
Deletes user symbols. If a <name> parameter is not included, all user symbols are
deleted. If a <name> parameter is included, only user symbols matching the
entered name are deleted.
-dg
Deletes all global symbols. No option exists to delete one global symbol.
276
Chapter 8: Commands
sym - define, display or delete symbols
-dl
Deletes local symbols in a module. If a <name> parameter is not included, all local
symbols are deleted for all modules. If a <name> parameter is included to specify a
module name, only local symbols in the module matching the entered name are
deleted.
-g
Specifies the display of global symbols. If a <name> parameter is not included, all
global symbols are displayed. If a <name> parameter is included, only global
symbols matching the entered name are displayed.
-l
This option allows you to display local modules and symbols. If a <name>
parameter is not included, all local modules are displayed. If a <name> parameter is
included, only local symbols matching the symbol name or module are displayed.
-u
This option allows you to display user symbols. If a <name> parameter is not
included, all user symbols are displayed. If a <name> parameter is included, only
user symbols matching the entered name are displayed.
See Also
equ (used to equate names to expressions)
load (used to load a program file with symbols, or a symbol text file)
277
Chapter 8: Commands
sync - synchronize emulator
sync - synchronize emulator
sync sim
sync cf
sync diff
- sync cf_sim registers to M68340 sim registers
- sync M68340 sim registers to cf_sim registers
- show differences for M68340 and cf_sim registers
The sync command synchronizes the 68340’s system integration module (SIM)
registers to the emulator’s cf_sim registers.
The parameters are as follows:
sim
Copies the 68340 SIM registers into the emulator’s cf_sim registers.
cf
Copies the emulator’s cf_sim registers into the 68340 SIM registers.
diff
Displays the differences between the 68340 SIM registers and the emulator’s
cf_sim registers.
See Also
reg (view or modify processor register contents)
278
Chapter 8: Commands
t - start a trace
t - start a trace
t - start an emulation trace
The t command starts an emulation traces. This command (or tx if making a
synchronous CMB execution) must be entered to actually begin a measurement;
most other trace commands are used only for specification of triggering, sequencer,
and storage parameters; or to display trace results or status.
See Also
r (starts a user program run; normally will be specified after entering the t
command)
th (halts a trace in process)
ts (allows you to determine the current status of the emulation analyzer)
tx (specifies whether a trace is to begin upon start of CMB execution)
x (begins synchronous CMB execution)
279
Chapter 8: Commands
ta - current status of analyzer signals is displayed
ta - current status of analyzer signals is displayed
ta
The ta command allows you to display the activity on each of the analyzer input
lines. Each signal may be low (0), high (1), or moving (?).
Each pod (group of 16 lines) is displayed on a single line with bit 0 (LSB) at the far
right and bit 15 (MSB) on the far left.
280
Chapter 8: Commands
tarm - specify the arm condition
tarm - specify the arm condition
tarm
<signal>
- arm the emulation analyzer
The tarm command allows you to specify an arming condition for the emulation
analyzer. You can specify the arm condition as the assertion of the trig1 or trig2
signals or as tarm always.
The trig1 or trig2 signals can be asserted from many sources including the analyzer
itself or the rear panel BNC connector or the CMB. See bnct, cmbt, and tgout for
examples.
The arm condition may be used in specifying the analyzer trigger or in specifying
branch conditions for the sequencer, as well as count or prestore qualifiers.
If no parameters are supplied, the current tarm condition is displayed. The default
setting after powerup or tinit is tarm always.
The parameters are as follows:
=trig1
The assertion of the trig1 signal will arm the analyzer.
=trig2
The assertion of the trig2 signal will arm the analyzer.
!=trig1
If the trig1 signal is asserted when the analyzer is started, the analyzer can never be
armed.
If the trig1 signal is not asserted when the analyzer is started, the analyzer is armed
immediately.
!=trig2
If the trig2 signal is asserted when the analyzer is started, the analyzer can never be
armed.
If the trig2 signal is not asserted when the analyzer is started, the analyzer is armed
immediately.
always
The analyzer is always armed.
See Also
bc (can be used to cause the emulator to break to the monitor upon receipt of the
trig1 and/or trig2 signals)
bnct (used to define connections between the internal trig1 and trig2 signals and the
rear panel BNC connector)
281
Chapter 8: Commands
tarm - specify the arm condition
cmbt (used to define connections between the internal trig1 and trig2 signals and
the CMB trigger signal)
tgout (defines whether or not the trig1 or trig2 signals are driven when the analyzer
finds the trigger state)
282
Chapter 8: Commands
tcf - set or display trace configuration
tcf - set or display trace configuration
tcf
tcf -c
tcf -e
- display trace configuration
- set complex trace configuration
- set easy trace configuration
The tcf command is used to set the configuration for the emulation analyzer. There
are two possible configurations for the analyzer, an easy configuration (tcf -e) and a
complex configuration (tcf -c).
The easy configuration hides some of the complexity of the analyzer sequencer and
makes it easy to use. The complex configuration gives you greater capability when
using the sequencer and gives you greater flexibility when using expressions to
qualify states.
In the easy configuration, you can insert up to five sequence terms in the sequencer.
The branch out of the last sequence term constitutes the trigger.
In the complex configuration, there are always eight terms in the sequencer. Any
of the sequence terms except the first may be specified as the trigger term. Entry
into the trigger term constitutes the trigger.
In the complex configuration, up to eight pattern resources and one range resource
may be used in trace commands wherever state qualifier expressions are used in the
easy configuration. These patterns are grouped in to sets and may be combined with
set operators to specify more complex qualifiers.
If no parameters are supplied, the current analyzer configuration is displayed. After
powerup or tinit, the default analyzer configuration is tcf -e.
The parameters are as follows:
-e
Sets the analyzer to the easy configuration.
-c
Sets the analyzer to the complex configuration.
See Also
tarm (used to set the analyzer arm specification; this specification can only be used
in analyzer expressions in complex configuration)
telif (sets the global restart in easy configuration, secondary branch condition in
complex configuration)
tg (used to set a trigger expression in either analyzer configuration)
283
Chapter 8: Commands
tcf - set or display trace configuration
tif (sets primary branch specification in either analyzer configuration)
tpat (used to label complex analyzer expressions with a pattern name; the pattern
name is then used by the analyzer setup commands. Only valid in complex
configuration)
tpq (specifies trace prestore qualifier in either analyzer configuration)
trng (defines a range of values to be used in complex analyzer expressions)
tsto (specifies a qualifier to be used when storing analyzer states)
tsq (used to modify the trace sequencer’s number of terms and trigger term)
284
Chapter 8: Commands
tck - set or display clock specification for the analyzer
tck - set or display clock specification for the
analyzer
tck
tck
tck
tck
tck
tck
tck
tck
-r
-f
-x
-l
-h
-b
-u
-s
<clock>
<clock>
<clock>
<clock>
<clock>
<speed>
-
clock analyzer on rising edge of clock
clock analyzer on falling edge of clock
clock analyzer on either edge of clock
qualify on low level of clock
qualify on high level of clock
qualify when emulation in background
qualify when emulation in user
define the clock speed
The tck command allows specification of clock qualifiers and master edges of the
master clocks used for the emulation analyzer.
The tck command is included with the system for the purpose of internal system
initialization and system control through high-level software interfaces.
You should ONLY use the tck command when you wish to trace background
execution. In other words, do not change the the "tck -r L" setting.
The parameters are as follows:
<clock>
Three clock signals are defined: L, M, and N.
The L, M, and N clocks are generated by the emulator. The L clock is the
emulation clock derived by the emulator, the N clock is used as a qualifier to
provide the user/background tracing options (-u and -b) to tck, and the M clock is
not used.
r
The analyzer is clocked on the rising edge of the indicated clock signal.
f
The analyzer is clocked on the falling edge of the indicated clock signal.
x
The analyzer is clocked on both the rising and falling edges of the indicated clock
signal.
l
Qualifies the analyzer clock so that the analyzer is only clocked when this clock
signal is low (less positive/more negative voltage).
h
Qualifies the analyzer clock so that the analyzer is only clocked when this clock
signal is high (more positive/less negative voltage).
-b
The analyzer is only clocked when the emulator is executing in background (in
other words, the background monitor).
285
Chapter 8: Commands
tck - set or display clock specification for the analyzer
-u
The analyzer is only clocked when the emulator is executing in foreground (in other
words, the user program or foreground monitor). This is the default.
-s <speed>
Specifies the maximum qualified clock speed. The <speed> parameter can be:
S
SLOW, less than or equal to 16 MHz.
F
FAST, between 16 MHz and 20 MHz.
VF
VERY FAST, between 20 MHz and 25 MHz.
Changing the clock speed affects the tcq command parameters. When speed is set
to S (slow), the tcq command may either count states or time. When speed is set to
F (fast), the tcq command may be used to count states but not time. If clock speed
is set to VF (very fast), tcq cannot count either state or time and should be set to
tcq none.
If no parameters are specified, the current clock definitions are displayed. After
powerup or tinit, the -u option is always set.
When several clock edges are specified with the -r, -f, or -x options, any one of the
edges clocks the given trace. If several qualifiers are specified with the -l or -h
options, they are ORed so that the trace is clocked when any of the qualifiers are
met.
Note that the -u and -b qualifiers are ORed with all of the other qualifiers specified.
See Also
tcq (specifies the trace count qualifier as states, time, or none. The maximum
qualified clock speed set by tck -s affect which tcq parameters are valid.)
tsck (used to define slave clock signals used by the analyzer; tck defines the master
clock signals. Default mode for tsck is off on all pods.)
286
Chapter 8: Commands
tcq - set or display the count qualifier specification
tcq - set or display the count qualifier
specification
tcq
tcq time
tcq <expr>
- display count qualifier specification
- define count on time
- define count on state
The tcq command allows you to specify a qualifier for the emulation trace tag
counter.
When the tag counter is active, the analyzer counts occurrences of the expression
you specify (which may include simple or complex expressions (depending on
analyzer configuration), time, or none). Each time a trace state is stored, the value
of the counter is also stored and the counter is reset. The tag counter shares trace
memory with stored states, so only half as many states can be captured by the
analyzer when the tag counter is active. (The analyzer can store 1024 states with
tcq none, 512 states otherwise.)
If no parameters are given, the current count qualifier is displayed. Upon powerup
or after tinit initialization, the clock qualifier defaults to the state tcq time.
The parameters are as follows:
time
If you specify time rather than an analyzer expression, the trace tag counter
measures the amount of time between stored states.
Note that the tcq time qualifier is only available when the analyzer clock speed is
set to the slow (S) speed setting (default). If the clock speed is set to very fast
(VF), then trace tag counting must be turned off by specifying tcq none. Refer to
the tck command (analyzer clock specification) for further information.
<expr>
State qualifier expression. Refer to the <expr> description in this chapter.
Note that the count qualifier tcq arm is not permitted in any configuration.
See Also
tck (used to specify the clock source and clock parameters for the analyzer)
tp (specifies position of the trigger within the trace; note that tcq affects the
number of states the analyzer can store and therefore may affect trigger positioning)
tpat (assigns analyzer expressions to pattern names in complex configuration; the
pattern names are then used to specify qualifiers in other analyzer commands such
as tcq)
287
Chapter 8: Commands
tcq - set or display the count qualifier specification
trng (specifies a range of values to be used as a complex mode qualifier; this range
definition can be used as a count qualifier by tcq)
tsq (used to manipulate the trace sequencer)
288
Chapter 8: Commands
telif - set or display secondary branch specification
telif - set or display secondary branch
specification
In the easy configuration:
telif
telif <expr>
- display global restart specification
- define global restart specification
In the complex configuration:
telif
telif X
telif X <expr>
telif X <expr> Y
-
display all secondary branch specifications
display secondary branch specification X
define secondary branch specification X
secondary branch X will jump to Y (default next
term)
The telif command allows you to set the global restart qualifier (in easy
configuration) for the emulation analyzer sequencer. In complex configuration,
telif lets you set the secondary branch qualifier for each term of the emulation
analyzer sequencer.
Note that the telif command is used as a global restart qualifier in easy
configuration and a secondary branch qualifier in complex configuration. The
hierarchy of the tif and telif commands is such that either branch will be taken if
found before the other; however, if both branches are found simultaneously, the tif
branch is always taken over the telif branch.
When in easy configuration, the sequencer will restart by jumping to sequencer
term number one (1) when the expression specified by telif occurs.
When in complex configuration, the sequencer will branch to the sequencer level
specified by the Y parameter when the expression specified is found. There are
always eight sequencer terms available. Position of the trigger term is defined with
the tsq command. If both the tif and telif expressions are satisfied simultaneously,
the tif branch is taken; otherwise, branching occurs according to which expression
is first satisfied.
The parameters are as follows:
<expr>
State qualifier expression. Refer to the <expr> description in this chapter.
X
Specifies a sequence term number to associate with the given <expr>. When you
associate a term number with a complex expression, that expression is only used as
a secondary branch qualifier at the sequencer level specified by the term number. If
289
Chapter 8: Commands
telif - set or display secondary branch specification
you specify X without an expression, the secondary branch qualifier currently
associated with that term number is displayed.
Y
Specifies the branch destination when <expr> is found. For example, if you wish to
have the sequencer branch from term 1 to term 3 after the expression is found you
would be specified as telif 1 <expr> 3. If you do not specify a term number, the
default is to increment the sequencer level (telif X <expr> (X+1)).
If telif is entered with no parameters, the global restart qualifier or secondary
branch qualifiers (depending on analyzer configuration) for all sequencer levels are
displayed. If telif is entered with only an X parameter in complex configuration,
the secondary branch qualifier for only that term number is displayed.
Upon initialization via a powerup sequence or the tinit command, the secondary
branch specifiers are set to telif never.
Note that the default branch to condition for sequence term 8 is 8; that is, branch to
the same term.
Note that if the tif expression for the given sequence term X has a <count>
parameter other than one (1), the counter is reset to zero (0) if the telif branch is
taken before the occurrence counter parameter is satisfied. For example, if the tif
counter parameter is 7, and the tif expression has been found 5 times, then the telif
expression is satisfied, the telif branch will be taken and the tif counter will be reset
from 5 to 0. This might cause you difficulty if you happen to have telif branching
back to the same term; your occurrence condition may or may not be satisfied.
See Also
tarm (allows you to specify that the trig1 or trig2 signal will arm the analyzer.
This arm condition can then be used as part of the secondary branch qualifier)
tcf (used to select whether the analyzer is operated in easy configuration or
complex configuration)
tif (used to specify a primary branch specification for the analyzer)
tg (used to set up a simple trigger qualifier in either analyzer configuration.
Specifying the tg command overrides the current sequencer specification and will
modify the existing telif qualifier stored in sequence term number 1)
tpat (used to assign pattern names to simple expressions for use in specifying
complex expressions. These complex expressions are used to specify telif
qualifiers in analyzer complex configuration)
290
Chapter 8: Commands
telif - set or display secondary branch specification
trng (used to set up an expression which assigns a range of values to a range
variable. This range information may be used in specifying complex telif qualifiers)
tsto (specifies a global trace storage qualifier in both easy & complex
configurations; also specifies a trace storage qualifier for each sequencer term in
complex configuration. Used to control the types of information stored by the
analyzer)
tsq (used to manipulate the trace sequencer)
291
Chapter 8: Commands
tf - specify trace display format
tf - specify trace display format
tf
tf
tf
tf
tf
tf
tf
tf
- display current format
<label>,<base>
- display the label in the specified base
mne
- disassembled mnemonic
count
- count, absolute (relative to trigger)
count,a
- count, absolute (relative to trigger)
count,r
- count, relative to preceding state
seq
- sequencer state change
mne <label>,<base> count count,r seq
- multiple fields may be specified
tf addr,H mne count,r seq - default format
tf addr,<base>,<width>
- column width (addr column only)
The tf command allows you to specify which pieces of information from the
emulation analyzer trace will be displayed by tl (trace list) commands. Each label
represents a column in the trace list display.
The parameters are as follows:
<label>
A label defined with the tlb command. The analyzer bits associated with that label
will be displayed in a column of the trace listing.
<base>
Specifies the numeric base in which <label> is to be displayed. The choices are Y
(binary), Q or O (octal), T (decimal), H (hexadecimal), or A (ASCII). The
specifiers are not case sensitive. In ASCII mode, non printing characters are
displayed as periods (.). If <base> is not specified, the default base is hexadecimal.
mne
Displays mnemonic information about a state. Depending on the trace list
disassembler options (see tl -o), disassembled instructions may be displayed in this
column. To ensure correct operation of mne, the predefined labels addr, data, and
stat must not be redefined.
count
count,a
Absolute time counts are displayed. That is, the the time shown for each state is
relative to the trigger state.
count,r
Relative time counts are displayed. That is, the time count shown for each state is
relative to the previous state.
seq
If you specify seq, a "+" is displayed in the seq column for each state that causes
the sequencer to branch from one term to another.
<width>
This option allows you to set the width of the column for the "addr" predefined
trace label to values from 4 to 50. A wider address field is useful when displaying
symbols in the trace list.
292
Chapter 8: Commands
tf - specify trace display format
The minimum width is really defined by the base of the "addr" column. For
example, if the 32-bit address is displayed in binary, the minimum width is 32.
Note that changing the trace format DOES NOT change the type of information
captured by the analyzer; it only specifies how the captured data should be
displayed.
See Also
tl (displays the current data in emulation trace memory according to the
specifications set up by tf)
tlb (define labels which represent groups of emulation analyzer input lines; these
labels may be used to create special trace list displays by including the labels in the
tf definition)
293
Chapter 8: Commands
tg - set and display trigger condition
tg - set and display trigger condition
tg
tg <expr>
tg <expr> <count>
- display sequence term 1 primary branch
- define trigger
- define trigger and occurrence count
The tg command sets a trigger condition for the emulation analyzer. When the
expression specified occurs the number of times specified, the analyzer triggers.
The parameters are as follows:
<expr>
State qualifier expression. Refer to the <expr> description in this chapter.
<count>
Specifies the number of times the expression must occur before the trigger
condition is satisfied. The <count> value specified must be from 1 to 65535. The
default number base for <count> is decimal. If <count> is not specified, the
occurrence count is 1.
If no parameters are specified, the current primary branch condition for sequencer
term 1 is displayed. Note that this is not necessarily the trigger condition if other
sequence terms are used. After powerup or tinit initialization, tg is set to tg any.
The tg command modifies the current analyzer sequence specification. The manner
in which the sequencer is modified is dependent upon the analyzer configuration.
If the analyzer is in easy configuration (tcf -e), the sequencer is reduced to a one
term sequence triggering upon exit from term 1. The global restart qualifier is set
to never (telif never); the primary branch condition is set to the specified trigger
expression (tif 1 <expr> <count>).
If the analyzer is in complex configuration (tcf -c), the sequencer is modified to
trigger upon entrance to the second sequence term (tsq -t 2), the secondary branch
qualifier is set to never (telif 2 never), and the primary branch qualifier for term
number 1 is set to the specified expression (tif 1 <expr> 2 <count>).
The analyzer storage qualifier (tsto) is not affected in either configuration;
therefore, the analyzer uses the storage qualifier from the most recent tsto
command.
See Also
294
bc (allows you to break the emulator to the monitor when various conditions occur;
you can have the emulator break upon analyzer trigger by specifying tgout trig1
and bc -e trig1 (or you could use the trig2 signal to perform the same function))
Chapter 8: Commands
tg - set and display trigger condition
t (starts an emulation trace)
tarm (used to specify an analyzer arm condition; the analyzer will not trigger until
the arm condition is received if you specify tg arm)
tcf (used to specify whether the analyzer is operated in easy or complex
configuration)
tpat (used to assign pattern names to simple analyzer expressions; the pattern
names are then used in creating complex analyzer expressions which could be used
with the tg command to trigger the analyzer)
trng (used to specify a range of values for a particular group of analyzer lines; this
range may be used in specifying complex analyzer expressions for triggering the
analyzer)
tsto (specifies which states encountered by the analyzer should be stored in trace
memory)
tsq (used to manipulate the trace sequencer. Note that the sequencer’s current
status is affected by the tg command.)
295
Chapter 8: Commands
tgout - specify signals to be driven by the analyzer
tgout - specify signals to be driven by the
analyzer
tgout
<signal>
- find trigger then drive signal
The tgout command allows you to specify which of the internal trig1 and/or trig2
signals will be driven when the emulation analyzer finds its trigger condition.
The parameters are as follows:
<signal>
Specifies the internal signal to drive when the trigger is found. This signal can be:
trig1
The trig1 signal is driven by the analyzer when the trigger state
is found.
trig2
The trig2 signal is driven by the analyzer when the trigger state
is found.
trig1,trig2
Both trig1 and trig2 should are driven when the analyzer trigger
is found.
none
Neither the trig1 nor trig2 signals are driven when the analyzer
finds its trigger state.
If no parameters are specified, the current state of tgout is displayed. Upon
powerup or tinit, the default state is tgout none.
Note that if the analyzer is receiving trig1 or trig 2 via the tarm command, then that
signal cannot be driven, although no error message will be issued to that effect.
See Also
bc (allows you to specify a break to emulation monitor when the tgout condition is
satisfied)
bnct (specifies whether or not trig1 and trig2 are used to drive and/or receive the
rear panel BNC connector signal line)
cmbt (specifies whether or not trig1 and trig2 are used to drive and/or receive the
CMB trigger signal)
296
Chapter 8: Commands
tgout - specify signals to be driven by the analyzer
tarm (used to specify that the analyzer will be armed upon assertion or negation of
trig1 or trig2)
297
Chapter 8: Commands
th - halt the trace
th - halt the trace
th
th -w
- halt the emulation trace
- suppress output and errors
The th command stops an emulation trace.
The parameters are as follows:
-w
Suppresses the output and errors. In other words, "Emulation trace halted" is not
shown.
The analyzer will stop driving the trig1 and trig2 signals when the trace is halted.
This may cause you difficulty in making measurements with instruments connected
to the BNC. For example, if you set the analyzer to drive trig1 (tgout trig1) when
the trigger condition is found, then drive this to the BNC connector with bnct -d
trig1, the BNC signal will be driven high when the analyzer finds its trigger while a
trace is in progress; it will fall low when the trace finishes.
You should start the trace after you have begun the external instrument’s
measurement. Otherwise, the following measurement errors may occur, depending
on the type of external instrument you are using:
•
With an edge sensitive instrument, starting the instrument after the analyzer
trigger is found will mean that the instrument never sees the transition of the
trig1 line and therefore never triggers.
•
With a level sensitive instrument, starting the instrument after the analyzer
trigger is found will mean that the instrument triggers immediately; although
many states of interest have probably already passed.
Note that if the analyzer trigger specification has not been found, you will need to
use the th command to halt the analyzer before you can display the trace list.
298
Chapter 8: Commands
th - halt the trace
See Also
t (used to start an analyzer trace)
ts (allows you to determine the current status of the emulation analyzer)
tx (starts an analyzer trace upon receipt of the CMB execute signal)
x (starts a synchronous CMB execution)
299
Chapter 8: Commands
tif - set or display primary sequence branch specifications
tif - set or display primary sequence branch
specifications
In the easy configuration:
tif
tif X
tif X <expr>
tif X <expr> <count>
-
display all primary branch specifications
display primary branch X specification
define primary sequence branch X
branch X jump to next term after count times
In the complex configuration:
tif
tif
tif
tif
tif
X
X <expr>
X <expr> Y
X <expr> Y <count>
-
display all primary branch specifications
display primary branch X specification
define primary sequence branch X
define primary sequence branch X jump to Y
define branch X jump to Y after count times
The tif command allows you to set the primary branch qualifier for each term of the
emulation analyzer sequencer.
The parameters are as follows:
X
Specifies the sequence term whose primary branch qualifier is to be modified with
the <expr> state qualifier. If you specify X without an expression, the tif qualifier
for that term number is displayed.
<expr>
State qualifier expression. Refer to the <expr> description in this chapter.
<count>
Specifies the number of times the expression must occur before the trigger
condition is satisfied. The <count> value specified must be from 1 to 65535. The
default number base for <count> is decimal. If <count> is not specified, the
occurrence count is 1.
Note that, in the complex configuration, if you specify the <count> parameter, you
must also specify a Y parameter. If you omit the Y parameter when specifying
<count>, the system will interpret the count as "branch to term" information; if
greater than eight (8), an error will be returned; otherwise, you will have just
specified an incorrect branch.
Y
300
Specifies the branch destination when the state qualifier is found. For example, if
you wish to have the sequencer branch from term 1 to term 3 after the expression is
found, this would be specified as tif 1 <expr> 3. If you do not specify a term
number, the default is to increment the sequencer level (tif X <expr> (X+1)).
Chapter 8: Commands
tif - set or display primary sequence branch specifications
If tif is entered with no parameters, the primary branch qualifiers for all sequencer
levels are displayed. If tif is entered with only an X parameter, the primary branch
qualifier for only that term number is displayed.
Upon initialization via a powerup sequence or the tinit command, the primary
branch specifiers are set to tif X any (X+1).
Note that the telif command is used as a global restart qualifier in easy
configuration and a secondary branch qualifier in complex configuration. The
hierarchy of the tif and telif commands is such that either branch will be taken if
found before the other; however, if both branches are found simultaneously, the tif
branch is always taken over the telif branch.
When in easy configuration, the sequencer will increment to the next sequencer
level when the expression specified by tif occurs the number of times specified by
the <count> parameter. There is a maximum of five sequence levels; only one is
available at initialization. If you require more sequencer levels, you must insert
them with the tsq command. (The term you are specifying a primary branch for
with the tif command must be present in the sequence.) The branch out of the last
sequencer term constitutes the trigger.
When in complex configuration, the sequencer will branch to the sequencer level
specified by the Y parameter when the expression specified occurs the number of
times indicated in the <count> parameter. There are always eight sequencer terms
available. Position of the trigger term is defined with the tsq command.
Note that, in the complex configuration, at sequencer term number 8, the default
branch to condition is also term 8; that is, branch to the same term.
See Also
tarm (allows you to specify that the trig1 or trig2 signal will arm the analyzer.
This arm condition can then be used as part of the primary branch qualifier)
tcf (used to select whether the analyzer is operated in easy configuration or
complex configuration)
telif (used to specify a secondary branch specification for the analyzer)
tg (used to set up a simple trigger qualifier in either analyzer mode. Specifying the
tg command overrides the current sequencer specification and will modify the
existing tif qualifier stored in sequence term number 1)
301
Chapter 8: Commands
tif - set or display primary sequence branch specifications
tpat (used to assign pattern names to simple expressions for use in specifying
complex expressions. These complex expressions are used to specify tif qualifiers
in analyzer complex configuration)
trng (used to set up an expression which assigns a range of values to a range
variable. This range information may be used in specifying complex tif qualifiers)
tsto (specifies a global trace storage qualifier in both easy and complex
configurations; also specifies a trace storage qualifier for each sequencer term in
complex configuration. Used to control the types of information stored by the
analyzer)
tsq (used to manipulate the trace sequencer)
302
Chapter 8: Commands
tinit - initialize emulation analyzer to powerup defaults
tinit - initialize emulation analyzer to powerup
defaults
tinit
The tinit command restores all trace specification items to their powerup default
values which are as follows:
Trace Specification
Default Value
Analyzer arm
tarm always
Trace Configuration
tcf -e
Analyzer master clocks
tck -r L -u -s VF
Trace format
tf addr mne count,r
Trace trigger
tg any
tgout none
Analyzer signal line labels
#### Emulation trace labels
tlb addr 0..31
tlb data 32..47
tlb stat 64..79
Trigger Position
tp s
Trace Prestore Qualifier
tpq none
Trace sequencer (includes branch and
store conditions)
tif 1 any
tsto all
telif never
Trace slave clocks
tsck -o 1
tsck -o 2
tsck -o 3
tsck -o 4
tsck -o 5
Trace Upon Execute?
tx -d
# ignore the execute signal
303
Chapter 8: Commands
tinit - initialize emulation analyzer to powerup defaults
See Also
304
init (used to initialize selected portions of the emulator or the entire emulator,
dependent on the options given)
Chapter 8: Commands
tl - display trace list
tl - display trace list
tl
tl
tl
tl
tl
*
10..20
-d -15..3
-d -ol -8
-
tl -d -od 5..25
-
tl -d -od 50 62
-
tl -on
-
tl -oi -10..10
tl -oa -10..10
-
tl -e
tl -s 10..30
-
tl -a
-
tl
tl
tl
tl
-
-n 3
-t 123
-h
-b
display next states
display all states
display states 10 through 20
display states -15 through 3, disassembled
disassemble starting from low-order word of
state -8
display states 5 through 25, disassembled
and dequeued
display dequeued disassembly, disassembling opcodes
from state 50 and aligning operands from state 62
display non-dequeued disassembly (turn off
option -od)
display instructions only (no operand cycles shown)
display instructions and operands (turn off
option -oi)
display states with symbols and addresses
display states with symbols only (no addresses
shown)
display states with addresses only (no symbols
shown)
display next 3 states
display top 123 states
display next states, no header
upload binary trace list
The tl command allows you to display the current emulation analyzer trace list
information.
If the trigger specification has not yet been satisfied, the trace list cannot be
displayed until the trace in progress is halted with the th command. Entering the tl
command before the trace is halted results in the message "** Trigger not in
memory **."
If the analyzer was halted before any states were captured, the message "** No
trace data **" is displayed upon entry of the tl command.
The parameters are as follows:
-d
Disassemble instructions in the trace.
-s
Display symbols in the address column.
-a
Display absolute addresses in the address column. This is the default.
-e
Display symbols and absolute addresses in the address column.
-h
Suppresses the display of column headers.
305
Chapter 8: Commands
tl - display trace list
-n
Display the next number of states of the trace. If you do not specify a number, the
same number of states will be displayed as the last time you used tl to display part
(but not all) of the trace.
-o <opts>
Specify disassembler options for the inverse assembly of information in the mne
column. The valid disassembler options are:
l
Disassemble starting from the low order word.
d
Disassemble and dequeue the trace.
n
Display non-dequeued disassembly (turn OFF -od).
i
Display instruction cycles only (no operand cycles are shown).
a
Display instruction and operand cycles (turn OFF -oi).
-t
Displays the top number of states of the trace. If you do not specify a number, the
number of states displayed is the same number as the last time tl was invoked to
display part (but not all) of the trace.
-b
Dumps the trace list in binary format using the HP 64000 transfer protocol.
Note that the -h and -d options cannot be used with the -b option.
<align_operand
_state>
The first state or state range specifies the trace states that should be displayed. The
second state specifies the state from which the operands should be aligned.
If no parameters are given, the trace list is displayed starting with the first state that
has not yet been displayed. The number of states displayed is identical to the
number of states displayed by the last tl command. For example, if the last trace
list display was tl -t 5, then the next tl command will start the display at state 6 and
display a total of five states.
Note that the HP 64700 remembers the last option specified for the address field
(-s, -a, or -e), and uses it for the next tl command if no other option is specified.
See Also
t (starts an analyzer trace)
tf (specifies the display format for the trace)
th (halts a trace in process)
306
Chapter 8: Commands
tl - display trace list
tlb (defines analyzer signal line labels; these may be used by tf in specifying the
trace list display format)
ts (allows you to determine the current status of the emulation analyzer)
307
Chapter 8: Commands
tlb - define and display trace labels
tlb - define and display trace labels
tlb addr 0..15
tlb data 16..23
tlb stat 24..31
tlb stat 31..24
tlb
tlb
tlb
tlb
tlb
-n LRESET 25
-d LRESET
-d *
addr
- define addr, positive polarity, bits
0 through 15
- define data, positive polarity, bits
16 through 23
- define stat, bits 24 through 31
- define stat, bits 24 through 31;
31..24 is the same bit range as 24..31
- define LRESET, negative polarity, bit 25
- delete named label
- delete all labels
- display named label
- display all labels
The tlb command allows you to define new labels for emulation analyzer lines, as
well as display or delete previously defined analyzer labels.
The parameters are as follows:
-d
Delete the named label. If the label is currently used in a trace specification or in
the trace display format (tf command), it will not be deleted until removed from all
of the specifications. If * is used, all labels are deleted.
-n
Defines the named label with negative polarity. That is, after label definition, bits
that are a one (1) refer to a signal lower than the threshold voltage and bits that are
a zero (0) refer to a signal higher than the threshold voltage. If -n is not specified,
the named label defaults to positive polarity.
If no parameters are specified, the current label definitions are displayed. Upon
emulator powerup, or after a tinit command, the following labels are defined:
M>tlb
#### Emulation trace labels
tlb addr 0..31
tlb data 32..47
tlb stat 64..79
Note that the predefined emulation trace labels are special labels, used for trace list
disassembly. They should not be changed or deleted.
In emulation analyzer labels, no more than 32 signal lines may be assigned to a
given label. Also, an emulation analyzer label may not cross more than a multiple
of 16 boundary. For example, a label cannot be defined for emulation analyzer
lines 15..32 since one multiple of 16 boundary is crossed from 15 to 16 and another
boundary is crossed from 31 to 32.
308
Chapter 8: Commands
tlb - define and display trace labels
Labels are made up of alphanumeric characters; upper and lower case are
distinguished. Labels can be up to 31 characters in length.
Labels can be made to overlap; for example, you may wish to define a label for a
particular status line or data bit so that you can easily track its state in the trace list.
The number of labels that can be defined is limited only by system memory.
See Also
tf (used to specify the trace list format; tlb <LABEL> definitions can be specified
as output columns in the trace listing through the tf command)
tpat (trace pattern definition; labels defined in tlb can be used in pattern definitions)
trng (trace range, used to specify a range of valid values to be used in a trace
specification; labels defined by tlb may be used in defining the trace range)
309
Chapter 8: Commands
tp - set and display trigger position within the trace
tp - set and display trigger position within the
trace
tp
tp
tp
tp
tp
tp
s
c
e
-b <offset>
-a <offset>
-
display
trigger
trigger
trigger
trigger
trigger
trigger position
position start of the trace
position center of the trace
position end of the trace
is offset states from beginning of trace
has offset states after the trigger
The tp command allows you to specify where the trigger state will be positioned
within the emulation trace list.
The position number specified has an accuracy of +/- 1 state when counting states
or time; when counts are turned off, the accuracy is +/- 3 states.
The parameters are as follows:
s
The trigger is positioned at the start of the trace list.
c
The trigger is positioned at the center of the trace list.
e
The trigger is positioned at the end of the trace list.
-b
Indicates that the trigger is to be placed in the trace list with <offset> number of
states before the trigger position to the beginning of the trace.
-a
Indicates that the trigger is to be placed in the trace list with <offset> number of
states after the trigger position to the end of the trace.
<offset>
A decimal value from 0 to 1023.
If no parameters are supplied, the current trigger position setting is displayed.
Upon powerup or after tinit, the trigger position is tp s.
See Also
tg (defines the trigger expression)
tl (used to display the trace list)
tsq (used to specify the trigger position within the trace sequencer; reference the
sequencer operation when deciding where to position the trigger in the trace list, if
you want to capture all of the sequence conditions)
310
Chapter 8: Commands
tpat - set and display pattern resources
tpat - set and display pattern resources
tpat
tpat
tpat
tpat
tpat
tpat
<pattern>
<pattern>
<pattern>
<pattern>
<pattern>
-
display all patterns
display named patterns
<label>=<value>
equals pattern
<label>!=<value>
not equals pattern
<label>=<value> and <label>=<value>
<label>!=<value> or <label>!=<value>
The tpat command allows you to assign pattern names to simple emulation
analyzer expressions. These pattern names are then used in building complex
expressions for other analyzer commands.
The tpat command is only valid in the complex analyzer configuration (tcf -c).
The parameters are as follows:
<pattern>
One of the pattern names p1 through p8.
<label>
A trace label that is currently defined with the tlb command.
<value>
Values are numeric constants, equates, or symbols. Also, values can be the result
of constants, equates, and symbols combined with operators. Refer to the <value>
description.
If no parameters are given, or if the pattern name is given as *, all eight of the
current pattern assignments are displayed. If one of the pattern names is given, the
expression assigned to that pattern is displayed.
Upon entering complex configuration after powerup or a tinit initialization, all
eight patterns are defined as tpat <pattern> any.
See Also
tcf (defines whether the analyzer is in easy configuration or complex configuration;
the tpat command is only valid in complex configuration)
telif (specifies a secondary branch qualifier in analyzer complex configuration; tpat
patterns may be used in qualifier specification)
tg (used to specify a simple trigger in either easy configuration or complex
configuration; tpat patterns may be used in complex configuration trigger
specification)
311
Chapter 8: Commands
tpat - set and display pattern resources
tif (used to specify a primary branch qualifier in either analyzer configuration; tpat
patterns may be used in complex configuration branch specifications)
tpq (specifies a trace prestore qualifier; tpat patterns may be used in qualifier
specification)
trng (defines a range of values on a set of analyzer input lines; this range may be
used in conjunction with the patterns defined by tpat in setting up complex analysis
qualifiers)
tsq (used to manipulate the trace sequencer)
tsto (used to define global storage qualifiers in both analyzer configurations; may
also be used to define storage qualifiers for each sequencer level in complex
configuration. The patterns defined by tpat may be used in complex configuration
storage qualifier definition.)
312
Chapter 8: Commands
tpq - set or display prestore specification
tpq - set or display prestore specification
tpq
tpq <expr>
- display prestore specification
- set prestore specification
The tpq command allows you to specify a prestore qualifier for the emulation trace.
During the trace, the analyzer fills a two stage pipe with states that satisfy the
prestore qualifier. Each time a trace state is stored into the trace buffer, the prestore
qualifier is also stored and then cleared. Therefore, up to two prestore events may
be stored for each normal store event; the prestore events in the trace buffer will
correspond to the most recent states that satisfied the prestore qualifier immediately
prior to a store event but following the previous store event.
The parameters are as follows:
<expr>
State qualifier expression. Refer to the <expr> description in this chapter.
If no parameters are given, the current prestore qualifier setting is displayed. Upon
powerup or after tinit initialization, the prestore qualifier defaults to tpq none.
See Also
tcf (specifies whether the analyzer is to operate in easy configuration or complex
configuration)
tsq (used to manipulate the trace sequencer)
tsto (used to specify a global storage qualifier for both easy configuration and
complex configuration; also used to specify individual sequence term storage
qualifiers in complex configuration)
313
Chapter 8: Commands
trng - set or display range pattern
trng - set or display range pattern
trng
trng <label>=<value>..<value>
- display range
- define range
The trng command lets you specify a range of acceptable values for an emulation
trace label. This range may then be used in complex qualifiers for the trace
specification. The trng command is only available in the analyzer’s complex
configuration (see tcf syntax pages).
There is no need for a not equals operator in specifying ranges, as the trace
specification commands which allow "range" as a parameter also accept "not
range" in the form !r.
The parameters are as follows:
<label>
A trace label that is currently defined with the tlb command.
<value>
Values are numeric constants, equates, or symbols. Also, values can be the result
of constants, equates, and symbols combined with operators. Refer to the <value>
description.
If no parameters are supplied, the current range definition is displayed. After
powerup or tinit initialization, the trng command is set to trng any. (Note that
trng is not directly available after analyzer initialization; the analyzer is set to easy
configuration when initialized. You must then switch to complex configuration to
access trng.)
Ranges can be specified that encompass more bits than the number of bits defined
for the specified label.
Note that the tcf -e (set trace configuration to easy) command also will reset trng.
In other words, any trng defined when the analyzer was in complex configuration
is destroyed when the analyzer is set to easy configuration; you cannot return to
complex configuration and use the old trng.
See Also
tcf (sets analyzer to complex or easy configuration; analyzer must be in complex
configuration to utilize the trng command)
telif (specifies the sequencer secondary branch expression; in complex
configuration, this expression can include references to the range)
314
Chapter 8: Commands
trng - set or display range pattern
tg (specifies analyzer trigger; may trigger on references to range)
tif (specifies the sequencer primary branch expression; in complex configuration,
branch expression may include range qualifier)
tpat (trace pattern definition; assigns pattern names to simple expressions for later
use in analyzer specifications. tpat essentially commits only one pattern to a label;
whereas trng allows a range of values to be assigned to the range pattern)
tpq (defines trace prestore qualifier; the range specification may be used in
complex configuration prestore qualifier expressions)
tsq (trace sequencer definition)
tsto (defines trace storage qualifier; that is, specifies exactly what states are actually
to be stored by the analyzer. In complex configuration, this can include states that
fall within the specification defined by trng)
315
Chapter 8: Commands
ts - display status of emulation trace
ts - display status of emulation trace
ts
ts -w
- display complete emulation trace status
- display short status
The ts command allows you to determine the current status of the emulation
analyzer.
The parameters are as follows:
-w
The -w option indicates that the trace status should be printed in whisper mode; this
gives an abbreviated version of the status. See "Whisper Mode Trace Display"
below for interpretation of the whisper status information.
Trace Status Display
The emulation trace status is displayed in the following form:
---Emulation Trace Status--(NEW) [User | CMB ] trace [complete | halted | running ]
Arm [ ignored | (not) received ]
Trigger (not) found
Arm to trigger armcount
States visible (history) first..last
Sequence term term
Count remaining count
trace
The first line of the trace status indicates the initiator of the trace, whether the trace
is completed, running, or halted, and whether or not this trace has been displayed.
NEW
This trace has not been displayed. The tl command will clear this flag until the
next trace is started. Halting a trace that is running (as opposed to complete), marks
the trace as being NEW even though the trace may have been displayed while
running. The next tl command with no options will list the trace from the top.
User
The operator initiated this trace with the t command.
CMB
This trace was initiated by a /EXECUTE pulse on the CMB after a tx command
was entered.
complete
The trace has found its trigger and completed.
316
Chapter 8: Commands
ts - display status of emulation trace
halted
The trace was halted in response to a th command.
running
The trace is still running; either the complete sequencer specifications have not yet
been satisfied; or not enough qualified store states have been found to fill trace
memory.
Arm
The second line of the trace display indicates the analyzer arm status.
ignored
The arm condition specified for this trace was tarm always.
received
The arm condition has been satisfied.
not received
The arm condition was not satisfied. (If you specified an arm condition but didn’t
use it in trigger qualification, this will be displayed if the arm condition is not
satisfied. However, the analyzer may still find the correct trigger and complete the
trace.)
trigger
The third line of the state trace display indicates the trigger status. Because of the
pipelined analyzer architecture, it is possible that the trace status may display "not
found" when in fact the trigger has been found. This will occur when not enough
states satisfying the storage specification are found to push the trigger out of the
pipeline and into trace memory. In any case, the trace will not be displayable until
the trigger is in trace memory (unless you halt the analyzer).
found
The trigger condition has been found.
not found
The trigger condition has not yet been satisfied.
Arm to trigger
The fourth line of the trace display indicates the amount of time that passed
between the arm signal and the trigger condition.
armcount
This will be from -0.04 microseconds to 41.943 milliseconds. The arm to trigger
counter may underflow or overflow, in which case "<-0.04 microseconds" or
">41.943 milliseconds" are reported, respectively. If the arm signal was ignored or
if the trigger was not found, the character "?" (unknown) is displayed.
317
Chapter 8: Commands
ts - display status of emulation trace
States
The fifth line of the trace display indicates the number of states displayable by tl.
visible
Number of states which can be displayed by tl; this will be a number from 0 to
1024 (or 0 to 512 if tcq is active).
history
Number of states which can be displayed if the current trace is halted; this may
include history states which may be overwritten and thus unavailable if the current
trace runs to completion.
first
Number of the first state stored in trace memory, relative to the trigger state. This
will be a number from -1024 to 0. The character "?" is displayed if the trigger state
is not yet in memory.
last
Number of the last state stored in trace memory, relative to the trigger state. This
will be a number from -1 to 1023. The character "?" is displayed if the trigger state
is not yet in memory.
Sequence term
The sixth line of the trace display indicates the current sequencer term position.
term
Current sequence term position (1 through 5 in easy configuration; 1 through 8 in
complex configuration). If the trace is completed or halted, the last sequence term
number is displayed. A "?" is displayed if the trace is running and the sequencer is
running too quickly for the current term number to be read.
Count remaining
The seventh line of the trace display indicates the count qualifier status for the
primary branch condition of the current sequence term, see tif for further details.
count
318
Remaining number of occurrences of the primary branch qualifier needed to satisfy
the qualifier so that the primary branch will be taken. A "?" is displayed if the trace
is running and the counter is updating too quickly to be read.
Chapter 8: Commands
ts - display status of emulation trace
Whisper Mode Trace Display
If the -w option is given, an abbreviated version of the trace status is given as
follows:
Trace run status:
R - trace running
C - trace completed
H - trace halted
Trace arm status:
A - Arm has been received
a - arm has not yet been received
x - arm signal is being ignored
Trace trigger status:
T - trace trigger has been found
t - trace trigger has not yet been found
Trace list status:
* - indicates that this trace has not been displayed
See Also
es (allows you to determine general emulator status)
t (starts an emulation trace)
tarm (arm the analyzer based on state of the trig1 and trig2 signals)
tg (specify the analyzer trigger state)
th (halt the current trace in process)
tif (specify sequencer primary branch condition and number of occurrences)
tx (specify that trace is to begin upon receiving the CMB /EXECUTE pulse)
x (begin a synchronous CMB execution)
319
Chapter 8: Commands
tsck - set or display slave clock specification for the analyzer
tsck - set or display slave clock specification for
the analyzer
tsck
tsck
tsck
tsck
tsck
-o
-d
-d
-d
-m
<pod
<pod
<pod
<pod
<pod
number>
number>
number>
number>
number>
turn slave clock off in pod
demux pod, rising edge of clock(s)
demux pod, falling edge of clock(s)
demux pod, both edges of clock(s)
mix pod clocks, rising edge of
clock(s)
tsck -m <pod number> -f <clock> - mix pod clocks, falling edge of
clock(s)
tsck -m <pod number> -x <clock> - mix pod clocks, both edges of
clock(s)
-r
-f
-x
-r
<clock>
<clock>
<clock>
<clock>
-
The tsck command allows you to specify the slave clock edges used for the
emulation analyzer trace.
Each analyzer pod has the capability of latching certain signals with a slave clock
instead of the master clock. (You set up the master clock with the tck command.)
The parameters are as follows:
<pod number>
Specifies one of 5 groups of analyzer input lines. These are as follows:
Pod #
1
2
3
4
5
-d
Bits
0-15
16-31
32-47
48-63
64-79
Specifies that the slave clock operates in demultiplexed mode. In this mode, the
lower 8 channels of the analyzer pod (bits 0-7) are latched with the slave clock and
the upper 8 channels (bits 8 through 15) are replaced with the lower 8 channels. In
other words, the upper 8 bits are identical to the lower 8 at the pod.
However, the data is not clocked into the analyzer itself until the next master clock
occurs. Therefore, if no slave clocks have occurred since the last master clock, the
data on the lower 8 analyzer lines is identical to the upper 8. If one or more slave
clocks have occurred since the last master clock, the data on the lower 8 bits is the
only data available to the analyzer.
When using the -d option, you must specify one of the -r, -f, or -x options to
indicate the active edge(s) of the slave clock.
320
Chapter 8: Commands
tsck - set or display slave clock specification for the analyzer
-m
Specifies that the slave clock operates in mixed mode. In the mixed mode, the
lower 8 channels of the analyzer pod (bits 0-7) are latched with the slave clock, and
the master clock latches in the entire pod. Therefore, if no slave clock has occurred
since the last master clock, the data on the lower 8 bits of the pod will be clocked
into the analyzer at the same time as the upper 8 bits. If more than one slave clocks
has occurred since the last master clock, only the first slave clock data will be
available to the analyzer.
When using the -m option, you must specify one of the -r, -f, or -x options to
indicate the active edge(s) of the slave clock.
-r
Indicates that the pod should latch data on the rising edge of the slave clock.
-f
Indicates that the pod should latch data on the falling edge of the slave clock.
-x
Indicates that the pod should latch data on both edges of the slave clock.
<clock>
Three clock signals are defined: L, M, and N.
The L, M, and N clocks are generated by the emulator. The L clock is the
emulation clock derived by the emulator, the N clock is used as a qualifier to
provide the user/background tracing options (-u and -b) to tck, and the M clock is
not used.
-o
If you specify -o with a <pod number>, the slave clock is ignored on that pod.
If no parameters are specified, the current slave clock definitions are displayed.
The default for all slave clocks is off after powerup or tinit initialization.
See Also
ta (allows you to display active signals on the analyzer input lines; useful in
verifying that you have selected the correct clock conditions)
tck (used to define master clock signals used by the analyzer; tsck defines the slave
clock signals. Default mode for tsck is off on all pods.)
321
Chapter 8: Commands
tsq - modify or display sequence specification
tsq - modify or display sequence specification
In the easy configuration:
tsq
tsq -r
tsq -i X
tsq -d X
-
display entire sequence specification
reset the sequence specification
insert sequence term X into sequence
delete sequence term X from sequence
In the complex configuration:
tsq
tsq -t
tsq -t X
tsq -r
-
display entire sequence specification
display sequence trigger specification
set the sequence to trigger on entrance to term X
reset the sequence specification
The tsq command allows you to manipulate or display the emulation trace
sequencer.
When the analyzer is in easy configuration (tcf -e), the sequencer has a maximum
of four sequence terms with a minimum of one term.
If the analyzer is in complex configuration (tcf -c), the sequencer always has eight
terms (although the particular sequencer setup may mean that only two are ever
accessed).
The parameters are as follows:
-r
Resets the sequencer.
In the easy configuration, the result is a simple one term sequence which stores all
states and triggers on the first occurrence of any state. This is equivalent to issuing
the commands:
In the complex configuration, the result is an eight term sequence with the trigger
term at term number 2. The sequencer will be set to tsto any (store any state). All
secondary branch qualifiers are turned off (telif X never), and all primary branch
qualifiers will jump to the next higher numbered term on any state (tif X any
(X+1)).
-i
322
Inserts a new sequence term at X. The new sequence term will use the default
storage qualifier (which can be modified with the tsto command). It will also use
the secondary branch qualifier (global restart in easy configuration) specified by the
telif command.
Chapter 8: Commands
tsq - modify or display sequence specification
If there is already a sequence term with number X, terms with number X and above
will be renumbered (X becomes X+1) to make room for the new term.
You must insert terms in a contiguous manner; for example, you cannot insert a
term number 4 if the sequencer only has two terms defined. Instead, you must next
insert a term numbered 1, 2 or 3.
The primary branch qualifier for the new term will be defined as tif X any unless it
is the last term in the sequence (by definition, the trigger term), in which case the
primary branch qualifier is set to tif X never.
-d
Deletes the term specified and renumbers higher numbered terms downward to fill
the gap.
X
Specifies a sequence term number.
In the easy configuration, X is in the range from 1 through 4 when inserting or
deleting terms.
In the complex configuration, X is in the range 2 through 8 to use as the trigger
term.
-t
Specifies the trigger term when a sequence term number is included. When no
sequence term number is included, the trigger term is displayed. The analyzer
triggers on a sequencer branch to the trigger term.
If no options are given, all of the sequencer storage and branch qualifiers are
displayed along with the trigger term position. Upon powerup or after tinit
initialization, the sequencer defaults to the following state:
tif 1 any
tsto all
telif never
In other words, the sequencer powers up with two sequence terms; the second
sequence term is the trigger term. Any state will cause a branch from the first term
to the second term; global restart is set to never and all states are stored by the
analyzer.
Switching analyzer configurations from easy to complex or vice versa also resets
the sequencer (that is, tcf -c or tcf -e).
323
Chapter 8: Commands
tsq - modify or display sequence specification
See Also
tcf (defines whether analyzer is operated in complex configuration or easy
configuration)
telif (sets global restart qualifier in easy configuration; secondary branch qualifier
in complex configuration)
tg (defines the trigger qualifier)
tif (sets the primary branch qualifier in both easy and complex configuration)
tsto (defines the analyzer global storage qualifier)
324
Chapter 8: Commands
tsto - set or display trace storage specification
tsto - set or display trace storage specification
In the easy configuration:
tsto
tsto <expr>
- display storage specification
- define storage specification
In the complex configuration:
tsto
tsto X
tsto <expr>
tsto X <expr>
-
display all storage specifications
display storage qualifier X specification
define global storage specification
define storage qualifier X specification
The tsto command allows you to specify a trace storage qualifier for the emulation
analyzer. The expression parameter qualifies the states to be stored by the analyzer.
The parameters are as follows:
<expr>
State qualifier expression. Refer to the <expr> description in this chapter.
X
Specifies the sequence term number whose storage qualifier is either displayed or
assigned as <expr>.
If no parameters are given, the current trace storage qualifier settings are displayed.
Upon powerup or after tinit initialization, the trace storage qualifier defaults to tsto
all. Using the tcf command to switch from complex configuration to easy
configuration or vice versa will also reset the storage qualifier to tsto all.
If the analyzer is in easy configuration (tcf -e), the expression is specified by
<expr> and this serves as a global storage qualifier. In other words, the same
expression is used as a storage qualifier regardless of the current sequencer state.
If the analyzer is in complex configuration (tcf -c), the expression is specified by
<expr> and may be assigned to a sequencer state with the X parameter. When an
expression is assigned to a specific term number, the analyzer will only store states
corresponding to the given expression when at the given sequencer level. If no
sequence term number is used, the associated expression is defined as global; the
analyzer stores states satisfying the expression regardless of the sequencer level.
See Also
tcf (used to specify whether the analyzer is in easy configuration or complex
configuration)
325
Chapter 8: Commands
tsto - set or display trace storage specification
telif (used to specify a global restart qualifier in easy configuration; specifies a
secondary branch qualifier for each sequencer level in complex configuration)
tg (used to specify a trigger condition in either easy configuration or complex
configuration; overrides the current sequencer specification. Note that tg does not
affect tsto; therefore, the current tsto specifications remain in effect whenever a tg
command is entered)
tif (used to specify a primary branch qualifier in either analyzer configuration)
tpat (used to assign pattern names to simple analyzer expressions for use in
constructing complex analyzer expressions; these expressions can be used in
specifying storage qualifiers for the tsto command)
trng (used to specify a range of values of a set of analyzer inputs; this range
information can be used in constructing complex configuration qualifiers for the
tsto command)
tsq (used to manipulate the trace sequencer)
326
Chapter 8: Commands
tx - enable/disable execute condition
tx - enable/disable execute condition
tx -e
tx -d
- start a measurement when the execute signal is received
- ignore the execute signal
The tx command allows you to specify that the analyzer will begin a measurement
when the CMB /EXECUTE line is asserted.
The parameters are as follows:
-e
Specifies that the analyzer will start a measurement upon receiving the CMB
/EXECUTE signal.
-d
The analyzer will NOT start a measurement upon receiving the CMB /EXECUTE
signal.
If no options are specified, the current state of tx enable/disable is displayed. Upon
powerup or after a tinit, the system defaults to tx -d.
If tx -e is given, enabling measurement on execute, the CMB trigger is immediately
driven true upon receiving the /EXECUTE signal. If the analyzer is not driving
either trig1 or trig2, it is then started. The CMB trigger is then disabled and the
HP 64700 waits for all other participants in the measurement to release the CMB
trigger. When the last instrument releases the CMB trigger, the trigger will go
false; at this point any analyzers driving trig1 or trig2 will be started.
See Also
cmbt (specifies whether the CMB trigger signal is driven or received by the
internal trig1 and trig2 signals)
tarm (specifies the arm condition for the analyzer)
tg (specifies a trigger condition for the analyzer)
327
Chapter 8: Commands
<value> - values in Terminal Interface commands
<value> - values in Terminal Interface commands
Values are numeric constants, equates, or symbols. Also, values can be the result
of constants, equates, and symbols combined with operators. Equates are defined
with the equ command. Symbols can be loaded with the load command or defined
with the sym command.
Constants
A value may be specified as a constant in any of the following number bases.
(Constants with no base specified are assumed to be hexadecimal numbers.)
•
Hexadecimal (base H or h). For example: 6eh, 9xH, 0f3, or 0cfh. (The
leading digit of a hexadecimal constant must be 0-9.)
•
Decimal (base T or t, for base "ten"). For example: 27t or 99T. (Don’t cares
are not allowed in decimal numbers.)
•
Binary (base Y or y). For example: 1101y, 01011Y, or 0xx10xx11y. (The
leading digit of a binary constant must be 0 or 1. Do not use the characters "B"
or "b" to specify the base of binary numbers because they will be interpreted as
hexadecimal numbers; for example, 1B equals 27 decimal.)
•
Octal (base Q, q, O, or o). For example: 777o, 6432q, or 7xx3Q. (The leading
digit of an octal constant must be 0-7.)
Don’t cares are not allowed in ranges or decimal numbers. A value of all don’t
cares may be represented by a question mark (?).
Operators. When specifying values, constants can be combined with the
following operators (in descending order of precedence):
328
-, ~
Unary two’s complement, unary one’s complement. The
unary two’s complement operator is not allowed on
constants containing don’t care bits.
*, /, %
Integer multiply, divide, and modulo. These operators are
not allowed on constants containing don’t care bits.
+, -
Addition, subtraction. These are not allowed on constants
containing don’t care bits.
Chapter 8: Commands
<value> - values in Terminal Interface commands
<<, <<<,
>>, >>>
Shift left, rotate left, shift right, rotate right.
&
Bitwise AND.
^
Bitwise exclusive or, XOR.
|
Bitwise inclusive OR.
&&
Logical AND/bit-wise merge. When bits are different, the
first value overrides the second; e.g., 10xxy && 11x1y ==
10x1y.
Note that all operations are carried out on 32-bit numbers.
329
Chapter 8: Commands
ver - display system software and hardware version numbers
ver - display system software and hardware
version numbers
ver
The ver command instructs the emulator to return the current emulator Terminal
Interface software version numbers.
330
Chapter 8: Commands
w - wait for specified condition before continuing
w - wait for specified condition before continuing
w
w <value>
w -m
- wait for any keystroke
- wait for <value> number of seconds or any keystroke
- wait for measurement complete or any keystroke
The w command is used to program automatic waits into macros, repeats, and
command files. Normal operation is to wait for any keystroke before executing the
next operation; optionally, the wait can be programmed for a specific time period or
for completion of a measurement in process (such as a trace).
The parameters are as follows:
<value>
The number of seconds before proceeding.
-m
Wait for completion of the current measurement before proceeding.
Examples
To cause the emulator to wait for any keystroke before proceeding to the next
command, type:
U>w
You might use this in a situation where you wish the operator to make a judgment
regarding some other condition before proceeding with the next measurement.
To cause the emulator to wait for 32 seconds or for any keystroke, type:
U> w 32
This might be used where you know the desired system state will be reached in a
definite amount of time (or should be reached within that time).
To have the emulator wait until another measurement is completed or for any
keystroke entry, type:
U> w -m
Note that the above examples, taken exactly as shown, don’t provide you with a
useful function -- they are provided only to show correct examples of command
line syntax. To use the wait command effectively, it should be applied within
macros, repeat commands, or command files. Refer to the rep and mac commands
for further examples.
331
Chapter 8: Commands
x - emit a Coordinated Measurement Bus execute signal
x - emit a Coordinated Measurement Bus execute
signal
x
The x command allows you to initiate a synchronous CMB (Coordinated
Measurement Bus) measurement execution.
When x is performed, the CMB /EXECUTE line is pulsed. If tx (trace at execute)
is enabled, an analyzer measurement will begin. If the CMB is enabled via the cmb
-e command, a break will occur, followed by a run at execute as specified by the rx
command.
The x command is available whether CMB and trace at execute are enabled or not.
Specifically, the cmb and tx commands control how this HP 64700 emulator will
respond when an /EXECUTE or READY is detected. The x command only
controls when this emulator will issue an /EXECUTE signal.
See Also
cmb (used to enable or disable interaction with the CMB)
rx (used to specify an address to start a program run when the /EXECUTE pulse is
received from the CMB)
tx (used to specify that an analyzer measurement should begin when the
/EXECUTE pulse is received from the CMB)
332
9
Error Messages
333
Emulator Error Messages
This chapter contains descriptions of error messages that can occur while using the
Terminal Interface. The error messages are listed in numerical order, and each
description includes the cause of the error and the action you should take to remedy
the situation.
The emulator can return messages to the display only when it is prompted to do so.
Situations may occur where an error is generated as the result of some command,
but the error message is not displayed until the next command (or a carriage return)
is entered.
A maximum number of 8 error messages can be displayed at one time. If more
than 8 errors are generated, only the last 8 are displayed.
1
I/O port access not supported
Cause: You attempted to use the io command for an emulator whose processor
does not support separate I/O (such as the 68340).
Action: Use the m command to modify I/O ports on these emulators.
20
Attempt to change foreground monitor map term
Cause: The cf mon=fg command that sets up use of a foreground monitor also
maps a memory range for the monitor’s use. You attempted to alter that term using
the map command.
Action: Try using another memory range for the new map term. If you need to
have the range used by the foreground monitor, then switch to a background
monitor, delete the old foreground monitor map term, and add the new term. Now
you can return to using a foreground monitor; remember you will need to reload the
monitor code.
21
Insufficient emulation memory
Cause: You have attempted to map more emulation memory than is available.
Action: Reduce the amount of emulation memory that you are trying to map.
334
Chapter 9: Error Messages
Emulator Error Messages
40
Restricted to real time runs
Cause: While the emulator is restricted to real-time execution, you have attempted
to use a command that requires a temporary break in execution to the monitor. The
emulator does not permit the command and issues this error message.
Action: You must break the emulator’s execution into the monitor before you can
enter the command.
61
Emulator is in the reset state
Cause: You have entered a command that requires the emulator to be running in
the monitor (for example, displaying registers).
Action: Enter the b (break) command to cause the emulator to run in the monitor,
and enter the command that caused the error again.
80
Stack pointer is odd
Cause: You have attempted to modify the stack pointer to an odd value for a
processor that expects the stack to be aligned on a word boundary (such as the
68340).
Action: Modify the stack pointer to an even value.
81
Stack is in guarded memory
Cause: Your stack pointer pointed to a location in memory mapped as guarded;
you then attempted to run or step the emulation processor. The emulator was
unable to access the stack to complete the transition from the monitor to the user
program or vice versa.
Action: Either remap memory so the stack pointer points to a location in RAM, or
change the stack pointer value (either with your program or with the cf command
options, if available) to point to a location in RAM.
82
Stack is in target ROM
Cause: Your stack pointer pointed to a location in memory mapped as target ROM;
you then attempted to run or step the emulation processor. The emulator was
unable to access the stack to complete the transition from the monitor to the user
program or vice versa.
335
Chapter 9: Error Messages
Emulator Error Messages
Action: Either remap memory so the stack pointer points to a location in RAM, or
change the stack pointer value (either with your program or with the cf command
options, if available) to point to a location in RAM.
83
Stack is in emulation ROM
Cause: Your stack pointer pointed to a location in memory mapped as emulation
ROM; you then attempted to run or step the emulation processor. The emulator
was unable to access the stack to complete the transition from the monitor to the
user program or vice versa.
Action: Either remap memory so the stack pointer points to a location in RAM, or
change the stack pointer value (either with your program or with the cf command
options, if available) to point to a location in RAM.
84
Program counter is odd
Cause: You attempted to modify the program counter to an odd value using the reg
command on a processor which expects even alignment of opcodes.
Action: Modify the program counter only to even numbered values.
102
Monitor failure; no clock input
Cause: The monitor is unable to run because no emulation processor clock is
available.
Action: If running out of circuit, choose configuration option cf clk=int; if running
in-circuit, choose configuration option cf clk=ext and make sure a clock meeting
the microprocessor’s specifications is input to the clock pin of the target system
probe.
103
Monitor failure; no processor cycles
Cause: The monitor is unable to run since the processor is not running. The
monitor is unable to determine the cause of the failure.
Action: If running in-circuit, troubleshoot the target system. If running out of
circuit, reinitialize the emulator and try the procedure again.
336
Chapter 9: Error Messages
Emulator Error Messages
104
Monitor failure; bus grant
Cause: The monitor is unable to run. The emulation processor is not running
because it has granted the bus to another device.
Action: Wait until the processor has regained bus control, then retry the operation.
105
Monitor failure; halted
Cause: The monitor is unable to run because the processor is halted (due to an
external halt line or a halt instruction).
Action: Release the external halt and retry the operation. If the processor halted
due to a halt instruction, try the rst command, then retry the operation.
106
Monitor failure; wait state
Cause: The monitor is unable to run because the processor is in a continuous wait
state.
Action: A continuous wait state may indicate target system problems.
Troubleshoot the wait line. If you were running out of circuit, try initializing the
emulator with init, then retry the procedure.
107
Monitor failure; bus error
Cause: The monitor is unable to run because the processor has encountered a bus
fault (such as the 68340 /BERR line).
Action: Release the /BERR line and determine why it was activated.
337
Chapter 9: Error Messages
68340 Emulator Messages
68340 Emulator Messages
The following error messages are unique to the 68340 emulator.
141
Dual ported memory limited to 4K bytes
Cause: You attempted to map an address range larger than 4 Kbytes to dual-port
emulation memory. Only 4 Kbytes of dual-port emulation memory is available.
Action: Split the address range into one 4 Kbyte range that will be mapped to
dual-port emulation memory and another range that will be mapped to single-port
emulation memory.
142
Dual ported memory already in use
Cause: You attempted to map a second address range to dual-port emulation
memory. Only one address range can be mapped to dual-port emulation memory.
Action: If both ranges can fit into one 4 Kbyte range, delete the term currently
mapped to dual-port emulation memory, and map the larger range. If both ranges
cannot fit into one 4 Kbyte range, you must map one of the ranges to single-port
emulation memory.
143
Dual ported memory in use by foreground monitor
Cause: You attempted to map an address range to the 4 Kbyte block of dual-port
emulation memory when it has already been allocated to the foreground monitor.
Action: When using a foreground monitor, only single-port emulation memory is
available when mapping memory.
144
Dual ported memory not mapped to <abs_file_address_range> for
downloaded monitor
Continuing with default foreground monitor
Cause: You attempted to load, with the load -f command, a foreground monitor
absolute file whose address range does not agree with the range defined by the
cf monaddr configuration item. The second message tells you the default
foreground monitor, resident in the emulator firmware, continues to be used.
338
Chapter 9: Error Messages
68340 Emulator Messages
Action: Either assemble and link your foreground monitor at the address specified
by the cf monaddr configuration item or change the cf monaddr configuration
item so that it agrees with the monitor program absolute file.
145
Downloaded monitor spans multiple 4K byte block boundaries
Cause: You attempted to load, with the load -f command, a foreground monitor
absolute file that does not fit into one 4 Kbyte address range.
Action: Edit your foreground monitor program source file so that it fits into one
4 Kbyte address range.
146
Monitor must be mapped on a 4K byte boundary
Cause: You attempted to define a foreground monitor base address (using the
cf monaddr configuration item) that is not on a 4 Kbyte boundary.
Action: Re-enter the cf monaddr=<address> command, specifying an address
that is on a 4 Kbyte boundary (in other words, ending in 000H).
147
cs0 can be used on one term only
Cause: You attempted to map a second address range for global chip select
operation. Only one address range can be mapped for this purpose.
Action: You must remove the current mapper term that is assigned the cs0 attribute
before you can map a different range for global chip select operation.
148
Bus activity required to access dual ported memory
Cause: In order for the system controller to be able to access dual-port emulation
memory, the 68340 emulation processor’s /AS signal must not remain active for
too long a time (more than 100 microseconds, approximately). Typically, this
situation occurs when the 68340 emulation processor attempts to access memory
that is not present.
Action: Investigate the cause of the /AS signal being active too long.
339
Chapter 9: Error Messages
68340 Emulator Messages
149
Register mbar valid bit not set
Register cf_mbar valid bit not set
Cause: The contents of the mbar or cf_mbar register must be valid (that is, bit 0 of
the register must be set to 1) before you can display of modify of the SIM or SIM
configuration registers.
Action: Make sure the contents of the mbar or cf_mbar register are valid.
150
Program counter is odd or uninitialized
Program counter is located in guarded memory
Cause: You attempted to run or step from the current program counter when it
contains an odd value or an address that is mapped as guarded memory.
Action: When running from the current program counter, make sure it contains an
even address that is not in guarded memory.
151
Supervisor stack pointer is odd or uninitialized
Supervisor stack is located in emulation ROM
Supervisor stack is located in guarded memory
Cause: You are using a foreground monitor, and you have attempted to run or step
when the stack pointer contains an odd value or when the stack pointer contains an
address that is mapped as emulation ROM or guarded memory.
Action: Make sure the stack pointer contains an even address value that is not
mapped as emulation ROM or guarded memory.
152
Foreground monitor had unexpected exception %d
Cause: The decimal number value of the vector offset (included with the message)
tells you what type of exception caused the message. For example, if a priviledged
opcode is attempted to be executed at the user access level, the decimal value 32 is
shown with this error message.
Action: Determine the cause of the exception.
340
Chapter 9: Error Messages
68340 Emulator Messages
155
Unable to verify trace vector; vector table in guarded memory
Cause: In order to step when using a foreground monitor, the trace vector must
contain the address of the monitor program’s TRACE_ENTRY label (which equals
the monitor base address plus 800H). The step command reads the trace vector on
each step to make sure it contains the correct address value. This error occurs when
the vector table is in guarded memory.
Action: Make sure the vector table is not in an address range mapped as guarded
memory.
156
Unable to verify trace vector; vector table read failed
Cause: In order to step when using a foreground monitor, the trace vector must
contain the address of the monitor program’s TRACE_ENTRY label (which equals
the monitor base address plus 800H). The step command reads the trace vector on
each step to make sure it contains the correct address value. This error occurs when
the vector table is in target memory and the read fails.
Action: Make sure the vector base register points to the correct location in target
memory and that the memory system is operating correctly.
157
Unable to set trace vector to <TRACE_ENTRY_address>; vector table write
failed
Cause: In order to step when using a foreground monitor, the trace vector must
contain the address of the monitor program’s TRACE_ENTRY label (which equals
the monitor base address plus 800H). The step command reads the trace vector on
each step to make sure it contains the correct address value. If the trace vector does
not contain the correct value, the emulator attempts to write the correct value. This
error occurs when the vector table is in target memory and the write fails.
Action: Make sure the vector base register points to the correct location in target
memory and that the memory system is writeable and is operating correctly.
158
Trace vector modified to <TRACE_ENTRY_address> for single stepping
Cause: In order to step when using a foreground monitor, the trace vector must
contain the address of the monitor program’s TRACE_ENTRY label (which equals
the monitor base address plus 800H). The step command reads the trace vector on
each step to make sure it contains the correct address value. If the trace vector does
not contain the correct value, the emulator attempts to write the correct value. This
341
Chapter 9: Error Messages
68340 Emulator Messages
message informs you the emulator was successful in writing the correct value to the
trace vector.
159
Unable to set trace vector to <TRACE_ENTRY_address>; vector table in
TROM
Cause: In order to step when using a foreground monitor, the trace vector must
contain the address of the monitor program’s TRACE_ENTRY label (which equals
the monitor base address plus 800H). The step command reads the trace vector on
each step to make sure it contains the correct address value. If the trace vector does
not contain the correct value, the emulator attempts to write the correct value. This
error occurs when the vector table is in memory mapped as target ROM.
Action: If the vector table is really in target ROM memory, its trace vector must
already contain the correct address value.
160
Coverage not supported
Cause: You attempted to use the cov command for an emulator that does not
provide coverage memory.
161
Copy target image not supported
Cause: You attempted to use the cim command for an emulator that does not
support the command.
162
Double bus fault occurred
Cause: This message informs you of a double bus fault in the emulation
microprocessor. The most common cause of this error message is running or
stepping from target memory locations that do not exist.
163
Update HP64740 firmware to version A.02.02 or newer
Cause: The HP 64751 emulator requires version A.02.02 or newer of the analyzer
firmware.
Action: Refer to the "Updating Emulator/Analyzer Firmware" section in the
"Installation" chapter.
342
Chapter 9: Error Messages
68340 Emulator Messages
168
Can’t access module regs, addr space mask (@sd bit 6) is set
Cause: You have attempted to modify the mbar or cf_mbar register with a value
that masks supervisor data space by setting bit 6 (for example, reg mbar=4041).
The HP 64751 emulator requires an address space to access 68340 SIM registers
and, therefore, doesn’t let you set bit 6 in the mbar or cf_mbar register.
Action: Modify the mbar or cf_mbar registers with values that do not set bit 6.
168
Can’t access module regs, mbar (@sd bit 6) is set
Can’t access module regs, cf_mbar (@sd bit 6) is set
Cause: These errors occur if the user program sets bit 6 of the mbar register
(whose contents can be copied into the cf_mbar register with the sync sim
command) and the emulator needs to access other SIM or emulator configuration
registers.
Action: Modify the mbar or cf_mbar registers with values that do not set bit 6.
177
BDM communication failed
Cause: There was some problem with the serial communication interface with the
emulation processor’s Background Debug Mode (BDM).
Action: Initialize the emulator or cycle power. Then reenter the command. If the
same failure occurs, call your HP sales and service office.
178
Unable to run performance verification tests
Cause: The emulator was unable to run the performance verification tests.
Action: Make sure the emulator probe is connected correctly and that all cables are
secured. Make sure that the emulator probe is plugged into the demo target system
and that the demo target system power cable is connected to the HP 64700.
179
M68340 probe not connected or configured incorrectly
Cause: The emulator is reading an invalid identifier for the emulation probe.
Action: Make sure that the emulator probe cables are connected correctly. Also,
make sure that the probe is the 68340 probe.
343
Chapter 9: Error Messages
68340 Emulator Messages
179
Fuse F1 blown on HP64748C ABG Control Board
Cause: The emulator detects a blown fuse on the HP 64748C Emulation Control
Board.
Action: Contact your Hewlett-Packard Representative.
344
Chapter 9: Error Messages
General Emulator and System Messages
General Emulator and System Messages
201
Out of system memory
Cause: Macros and equates that you have defined have used all of the available
system memory.
Action: Delete some of the existing macros (mac -d <NAME>) and equates (equ
-d <NAME>), which will free additional memory.
204
FATAL SYSTEM SOFTWARE ERROR
205
FATAL SYSTEM SOFTWARE ERROR
208
FATAL SYSTEM SOFTWARE ERROR
Cause: The system has encountered an error from which it cannot recover.
Action: Write down the sequence of commands which caused the error. Cycle
power on the emulator and reenter the commands. If the error repeats, call your
local HP Sales and Service office for assistance.
206
Incompatible compatibility table entry
Cause: The emulation firmware (ROM) is not compatible with the analysis or
system firmware in your HP 64700 system.
Action: The ROMs in your emulator must be compatible with each other for your
emulation system to work correctly. Contact your Hewlett-Packard Representative.
300
Invalid option or operand
305
Invalid option or operand: %s
Cause: You have specified incorrect option(s) to a command. %s, if printed,
indicates the incorrect option(s).
Action: Reenter the command with the correct syntax. Refer to the on-line help
information.
345
Chapter 9: Error Messages
General Emulator and System Messages
307
Invalid expression: %s
Cause: You have entered an expression with incorrect syntax; therefore, it cannot
be evaluated. %s is the bad expression.
Action: Reenter the expression, following the syntax rules for that type of
expression. Refer to the command description to determine the expression type;
then refer to the expression syntax pages to determine the correct syntax for that
type.
308
Invalid number of arguments
Cause: You have either entered too many options to a command or an insufficient
number of options.
Action: Re-enter the command with correct syntax. Refer to the command syntax
pages in this manual for information.
310
Invalid address: %s
Cause: You specified an invalid address value as an argument to a command (other
than an analyzer command). For example, you may have specified digits that don’t
correspond to the base specified, or you forgot to precede a hexadecimal letter digit
with a number (even zero (0)).
Action: Re-enter the command and the address specification. See the
<ADDRESS> and <EXPRESSION> syntax pages in the "Commands" chapter for
information on address specifications.
311
Invalid address range: %s
Cause: You specified an invalid address range as an argument to a command (other
than an analyzer command). For example, you may have specified digits that don’t
correspond to the base specified, or you forgot to precede a hexadecimal letter digit
with a number, or the upper boundary of the range you specified is less than the
lower boundary.
Action: Re-enter the command and the address specification. See the
<ADDRESS> and <EXPRESSION> syntax pages in the "Commands" chapter for
information on address specifications. Also, make sure that the upper boundary
specification is greater than the lower boundary specification (the lower boundary
must always precede the upper boundary on the command line).
346
Chapter 9: Error Messages
General Emulator and System Messages
312
Ambiguous address: %s
Cause: Certain emulators support segmentation or function code information in
addressing. The emulator is unable to determine which of two or more address
ranges you are referring to, based upon the information you entered.
Action: Re-enter the command and fully specify the address, including
segmentation or function code information.
313
Missing option or operand
Cause: You have omitted a required option to the command.
Action: Re-enter the command with the correct syntax. Refer to the "Commands"
chapter for further information on required syntax.
314
Option conflict: %s
Cause: You have entered a command with two options which cannot be used
together. For example, you might have entered tl -bx; you cannot ask for both a
binary and hexadecimal trace list dump.
Action: Reenter the command, specifying only non-conflicting options. Refer to
the command description to determine which options may be used together.
315
Invalid count: %s
Cause: This error occurs when the emulation system expects a certain number (of
arguments, for example), but you specify a different number.
Action: Enter the number the system expects to receive.
316
Invalid range expression: %s
Cause: In the tl command, you specified an illegal range. For example, you might
have specified tl -10..a.
Action: Use only legitimate range numbers in the tl command (-1024..1023); the
second range value must be greater than the first.
347
Chapter 9: Error Messages
General Emulator and System Messages
317
Range out of bounds: %s
Cause: In the tl command, you specified a range number which was greater than
the number of states available in the analyzer. For example, you might have
specified tl -2048..2048; the analyzer only has 1024 states.
Action: Specify range numbers between -1024 and 1023.
318
Count out of bounds: %s
Cause: You specified an occurrence count less than 1 or greater than 65535 for tg
or tif. For example, you might have entered tif 1 any 2 69234.
Action: Re-enter the command, specifying a count value from 1 to 65535. For
example: tif 1 any 2 65535.
319
Invalid base: %s
Cause: This error occurs if you have specified an invalid base in the tf command.
Action: Enter the help tf command to view the valid base options.
320
Invalid label: %s
Cause: You tried to define a label with characters other than letters, digits, or
underscores.
Action: Re-enter the tlb command with a label consisting only of letters, digits, or
underscores.
321
Label not defined: %s
Cause: You entered an analyzer expression in which the label was not present in
the analyzer label list. For example, if the label list includes addr, data, and stat,
you might have entered something such as tg lowerdata=24t. This error also
occurs if you try to delete a label that does not exist.
Action: You can re-enter the command, using one of the previously defined labels
and adjust the expression as necessary to accommodate the fit of that label to the
analyzer input lines. Or, you can define a new label using the tlb command, then
re-enter the analyzer command using the newly defined label.
348
Chapter 9: Error Messages
General Emulator and System Messages
400
Record checksum failure
Cause: During a transfer operation, the checksum specified in a file did not agree
with that calculated by the HP 64700.
Action: Retry the transfer operation. If the failure is repeated, make sure that both
your host and the HP 64700 data communications parameters are configured
correctly.
401
Records expected: %s; records received: %s
Cause: The HP 64700 received a different number of records than it expected to
receive during a transfer operation.
Action: Retry the transfer. If the failure is repeated, make sure that the data
communications parameters are set correctly on the host and on the HP 64700.
Refer to the "Installation" chapter for details.
410
File transfer aborted
Cause: A transfer operation was aborted due to a break received, most likely a
<CTRL>c from the keyboard.
Action: If you typed <CTRL>c, you probably did so because you thought the
transfer was about to fail. Retry the transfer, making sure to use the correct
command options. If you are unsuccessful, make sure that the data
communications parameters are set correctly on the host and on the HP 64700, then
retry the operation.
411
Severe error detected, file transfer failed
Cause: An unrecoverable error occurred during a transfer operation.
Action: Retry the transfer. If it fails again, make sure that the data
communications parameters are set correctly on the host and on the HP 64700.
Also make sure that you are using the correct command options, both on the
HP 64700 and on the host.
412
Retry limit exceeded, transfer failed
Cause: The limit for repeated attempts to send a record during a transfer operation
was exceeded, therefore the transfer was aborted.
349
Chapter 9: Error Messages
General Emulator and System Messages
Action: Retry the transfer. Make sure you are using the correct command options
for both the host and the HP 64700. The data communications parameters need to
be set correctly for both devices. Also, if you are in a remote location from the
host, it is possible that line noise may cause the failure.
413
Transfer failed to start
Cause: Communication link or transfer protocol incorrect.
Action: Check link and transfer options.
415
Timeout, receiver failed to respond
Cause: Communication link or transfer protocol incorrect.
Action: Check link and transfer options.
420
Unknown mode: %s
Cause: This error occurs when you have specified an unknown option in the stty
command.
Action: Enter the help stty command to view the valid options.
425
Load option conflict: %s and option: %s
Cause: Two or more options in the load command cannot be used together.
Action: Enter the help load command to view the options that cannot be used
together.
520
Equate not defined: %s
Cause: You tried to delete an equate that did not exist in the equate table. For
example suppose the equates a=1 and b=2 were in the equate table. If you typed
equ -d c, you would receive the above error message.
Action: Use equ to display the list of named equates before deleting equates.
600
Adjust PC failed during break
Cause: System failure or target condition.
Action: Run performance verification (pv command), and check target system.
350
Chapter 9: Error Messages
General Emulator and System Messages
602
Break failed
Cause: The b command was unable to break the emulator to the monitor.
Action: Determine why the break failed, then correct the condition and retry the
command. See message 608.
603
Read PC failed during break
Cause: System failure or target condition.
Action: Try again.
604
Disable breakpoint failed: %s
Cause: System failure or target condition.
Action: Run performance verification (pv command), and check target system.
605
Undefined software breakpoint: %s
Cause: The emulator has encountered a software breakpoint in your program that
was not inserted with the bp command.
Action: If your processor allows different software breakpoint instructions, either
modify the ones you inserted in your code, or modify the ones inserted by bp using
your emulator’s configuration options (cf command). If only one instruction is
available, remove those inserted in your code before assembly and link, then
reinsert them using the bp command.
606
Unable to run after CMB break
Cause: System failure or target condition.
Action: Run performance verification (pv command), and check target system.
608
Unable to break
Cause: This message is displayed if the emulator is unable to break to the monitor
because the emulation processor is reset, halted, or is otherwise disabled.
Action: First, look at the emulation prompt and other status messages displayed to
determine why the processor is stopped. If reset by the emulation controller, use
the b command to break to the monitor. If reset by the emulation system, release
351
Chapter 9: Error Messages
General Emulator and System Messages
that reset. If halted, try rst -m to get to the monitor. If there is a bus grant, wait for
the requesting device to release the bus before retrying the command. If there is no
clock input, perhaps your target system is faulty or you have configured the clock
wrong with cf clk. It’s also possible that you have configured the emulator to
restrict to real time runs, which will prohibit temporary breaks to the monitor.
610
Unable to run
Cause: System failure or target condition.
Action: Run performance verification (pv command), and check target system.
611
Break caused by CMB not ready
Cause: This status message is printed during coordinated measurements if the
CMB READY line goes false. The emulator breaks to the monitor. When CMB
READY is false, it indicates that one or more of the instruments participating in the
measurement is running in the monitor.
Action: None, information only.
612
Write to ROM break
Cause: This status message will be printed if you have set bc -e rom and the
emulation processor attempted a write to a memory location mapped as ROM.
Action: None (except troubleshooting your program).
613
Analyzer Break
Cause: Status message.
Action: None.
614
Guarded memory access break
Cause: This message is displayed if the emulation processor attempts to read or
write memory mapped as guarded.
Action: Troubleshoot your program; or, you may have mapped memory incorrectly.
352
Chapter 9: Error Messages
General Emulator and System Messages
615
Software breakpoint: %s
Cause: This status message will be displayed if a software breakpoint entered with
bp and enabled with bc -e bp is encountered during a program run. The emulator
is broken to the monitor. The string %s indicates the address where the breakpoint
was encountered.
Action: None.
616
BNC trigger break
Cause: This status message will be displayed if you have set bc -e bnct and the
BNC trigger line is activated during a program run. The emulator is broken to the
monitor.
Action: None.
617
CMB trigger break
Cause: This status message will be displayed if you have set bc -e cmbt and the
CMB trigger line is activated during a program run. The emulator is broken to the
monitor.
Action: None.
618
trig1 break
Cause: This status message will be displayed if you have set the analyzer to drive
trig1 upon finding the trigger, bc -e trig1 is set, and the analyzer has found the
trigger condition while tracing a program run. The emulator is broken to the
monitor.
Action: None.
619
trig2 break
Cause: This status message will be displayed if you have set the analyzer to drive
trig2 upon finding the trigger, bc -e trig2 is set, and the analyzer has found the
trigger condition while tracing a program run. The emulator is broken to the
monitor.
Action: None.
353
Chapter 9: Error Messages
General Emulator and System Messages
620
Unexpected software breakpoint
Cause: If you have enabled software breakpoints with bc -e bp, this message is
displayed if a software breakpoint instruction is encountered in your program that
was not inserted by bp and is therefore not in the breakpoint table.
Action: If your processor allows different software breakpoint instructions, either
modify the ones you inserted in your code, or modify the ones inserted by bp using
your emulator’s configuration options (cf command). If only one instruction is
available, remove those inserted in your code before assembly and link, then
reinsert them using the bp command.
621
Unexpected step break
Cause: System failure.
Action: Run performance verification (pv command).
622
%s
Cause: Monitor specific message.
Action: None.
623
CMB execute break
Cause: This message occurs when coordinated measurements are enabled and an
EXECUTE pulse causes the emulator to run; the emulator must break before
running.
Action: This is a status message; no action is required.
624
Configuration aborted
Cause: Occurs when a <CTRL>c is entered during cf display command.
Action: None.
625
Invalid configuration value: %s
Cause: You have entered a configuration option incorrectly, such as typing cf
rrt=enn instead of cf rrt=en.
354
Chapter 9: Error Messages
General Emulator and System Messages
Action: Re-enter the configuration command, specifying only the correct options.
Enter the help cf command for a description of the configuration options for your
emulator.
626
Configuration failed; setting unknown: %s=%s
Cause: Target condition or system failure.
Action: Check target system, and run performance verification (pv command).
627
Invalid configuration item: %s
Cause: You specified a non-existent configuration item in the cf command. For
example, you would see this message if you tried to enter cf bob since there is no
bob configuration item for the emulator.
Action: Re-enter the command, specifying only configuration items that are
supported by your emulator. Enter the help cf command for a description of the
configuration options for your emulator.
628
Guarded memory break: <address>
Cause: A memory access to a location mapped as guarded memory has occurred
during execution of the user program.
Action: Investigate the cause of the guarded memory access by the user program.
628
Write to ROM break: <address>
Cause: When the rom break condition is enabled, a memory write access to a
location mapped as ROM has occurred during execution of the user program.
Action: Investigate the cause of the write to ROM by the user program. You can
disable the break condition with the bc -d rom command.
630
Register access aborted
Cause: Occurs when a <CTRL>c is entered during register display.
Action: None.
631
Unable to read registers in class: %s
Cause: The emulator was unable to read the registers you requested.
355
Chapter 9: Error Messages
General Emulator and System Messages
Action: To resolve this, you must look at the other status messages displayed.
Most likely, the emulator was unable to break to the monitor to perform the register
read. See message 608.
632
Unable to modify register: %s=%s
Cause: The emulator was unable to modify the register you requested.
Action: To resolve this, you must look at the other status messages displayed. It’s
likely that emulator was unable to break to the monitor to perform the register
modification. See message 608.
634
Display register failed: %s
Cause: The emulator was unable to display the register you requested.
Action: To resolve this, you must look at the other status messages displayed. It’s
likely that emulator was unable to break to the monitor to perform the register
display. See message 608.
636
Register not writable: %s
Cause: This error occurs when you attempt to modify a read only register.
Action: If this error occurs, you cannot modify the contents of the register with the
reg command.
637
Register class cannot be modified: %s
Cause: You tried to modify a register class instead of an individual register.
Action: You can only modify individual registers. Refer to the reg command
description for a list of register names.
640
Unable to reset
Cause: Target condition or system failure.
Action: Check target system, and run performance verification (pv command).
641
Unable to reset into monitor
Cause: You have entered a rst -m command and the emulator is unable to break
into the monitor.
356
Chapter 9: Error Messages
General Emulator and System Messages
Action: Reload monitor (rst for background).
650
Unable to configure break on write to ROM
Cause: The emulator controller is unable to execute the bc -e rom command
correctly, possibly because the emulator was left in an unknown state or because of
a hardware failure.
Action: Initialize the emulator or cycle power. Then reenter the command. If the
same failure occurs, call your HP sales and service office.
651
Unable to configure break on software breakpoints
Cause: The emulator controller is unable to execute the bc -e bp command,
possibly because the emulator is in an unknown state or because of a hardware
failure.
Action: Initialize the emulator or cycle power, then re-enter the command. If the
same failure occurs, call your HP sales and service office.
652
Break condition must be specified
Cause: You entered bc -e or bc -d without specifying a break condition to enable
or disable.
Action: Re-enter the bc command along with the enable/disable flag and the break
condition you wish to modify.
653
Break condition configuration aborted
Cause: Occurs when <CTRL>c is entered during bc display.
Action: None.
661
Software breakpoint break condition is disabled
Cause: You entered the bp command and options; however, the software
breakpoint break condition is disabled.
Action: Enable the software breakpoint feature with bc -e bp, then enter the
desired breakpoints with bp.
357
Chapter 9: Error Messages
General Emulator and System Messages
663
Specified breakpoint not in list: %s
Cause: You tried to enable a software breakpoint (bp -e <ADDRESS>) that was
not previously defined. The string %s prints the address of the breakpoint you
attempted to enable.
Action: Insert the breakpoint into the table and memory by typing bp
<ADDRESS>.
664
Breakpoint list full; not added: %s
Cause: The software breakpoint table is full. The breakpoint you just requested,
with address %s, was not inserted.
Action: Remove breakpoints that are no longer in use with bp -r <ADDRESS>.
Then insert the new breakpoint.
665
Enable breakpoint failed: %s
Cause: System failure or target condition.
Action: Check memory mapping and configuration questions.
666
Disable breakpoint failed: %s
Cause: System failure or target condition.
Action: Check memory mapping and configuration questions.
667
Breakpoint code already exists: %s
Cause: You attempted to insert a breakpoint with bp <ADDRESS>; however,
there was already a software breakpoint instruction at that location which was not
already in the breakpoint table.
Action: Your program code is apparently using the same breakpoint instruction as
bp. If multiple breakpoint instructions are available on your processor, either
change those in your program code or modify the one bp uses with your emulator’s
configuration options (cf command). If only one instruction is available, remove
the breakpoints from your program code and use bp to insert breakpoints.
358
Chapter 9: Error Messages
General Emulator and System Messages
668
Breakpoint not added: %s
Cause: You tried to insert a breakpoint in a memory location which was not
mapped or was mapped as guarded memory.
Action: Insert breakpoints only within memory ranges mapped to emulation or
target RAM or ROM.
669
Breakpoint remove aborted
Cause: Occurs when <CTRL>c is entered during a bp -r command.
Action: None.
670
Breakpoint enable aborted
Cause: Occurs when <CTRL>c is entered during a bp -e command.
Action: None.
671
Breakpoint disable aborted
Cause: Occurs when <CTRL>c is entered during a bp -d command.
Action: None.
680
Stepping failed
Cause: Stepping has failed for some reason.
Action: Usually, this error message will occur with other error messages. Refer to
the descriptions of the accompanying error messages to find out more about why
stepping failed.
682
Invalid step count: %s
Cause: You specified an non-cardinal value for a step count in the s command
(such as entering s 22.1).
Action: Reenter the step command, using only cardinal values (positive integers)
for the step count.
684
Failed to disable step mode
Cause: System failure.
359
Chapter 9: Error Messages
General Emulator and System Messages
Action: Run performance verification (pv command).
685
Stepping aborted
Cause: This message is displayed if a break was received during a s (step)
command with a step count of zero (0). The break could have been due to any of
the break conditions in bc or a <CTRL>c break.
Action: None.
686
Stepping aborted; number steps completed: %d
Cause: This message is displayed if a break was received during a s (step)
command with a step count greater than zero. The break could have been due to
any of the break conditions in bc or a <CTRL>c break. The number of steps
completed is displayed.
Action: None.
688
Step display failed
Cause: System failure or target condition.
Action: Check memory mapping and configuration questions.
689
Break due to cause other than step
Cause: An activity other than a step command caused the emulator to break. This
could include any of the break conditions in a bc command or a <CTRL>c break.
Action: None.
692
Trace error during CMB execute
Cause: System failure.
Action: Run performance verification (pv command).
693
CMB execute; run started
Cause: This status message is displayed when you are making coordinated
measurements. The CMB /EXECUTE pulse has been received; the emulation
processor started running at the address specified by the rx command.
360
Chapter 9: Error Messages
General Emulator and System Messages
Action: None; information only.
694
Run failed during CMB execute
Cause: System failure or target condition.
Action: Run performance verification (pv command), and check target system.
700
Target memory access failed
Cause: This message is displayed if the emulator was unable to perform the
requested operation on memory mapped to the target system.
Action: In most cases, the problem results from the emulator’s inability to break to
the monitor to perform the operation. See message 608.
702
Emulation memory access failed
Cause: System failure.
Action: Run performance verification (pv command).
707
Request access to guarded memory: %s
Cause: The address or address range specified in the command included addresses
within a range mapped as guarded memory. When the emulator attempts to access
these during command processing, the above message is printed, along with the
specific address or addresses accessed.
Action: Re-enter the command and specify only addresses or address ranges within
emulation or target RAM or ROM. Or, you can remap memory so that the desired
addresses are no longer mapped as guarded.
710
Memory range overflow
Cause: Accessing a word or short word, for example "m -dw 0ffffffff" will cause a
rounding error that overflows physical memory.
Action: Reduce memory display request.
361
Chapter 9: Error Messages
General Emulator and System Messages
720
Invalid map term number: %s
Cause: You attempted to delete a mapper term that does not exist. For example,
you may have tried map -d 17 (there are a maximum of 8 mapper terms). Or you
may have tried map -d 2, when only one mapper term has been defined.
Action: Use the map command to determine the numbers of the terms currently
mapped. Then delete the appropriate mapper term.
721
No map terms available; maximum number already defined
Cause: You tried to add more than 8 mapper terms.
Action: Either combine map ranges to conserve on the number of terms or delete
mapper terms that aren’t needed to free another mapper term.
723
Invalid map address range: %s
Cause: You specified an invalid address range as an argument to the map
command. For example, you may have specified digits that don’t correspond to the
base specified, or you forgot to precede a hexadecimal letter digit with a number, or
the upper boundary of the range you specified is less than the lower boundary.
Action: Re-enter the map command and the address specification. See the
<ADDRESS> and <EXPRESSION> syntax pages in the "Commands" chapter for
information on address specifications. Also, make sure that the upper boundary
specification is greater than the lower boundary specification (the lower boundary
must always precede the upper boundary on the command line).
725
Unable to load new memory map; old map reloaded
Cause: There is not enough emulation memory left for this request.
Action: Reduce the amount of emulation memory requested.
726
Unable to reload old memory map; hardware state unknown
Cause: System failure.
Action: Run performance verification (pv command).
362
Chapter 9: Error Messages
General Emulator and System Messages
730
Invalid memory map type: %s
Cause: You specified a memory type while mapping that is not one of the
supported types: eram, erom, tram, trom, or grd.
Action: Re-enter the map command, specifying only one of the five types listed
above.
731
Invalid memory map attribute: <attribute>
Cause: You have entered an unknown attribute when mapping a range of memory.
Action: Only the dp, dsi, and cs0 attributes are available; the dp and dsi attributes
are only valid for emulation memory ranges.
732
Invalid memory type for ’other’ range: %s
Cause: The unmapped memory type must be tram, trom, or grd. If you see the
above message, you have tried to map the "other" range to eram or erom.
Action: Map the "other" range to tram, trom, or grd.
734
Map range overlaps with term: %d
Cause: You entered a map term whose address range overlaps with one already
mapped. For example, you may have entered a term map 1000..2fff eram, then
tried to enter a term map 2000..3fff erom.
Action: Re-enter the map term so that ranges do not overlap, or combine terms and
change the memory type.
736
Memory not mapped as emulation: %s
Cause: This error occurs when a feature available only for emulation memory is
attempted with target memory.
Action: You must remap the address range as emulation memory.
740
I/O port access failed
Cause: The emulator was unable to read or write the port specified in the io
command. This message is also printed if your processor does not support separate
I/O.
363
Chapter 9: Error Messages
General Emulator and System Messages
Action: If your processor does not support separate I/O, use the m command to
modify I/O ports. Otherwise, retry the operation, and make sure that you are
specifying a valid I/O address.
752
Copy memory aborted; next destination: %s
754
Memory modify aborted; next address: %s
756
Memory search aborted; next address: %s
Cause: One of these message is displayed if a break occurs during processing of
the cp, m, or ser commands, respectively. The break could result from any of the
break conditions (except bp) or could have resulted from a <CTRL>c break.
Action: Retry the operation. If breaks are occurring continuously, you may wish to
disable some of the break conditions with the bc command.
800
Invalid command: %s
Cause: You have entered a command which is not part of the standard Terminal
Interface command set (documented in this manual) and was not found in the
currently defined macros.
Action: Enter only commands defined in this manual or in the macro set. You can
display the macro set using mac. You can rename commands or name command
groups using the mac command.
801
Invalid command group: %s
Cause: This error occurs when you specify an invalid group name in the help -s
<group> command.
Action: Enter the help command with no options for a listing of the valid group
names.
802
Invalid command format
Cause: This error occurs when an invalid macro is entered, for example, mac
{help;{}.
Action: Refer to the mac command description.
364
Chapter 9: Error Messages
General Emulator and System Messages
807
Macro list full; macro not added
Cause: The maximum number of macros have been defined.
Action: You must delete macros before adding any new macros.
809
Macro buffer full; macro not added
Cause: This error occurs when the memory reserved for macros is all used up.
Action: You must delete macros to reclaim memory in the macro buffer.
812
Invalid macro name: %s
Cause: You tried to delete a macro that did not exist; or you tried to define a new
macro with a name containing characters other than letters, digits, or underscores.
Action: Use the mac command to display the names of macros in the macro table
before deleting them with mac -d <NAME>. Define new macro names using only
letters, digits, and underscore characters.
813
Command line too long; maximum line length: %d
Cause: This error occurs when the command line exceeds the maximum number of
characters.
Action: Split the command line into two command lines.
814
Command line too complex
Cause: There was not enough memory for the expressions in the command line.
Action: Split up the command line, or use fewer expressions.
815
Missing macro parameter: %s
Cause: This error occurred because you did not include a parameter with the
specified mac command for macro expansion.
Action: Enter the command again, and include the appropriate parameter for the
macro expansion.
816
Command line too complex
Cause: Too many expression operators are used.
365
Chapter 9: Error Messages
General Emulator and System Messages
Action: Split up the command line, or use fewer expressions.
818
Command line too complex
Cause: A maximum nesting level has been exceeded for nested command
execution.
Action: Reduce the number of nesting levels.
820
Unmatched quote encountered
Cause: In entering a string, such as with the echo command, you didn’t properly
match the string delimiters (either ‘‘ or ""). For example, you might have entered
echo "set S1 to off
Action: Re-enter the command and string, making sure to properly match opening
and closing delimiters. Note that both delimiters must be the same character. For
example: echo "set S1 to off".
822
Unmatched command group encountered
Cause: You entered the mac or rep command group without matching braces {}.
For example: mac test={rst -m;cf or rep 2 {rst -m;map.
Action: Re-enter the command, making sure to match braces around commands
you want grouped into the macro or repeat. For example: mac test={rst -m;cf}.
824
Maximum number of arguments exceeded
Cause: Exceeding the limit of 100 arguments per command.
Action: Reduce the number of arguments in the command.
826
Maximum argument buffer space exceeded
Cause: Exceeding space limits for argument lists.
Action: Reduce request.
840
Invalid date: %s
Cause: You have specified the date format incorrectly in the dt command.
366
Chapter 9: Error Messages
General Emulator and System Messages
Action: Re-enter the command with the correct date format. Refer to the dt
command description for the correct format.
842
Invalid time: %s
Cause: You have incorrectly specified the time format in the dt command.
Action: Re-enter the command with the correct time format. Refer to the dt
command description for the correct format.
844
Invalid repeat count: %s
Cause: You entered a non cardinal value for the repeat count in the rep command,
such as rep 22.1 <command_group>.
Action: Re-enter the rep command, specifying only a cardinal number (positive
integer) for the repeat count.
850
Attempt to load code outside of allocated bounds
Cause: This error occurs when the lcd command attempts to load an absolute file
that contains code or data outside the range allocated for system code.
Action: Generally, you will not use the lcd command. The lcd command is
intended to be used by high-level interfaces to the HP 64700.
875
Invalid syntax for global or user symbol name: %s
Cause: This error occurs when you enter a global or user symbol name with
incorrect syntax.
Action: Make sure that you enter the global or user symbol name using the correct
syntax. When specifying a global symbol, make sure that you precede the global
symbol with a colon (for example, :glb_sym). When specifying a user symbol
(created with the sym command), make sure that you enter the name correctly
without a colon.
876
Invalid syntax for local symbol or module: %s
Cause: This error occurs when you enter a local symbol or module name with
incorrect syntax.
367
Chapter 9: Error Messages
General Emulator and System Messages
Action: When entering a local symbol name using the sym command, make sure
that you specify the module name, followed by a colon, then the symbol name (for
example module:loc_sym). Make sure that you specify the module name correctly.
877
Symbol not found: %s
Cause: This occurs when you try to enter a symbol name that doesn’t exist.
Action: Enter a valid symbol name.
878
Symbol cannot contain wildcard in this context
Cause: You tried to enter a global, local, or user symbol name using the wildcard
(*) incorrectly.
Action: When you enter the symbol name again, include the wildcard (*) at the end
of the symbol.
879
Symbol cannot contain text after the wildcard
Cause: You tried to include text after the wildcard specified in the symbol name
(for example, sym*text).
Action: Enter the symbol again, but don’t include text after the wildcard (*).
880
Conflict between expected and received symbol information
Cause: The information you supplied in a symbol definition is not what the
HP 64700 expected to receive.
Action: Make sure that all symbols in the symbol file are defined correctly. Verify
that there are no spaces in the address definitions for the symbols in the symbol file
being downloaded.
881
Ascii symbol download failed
Cause: This error occurs because the system is out of memory.
Action: You must either reduce the number of symbols to be loaded, or free up
additional system space and try the download again.
368
Chapter 9: Error Messages
General Emulator and System Messages
882
No module specified for local symbol
Cause: This error occurs because you tried to specify a local symbol name without
specifying the module name where the symbol is located.
Action: Enter the module name where the local symbol is located, followed by a
colon, then the local symbol name.
901
Invalid firmware for emulation subsystem
Cause: This error occurs when the HP 64700 system controller determines that the
emulation firmware (ROM) is invalid.
Action: This message is not likely to occur unless you have upgraded the ROMs in
your emulator. Be sure that the correct ROM is installed in the emulation controller.
902
Invalid analysis subsystem; product address: %s
Cause: This error occurs when the HP 64700 system controller determines that the
analysis firmware (ROM) is invalid.
Action: This message is not likely to occur unless you have upgraded the ROMs in
your emulator. Be sure that the correct ROMs are installed in the analyzer board.
903
Invalid ET subsystem; product address: %s
Cause: Detects an invalid ET. Used only internally.
Action: None.
904
Invalid auxiliary subsystem; product address: %s
Cause: For future products.
Action: None.
911
Lab firmware for emulation subsystem
Cause: This message should never occur. It shows that you have an unreleased
version of emulation firmware.
Action: None.
369
Chapter 9: Error Messages
General Emulator and System Messages
912
Lab firmware analysis subsystem; product address: %s
Cause: This message should never occur. It shows that you have an unreleased
version of analysis firmware.
Action: None.
913
Lab firmware subsystem; product address: %s
Cause: This message should never occur. It shows that you have an unreleased
version of system controller firmware.
Action: None.
914
Lab firmware auxiliary subsystem; product address: %s
Cause: This message should never occur. It shows that you have an unreleased
firmware version of the auxiliary subsystem.
Action: None.
370
Chapter 9: Error Messages
Analyzer Messages
Analyzer Messages
1000
Conflicting disassembler option: <option>
Cause: This error occurs when you attempt to specify inverse assembly options (tl
-o<ialopts>) which are not allowed with each other.
Action: You must not use conflicting inverse assembly options in the same trace
list command.
1001
Invalid disassembler option: <option>
Cause: The <ialopts> option specified with the tl -o command is not valid.
Action: Refer to the tl command description for a list of the valid options.
1102
Invalid bit range; crosses two multiples of 16: <sig#>..<sig#>
Cause: This error occurs when defining trace labels. A trace label may not contain
trace signals crossing two 16-bit boundaries. For example, the command "tlb
name 1..32" will cause this error because "name" contains signals which cross the
15-16 and 31-32 16-bit boundaries.
Action: Redefine your trace label so that no more than one 16-bit boundary is
crossed.
1103
Invalid bit range; out of bounds: <sig#>..<sig#>
Cause: This error occurs when defining trace labels, and you have attempted to
assign non-existent trace signals to a label.
Action: Enter the trace activity command to view the trace signals present, and use
only these signals when defining trace labels.
1104
Invalid bit range; too wide: <sig#>..<sig#>
Cause: This error occurs when defining trace labels, and you have attempted to
assign more than 32 trace signals to a label.
Action: Use more than one trace label to define over 32 trace signals.
371
Chapter 9: Error Messages
Analyzer Messages
1105
Unable to delete label; used by emulation analyzer: <label>
Cause: This error occurs when you attempt to delete an emulation trace label
which is currently being used as a qualifier in the emulation trace specification or is
currently specified in the emulation trace format.
Action: Display the emulation trace sequencer specification in the easy
configuration, display the emulation trace patterns in the complex configuration, or
display the trace format to see where the label is used. Also, you should check tpq
for uses of that label. You must change the pattern or format specification to
remove the label before you can delete it.
1108
Unable to redefine label; used by emulation analyzer: <label>
Cause: This error occurs when you attempt to redefine an emulation trace label
which is currently used as a qualifier in the emulation trace specification.
Action: Display the emulation trace sequencer specification in the easy
configuration, display the emulation trace patterns in the complex configuration, or
display the emulation trace format to see where the label is used. You must change
the pattern or format specification to remove the label before you can redefine it.
1130
Illegal base for count display
Cause: When specifying the trace format, counts may only be displayed relative or
absolute. When counting states, the count is always displayed as a decimal number.
Action: Respecify the trace format without using a base for the count column.
Also, you can use ",A" to specify that counts be displayed absolute, or you can use
",R" to specify that counts be displayed relative.
1131
Illegal base for mnemonic disassembly display
Cause: When specifying the trace format, you cannot specify a number base for the
column containing mnemonic information.
Action: Respecify the trace format without using a base for the mnemonic column.
1132
Illegal base for sequencer display
Cause: When specifying the trace format, you cannot specify a number base for the
column containing sequencer information.
Action: Respecify the trace format without using a base for the sequencer column.
372
Chapter 9: Error Messages
Analyzer Messages
1133
Trace format command failed; using old format
Cause: This error occurs when the trace format command fails for some reason.
This error message always occurs with another error message.
Action: Refer to the "Action" description for the other error message displayed.
1138
Illegal width for symbol display: %s
Cause: This error occurs when the value specified for the trace format address field
width is not valid.
Action: Enter the tf command again, and specify the width of the address field for
symbol display within the range of 4 to 55.
1139
Illegal width for addr display, mne not specified
Cause: This error occurs when you specify a width for the address field in the tf
command, but do not include the mne option.
Action: Enter the command again, and include the mne option.
1140
Symbol display unsupported
Cause: This error occurs when you try to display symbols in the trace list, but the
emulator you are using doesn’t support symbols.
Action: Enter the tl command again, but don’t try to display symbols.
1141
Symbol display unavailable without mne field
Cause: This error occurs when you try to display symbols, but have not included
the mne option to the tf command.
Action: Don’t try to display symbols unless the mne field has already been
specified.
1202
Trigger position out of bounds: <bounds>
Cause: This error occurs when you attempt to specify a number of lines to appear
either before or after the trigger which is greater than the number of lines allowed.
The <bounds> string indicates the incorrect range that you typed (not the correct
limits on the range).
373
Chapter 9: Error Messages
Analyzer Messages
Action: Be sure that the trigger position specified is within the range -1024 to 1023.
1207
Invalid clock channel: <name>
Cause: Valid clock channels are L, M, and N.
Action: Respecify the command using valid clock channels.
1209
Operator must be "and" or "or": <expression>
Cause: When combining trace labels to specify trace patterns (in simple
expressions or with the tpat command), an operator of either "and" or "or" must
appear between the label qualifiers.
Action: Refer to the "Qualifying Trigger and Store Conditions" section of the
"Using the Emulation Analyzer - Easy Configuration" chapter.
1210
Illegal mix of = and !=
Cause: When combining trace labels to specify patterns (in simple expressions or
with the tpat command), all labels must either be equal to values or not equal to
values.
Action: Refer to the "Qualifying Trigger and Store Conditions" section of the
"Using the Emulation Analyzer - Easy Configuration" chapter.
1211
Illegal mix of and/or
Cause: When combining trace labels to specify patterns (in simple expressions or
with the tpat command), all label qualifiers must either be ANDed together or
ORed together. You cannot mix these operators.
Action: Refer to the "Qualifying Trigger and Store Conditions" section of the
"Using the Emulation Analyzer - Easy Configuration" chapter.
1212
Conflict with overlapping label: <label>
Cause: When combining trace labels to specify patterns (in simple expressions or
with the tpat command), you cannot combine labels which are defined for common
trace signals. For example, the following easy configuration commands will result
in this error: tlb low8 0..7; tlb low16 0..15; tg low8=0 and low16=1.
Action: Either omit one of the overlapping labels, or redefine your labels so that
they do not contain common trace signals. You could also circumvent this error by
374
Chapter 9: Error Messages
Analyzer Messages
using don’t cares in the appropriate places; for the example shown in cause, you
could specify patterns tg low8=0xx0xY and low16=1.
1213
Illegal mix of !=/and
Cause: When combining trace labels to specify patterns (in simple expressions or
with the tpat command), labels which are not equal to values must be ORed
together so that the entire pattern specifies a "not equals" condition.
Action: Refer to the "Qualifying Trigger and Store Conditions" section of the
"Using the Emulation Analyzer - Easy Configuration" chapter.
1214
Illegal mix of =/or
Cause: When combining trace labels to specify patterns (in simple expressions or
with the tpat command), labels which are equal to values must be ANDed together
so that the entire pattern specifies an "equals" condition.
Action: Refer to the "Qualifying Trigger and Store Conditions" section of the
"Using the Emulation Analyzer - Easy Configuration" chapter.
1215
Comparator must be = or !=: <label>
Cause: When combining trace labels to specify patterns (in simple expressions or
with the tpat command), the value of the label can only be specified with the "=" or
"!=" operators.
Action: Refer to the "Qualifying Trigger and Store Conditions" section of the
"Using the Emulation Analyzer - Easy Configuration" chapter.
1217
Illegal pattern name: <name>
Cause: Valid pattern names are p1 through p8.
Action: Use only valid pattern names.
1218
Illegal comparator for range qualifier: !=
Cause: When specifying a range with the trng command, you cannot use the"!="
operator.
Action: Use the "!r" range name.
375
Chapter 9: Error Messages
Analyzer Messages
1219
Range cannot be combined with any other qualifier
Cause: For example, the following easy configuration command will result in this
error: tsto addr=400..4ff and data=40.
Action: Do not attempt to combine labels when using range qualifiers.
1221
Range resource in use
Cause: This error occurs when you attempt to use two different range expressions
in the "easy" configuration trace specification or when you attempt to redefine the
"complex" configuration range resource while it is currently being used as a
qualifier in the trace specification.
Action: Only one range expression may be used in the "easy" configuration trace
specification. In the "complex" configuration, display the sequencer specification
to see where the range resource is being used and remove it; then, you can redefine
the range resource.
1224
Sequence term number out of range: <term>
Cause: This error occurs when a sequencer qualification command (tif, telif, tsq,
or tsto) specifies a non-existent sequence term. The easy configuration sequencer
may have a maximum of 4 sequence terms. Eight sequence terms exist in the
complex configuration sequencer.
Action: Re-enter the command using an existing sequence term.
1225
Sequence term not contiguous: <term>
Cause: This error occurs when you attempt to insert a sequence term which is not
between existing terms or after the last term. For example, the following easy
configuration commands will result in this error: tg any; tsq -i 4.
Action: Be sure that the sequence term you enter is either between existing
sequence terms or after the last sequence term.
1226
Too many sequence terms
Cause: This error occurs when you attempt to insert more than 4 sequence terms.
Action: Do not attempt to insert more than 4 sequence terms.
376
Chapter 9: Error Messages
Analyzer Messages
1227
Sequence term not defined: <term>
Cause: This error occurs when you attempt to delete, or specify a primary branch
expression for, a sequence term number which is possible, but which is not
currently defined.
Action: Insert the sequence term, and respecify the primary branch expression for
that term.
1228
One sequence term required
Cause: This error occurs when you attempt to delete terms from the sequencer
when only one term exists.
Action: At least one term must exist in the sequencer. Do not attempt to delete
sequence terms when only one exists.
1234
Invalid occurrence count: <number>
Cause: Occurrence counts may be from 1 to 65535.
Action: Re-enter the command with a valid occurrence count.
1235
Illegal threshold value: <value>
Cause: Threshold voltage specifications may be from -6.4 V to +6.35 V in
increments of 0.05 V.
Action: Re-enter the command with a valid threshold voltage.
1239
Clock speed not available with current count qualifier.
Cause: This error occurs when you attempt to specify a fast (F) or very fast (VF)
maximum qualified clock speed when counting time (tcq time). This error also
occurs when you attempt to specify a very fast (VF) maximum qualified clock
speed when counting states (for example, tcq addr=400).
Action: Change the count qualifier; then, re-enter the command.
1240
Count qualifier not available with current clock speed.
Cause: This error occurs when you attempt to specify the "time" count qualifier
when the current maximum qualified clock speed is fast (F) or very fast (VF). This
377
Chapter 9: Error Messages
Analyzer Messages
error also occurs when you attempt to specify a "state" count qualifier when the
maximum qualified clock speed is fast (F).
Action: Change the clock speed; then, change the count qualifier.
1241
Invalid qualifier resource or operator: <expression>
Cause: When specifying complex expressions, you have either specified an illegal
pattern or used an illegal operator.
Action: Refer to the "Using Complex Expressions" section of the "Using the
Emulation Analyzer - Complex Configuration" chapter for information on valid
patterns and operators.
1245
Range qualifier not accessible in easy configuration
Cause: This error occurs when you attempt to use the trng command in the easy
configuration.
Action: Changing into the complex configuration will allow you to use the trng
command; otherwise, specify the range in easy configuration command expressions.
1246
Pattern qualifiers not accessible in easy configuration
Cause: This error occurs when you attempt to use the tpat command in the easy
configuration.
Action: Changing into the complex configuration will allow you to use the tpat
command; otherwise, specify the patterns in easy configuration command
expressions.
1248
Range term used more than once
Cause: This error occurs when you attempt to use the range resource more than
once in a sequencer branch expression.
Action: You cannot use the range resource more than once in a sequencer branch
expression.
1249
Invalid qualifier expression: <expression>
Cause: This error message is shown with the errors that occur when patterns, the
range, or the arm condition is used more than once within a set. This error message
378
Chapter 9: Error Messages
Analyzer Messages
also occurs when intraset operators are not the same. For example, the following
complex expression will result in this error: p1 ~ p2 | p3.
Action: Refer to the "Using Complex Expressions" section of the "Using the
Emulation Analyzer - Complex Configuration" chapter for information on valid
patterns and operators.
1250
Arm term used more than once
Cause: This error occurs when you attempt to use the "arm" qualifier more than
once in a sequencer branch expression.
Action: You cannot use the "arm" qualifier more than once in a sequencer branch
expression.
1251
Trigger term cannot be term 1
Cause: This error occurs when to attempt to specify the first sequence term as the
trigger term. The trigger term may be any term but the first.
Action: Respecify the trigger term as any other sequence term.
1253
Invalid pod number: <pod#>
Cause: This error message occurs when you attempt to specify a slave clock for a
non-existent analyzer pod.
Action: Use the trace activity command to display the valid pod numbers, and use
only these numbers when entering commands.
1302
Trig1 signal cannot be driven and received
Cause: This error occurs when you attempt to specify the internal trig1 signal as
the trace arm condition while the same analyzer’s trigger output is currently driving
the trig1 signal. This error also occurs if you attempt to specify that the trigger
output drive the internal trig1 signal while that signal is currently specified as the
arm condition for the same analyzer.
Action: You can either change the arm or the trigger output specification; in either
case, make sure that they do not use the same internal signal.
379
1303
Trig2 signal cannot be driven and received
Cause: This error occurs when you attempt to specify the internal trig2 signal as
the trace arm condition while the same analyzer’s trigger output is currently driving
the trig2 signal. This error also occurs if you attempt to specify that the trigger
output drive the internal trig2 signal while that signal is currently specified as the
arm condition for the same analyzer.
Action: You can either change the arm or the trigger output specification; in either
case, make sure that they do not use the same internal signal.
1305
CMB execute; emulation trace started
Cause: This status message informs you that an emulation trace measurement has
started as a result of a CMB execute signal (as specified by the "tx -e" command).
380
10
Specifications and Characteristics
381
Chapter 10: Specifications and Characteristics
Emulator Specifications and Characteristics
Emulator Specifications and Characteristics
This section contains the following types of emulator specifications and
characteristics:
•
Electrical characteristics (including emulator timing).
•
Physical characteristics.
•
Environmental characteristics.
Electrical
This section describes the electrical characteristics of the HP 64751 68340
Emulator and the HP 64700 Card Cage.
Electrical Characteristics of the HP 64751 Emulator
The emulator requires some control signals and power supply in order to run.
Therefore, a target system is required in order to use the emulator. The demo board
that is included with the emulator is one such minimum target system.
DC Characteristics. The DC characteristics of the HP 64751 emulator’s active
probe are listed in the following table.
382
Chapter 10: Specifications and Characteristics
Emulator Specifications and Characteristics
DC Electrical Specifications
Characteristic
Symbol
Min
Max
Unit
Input High Voltage (except clock)
VIH
2.0
VCC
V
Input Low Voltage
VIL
GND
0.8
V
Input Leakage Current, GND≤Vin≤VCC
BR, BGACK, IRQx
Iin
-2.5
2.5
Input High Current
BERR, DSACKx
RESET, HALT
IIH
—
—
25
50
Input Low Current
BERR, DSACKx
RESET, HALT
IIL
—
—
-0.25
-1.0
2.4
2.4
—
—
—
—
—
—
0.5
0.5
0.5
0.5
—
—
2.2
2.2
—
20
—
—
100
50
Output High Voltage, IOH = -0.8 mA
A0-A23, AS, BG, D0-D15, DS, R/W,
RMC, SIZ0-SIZ1, FC0-FC3
VOH
Output Low Voltage
IOL = 2.0 mA A0-A23, SIZ0-SIZ1, FC0-FC3
IOL = 4.5 mA R/W, RMC
IOL = 20 mA AS, D0-D15, DS
IOL = 14 mA RESET, HALT
VOL
Power Dissipation
TA = 0°C
TA = 70°C
PD
Capacitance, Vin = 0 V, TA = 25°C, f = 1 MHz
Cin
Load Capacitance
A0-A31, R/W, SIZ0-SIZ1, FC0-FC3
All Other
CL
µA
µA
mA
V
V
W
pF
pF
AC Characteristics. The AC characteristics of the HP 64751 emulator’s active
probe are listed in the following tables.
383
Chapter 10: Specifications and Characteristics
Emulator Specifications and Characteristics
AC Electrical Specifications (64751-66508 and higher active probe board numbers) — Clock
Timing
MC68340
25.16 MHz
Num.
Characteristic
HP 64751
Symbol
Min
Max
Min
Max
Unit
fsys
dc
25.16
dc
25.16
MHz
fXTAL
25
50
25
50
kHz
On-Chip VCO System Frequency
fsys
0.13
25.16
0.13
25.16
MHz
On-Chip VCO Frequency Range
fVCO
0.1
50.3
0.1
50.3
MHz
Crystal Oscillator Startup Time
trc
—
20
—
20
ms
CLKOUT Period
tcyc
40
—
40
—
ns
2,3
CLKOUT Pulse Width
tCW
19
—
19
—
ns
4,5
CLKOUT Rise and Fall Times
tCrf
—
4
—
4
ns
System Frequency (See Note)
Crystal Frequency
1
NOTE: All internal registers retain data at 0 Hz.
384
Chapter 10: Specifications and Characteristics
Emulator Specifications and Characteristics
AC Electrical Specifications (64751-66508 and higher active probe board numbers) — Read and
Write Cycles
(Vcc = 5.0 Vdc +/-5%; GND = 0 Vdc; TA = TL to TH)
MC68340
25.16 MHz
HP 64751
Num.
Characteristic
Symbol
Min
Max
Min
Max
Unit
6
CLKOUT High to Address, FC, SIZE, RMC
Valid
tCHAV
0
20
0
20
ns
7
CLKOUT High to Address, Data, FC, SIZE,
RMC High Impedance
tCHAZx
0
40
0
40
ns
8
CLKOUT High to Address, FC, SIZE, RMC
Invalid
tCHAZn
0
—
0
—
ns
9
CLKOUT Low to AS, DS,
CS, IACK,
IFETCHA, IPIPEA Asserted
tCLSA
3
3
3
20
20
20
0
3
—
23
20
—
ns
ns
ns
9A2
AS to DS or CS Asserted (Read)
tSTSA
-6
6
-8
8
ns
11
Address, FC, SIZE, RMC Valid to AS, CS
(and DS Read) Asserted
tAVSA
10
—
10
—
ns
12
CLKOUT Low to AS, DS,
CS, IACK,
IFETCHA, IPIPEA Negated
tCLSN
3
3
3
20
20
20
0
3
—
23
20
—
ns
ns
ns
13
AS, DS, CS, IACK Negated to Address, FC,
SIZE Invalid (Address Hold)
tSNAI
10
—
10
—
ns
14
AS, CS (and DS Read) Width Asserted
tSWA
70
—
70
—
ns
14A
DS Width Asserted Write
tSWAW
30
—
30
—
ns
14B
AS, CS, IACK, (and DS READ) Width
Asserted (Sync Cycle)
tSWDW
30
—
30
—
ns
153
AS, DS, CS Width Negated
tSN
30
—
30
—
ns
385
Chapter 10: Specifications and Characteristics
Emulator Specifications and Characteristics
AC Electrical Specifications (64751-66508 and higher active probe board numbers) — Read and
Write Cycles
(Vcc = 5.0 Vdc +/-5%; GND = 0 Vdc; TA = TL to TH)
MC68340
25.16 MHz
Num.
Characteristic
HP 64751
Symbol
Min
Max
Min
Max
Unit
16
CLKOUT High to AS, DS,
R/W High Impedance
tCHSZ
—
—
60
60
—
—
0.5tcyc+30
40
ns
ns
17
AS, DS, CS Negated to R/W High
tSNRN
10
—
10
—
ns
18
CLKOUT High to R/W High
tCHRH
0
20
0
20
ns
20
CLKOUT High to R/W Low
tCHRL
0
20
0
20
ns
21
R/W High to AS, CS Asserted
tRAAA
10
—
10
—
ns
22
R/W Low to DS Asserted (Write)
tRASA
47
—
47
—
ns
23
CLKOUT High to Data-Out Valid
tCHDO
—
20
—
23
ns
24
Data-Out Valid to Negating Edge of AS, CS
(Synchronous Write)
tDVASN
10
—
10
—
ns
25
DS, CS Negated to Data-Out Invalid
(Data-Out Hold)
tSNDOI
10
—
10
—
ns
26
Data-Out Valid to DS Asserted (Write)
tDVSA
10
—
9
—
ns
27
Data-In Valid to CLKOUT Low (Data Setup)
tDICL
5
—
8
—
ns
Late BERR, HALT,
BKPTB Asserted to CLKOUT Low
(Setup Time)
tBELCL
10
10
—
—
10
—
—
—
ns
ns
28
AS, DS Negated to DSACKx, BERR, HALT
tSNDN
0
50
0
50
ns
294
DS Negated to Data-In Invalid (Data-In Hold)
tSNDI
0
—
0
—
ns
tSHDI
—
40
—
40
ns
27A
29A4 DS Negated to Data-In High Impedance
386
Chapter 10: Specifications and Characteristics
Emulator Specifications and Characteristics
AC Electrical Specifications (64751-66508 and higher active probe board numbers) — Read and
Write Cycles
(Vcc = 5.0 Vdc +/-5%; GND = 0 Vdc; TA = TL to TH)
MC68340
25.16 MHz
Num.
304
Characteristic
CLKOUT Low to Data-In Invalid
(Synchronous Hold)
30A4 CLKOUT Low to Data-In High Impedance
HP 64751
Symbol
Min
Max
Min
Max
Unit
tCLDI
10
—
10
—
ns
tCLDH
—
60
—
60
ns
315
DSACKx Asserted to Data-In Valid
tDADI
—
32
—
32
ns
32
HALT and RESET Input Transition Time
tRHrf
0
140
0
140
ns
33
CLKOUT Low to BG Asserted
tCLBA
—
20
—
20
ns
34
CLKOUT Low to BG Negated
tCLBN
—
20
—
20
ns
357
BR Asserted to BG Asserted (RMC Not
Asserted)
tBRAGA
1
—
1
—
clks
37
BGACK Asserted to BG Negated
tGAGN
1
2.5
1
2.5
clks
39
BG Width Negated
tGH
2
—
2
—
clks
39A
BG Width Asserted
tGA
1
—
1
—
clks
R/W Width Asserted (Write or Read)
tRWA
100
—
100
—
ns
46A
R/W Width Asserted (Sync. Write or Read)
tRWAS
60
—
60
—
ns
47A
Asynchronous Input Setup Time
tAIST
5
—
5
—
ns
47B
Asynchronous Input Hold Time
tAIHT
10
—
10
—
ns
488
DSACKx Asserted to BERR, HALT Asserted
tDABA
—
20
—
20
ns
53
Data-Out Hold from CLKOUT High
tDOCH
0
—
0
—
ns
54
CLKOUT High to Data-Out High Impedance
tCHDH
—
20
—
20
ns
55
R/W Asserted to Data Bus Impedance Change
tRADC
25
—
25
—
ns
46
387
Chapter 10: Specifications and Characteristics
Emulator Specifications and Characteristics
AC Electrical Specifications (64751-66508 and higher active probe board numbers) — Read and
Write Cycles
(Vcc = 5.0 Vdc +/-5%; GND = 0 Vdc; TA = TL to TH)
MC68340
25.16 MHz
Num.
Characteristic
HP 64751
Symbol
Min
Max
Min
Max
Unit
56
RESET Pulse Width (Reset Instruction)
tHRPW
512
—
512
—
clks
57
BERR Negated to HALT Negated (Rerun)
tBNHN
0
—
0
—
ns
70
CLKOUT Low to Data Bus Driven (Show
Cycle)
tSCLDD
0
30
—C
—C
ns
71
Data Setup Time to CLKOUT Low (Show
Cycle)
tSCLDS
10
—
—C
—
ns
72
Data Hold from CLKOUT Low (Show Cycle) tSCLDH
6
—
—C
—
ns
MC68340 NOTES:
1. All AC timing is shown with respect to 0.8-V and 2.0-V levels unless otherwise noted.
2. This number can be reduced to 5 ns if strobes have equal loads.
3. If multiple chip selects are used, the CS width negated (#15) applies to the time from the negation of a
heavily loaded chip select to the assertion of a lightly loaded chip select.
4. These hold times are specified with respect to DS on asychronous reads and with respect to CLKOUT
on synchronous reads. The user is free to use either hold time.
5. If the asychronous setup time (#47) requirements are satisfied, the DSACKx low to data setup time
(#31) and DSACKx low to BERR low setup time (#48) can be ignored. The data must only satisfy the
data-in to CLKOUT low setup time (#27) for the following clock cycle, BERR must only satisfy the late
BERR low to CLKOUT low setup time (#27A) for the following clock cycle.
6. To ensure coherency during every operand transfer, BG will not be asserted in response to BR until
after cycles of the current operand transfer are complete and RMC is negated.
7. In the absence of DSACKx, BERR is an asychronous input using the asychronous setup time (#47).
8. Address Access Time = 2tcyc + tCW - tCHAV - tDICL = 74 ns (@ 25.16-MHz clock). Chip Select
Access Time = 2tcyc - tCLSA - tDICL = 55 ns (@ 25.16-MHz clock).
HP 64751 NOTES:
A. IFETCH and IPIPE are not driven to the target system.
B. The emulator does not respond to BKPT from the target system.
C. The emulator does not drive data to the target system during show cycles.
388
Chapter 10: Specifications and Characteristics
Emulator Specifications and Characteristics
AC Electrical Specifications (64751-66506 and lower active probe board numbers) — Clock Timing
MC68340
16.78 MHz
Num.
Characteristic
HP 64751
Symbol
Min
Max
Min
Max
Unit
fsys
dc
16.78
dc
16.78
MHz
fXTAL
25
50
25
50
kHz
On-Chip VCO System Frequency
fsys
0.13
16.78
0.13
16.78
MHz
On-Chip VCO Frequency Range
fVCO
0.1
35
0.1
35
MHz
Crystal Oscillator Startup Time
trc
—
100
—
100
ms
CLKOUT Period
tcyc
59.6
—
59.6
—
ns
2,3
CLKOUT Pulse Width
tCW
28
—
28
—
ns
4,5
CLKOUT Rise and Fall Times
tCrf
—
5
—
5
ns
System Frequency (See Note)
Crystal Frequency
1
NOTE: All internal registers retain data at 0 Hz.
389
Chapter 10: Specifications and Characteristics
Emulator Specifications and Characteristics
AC Electrical Specifications (64751-66506 and lower active probe board numbers) — Read and
Write Cycles
(Vcc = 5.0 Vdc +/-5%; GND = 0 Vdc; TA = TL to TH)
MC68340
16.78 MHz
HP 64751
Num.
Characteristic
Symbol
Min
Max
Min
Max
Unit
6
CLKOUT High to Address, FC, SIZE, RMC
Valid
tCHAV
0
30
0
30
ns
7
CLKOUT High to Address, Data, FC, SIZE,
RMC High Impedance
tCHAZx
0
60
0
60
ns
8
CLKOUT High to Address, FC, SIZE, RMC
Invalid
tCHAZn
0
—
0
—
ns
9
CLKOUT Low to AS, DS,
CS, IACK,
IFETCHA, IPIPEA Asserted
tCLSA
3
3
3
30
30
30
0
3
—
33
30
—
ns
ns
ns
9A2
AS to DS or CS Asserted (Read)
tSTSA
-15
15
-15
15
ns
11
Address, FC, SIZE, RMC Valid to AS, CS
(and DS Read) Asserted
tAVSA
15
—
15
—
ns
12
CLKOUT Low to AS, DS,
CS, IACK,
IFETCHA, IPIPEA Negated
tCLSN
3
3
3
30
30
30
0
3
—
33
30
—
ns
ns
ns
13
AS, DS, CS, IACK Negated to Address, FC,
SIZE Invalid (Address Hold)
tSNAI
15
—
15
—
ns
14
AS, CS (and DS Read) Width Asserted
tSWA
100
—
100
—
ns
14A
DS Width Asserted Write
tSWAW
45
—
45
—
ns
14B
AS, CS, IACK, (and DS READ) Width
Asserted (Sync Cycle)
tSWDW
40
—
40
—
ns
153
AS, DS, CS Width Negated
tSN
40
—
40
—
ns
390
Chapter 10: Specifications and Characteristics
Emulator Specifications and Characteristics
AC Electrical Specifications (64751-66506 and lower active probe board numbers) — Read and
Write Cycles
(Vcc = 5.0 Vdc +/-5%; GND = 0 Vdc; TA = TL to TH)
MC68340
16.78 MHz
Num.
Characteristic
HP 64751
Symbol
Min
Max
Min
Max
Unit
16
CLKOUT High to AS, DS,
R/W High Impedance
tCHSZ
—
—
60
60
—
—
0.5tcyc+40
60
ns
ns
17
AS, DS, CS Negated to R/W High
tSNRN
15
—
15
—
ns
18
CLKOUT High to R/W High
tCHRH
0
30
0
30
ns
20
CLKOUT High to R/W Low
tCHRL
0
30
0
30
ns
21
R/W High to AS, CS Asserted
tRAAA
15
—
15
—
ns
22
R/W Low to DS Asserted (Write)
tRASA
70
—
70
—
ns
23
CLKOUT High to Data-Out Valid
tCHDO
—
30
—
33
ns
24
Data-Out Valid to Negating Edge of AS, CS
(Synchronous Write)
tDVASN
15
—
15
—
ns
25
DS, CS Negated to Data-Out Invalid
(Data-Out Hold)
tSNDOI
15
—
15
—
ns
26
Data-Out Valid to DS Asserted (Write)
tDVSA
15
—
12
—
ns
27
Data-In Valid to CLKOUT Low (Data Setup)
tDICL
5
—
8
—
ns
Late BERR, HALT,
BKPTB Asserted to CLKOUT Low
(Setup Time)
tBELCL
20
20
—
—
20
—
—
—
ns
ns
28
AS, DS Negated to DSACKx, BERR, HALT
tSNDN
0
80
0
80
ns
294
DS Negated to Data-In Invalid (Data-In Hold)
tSNDI
0
—
0
—
ns
tSHDI
—
60
—
60
ns
27A
29A4 DS Negated to Data-In High Impedance
391
Chapter 10: Specifications and Characteristics
Emulator Specifications and Characteristics
AC Electrical Specifications (64751-66506 and lower active probe board numbers) — Read and
Write Cycles
(Vcc = 5.0 Vdc +/-5%; GND = 0 Vdc; TA = TL to TH)
MC68340
16.78 MHz
Num.
304
Characteristic
CLKOUT Low to Data-In Invalid
(Synchronous Hold)
30A4 CLKOUT Low to Data-In High Impedance
HP 64751
Symbol
Min
Max
Min
Max
Unit
tCLDI
15
—
15
—
ns
tCLDH
—
90
—
90
ns
315
DSACKx Asserted to Data-In Valid
tDADI
—
50
—
50
ns
32
HALT and RESET Input Transition Time
tRHrf
0
200
0
200
ns
33
CLKOUT Low to BG Asserted
tCLBA
—
30
—
30
ns
34
CLKOUT Low to BG Negated
tCLBN
—
30
—
30
ns
357
BR Asserted to BG Asserted (RMC Not
Asserted)
tBRAGA
1
—
1
—
clks
37
BGACK Asserted to BG Negated
tGAGN
1
2.5
1
2
clks
39
BG Width Negated
tGH
2
—
2
—
clks
39A
BG Width Asserted
tGA
1
—
1
—
clks
R/W Width Asserted (Write or Read)
tRWA
150
—
150
—
ns
46A
R/W Width Asserted (Sync.Write or Read)
tRWAS
90
—
90
—
ns
47A
Asynchronous Input Setup Time
tAIST
5
—
5
—
ns
47B
Asynchronous Input Hold Time
tAIHT
15
—
15
—
ns
488
DSACKx Asserted to BERR, HALT Asserted
tDABA
—
30
—
30
ns
53
Data-Out Hold from CLKOUT High
tDOCH
0
—
0
—
ns
54
CLKOUT High to Data-Out High Impedance
tCHDH
—
30
—
30
ns
55
R/W Asserted to Data Bus Impedance Change
tRADC
40
—
40
—
ns
46
392
Chapter 10: Specifications and Characteristics
Emulator Specifications and Characteristics
AC Electrical Specifications (64751-66506 and lower active probe board numbers) — Read and
Write Cycles
(Vcc = 5.0 Vdc +/-5%; GND = 0 Vdc; TA = TL to TH)
MC68340
16.78 MHz
Num.
Characteristic
HP 64751
Symbol
Min
Max
Min
Max
Unit
56
RESET Pulse Width (Reset Instruction)
tHRPW
512
—
512
—
clks
57
BERR Negated to HALT Negated (Rerun)
tBNHN
0
—
0
—
ns
70
CLKOUT Low to Data Bus Driven (Show
Cycle)
tSCLDD
0
30
—C
—C
ns
71
Data Setup Time to CLKOUT Low (Show
Cycle)
tSCLDS
15
—
—C
—
ns
72
Data Hold from CLKOUT Low (Show Cycle) tSCLDH
10
—
—C
—
ns
MC68340 NOTES:
1. All AC timing is shown with respect to 0.8-V and 2.0-V levels unless otherwise noted.
2. This number can be reduced to 5 ns if strobes have equal loads.
3. If multiple chip selects are used, the CS width negated (#15) applies to the time from the negation of a
heavily loaded chip select to the assertion of a lightly loaded chip select.
4. These hold times are specified with respect to DS on asychronous reads and with respect to CLKOUT
on synchronous reads. The user is free to use either hold time.
5. If the asychronous setup time (#47) requirements are satisfied, the DSACKx low to data setup time
(#31) and DSACKx low to BERR low setup time (#48) can be ignored. The data must only satisfy the
data-in to CLKOUT low setup time (#27) for the following clock cycle, BERR must only satisfy the late
BERR low to CLKOUT low setup time (#27A) for the following clock cycle.
6. To ensure coherency during every operand transfer, BG will not be asserted in response to BR until
after cycles of the current operand transfer are complete and RMC is negated.
7. In the absence of DSACKx, BERR is an asychronous input using the asychronous setup time (#47).
8. Address Access Time = 2tcyc + tCW - tCHAV - tDICL = 112.2 ns (@ 16.78-MHz clock). Chip Select
Access Time = 2tcyc - tCLSA - tDICL = 84.2 ns (@ 16.78-MHz clock).
HP 64751 NOTES:
A. IFETCH and IPIPE are not driven to the target system.
B. The emulator does not respond to BKPT from the target system.
C. The emulator does not drive data to the target system during show cycles.
393
Chapter 10: Specifications and Characteristics
Emulator Specifications and Characteristics
Electrical Characteristics of the HP 64700
The electrical characteristics of the HP 64700 communication ports are as follows.
Communications
Serial Port
RS-232-C DCE or DTE to 38.4 Kbaud.
RS-422 DCE to 460.8 Kbaud.
BNC (labeled
TRIGGER
IN/OUT)
Input. The signal must drive approximately 4 mA at 2 V. Edge
Sensitive. Minimum pulse width is approximately 25 ns.
Output. Driven active high only;
equals +2.4V into a 50 ohm load.
Physical
Dimensions of Emulator Probe
There must be enough clearance in the target system to allow the emulation probe
to be plugged in and the cable routed from the target system to the emulator control
card in the HP 64700. The following figure shows probe dimensions.
394
Chapter 10: Specifications and Characteristics
Emulator Specifications and Characteristics
Emulator Dimensions
Width
Height
Length
325 mm (12.8 in.)
173 mm (6.8 in.)
389 mm (15.3 in.)
Emulator Weight
HP 64751
8.2 kg (18 lb)
Cable Length
Emulator to
target system
approximately 914 mm (3 ft).
Probe Dimensions
92 mm (3.625 in.) width x 16 mm (0.626 in.) height x 159 mm
(6.25 in.) length
Communications
CAUTION
Serial Port
25-pin female type "D" subminiature connector.
CMB Port
9-pin female type "D" subminiature connector.
Possible damage to emulator. Any component used in suspending the emulator
must be rated for 30 kg (65 lb) capacity.
395
Chapter 10: Specifications and Characteristics
Emulator Specifications and Characteristics
Environmental
Temperature
Operating
0°C to +55°C
(+32°F to 131°F)
Non-operating
-40°C to +70°C
(-40°F to 158°F)
Altitude
Operating
4 600m
(15 000 ft)
Non-operating
15 300m
(50 000 ft).
Relative Humidity
15% to 95%.
396
Part 4
Concept Guide
397
Part 4
398
11
Concepts
399
Concepts
This chapter provides conceptual information on the following topics:
•
400
Demo program descriptions.
Chapter 11: Concepts
Demo Program Descriptions
Demo Program Descriptions
Three demo programs have been used to generate examples throughout this
manual. The quick start demo program is used in the "Quick Start" chapter’s
tutorial. The emulator demo program is used to generate examples in the "Using
the Emulator" chapter. The analyzer demo program is used to generate examples in
the "Using the Analyzer" chapters. The quick start demo is an assembly language
program and the emulator and analyzer demo programs are simple C language
programs.
Quick Start Demo Program
The HP 64751 emulator contains a simple demo program that allows you to learn
about the emulator and Terminal Interface without having to write and load a
program.
The demo command resets the processor, initializes all configuration items, defines
a new memory map, and loads the quick start demo program and its symbols.
The quick start demo program was written in 68000 assembly language. The
program is a simple command interpreter. It has a one-byte input buffer for
commands, and recognizes the ASCII characters "A" and "B." All other values are
considered invalid.
When you input a command to the buffer, the program calls a subroutine that
interprets the command and writes a corresponding message to an output buffer.
There are two modules in the program. One is the main module, called demo. The
second module, which has the subroutines for printing the messages, is called
handle_msg.
The "demo.s" source file is shown below.
*
*
*
*
*
*
*
*
*
*
*
*
*
This program is a simple 68000 assembler program that can be used
to demonstrate run and trace features for the HP 64751 emulator.
It emulates a simple command interpreter.
The program scans the location Cmd_Input looking for a non-null
value. When it finds one, it calls a routine to determine whether
the command is "A," "B," or an invalid command. This routine sets
up certain parms for the output message handler, then calls the
message handler to write a message based on the command input.
Module name: demo.s
401
Chapter 11: Concepts
Demo Program Descriptions
* Define the chip. Call it 68000 here since we don’t use any 68340-specific
* features.
chip 68000
* Int_Cmd is in the module handle_msg.
xref
Int_Cmd
* Set up the stack pointer and initial program counter for run-from-reset.
sect
org $0
Table,,r
dc.l
dc.l
Top_of_Stack
Main
* Set up the trace vector
* so single-stepping works
org $24
dc.l 0
* The stack is declared as 16 long words, which should be more than
* sufficient since there shouldn’t be more than 3 PC’s on the stack (plus
* whatever the emulation monitor pushes).
sect
Stack
ds.l
Top_of_Stack
Stack,,d
16
* The only data local to this module is the command input buffer, which
* is a single byte.
sect
Cmd_Input
Data,,d
ds.b
1
* Main program starts here.
sect
Prog,,c
* Load the user stack pointer, then clear the command input byte.
Main
move.l
move.b
#Top_of_Stack,a7
#0,Cmd_Input
* Now loop, looking for a nonzero value. If found, call the message interpreter.
Loop
move.b
bne
bra
Cmd_Input,d0
Call_Int
EndLoop
* Call to the message interpreter is a simple subroutine branch. The parameter
* is passed in d0 (the command we read). When finished, clear the command
* input buffer.
Call_Int
bsr
move.b
Int_Cmd
#0,Cmd_Input
* Branch forever.
EndLoop
402
bra
Loop
Chapter 11: Concepts
Demo Program Descriptions
end
Main
* End of demo.s
The "handle.s" source file is shown below.
* This module contains the message intepreter and message printing routines
* for the quick start demo program. The main program module is demo.s.
*
* Module: handle_msg.s
* Int_Cmd must be made global so demo.s can see it.
xdef
Int_Cmd
* Data local to this module are the message definitions and the message
* output buffer.
sect
Data,,d
* Define the messages printed for commands A, B and invalid respectively.
Msg_A
Msg_B
Msg_I
End_Msgs
dc.b
dc.b
dc.b
’Command A entered’
’Entered B command’
’Invalid command’
* Message output buffer.
Msg_Dest
ds.b
32
* Start program code for this module.
sect
Prog,,c
* Int_Cmd is the command interpreter routine. It is called by the main
* program loop in demo.s whenever a command is found.
Int_Cmd
*
*
*
*
#’A’,d0
Cmd_A
#’B’,d0
Cmd_B
Cmd_I
If "A", then load a pointer to the beginning of the "A" message into a0,
and load the message’s length into d1. Then call the routine to print
the message. When done, return to the caller (the main program loop in
demo.s).
Cmd_A
*
*
*
*
cmp.b
beq
cmp.b
beq
bra
lea
move.l
bsr
rts
Msg_A,a0
#Msg_B-Msg_A-1,d1
Print_Msg
If "B", then load a pointer to the beginning of the "B" message into a0,
and load the message’s length into d1. Then call the routine to print
the message. When done, return to the caller (the main program loop in
demo.s).
Cmd_B
lea
move.l
Msg_B,a0
#Msg_I-Msg_B-1,d1
403
Chapter 11: Concepts
Demo Program Descriptions
bsr
rts
*
*
*
*
*
Print_Msg
The command isn’t recognized, so load a pointer to the beginning of the
invalid message into a0,
and load the message’s length into d1. Then call the routine to print
the message. When done, return to the caller (the main program loop in
demo.s).
Cmd_I
lea
move.l
bsr
rts
Msg_I,a0
#End_Msgs-Msg_I-1,d1
Print_Msg
* End of Int_Cmd
* Print_Msg handles the writing of the appropriate message to the Msg_Dest
* buffer. After the message is written, it writes nulls to the remaining
* locations to clear them from previous commands.
* To print the message, we load a pointer to the output buffer into
* a1, then do a block xfer with autoincrement addressing. When the number
* of characters specified in d1 has been moved, fall out of the Again loop.
Print_Msg
Again
*
*
*
*
*
lea
move.b
dbeq
Msg_Dest,a1
(a0)+,(a1)+
d1,Again
Now move a null to the next location pointed to by a1 (which is now after
the last character of the message. Compare the address in a1 to the end
address of the message buffer, and keep repeating until all remaining
destination buffer locations are zeroed. Then return to the caller
(Int_Cmd in this case).
Fill_Dest
move.b
cmpa
bne
rts
#0,(a1)+
#Msg_Dest+32,a1
Fill_Dest
* End of Print_Msg
* End of handle_msg.s
How the Quick Start Demo Program was Built
The quick start demo program was built using the Hewlett-Packard 68000/10/20
Assmbler/Linker/Librarian software development tools on the HP 9000 Series 300
host computer with the following commands:
$ as68k -h demo.s
$ as68k -h handle_msg.s
$ ld68k -h -c demo.k -o demo.x
404
Chapter 11: Concepts
Demo Program Descriptions
Where the "demo.k" linker command file contains:
CHIP
LIST
SECT
SECT
SECT
68000
c,d,p,s,t,x
Prog=$400
Data=$500
Stack=$f00
LOAD demo
LOAD handle_msg
Emulator Demo Program
The emulator demo program used in this chapter is a simple command interpreter.
The "cmd_rdr.c" source file is shown below.
volatile char Cmd_Input;
char Msg_Dest[0x20];
void Write_Msg (char *s)
{
char *Dest_Ptr;
Dest_Ptr = Msg_Dest;
while (*s != ’\0’)
{
*Dest_Ptr = *s;
Dest_Ptr++;
s++;
}
}
main ()
{
static char Msg_A[] = "Command A Entered
static char Msg_B[] = "Entered B Command
static char Msg_I[] = "Invalid Command
char c;
";
";
";
for (;;)
{
Cmd_Input = ’\0’;
while ((c = Cmd_Input) == ’\0’);
switch (c) {
case ’A’ :
Write_Msg (Msg_A);
break;
case ’B’ :
Write_Msg (Msg_B);
break;
default :
Write_Msg (Msg_I);
break;
}
}
}
405
Chapter 11: Concepts
Demo Program Descriptions
The "cmd_rdr" program continuously reads values from Cmd_Input; when a value
other than NULL is found, the program calls the Write_Msg function to copy a
string to the Msg_Dest array.
Building the Emulator Demo Program
The emulator demo program was built using the Hewlett-Packard 68332 Advanced
C Cross Compiler and the 68000/10/20 Assmbler/Linker/Librarian software
development tools on the HP 9000 Series 300 host computer with the following
command:
$ cc68332 -hOGNr hp64751 -Wl,-Lfx -o cmd_rdr cmd_rdr.c > cmd_rdr.map
Analyzer Demo Program
The "anly.c" source file is shown below.
#include <stdlib.h>
int Results[0x100];
void Write_Num (int Number, int Offset)
{
Offset = Offset % 256;
Results[Offset] = Number;
}
void Caller_0 (int Num, int Ofs)
{
Write_Num (Num, Ofs);
}
void Caller_1 (int Num, int Ofs)
{
Write_Num (Num, Ofs);
}
void Caller_2 (int Num, int Ofs)
{
Write_Num (Num, Ofs);
}
void Caller_3 (int Num, int Ofs)
{
Write_Num (Num, Ofs);
}
static int cmp_function (const int *item1, const int *item2)
{
if (*item1 < *item2)
{
return (-1);
}
else if (*item1 > *item2)
{
return (1);
406
Chapter 11: Concepts
Demo Program Descriptions
}
else
{
return (0);
}
}
void main ()
{
int Rand_Num=0, Rand_Num_Old=0, Rand_Num_Older, Counter;
Counter = 4096;
for (;;)
{
Rand_Num_Older = Rand_Num_Old;
Rand_Num_Old = Rand_Num;
Rand_Num = rand();
switch (Rand_Num_Old % 4)
case 0 :
Caller_0 (Rand_Num,
break;
case 1 :
Caller_1 (Rand_Num,
break;
case 2 :
Caller_2 (Rand_Num,
break;
case 3 :
Caller_3 (Rand_Num,
break;
default :
break;
}
Counter--;
if (Counter == 0)
{
qsort (Results, 0x100,
(int (*)(const void
Counter = 4096;
}
{
Rand_Num_Older);
Rand_Num_Older);
Rand_Num_Older);
Rand_Num_Older);
sizeof(*Results),
*, const void *))cmp_function);
}
}
The "anly" program uses four different functions to call the Write_Num function to
simulate situations in real programs where routines are called from many different
places.
407
Chapter 11: Concepts
Demo Program Descriptions
Building the Analyzer Demo Program
The analyzer demo program was built using the Hewlett-Packard 68332 Advanced
C Cross Compiler and the 68000/10/20 Assmbler/Linker/Librarian software
development tools on the HP 9000 Series 300 host computer with the following
command:
$ cc68332 -hOGNr hp64751 -Wl,-Lfx -o anly anly.c > anly.map
408
Part 5
Installation Guide
409
Part 5
410
12
Installation
411
Installation at a Glance
412
Chapter 12: Installation
Installation at a Glance
Equipment supplied
The minimum system contains:
•
•
•
•
HP 64751A 68340 PGA Emulator Probe (which includes the demo target
system).
HP 64748C Emulation Control card.
HP 64704A 80-Channel Emulation Bus Analyzer card.
HP 64700 Card Cage.
Optional parts are:
•
•
•
HP 64171A 256 Kbyte Memory Modules or HP 64171B 1 Mbyte Memory
Modules (0 wait state emulation memory through 16.7 MHz, 1 wait state
above 16.7 MHz).
HP 64172A 256 Kbyte Memory Modules or HP 64172B 1 Mbyte Memory
Modules (0 wait state emulation memory through 25 MHz).
HP 64173A 4 Mbyte Memory Modules (0 wait state emulation memory
through 22 MHz, 1 wait state above 22 MHz).
Equipment and tools needed
In order to install and use the 68340 emulation system, you need:
•
•
•
Host computer or terminal with RS-232/RS-422 port.
RS-232/RS-422 cable.
Flat-blade screwdriver.
Installation overview
The steps in the installation process are:
1
2
3
4
5
6
7
Connect the emulator probe cables.
Install emulation control and analyzer boards into the HP 64700 Card Cage.
Connect the HP 64700 Card Cage to a host computer or terminal.
Install memory modules on emulator probe.
Connect the emulator probe to the demo target system.
Apply power to the HP 64700.
Verify emulator and analyzer performance.
Your emulation and analysis system may already be assembled (depending on how
parts of the system were ordered), and you may only need to connect the HP 64700
to a host computer or terminal and the target microprocessor system.
413
Chapter 12: Installation
Installation at a Glance
Antistatic precautions
Integrated-circuit boards contain electrical components that are easily damaged by
small amounts of static electricity. To avoid damage to the emulator cards, follow
these guidelines:
•
•
•
414
If possible, work at a static-free workstation.
Handle the boards only by the edges; do not touch components or traces.
Use a grounding wrist strap that is connected to the HP 64700’s chassis.
Chapter 12: Installation
Step 1. Connect the Emulator Probe Cables
Step 1. Connect the Emulator Probe Cables
Three ribbon cables connect the HP 64748C emulation control card to the HP 64751 68340 emulator
probe.
The shortest cable connects from J1 of the emulation control card to J3 of the emulator probe. The
medium length cable connects from J2 of the emulation control card to J2 of the emulator probe. The
longest cable connects from J3 of the emulation control card to J1 of the emulator probe.
1 Connect the emulator probe cables to the emulation control card.
415
Chapter 12: Installation
Step 1. Connect the Emulator Probe Cables
2 When inserting cable connectors into the sockets, press inward on the connector clips so that they hook
into the sockets as shown.
416
Chapter 12: Installation
Step 1. Connect the Emulator Probe Cables
3 Connect the other ends of the cables to the emulator probe.
417
Chapter 12: Installation
Step 2. Install Boards into the HP 64700 Card Cage
Step 2. Install Boards into the HP 64700 Card
Cage
WARNING
Before removing or installing parts in the HP 64700 Card Cage, make sure
that the card cage power is off and that the power cord is disconnected.
CAUTION
Do NOT stand the HP 64700 on the rear panel. You could damage the rear panel
ports and connectors.
If your emulator and analyzer boards are already installed in the HP 64700 Card Cage, go to "Step 3a.
Connect the HP 64700 via RS-232/RS-422" or "Step 3b. Connect the HP 64700 via LAN".
418
Chapter 12: Installation
Step 2. Install Boards into the HP 64700 Card Cage
1 Use a ground strap when removing or installing boards into the HP 64700 Card Cage to reduce the
chances of damage to the circuit cards from static discharge. A jack on the rear panel of the HP 64700
Card Cage is provided for this purpose.
419
Chapter 12: Installation
Step 2. Install Boards into the HP 64700 Card Cage
2 Turn the thumb screw and remove the top cover by sliding the cover toward the rear and up.
420
Chapter 12: Installation
Step 2. Install Boards into the HP 64700 Card Cage
3 Remove the side cover by unsnapping the two latches and lifting off.
4 Remove the card supports.
421
Chapter 12: Installation
Step 2. Install Boards into the HP 64700 Card Cage
5 First, completely loosen the four egress thumb screws.
To remove emulator cards, insert a flat blade screwdriver in the access hole and eject the emulator cards
by rotating the screwdriver.
422
Chapter 12: Installation
Step 2. Install Boards into the HP 64700 Card Cage
6 Insert a screw driver into the third slot of the right side of the front bezel, push to release catch, and
pull the right side of the bezel about one half inch away from the front of the HP 64700. Then, do the
same thing on the left side of the bezel. When both sides are released, pull the bezel toward you
approximately 2 inches.
423
Chapter 12: Installation
Step 2. Install Boards into the HP 64700 Card Cage
7 Lift the bezel panel to remove. Be careful not to put stress on the power switch extender.
8 If you’re removing an existing analyzer card that provides external analysis, remove the right angle
adapter board by turning the thumb screws counter-clockwise.
424
Chapter 12: Installation
Step 2. Install Boards into the HP 64700 Card Cage
9 To remove the analyzer card, insert a flat blade screwdriver in the access hole and eject the analyzer
card by rotating the screwdriver.
Do not remove the system control board. This board is used in all HP 64700 emulation and analysis
systems.
425
Chapter 12: Installation
Step 2. Install Boards into the HP 64700 Card Cage
10 Install HP 64704A and HP 64748C boards. The HP 64704A is installed in the slot next to the system
controller board. The HP 64748C is installed in the second slot from the bottom of the HP 64700. These
boards are identified with labels that show the model number and the serial number.
To install a card, insert it into the plastic guides. Make sure the connectors are properly aligned; then,
press the card into mother board sockets. Check to ensure that the cards are seated all the way into the
sockets. If the cards can be removed with your fingers, the cards are NOT seated all the way into the
mother board socket.
426
Chapter 12: Installation
Step 2. Install Boards into the HP 64700 Card Cage
11 Connect the +5 V power cable to the connector in the HP 64700 front panel.
427
Chapter 12: Installation
Step 2. Install Boards into the HP 64700 Card Cage
12 To reinstall the front bezel, be sure that the bottom rear groove of the front bezel is aligned with the
lip as shown below.
428
Chapter 12: Installation
Step 2. Install Boards into the HP 64700 Card Cage
13 Install the card supports.
14 To install the side cover, insert the side cover into the tab slots and fasten the two latches.
429
Chapter 12: Installation
Step 2. Install Boards into the HP 64700 Card Cage
15 Install the top cover in reverse order of its removal, but make sure that the side panels of the top cover
are attached to the side clips on the frame.
430
Chapter 12: Installation
Step 3a. Connect the HP 64700 via RS-232/RS-422
Step 3a. Connect the HP 64700 via RS-232/RS-422
If you wish to connect the HP 64700 to a host computer via the LAN interface, go to "Step 3b. Connect
the HP 64700 via LAN".
1 Set the data communications configuration switches so that the HP 64700 port will have characteristics
compatible with the terminal or host computer interface to which it will be connected (see the following
switch summary tables). Note that the configuration switch settings are only read when the HP 64700 is
powered ON or when the init -p command is entered.
The locations of the data communications ports and configuration switches are shown below.
431
Chapter 12: Installation
Step 3a. Connect the HP 64700 via RS-232/RS-422
HP 64700B Configuration Switch Summary
The information in the following table is also on an adhesive label attached to each
HP 64700B.
Configuration Switches S1-S8
S1
S2
RS-232/RS-422 Baud Rate
1 1 1 = 230400
1 1 0 = 115200
1 0 1 = 38400
1 0 0 = 57600
0 1 1 = 1200
0 1 0 = 2400
0 0 1 = 19200
0 0 0 = 9600
S3
S4
S5
S6
S7
S8
1=
1=
1=
1=
1=
DTE
RS-422
Service
Service
Reserved
for future
use
0=
0=
0=
0=
0=
DCE
RS-232
Normal
Normal
Normal
NOTES:
S1 - S3: Asynchronous baud rates include 300, 1200, 2400, 4800, 9600, 19200, 38400, 57600, and
115200. The rear panel switches can be used to initialize at 1200, 2400, 9600, 19200,
38400, or 115200 baud. Rates of 300 baud and 4800 baud are only selectable through the
Terminal Interface stty command. This entire range of rates are supported at RS-422 signal
levels. The EIA-RS232-D standard only covers data rates up to 20,000 bits per second
(actual 19200). Asynchronous connections using RS-232 signal levels above this rate can
be used but cannot be guaranteed.
Isosynchronous rates of 230400 baud and 460800 baud are supported at RS-422 signal
levels using a 1X clock. The rate of 230400 can be selected through the rear panel switches
but 460800 is only selectable through the stty command.
S4: DCE = Data Communications Equipment, DTE = Data Terminal Equipment. This switch is
ignored if S5 sets the serial port to be an RS-422 device (which is always DCE).
S6: When this switch is set to "1", self diagnostic information is displayed by a flashing LED
on the control board during the powerup cycle. This information is intended to be used by a
qualified service technician only.
S7: When this switch is set to "1", the HP 64700B firmware is forced to execute from ROM
instead of Flash EPROM. This mode is intended to be used by a qualified service
technician only.
432
Chapter 12: Installation
Step 3a. Connect the HP 64700 via RS-232/RS-422
Configuration Switches S9-S16
S9
S10
S11
S12
S13
S14
S15
S16
1=
1=
1=
1=
1=
1=
1=
1=
7 Bit
character
size
Parity
enabled
Parity even
RTS/CTS
DSR/DTR
XON/
XOFF
LAN
BOOTP
enabled
15 pin AUI
LAN
0=
0=
0=
0=
0=
0=
0=
0=
8 Bit
character
size
Parity
disabled
Parity odd
No HW
handshake
No SW
handshake
LAN
BOOTP
disabled
BNC
ThinLAN
Serial
NOTES:
S12: Hardware pacing uses a modified handshake. When hardware handshake is enabled, the
DTE uses Clear to Send (CTS) to control its output. When CTS is true, data may be output,
when CTS is false, data output will stop at the end of the current character. The DCE is
expected to negate CTS during receipt of a character if the internal hardware buffer is full.
Once a position is available in the internal hardware buffer, CTS is to be set true.
A modification is made in the use of Request to Send (RTS) as a reverse channel Clear to
Send to control the output of the DCE. The DTE sets RTS false during the receipt of a
character if there is no room in its hardware buffer. The DCE must stop transmission of
data at the conclusion of the current character and wait until the DTE sets RTS true before
resuming transmission.
This modified RTS/CTS handshake protocol provides full bi-directional hardware
handshaking of the data streams. The HP 64700B can support baud rates up to 460800
using this protocol.
S13: Software pacing uses XON/XOFF protocols (DC1/DC3). Upon receipt of an XOFF, the
HP 64700B can continue to transmit up to 3 additional characters. The HP 64700B sends
an XOFF when its internal buffer can accept only 64 additional bytes before overflow.
Software pacing is only valid on the transmission of ASCII data streams. It is not supported
for binary transfers. It will support a maximum baud rate of 57600. Above this rate
hardware handshaking must be used to prevent data loss.
433
Chapter 12: Installation
Step 3a. Connect the HP 64700 via RS-232/RS-422
2 Select and connect the RS-232/RS-422 cable.
To connect cables to the HP 64700, simply align the cable with the serial port and insert the 25-pin male
connector of the cable until it is firmly seated. You should then tighten the holding screws on each side
of the cable with a small flat blade screwdriver. This will ensure that the cable pins and shield hood
make good contact with the HP 64700 connector and will also guard against accidental disconnection of
the cable.
434
Chapter 12: Installation
Step 3b. Connect the HP 64700 via LAN
Step 3b. Connect the HP 64700 via LAN
1 Enable the LAN interface. If you are using the HP 64700’s LAN interface, you must enable it by
setting switch S16 is set to one (1). Set all other switches (S1 through S13) to zero.
2 Select the BNC or 15-pin AUI port. S15 is used to select which of the HP 64700’s LAN connectors
will be used: either the BNC connector (S15 = 0) or the 15-pin AUI connector (S15 = 1).
435
Chapter 12: Installation
Step 3b. Connect the HP 64700 via LAN
3 Enable or disable BOOTP.
BOOTP is a network service running on a host computer that allows the HP 64700’s LAN parameters to
be set automatically when the emulator is powered up.
When S14 is set to (1) and the host computer’s "bootptab" table file has been modified to include
information for the HP 64700, BOOTP will be used to set the HP 64700’s LAN parameters when the
emulator is powered up.
When S14 is set to zero (0), BOOTP is disabled and LAN parameters must be set by connecting the
HP 64700 to a terminal or host computer via the serial port (as described in the previous Step 3a) and use
the Terminal Interface lan command to set the HP 64700’s LAN parameters. Once the LAN parameters
are set (they are saved in EEPROM), you can change the configuration switch settings and connect the
HP 64700 to the LAN.
436
Chapter 12: Installation
Step 4. Install emulation memory modules on emulator probe
Step 4. Install emulation memory modules on
emulator probe
1 Remove plastic rivets that secure the plastic cover on the top of the emulator probe, and remove the
cover.
437
Chapter 12: Installation
Step 4. Install emulation memory modules on emulator probe
2 Determine the placement of the emulation memory modules. Three types of modules may be installed:
256 Kbyte (HP 64171A or HP 64172A), 1 Mbyte (HP 64171B or HP 64172B), and 4 Mbyte
(HP 64173A). Any type of module may be installed in either bank.
Memory in bank 0 is divided into 4 equal blocks that can be allocated by the memory mapper. Memory
in bank 1 is divided into 2 equal blocks.
If you have only one emulation memory module, place it in bank 0 to give yourself greater flexibility
when mapping address ranges to emulation memory. If you have two memory modules and one is larger
than the other, place the larger module in bank 0 to give yourself more evenly proportioned blocks.
The HP 64171A/B memory modules provide 0 wait state emulation memory through 16.7 MHz and 1
wait state above 16.7 MHz. The HP 64172A/B memory modules provide 0 wait state emulation memory
through 25 MHz. The HP 64173A memory modules provide 0 wait state emulation memory through
22 MHz and 1 wait state above 22 MHz. (The 68340 processor is programmed for the correct number of
wait states by user code.) If memory modules are mixed, the performance characteristics of the slower
module should be used.
438
Chapter 12: Installation
Step 4. Install emulation memory modules on emulator probe
3 Install emulation memory modules on emulator probe. There is a cutout on one side of the memory
modules so that they can only be installed one way.
To install memory modules, place the memory module into the socket groove at an angle. Firmly press
the memory module into the socket to make sure that it is completely seated. Once the memory module
is seated in the connector groove, pull the memory module forward so that the notches on the socket fit
into the holes on the memory module. There are two latches on the sides of the socket that hold the
memory module in place.
439
Chapter 12: Installation
Step 4. Install emulation memory modules on emulator probe
4 Replace the plastic cover, and insert new plastic rivets (supplied with the emulator) to secure the cover.
440
Chapter 12: Installation
Step 5. Plug the emulator probe into the demo target system
Step 5. Plug the emulator probe into the demo
target system
1 With HP 64700 power OFF, connect the emulator probe cables to the demo target system.
441
Chapter 12: Installation
Step 5. Plug the emulator probe into the demo target system
2 Connect the power supply wires from the emulator to the demo target system. The 3-wire cable has 1
power wire and 2 ground wires. When attaching the 3-wire cable to the demo target system, make
sure the connector is aligned properly so that all three pins are connected.
442
Chapter 12: Installation
Step 6. Apply power to the HP 64700
Step 6. Apply power to the HP 64700
The HP 64700B automatically selects the 115 Vac or 220 Vac range. In the 115 Vac range, the
HP 64700B will draw a maximum of 345 W and 520 VA. In the 220 Vac range, the HP 64700B will
draw a maximum of 335 W and 600 VA.
The HP 64700 is shipped from the factory with a power cord appropriate for your country. You should
verify that you have the correct power cable for installation by comparing the power cord you received
with the HP 64700 with the drawings under the "Plug Type" column of the following table.
If the cable you received is not appropriate for your electrical power outlet type, contact your
Hewlett-Packard sales and service office.
443
Chapter 12: Installation
Step 6. Apply power to the HP 64700
Power Cord Configurations
Plug Type
Cable Part No.
Plug Description
Length in/cm
Color
Opt 903
124V **
8120-1378
Straight
* NEMA5-15P
90o
90/228
Jade Gray
90/228
Jade Gray
Straight
* BS136A
90o
90/228
Gray
90/228
Mint Gray
Straight
* NZSS198/ASC
90o
79/200
Gray
87/221
Mint Gray
Straight
* CEE7-Y11
90o
Straight
(Shielded)
79/200
Mint Gray
79/200
Mint Gray
79/200
Coco
Brown
8120-1521
Opt 900
250V
8120-1351
8120-1703
Opt 901
250V
8120-1369
8120-0696
Opt 902
250V
812001689
8120-1692
8120-2857
* Part number shown for plug is industry identifier for plug only.
Number shown for cable is HP part number for complete cable including plug.
** These cords are included in the CSA certification approval for the equipment.
444
Chapter 12: Installation
Step 6. Apply power to the HP 64700
Power Cord Configurations (Cont’d)
Plug Type
Opt 906
250V
Cable Part No.
8120-2104
Color
79/20
Mint Gray
79/200
Mint Gray
Straight
*DHCK107
90o
79/200
Mint Gray
79/200
Mint Gray
79/200
Jade Gray
8120-4211
Straight
SABS164
90o
8120-4753
Straight Miti
90/230
8120-4754
90o
90/230
Opt 912
220V
8120-2957
Opt 918
100V
Length in/cm
Straight
* SEV1011
1959-24507
Type 12
90o
8120-2296
Opt 917
250V
Plug Description
8120-4600
79/200
Dark Gray
* Part number shown for plug is industry identifier for plug only.
Number shown for cable is HP part number for complete cable including plug.
** These cords are included in the CSA certification approval for the equipment.
445
Chapter 12: Installation
Step 6. Apply power to the HP 64700
1 Connect the power cord and turn on the HP 64700.
The line switch is a push button located at the lower left hand corner of the front panel. To turn ON
power to the HP 64700, push the line switch button in to the ON (1) position. The power light at the
lower right hand corner of the front panel will be illuminated.
446
Chapter 12: Installation
Step 6. Apply power to the HP 64700
When the emulator powers up, it sends a message (similar to the one that follows) to the selected
command port and then displays the Terminal Interface prompt. You can verify that your data
communications configuration is at least partially functional by looking for the message and prompt on
the controlling device (terminal or terminal emulation program running on a host computer).
Copyright (c) Hewlett-Packard Co. 1987
All Rights Reserved. Reproduction, adaptation, or translation without prior
written permission is prohibited, except as allowed under copyright laws.
HP64700B Series Emulation System
Version: B.01.00 20Dec93
Location: Flash
System RAM:1 Mbyte
HP64751A Motorola 68340 Emulator
HP64740 Emulation Analyzer
R>
447
Chapter 12: Installation
If the HP 64700 does not provide the Terminal Interface prompt
If the HP 64700 does not provide the Terminal
Interface prompt
When using the RS-232/RS-422 interface:
If the HP 64700 does not provide the Terminal Interface prompt to the controlling
device when power is applied:
Make sure that you have connected the emulator to the proper power source and
that the power light is lit.
Make sure that you have properly configured the data communications switches on
the emulator and the data communications parameters on your controlling device.
You should also verify that you are using the correct cable.
The most common type of data communications configuration problem involves
the configuration of the HP 64700 as a DCE or DTE device and the selection of the
RS-232 cable. If you are using the wrong type of cable for the device selected, no
prompt will be displayed.
When the serial port is configured as a DCE device, a modem cable should be used
to connect the HP 64700 to the host computer of terminal. Pins 2 and 3 at one end
of a modem cable are tied to pins 2 and 3 at the other end of the cable.
When the serial port is configured as a DTE device, a printer cable should be used
to connect the HP 64700 to the host computer of terminal. Pins 2 and 3 at one end
of a printer cable are swapped and tied to pins 3 and 2, respectively, at the other end
of the cable.
If you suspect that you may have the wrong type of cable, try changing the S4
setting and cycling power.
448
Chapter 12: Installation
If the HP 64700 does not provide the Terminal Interface prompt
When using the LAN interface:
You must use the telnet command on the host computer to access the HP 64700.
After powering up the HP 64700, it takes a minute before the HP 64700 can be
recognized on the network. After a minute, try the telnet <internet address>
command.
If telnet does not make the connection:
Make sure that you have connected the emulator to the proper power source and
that the power light is lit.
Make sure that the LAN cable is connected. Refer to your LAN documentation for
testing connectivity.
Make sure that the HP 64700’s Internet Address is set up correctly. You must use
the RS-232/RS-422 port to verify this that the Internet Address is set up correctly.
While you accessing the emulator via the RS-232/RS-422 port, run performance
verification on the LAN interface with the lanpv command. See "To run PV on the
LAN interface".
If telnet makes the connection, but no Terminal Interface prompt is supplied:
It’s possible that the HP 64000 software is in the process of running a command
(for example, if a repetitive command was initiated from telnet in another window).
You can use <CTRL>c to interrupt the repetitive command and get the Terminal
Interface prompt.
It’s also possible for there to be a problem with the HP 64700 firmware while the
LAN interface is still up and running. In this case, you must cycle power on the
HP 64700.
449
Chapter 12: Installation
To run PV on the LAN interface
To run PV on the LAN interface
1 Connect a host computer or terminal to the HP 64700 using the RS-232 interface.
The HP 64700 LAN interface can be tested through a Terminal Interface command
called lanpv. You can only use this command when communicating with the
HP 64700 over an RS-232 connection. Do not use this command when
communicating with the HP 64700 over the LAN.
2 Disconnect the HP 64700 from the LAN and terminate the HP 64700’s LAN port
you want to test.
Before you run the test, the HP 64700 must be disconnected from the network.
The connector you wish to test must be completely terminated, and the other
connector must not be terminated. Only one connector can be tested at a time.
To properly terminate the BNC port, place a BNC "T" connector on the port and
place 50 ohm terminators on each end of the T-connector.
To properly terminate the 15-pin AUI port, leave the MAU attached to the port and,
using the appropriate loopback hood or loopback connector, terminate the end of
the MAU that is normally connected to the LAN.
3 Access the Terminal Interface and enter the lan -va command to test the 15-pin
AUI connector or the lan -vb command to test the BNC connector.
This command will return "PASSED" or "FAILED" before issuing a prompt. For
example, to test the BNC connector:
R>lanpv -vb
Testing: HP 64700B LAN interface (BNC connector)
PASSED
450
Chapter 12: Installation
Step 7. Verify emulator and analyzer performance
Step 7. Verify emulator and analyzer performance
The emulator probe must be plugged into to the demo target system when you run
the performance verification tests.
After the emulator probe is plugged into the demo target system (make sure the
power lines from the emulator are connected to the demo target system), power has
been applied to the HP 64700, and the HP 64700 has supplied the Terminal
Interface prompt to the controlling device, you can run performance verification
tests on the emulator and analyzer.
1 Type the "pv" command, along with the number of times you want to execute the
command.
For example:
R>pv 1
Testing:
PASSED
Number
Testing:
PASSED
Number
HP64751A Motorola 68340 Emulator
of tests: 1
Number of failures: 0
HP64740 Emulation Analyzer
of tests: 1
Number of failures: 0
Copyright (c) Hewlett-Packard Co. 1987
All Rights Reserved. Reproduction, adaptation, or translation without prior
written permission is prohibited, except as allowed under copyright laws.
HP64700B Series Emulation System
Version:
B.01.00 20Dec93
Location: Flash
System RAM:1 Mbyte
HP64751A Motorola 68340 Emulator
HP64740 Emulation Analyzer
R>
451
Chapter 12: Installation
If performance verification fails
If performance verification fails
Make sure the emulator probe cables are connected to the demo target system
correctly (see Step 5) and that the power lines from the emulator are connected to
the demo target system.
Make sure the emulator and analyzer boards have been installed into the HP 64700
Card Cage correctly (see Step 2) and that there are no bent or broken pins on any of
the connectors.
If this does not seem to solve the problem, call the nearest Hewlett-Packard Sales
and Service office listed in the Support Services manual.
452
13
Installing/Updating Emulator
Firmware
453
Installing/Updating Emulator Firmware
If you ordered the HP 64751A 68340 emulator probe and the HP 64748C
emulation control card together, the control card contains the correct firmware for
the HP 64751A.
However, if you ordered the HP 64751A and the HP 64748C separately, or if you
are using a HP 64748C that has been previously used with a different emulator
probe, you must download the firmware for the HP 64751A into the emulation
control card.
The firmware, and the program that downloads it into the control card, are included
with the 68340 emulator probe on the following MS-DOS format floppy disks:
•
68340 EMULATION FIRMWARE 64751
•
64700 SW UTIL
The steps to install or update the emulator firmware are:
454
1
Connect the HP 64700 card cage to an IBM PC AT compatible computer’s
RS-232 serial port.
2
Install the firmware update utility and the 64751 emulator firmware.
3
Run "progflash" to update emulator firmware.
Chapter 13: Installing/Updating Emulator Firmware
Step 1. Connect the HP 64700 to a PC host computer
Step 1. Connect the HP 64700 to a PC host
computer
1 Set the HP 64700 data communications configuration switches.
Set all "COMM CONFIG" (communications configuration) switches on the rear panel of the HP 64700
to the zero or open position.
Note that switch settings are read ONLY after the HP 64700 is powered up. Any changes made to the
switches after power-up will not be read until you turn the HP 64700 off and back on again.
455
Chapter 13: Installing/Updating Emulator Firmware
Step 1. Connect the HP 64700 to a PC host computer
2 Connect the RS-232 cable.
Recommended cables are HP 13242N (25-pin male to 25-pin male) or HP 24542M (9-pin female to
25-pin male) which are equivalent to a MODEM cable.
To connect cables to the HP 64700, simply align the cable with the serial port and insert the 25-pin male
connector of the cable until it is firmly seated. You should then tighten the holding screws on each side
of the cable with a small flat blade screwdriver. This will ensure that the cable pins and shield hood
make good contact with the HP 64700 connector and will also guard against accidental disconnection of
the cable.
456
Chapter 13: Installing/Updating Emulator Firmware
Step 2: Install the firmware update utility
Step 2: Install the firmware update utility
Your HP Vectra PC or IBM PC AT compatible computer must have MS-DOS 3.1
or greater and a fixed disk drive. The firmware update utility and the 64751
firmware require about 300 Kbytes of disk space.
1 Insert the 64700 SW UTIL disk into drive A.
2 Change MS-DOS prompt to drive A: by typing "A:" at the MS-DOS prompt.
For example:
C> A: <RETURN>
A>
3 Type "INSTALL" at the MS-DOS prompt.
For example:
A> INSTALL <RETURN>
After confirming that you want to continue with the installation, the install program
will give you the option of changing the default drive and/or subdirectory where the
software will reside. The defaults are:
Drive = C:
Directory Path = C:\HP64700
Follow the remaining instructions to install the firmware update utility and the
64751 firmware. These instructions include editing your CONFIG.SYS and
AUTOEXEC.BAT files. Details follow in the next steps.
4 After completing the install program, use the PC editor of your choice and edit the
\CONFIG.SYS file to include these lines:
BREAK=ON
FILES=20
457
Chapter 13: Installing/Updating Emulator Firmware
Step 2: Install the firmware update utility
BREAK=ON allows the system to check for two break conditions:
<CTRL><Break>, and <CTRL>c.
FILES=20 allows 20 files to be accessed concurrently. This number must be at
LEAST 20 to allow the firmware update utility to operate properly.
5 Edit the AUTOEXEC.BAT file to add:
C:\HP64700\BIN (to the end of the PATH variable)
SET HPTABLES=C:\HP64700\TABLES (as a new line)
SET HPBIN=C:\HP64700\BIN (as a new line)
Part of an example AUTOEXEC.BAT file resembles:
ECHO OFF
SET HPTABLES=C:\HP64700\TABLES
PATH=C:\DOS;C:\HP64700\BIN
6 If you are using the COM3 or COM4 ports, you will need to edit the
\HP64700\TABLES\64700TAB file. The default file contains entries to establish
the communications connection for COM1 and COM2. The content of this file is:
EMUL_COM1 unknown COM1 OFF 9600 NONE ON 1 8
EMUL_COM2 unknown COM2 OFF 9600 NONE ON 1 8
Either add another line or modify one of the existing lines. For example:
EMUL_COM3 unknown COM3 OFF 9600 NONE ON 1 8
EMUL_COM4 unknown COM4 OFF 9600 NONE ON 1 8
The "unknown" field usually specifies the processor type (which is "m68340" for
the HP 64751 emulator), but you don’t need to change this field in order to update
the emulator firmware.
Software installation is now complete. The PC will need to be rebooted to enable
the changes made to the CONFIG.SYS and AUTOEXEC.BAT files. To reboot,
press the <CTRL><ALT><DEL> keys simultaneously.
458
Chapter 13: Installing/Updating Emulator Firmware
Step 3: Run "progflash" to update emulator firmware
Step 3: Run "progflash" to update emulator
firmware
• Enter the PROGFLAS [-V] [EMUL_NAME] [PRODUCTS ...] command.
The PROGFLAS command downloads code from files on the host computer into
Flash EPROM memory in the HP 64700.
The -V option means "verbose". It causes progress status messages to be displayed
during operation.
The EMUL_NAME option is the logical emulator name as specified in the
\HP64700\TABLES\64700TAB file.
The PRODUCTS option names the products whose firmware is to be updated.
If you enter the PROGFLAS command without options, it becomes interactive. If
you don’t include the EMUL_NAME option, PROGFLAS displays the logical
names in the \HP64700\TABLES\64700TAB file and asks you to choose one. If
you don’t include the PRODUCTS option, PROGFLAS displays the products
which have firmware update files on the system and asks you to choose one. (In
the interactive mode, only one product at a time can be updated.) You can abort the
interactive PROGFLAS command by pressing <CTRL>c.
PROGFLAS will print "Flash programming SUCCEEDED" and return 0 if it is
successful; otherwise, it will print "Flash programming FAILED" and return a
nonzero (error).
You can verify the update by displaying the firmware version information.
459
Chapter 13: Installing/Updating Emulator Firmware
Step 3: Run "progflash" to update emulator firmware
Examples
To install or update the HP 64751 emulator firmware in the HP 64700 that is
connected to the COM1 port:
C> PROGFLAS <RETURN>
HP64700S006 A.00.04 24Feb92
64700 SW UTIL
A Hewlett-Packard Software Product
Copyright Hewlett-Packard Co. 1991
All Rights Reserved. Reproduction, adaptation, or translation without prior
written permission is prohibited, except as allowed under copyright laws.
RESTRICTED RIGHTS LEGEND
Use , duplication , or disclosure by the Government is subject to
restrictions as set forth in subparagraph (c) (1) (II) of the Rights
in Technical Data and Computer Software clause at DFARS 52.227-7013.
HEWLETT-PACKARD Company , 3000 Hanover St. , Palo Alto, CA 94304-1181
Logical Name
1 EMUL_COM1
2 EMUL_COM2
Processor
unknown
unknown
Number of Emulator to Update? (intr (usually cntl C or DEL) to abort)
To update firmware in the HP 64700 that is connected to the COM1 port, enter "1".
Product
1 64751
Number of Product to Update? (intr (usually cntl C or DEL) to abort)
To update the HP 64751A 68340 emulator firmware, enter "1".
Enable progress messages? [y/n] (y)
To enable status messages, enter "y".
460
Chapter 13: Installing/Updating Emulator Firmware
Step 3: Run "progflash" to update emulator firmware
Checking System firmware revision...
Mainframe is a 64700B
Reading configuration from ’/hp64700/update/64751.cfg’
ROM identifier address = 2FFFF0H
Required hardware identifier = 1FFFH,1FF4H
Control ROM start address = 280000H
Control ROM size = 40000H
Control ROM width = 16
Programming voltage control address = 2FFFFEH
Programming voltage control value = FFFFH
Programming voltage control mask = 0H
Rebooting HP64700...
Checking Hardware id code...
Erasing Flash ROM
Downloading ROM code: /hp64700/update/64751.X
Code start 280000H (should equal control ROM start)
Code size 27BF4H (must be less than control ROM size)
Finishing up...
Rebooting HP64700...
Flash programming SUCCEEDED
C>
You could perform the same update as in the previous example with the following
command:
C> PROGFLAS -V EMUL_COM1 64751 <RETURN>
461
462
Glossary
access mode Specifies the types of cycles used to access target system memory
locations. For example a "byte" access mode tells the monitor program to use
load/store byte instructions to access target memory.
active emulator probe An emulator probe that contains circuitry that allows the
emulator to more closely imitate the electrical characteristics of the microprocessor
thereby avoiding the timing problems that can occur with passive probes.
analyzer An instrument that captures data on signals of interest at discreet
periods.
background The emulator mode in which foreground operation is suspended so
the emulation processor can be used for communication with the emulation
controller. The background monitor does not occupy any processor address space.
background emulation monitor An emulation monitor that does not execute
as part of the user program, and therefore, operates in the emulator’s background
mode.
display mode When displaying memory, this mode tells the emulator the size of
the memory locations to display. When modifying memory, the display mode tells
the emulator the size of the values to be written to memory.
embedded microprocessor system The microprocessor system which the
emulator plugs into.
emulation bus analyzer The internal analyzer that captures emulator bus cycle
information synchronously with the processor’s clock signal.
emulation monitor program A program that is executed by the emulation
processor which allows the emulation controller to access target system resources.
For example, when you display target system memory locations, the monitor
program executes microprocessor instructions that read the target memory locations
and send their contents to the emulation controller.
463
Glossary
emulator An instrument that performs just like the microprocessor it replaces, but
at the same time, it gives you information about the operation of the processor. An
emulator gives you control over target system execution and allows you to view or
modify the contents of processor registers, target system memory, and I/O
resources.
foreground The mode in which the emulator is executing the user program. In
other words, the mode in which the emulator operates as the target microprocessor
would.
global restart When the same secondary branch condition is used for all terms in
the analyzer’s sequencer, and secondary branches are always back to the first term.
prestore The analyzer feature that allows up to two states to be stored before
normally stored states. This feature is useful when you want to find the cause of a
particular state. For example, if a variable is accessed from many different places in
the program, you can qualify the trace so that only accesses of that variable are
stored and turn on prestore to find out where accesses of that variable originate
from.
primary sequencer branch Occurs when the analyzer finds the primary branch
state specified at a certain level and begins searching for the states specified at the
primary branch’s destination level.
real-time Refers to continuous execution of the user program without
interference from the emulator. (Such interference occurs when the emulator
temporarily breaks into the monitor so that it can access register contents or target
system memory or I/O.)
secondary sequencer branch Occurs when the analyzer finds the secondary
branch state specified at a certain level before it found the primary branch state and
begins searching for the states specified at the secondary branch’s destination level.
sequence terms Individual levels of the sequencer. The analyzer provides 8
sequence terms.
sequencer The part of the analyzer that allows it to search for a certain sequence
of states before triggering.
464
Glossary
sequencer branch Occurs when the analyzer finds the primary or secondary
branch state specified at a certain level and begins searching for the states specified
at another level.
target system The microprocessor system which the emulator plugs into.
trace A collection of states captured on the emulation bus (in terms of the
emulation bus analyzer) or on the analyzer trace signals (in terms of the external
analyzer) and stored in trace memory.
trigger The captured analyzer state about which other captured states are stored.
The trigger state specifies when the trace measurement is taken.
465
466
Index
144-pin TQFP target system, 54
A
abbreviated help mode, 243
absolute count (in trace list), 150, 292
absolute file
formats, 232, 248
loading into memory, 104, 248-249
accent grave mark character, 234, 270
access mode, 257, 463
access to guarded memory, 255
accuracy of trigger position, 310
active edges (slave clock), 320-321
activity, analyzer line, 280
addr (predefined trace label), 154
address overlap, memory mapping, 99
altitude, operating and non-operating environments, 396
ambiguous address error message, 98, 210, 256
analyzer, 463
analyzer initialization, 303-304
arming other HP 64700 Series analyzers, 5
breaking emulator execution into the monitor, 4
breaking execution of other HP 64700 Series emulators, 5
clock (master) specification, 285-286
complex config. pattern qualifier, 311-312
complex config. range qualifier, 314-315
configuration, 283-284
count qualifier, 287-288
definition, 4
demo program, 406
general description, 4
halt trace, 298-299
labels, 308-309
line activity, 280
master clock specification, 285-286
performance verification, 259
prestore qualifier, 313
467
Index
primary branches (sequencer), 300-302
sequencer, 322-324
sequencer secondary branch qualifiers, 289-291
slave clocks, 320-321
start, 279
storage qualifiers, 325-326
trace labels, predefined equates for, 154
trace list, 305-307
trace list format, 292-293
trace status, 316-319
tracing background operation, 285
tracing foreground operation, 286
trigger condition, 294-295
trigger output, 296-297
trigger position, 310
using the, 136
analyzer input lines and signal names, 152
and, interset logical AND operator, 240
arm condition
analyzer status, 317
specifying, 202, 281-282
time until trigger, 317
arming the analyzer, 281-282
ASCII strings, displaying on standard output, 234
asterisks, displayed for write-only registers, 126
AUTOEXEC.BAT file, 457-458
B
468
b (break into monitor) command, 32, 116, 211
background, 61, 463
cycles, tracing, 139
emulation monitor, 463
execution, tracing, 285
background monitor, 62
selecting, 63, 66
base address, 64
bases (number), 328
default for step count, 268
labels in trace list, 292
baud rates, serial port, 432
bc (break conditions) command, 212-213
bc command, 124-125
binary trace list format, 306
Index
blocks (emulation memory)
re-assignment of, 256
size of, 93
BNC
connector, 5, 192
trigger signal, 194, 212, 214-215
bnct (BNC trigger drivers and receivers) command, 214-215
BOOTP, 436
bootptab file, 436
bp (breakpoint modify) command, 216-217
bp command, 121
branch qualifiers (sequencer)
primary, 164, 166, 178, 300-302
secondary, 164, 167, 178, 289-291
break, 211
write to ROM, 124
break conditions, 124-125
after initialization, 85
analyzer trigger, 125
BNC or CMB trigger signals, 212
guarded memory access, 255
software breakpoints, 212
synchronous, 225
trig1 or trig2 internal signals, 212
write to ROM, 212
breakpoints, software, 120-123
after initialization, 85
C
cables
data communications, 434, 456
emulator probe, length, 395
power, 443
calculator for expressions, 234
caution
match transition socket and microprocessor, 51
cautions
antistatic precautions, 49, 414
avoid damaging traces, 51
BNC accepts only TTL voltage levels, 197
check orientation and alignment, 52
CMB 9-pin port is NOT for RS-232C, 195
damage from incorrect alignment of pin 1, 51
469
Index
do not pry extender off, 53
do not use probe without pin extender, 48
emulator suspension rating of 29.5 kg, 395
excessive mechanical force, 52
improper alignment will damage equipment, 54
orange dot not the same as pin A1, 52
powering OFF the HP 64700, 42
protect emulator against static discharge, 41
pv command re-initializes emulator, 259
rear panel, do not stand HP 64700 on, 418
cf (emulator configuration) command, 218-222
cf lfc command, 107
cf mon command, 63, 66
cf regfmt command, 128
cf rrt command, 59
cf rv (set reset values) command, 27
cf rv command, 27, 59
channels (analyzer)
demultiplexed slave clock mode, 320
mixed slave clock mode, 321
character length, 433
characteristics, emulator, 382-396
characterization of memory, 95
chip selects, access emulation memory with, 94
cl (command line editing) command, 79, 223-224
clock source, external, 382
clock source, selecting, 43, 58
clocks
specifying analyzer master, 285-286
specifying analyzer slave, 320-321
CMB (coordinated measurement bus), 192
enable/disable, 225
EXECUTE line, 194
HP 64700 connection, 195
READY line, 193
signals, 193
start synchronous execution, 332
trace at /EXECUTE, 327
TRIGGER line, 193
trigger signal, 212, 227-228, 327
cmb (enable/disable CMB interaction) command, 199, 225-226
470
Index
cmbt (CMB trigger drivers/receivers) command, 227-228
column headers in trace list
adding new columns, 292
suppressing, 305
command files
LAN, using over, 82
command syntax, 73
commands
bc, 124-125
bp, 121
cf lfc, 107
cf mon, 63, 66
cf regfmt, 128
cf rrt, 59
cf rv, 27, 59
combining on a single command line, 78
groups, viewing help for, 73
help, 243
help for group, 243
macros, 252-253
map, 100
maximum length of command line, 253
recall, 79
repeating a group of, 265
sym, 275-277
sync, 278
communications (data)
initialization, 244
setting parameters, 272-274
communications configuration switch summary, 432
communications ports, 431-434, 455-456
electrical characteristics, 394
physical characteristics, 395
comparison of foreground/background monitors, 62
complex analyzer configuration
definition, 178
pattern specifications, 311-312
range specification, 314-315
complex expressions, 240
CONFIG.SYS file, 457-458
471
Index
configuration
analyzer, 283-284
data communications switches, 272
emulator, 218-222
See emulator configuration
expanded register displays, 128
for operation with target system, 57-60
monitor selection, 63, 66
program counter, 59
program load function codes, 107
restrict to real-time runs, 59
supervisor stack pointer, 59
configuration switches, HP 64700B
summary, 432
connecting
emulator probe to target system, 48
to a 144-pin TQFP pacakge, 54
to a 68340 PGA package, 48
to a QFP package, 49
using the HP Elastomeric probing system, 54
constants, 328
control (CTRL) characters
c, command abort, 249, 259, 265, 268
non-displaying, 235
coordinated measurements
definition, 192
enable/disable, 225-226
copy memory, 229
count (occurrence), 294, 300, 318
reset if secondary branch taken, 290
count qualifier, 160, 287-288
counter, analyzer tag, 287
counts, displaying relative or absolute, 150
cp (copy memory) command, 133, 229
CPU in wait state, status message, 65, 95, 255
cross-triggering, 214, 225
custom foreground monitor program, 66
D
472
data (predefined trace label), 154
data communications
cable selection, 434, 456
configuration switches, 272
Index
initialization, 244
location of ports, 431
setting port parameters, 272-274
switch settings, 431
switch summary, 432
data cycles, monitor access to target memory, 257
date, setting emulation system, 231
DCE device, setting serial port as a, 432
deleting sequencer terms, 323
delimiters (string), 234, 270
demo (quick start demo program) command, 23, 230
demo board, 382
demo programs
analyzer, 406
emulator, 405
quick start, 401
demo target system, 382
DeMorgan’s law, 176, 240
demultiplexing, using slave clocks for, 320
design considerations (target system), 382
dimensions
emulator, 395
probe, 395
disassembly, trace list, 292
display mode, 257, 463
downloading absolute files, 5, 104, 248-249
drivers and receivers
BNC trigger signal, 214-215
CMB trigger signal, 227-228
See also trig1 and trig2 internal signals
dt (set or display system date/time) command, 231
DTACK interlock, 95, 255
DTE device, setting serial port as a, 432
dual-port emulation memory, 59
dump (upload memory) command, 232-233
E
easy configuration, definition, 178
echo (display to standard output) command, 234-235
edges (analyzer clock), rising, falling, both, 285
edges (analyzer slave clock), active, 320-321
8-bit memory, substituting emulation memory for, 94
electrical characteristics of the emulator, 382
473
Index
embedded microprocessor system, 463
emulation break, 211
emulation bus analyzer, 463
emulation memory, 93
8-bit, substituting for, 94
after initialization, 85
block size, 93
dual-port, 59
size of, 93
synchronizing to target system, 95, 255
emulation monitor, 463
break command, 211
breaks to the, 212
cycles used to access target memory, 257
enter after reset, 266
foreground or background, 61-63, 65-70
function of, 61
searching target memory, 271
emulation status character, 23, 32
emulator, 464
demo program, 405
dimensions, 395
electrical characteristics, 382
environmental characteristics of, 396
error messages, 334-337
general description, 4
initialization, 244-245
multiple start/stop, 5, 199-200
performance verification, 259
physical characteristics, 394
plugging into a target system, 40
probe cable length, 395
prompt, changing the, 258
select clock source, 43, 58
specifications and characteristics, 382-396
status, 238
status characters, 87
using the, 84
weight, 395
474
Index
emulator configuration
after initialization, 85
on-line help for, 73
emulator configuration items
clk, 58
lfc, 107
mon, 63
monaddr, 64
mondsi, 65
monintr, 65
regfmt, 128
rrt, 59
rv, 59, 115
emulator features
breakpoints, 120-123
restrict to real-time runs, 59
single-step processor, 116
emulator limitations, external DMA support, 94
emulator probe
access to target system, 394
active, 463
cable length, 395
dimensions, 395
pin alignment, 48
plugging into a target system, 40
power requirements, 382
target system connection, 41-56
environment variables
HPBIN, 458
HPTABLES, 458
PATH, 458
environmental characteristics of the emulator, 396
equ (equate names to expressions) command, 154, 236-237
equates, 236-237
predefined for trace labels, 154
equipment required
to connect QFP surface mount adapter, 49
to install emulation system, 413
equipment supplied
with surface mount adapter, 49
with the emulator, 413
475
Index
eram, mapper parameter for emulation RAM, 95, 254
erom, mapper parameter for emulation ROM, 95, 254
error messages, 334
analyzer, 371-379
emulator, 334-337
general and system error/status, 345-370
es (emulator status) command, 36, 87, 238
EXECUTE (CMB signal), 194, 225, 316, 327, 332
expanded register displays, 128
expression calculator, 234
expression operators, 328
expressions, 151
analyzer, complex configuration, 240
equating names to, 236-237
in the complex configuration, 174-177
F
476
fast (F) analyzer clock speed, 286
fast termination mode, 94
file formats, absolute, 104, 232, 248
firmware update utility
installation, 457-458
firmware updates, 5
foreground, 61, 464
execution, tracing, 286
foreground monitor, 62
advantages/disadvantages, 62
customizing, 62
example of using, 67
memory space required, 62
selecting, 63, 66
single-step, 66
formats
absolute file, 232, 248
binary trace list, 306
memory display, 250
trace list, 150, 292-293
function code lines to analyzer, 153
function codes
for program loads, 107
memory mapping, 99
need for separately linked modules, 99
Index
G
global access and display modes, 257
global restart qualifier, 163-164, 289, 294, 301, 322, 464
global set operators, 176
global storage qualifier, 325
grave mark character, 234, 270
grd, mapper parameter for guarded memory, 95, 255
ground strap, 41
group (command), 243
guarded memory access, 95, 99, 255
H
halt
trace, 144, 298-299
trace status, 316
handshake mode, 273
headers in trace list
adding new columns, 292
suppressing, 305
help
abbreviated mode, 243
information on system prompts, 87
using, 73
help (on-line help) command, 243
history, trace status, 318
HP 64037 RS-422 Interface Card, 5
HP 98659 RS-422 Interface Card, 5
HPBIN environment variable, 458
HPTABLES environment variable, 458
I
information (help), 243
init (emulator initialization) command, 85, 244-245
initial values for SSP and PC, 27
initialization
analyzer, 137, 303-304
emulator, 85, 244-245
emulator, -c option, 85
emulator, -p option, 85
emulator, -r option, 86
emulator, limited, 85
input lines and signal names for analyzer, 152
inserting sequencer terms, 322
477
Index
installation
68340 emulator, 411
emulator probe into target system, 40
QFP adapter assembly, 49
interlock DTACK, 95, 255
internal signals, trig1 and trig2, 212, 214, 227, 281, 298, 327
interrupt priority level, selecting, 65
interrupts, 62
interset operators, 176, 240
intraset operators, 176, 240
inverse assembler options, 306
inverse values (complex analyzer expressions), 241
478
L
L clock (analyzer), 285, 321
labels (trace)
defining analyzer, 308-309
predefined, 308
LAN connection, 435-436
LAN interface, 435-436, 450
BOOTP enable/disable, 436
enabling, 435
port selection, 435
limited initialization, 85
line activity (analyzer), 280
list, trace, 145
load (load absolute file) command, 248-249
load symbols command, 110
loading programs
function codes, 107
simplify multi-module loads, 108
M
m (memory display/modify) command, 26, 132, 250-251
M clock (analyzer), 285, 321
mac (macro definition/display) command, 252-253
macros
after initialization, 85
limitations, 253
simplifying multi-module loads, 108
using, 81
map (memory mapper) command, 96, 254-256
map command, 100
mapping memory, 93-103, 254-256
Index
master clocks (analyzer), 285-286
maximum
command line length, 253
sequence levels in easy configuration, 301
sequence terms in easy configuration, 322
measurements
analyzer, starting, 279
coordinated, 225-226
memory
assess mode, 257
characterization of, 95
display mode, 257
displaying, 250-251
dual-port emulation, 59
loading programs into, 104, 248-249
map after initialization, 85
mapping, 93-103, 254-256
mnemonic format display, 131
modifying, 250-251
re-assignment of emulation memory blocks in mapper, 98
search, 270-271
upload to host file, 232-233
memory mapping
block size, 93
function codes, 98
overlapping addresses, 99
resolution of mapped ranges, 93, 254
using emulation memory in place of target, 100
messages
error, 334
status, 345-370
mixed (slave clock) mode, 321
mnemonic information in the trace list, 292
mo (set access and display modes) command, 257
mode
abbreviated help, 243
demultiplexed slave clock, 320
memory access, 257
memory display, 257
479
Index
mixed slave clock, 321
quiet, 249, 268
whisper, 268, 316
monitor (emulation)
break command, 211
breaks to the, 212
comparison of foreground/background, 62
cycles used to access target memory, 257
enter after reset, 266
foreground or background, 61-63, 65-70
function of, 61
searching target memory, 271
selecting, 63, 66
multiple emulator start/stop, 5
N
480
N clock (analyzer), 285, 321
names
pattern, 311
values, 236-237
NAND operator, 241
no trace data (message), 305
none (analyzer keyword), 287
NOR, intraset logical operator, 240
notes
absolute files, loading in the wrong format, 249
analyzer count qualifier cannot be arm condition, 287
analyzer drives and receives same signal, 204
analyzer range resource, only one available, 152
analyzer, "tcq time" only if "tck -s S", 287
asterisk (*) in help command, 243
breakpoint display status checking, 216
breakpoint locations must contain opcodes, 121
CMB EXECUTE and TRIGGER signals, 194
dashes (-) when specifying command parameters, 248
data communications references, 274
date and time are reset when power is cycled, 231
date assumes year is in 20th century, 231
display mode and memory modification, 251
dump creates non-standard HP absolute files, 233
emulation memory block re-assignment, 256
equate limits, 236
equates, new values not updated in commands, 236
Index
equates, when values are assigned, 156
init -c, -r, or -p cause system memory loss, 244
map change requires breakpoint disable, 256
master clock qualifiers: tck -u, tck -b, 286
memory map modification causes emulator reset, 256
occurrence counts in complex configuration, 300
operations carried out on 32-bit numbers, 329
primary and secondary branch qualifiers satisfied, 289, 301
range reset when trace configuration reset to easy, 314
re-assignment of emulation memory blocks by mapper, 98
rx command enables CMB interaction, 225
search patterns, specifying complex, 271
sequence term count reset, 290
sequencer term 8 default, 290, 301
single open quote, ASCII character, 234, 270
step command doesn’t work when CMB enabled, 200
step count must be specified with address, 268
step does not work correctly while CMB enabled, 269
string delimiter character should not be in string, 234
strings should not contain string delimiter character, 270
trace format does not affect information captured, 293
trace list command options, mutually exclusive, 306
trace states, displaying when trigger not found, 298
xon toggling with baud rates of 1200 or below, 273
number bases, 328
numbers, software version, 330
numeric search in memory, 270
O
occurrence count, 157, 294, 300, 318
reset if secondary branch taken, 290
on-line help, using the, 73
operators
combining intraset and interset, 240
expression, 328
interset, 176, 240
intraset, 176, 240
optional parts, 413
or, interset logical OR operator, 240
OR, intraset logical operator, 240
other, mapper parameter for unmapped memory, 254
overlap, trace labels, 309
overlapping addresses, memory mapping, 99
481
Index
P
482
p1 - p8, trace pattern labels, 311
parameters, data communications, 272-274
parity
error detection, 433
reasons for setting, 433
switch settings for, 433
types of (odd/even), 433
parts list
QFP surface mount adapter assembly, 53
PATH environment variable, 458
patterns (trace), 174
limitations of combining, 176
names, 311
qualifying, 174, 311-312
PC values, setting initial, 59
performance verification, 259, 451
failure, what to do in case of, 452
LAN interface, 450
physical characteristics of the emulator, 394
pin extender, 48
pipeline, analyzer architecture, 317
plug-in, 40
po (set or display prompt) command, 258
polarity, trace labels, 308
ports (data communications)
setting parameters, 272-274
position of trigger state in trace, 310
power cables
connecting, 443
correct type, 443
power requirements of emulator probe, 382
powerup initialization, 244
predefined equates for trace labels, 154
predefined trace labels, 154, 308
prestore qualifier, 159, 313, 464
primary branches (analyzer sequencer), 164, 166, 300-302, 464
difference between easy and complex configuration, 178
probe
connecting to target system, 41-56
emulator, 259
Index
probing system
HP Elastomeric, 54
progflash example, 460
program counter
predefining, 59
program counter symbol ($), 260
program counter, initial value, 27
programs, load function codes, 107
prompts, 87
changing, 258
es (emulator status) command, 87
help information on, 87
protocol (transfer), 232, 248, 306
protocol checking, 249
prototyping socket, 47
pv (performance verification) command, 259
Q
QFP on target system, connecting to, 49
QFP surface mount adapter assembly, 49
qualifiers
analyzer count, 160, 287-288
analyzer master clock, 285-286
analyzer pattern, 311-312
analyzer prestore, 159, 313
analyzer range, 314-315
analyzer storage, 158, 325-326
global restart, 289, 294, 301, 322
sequencer primary branch, 164, 300-302
sequencer secondary branch, 164, 289-291
simple trigger, 156
question mark (?)
break conditions display, 213
on-line help command, 243
quick start demo program, 230, 401
quick start information, 19
quiet mode, 249, 268
quote marks, 234, 258, 270
R
r (run user program) command, 28, 115, 260
RAM, mapping emulation or target, 95
range (trace), 175
range qualifier (complex analyzer config.), 314-315
483
Index
re-mapping memory, 65
READY (CMB signal), 193, 225, 332
real-time runs, 464
commands not allowed during, 59
commands which will cause break, 60
restricting the emulator to, 59
real-time runs, restrict to, 59
real-time runs, turn OFF restriction, 60
recall, command, 79
receivers and drivers
BNC trigger signal, 214-215
CMB trigger signal, 227-228
See also trig1 and trig2 internal signals
record checking, 232
reg (register display/modify) command, 34, 126-129, 261-264
regfmt (expanded register displays) emulator configuration item, 128
register displays, expanded, 128
registers, displaying, 126-129
registers, write-only, 126
relational expressions, 240
relative counts in trace list, 150, 292
relative humidity, operating and non-operating environments, 396
removing QFP adapter extender, 53
rep (repeat commands) command, 80, 265
repeating commands, 265
replaceable parts
QFP surface mount adapter assembly, 53
reset
break during, 211
breakpoints, 216
commands which cause exit from, 119
emulation microprocessor, 266
emulator, due to mapper modification, 256
init command, 244
occurrence count, 290
range qualifier and trace configuration, 314
run from, 115, 260
sequencer, 322
system date and time, 231
484
Index
target system, 219
trace specification, 303-304
trace tag counter, 287
resolution, memory mapper, 93, 254
restart (global) qualifier, 289, 294, 301, 322
restrict to real time runs, 59
target system dependency, 60
ROM
mapping emulation or target, 95
writes to, 95, 212
rrt (restrict to real-time) emulator configuration item, 59
RS-232
serial port as RS-232 device, 432
RS-232 (data communications), 274
RS-422
host computer interface card, 5
serial port as RS-422 device, 432
rst (reset emulation processor) command, 36, 266
run command
from reset, 115
rx (run at execute) command, 199
S
s (step the emulation processor) command, 35, 116, 268-269
secondary branch expression, 164, 167, 464
difference between easy and complex configuration, 178
select emulator clock source, 43, 58
selecting emulation monitor, 63, 66
semicolon (command separator), 252
sequencer (analyzer), 322-324, 464
adding or inserting terms, 169
branch, 465
complex configuration, 178-189
default specification, 163
default specification in the complex configuration, 179
deleting terms, 170, 322-323
difference between easy and complex configuration, 178
primary branches, 300-302
resetting, 165, 179
secondary branch qualifiers, 289-291
simple trigger specification, 165
terms, 163, 464
using, 163-170
485
Index
ser (search memory for values) command, 133, 270-271
serial port
DCE device, 432
DTE device, 432
RS-422 device, 432
signal considerations, 382
signal names and input lines for analyzer, 152
signals
analyzer clocks, 285, 321
analyzer, defining labels for, 308-309
arm, 317
BNC trigger, 212, 214-215
CMB, 193
CMB /EXECUTE, 225, 266, 316, 327, 332
CMB READY, 225, 332
CMB trigger, 212, 227-228
internal trig1 and trig2, 212, 281, 298, 327
trigger output, 296-297
simple trigger
in the complex configuration, 181
in the easy configuration, 156
single-step emulation processor, 268-269
slave clocks (analyzer), 320-321
demultiplexed mode, 320
mixed mode, 321
slow (S) analyzer clock speed, 286-287
software breakpoints, 120-123, 216-217
break condition enable/disable, 212
pv command effect on, 259
software version numbers, 330
specifications, emulator, 382-396
SSP values, setting initial, 59
stack pointer, defining supervisor, 59
startup, tracing a program on, 142
stat (predefined trace label), 154
states (trace)
maximum with/without count, 287
prestore, 313
status, 318
visible, 318
static discharge, protecting the emulator probe against, 41
486
Index
status
analyzer, 316-319
characters (emulation), 87
emulator, 238
status character (emulation), 23, 32
status messages, CPU in wait state, 65, 95, 255
status, trace, 143
storage qualifier, 158, 325-326
difference between easy and complex configuration, 178
string delimiters, 234, 270
string search in memory, 270
stty (set data communications parameters) command, 272-274, 432
summary of data communication switches, 432
supervisor stack pointer, initial value, 27
supervisor stack pointer, initial values, 59
switch (data communications configuration) setting, 272, 431
baud rate, 432
character length, 433
LAN interface, 435-436
parity checking, 433
parity type, 433
serial port as DCE/DTE device, 432
serial port as RS-232/RS-422 device, 432
switches, data communications configuration, 272
sym (define/display/delete symbols) command, 109, 112, 114, 275-277
symbol file, loading, 109
symbol names, creating, 236-237
symbols, 109
$, program counter, 260
*, trace status, 319
sync (synchronize emulator) command, 278
synchronous runs and breaks, 225, 332
system clock, 231, 259
system date/time, 231
T
t (start trace) command, 29, 142, 279
ta (trace activity display) command, 137, 280
tag counter (analyzer), 287
target synchronization, 65
487
Index
target system, 465
access for emulator probe, 394
connecting emulator probe, 48
connecting to a 144-pin TQFP package, 54
connecting to a QFP package, 49
contents (minimum), 382
design considerations, 382
plugging the emulator into, 40
probe power requirements, 382
processor signal considerations, 382
RAM and ROM, 95
target system dependency on executing code, 60
tarm (trace arm condition) command, 202, 281-282
tcf (set easy/complex configuration) command, 173, 283-284
tck (specify master clock) command, 285-286
tcq (specify count qualifier) command, 287-288
tcq (trace count qualifier) command, 160
telif (secondary branch expression) command, 164, 167, 289-291
in the complex configuration, 178
telnet, LAN connection, 449
temperatures, operating and non-operating environments, 396
Terminal Interface, 432
terms
analyzer sequencer, 322
memory mapper, 256
tf (specify trace list format) command, 292-293
tf (trace format) command, 150
tg (simple trigger) command, 29, 156, 294-295
in the complex configuration, 181
tgout (trigger output) command, 125, 204, 296-297
th (trace halt) command, 144, 298-299
listing traces, 305
tif (primary branch expression) command, 164, 166, 300-302
in the complex configuration, 178
time (analyzer keyword), 287
time, setting emulation system, 231
tinit (trace initialization) command, 137, 303-304
tl (trace list) command, 29, 145, 305-307
tlb (define labels for analyzer lines) command, 308-309
tokens, 152
488
Index
tools required
to connect QFP surface mount adapter, 49
tp (trigger position) command, 158, 310
tpat (trace patterns) command, 174, 311-312
tpq (trace prestore qualifier) command, 159, 313
in the complex configuration, 184
trace, 465
count qualifier, 160
displaying activity, 137
halting the, 144
listing format, 150
listing the, 145
patterns (in complex configuration), 174
prestore qualifier, 159
range (in complex configuration), 175
starting the, 142
storage qualifier, 158
trigger output, 204
trigger position, 158
trace configuration
complex or easy, 178
selecting complex, 173
selecting easy, 173
trace labels, 152, 308-309
predefined, 154, 308
predefined equates for, 154
trace list, 305-307
format, 292-293
header suppression, 305
trace status, 143, 316-319
TRACE_ENTRY in foreground monitor, 66
tram, mapper parameter for target RAM, 95, 254
transfer memory to host file, 232-233
transfer utility, 232, 248, 306
trig1 and trig2 internal signals, 125, 202, 212, 214, 227, 281, 298, 327
trigger, 465
analyzer, break on, 125
condition, 164, 294-295
cross-triggering, 225
difference between easy and complex configuration, 178
driving signals when found, 204
489
easy configuration, 164
not in memory, 305
position, 158, 310
position, accuracy of, 158
sequence term, 283
simple complex configuration specification, 181
specifying a simple, 156
trigger term, 178, 183
TRIGGER, CMB signal, 193
trng (trace range) command, 175, 314-315
trom, mapper parameter for target ROM, 95, 254
ts (trace status) command, 29, 143, 316-319
arm information, 143
occurrence left information, 143
sequence term information, 143
tsck (specify slave clocks) command, 320-321
tsq (trace sequencer specification) command, 322-324
in the complex configuration, 178
tsto (trace storage qualifier) command, 158, 325-326
in the complex configuration, 178
tx (trace on CMB /EXECUTE) command, 199, 327
490
U
undefined breakpoint error, 217
upload memory to host, 232-233
uploading memory, 5
user program, 464
V
values, 328-329
equating with names, 236-237
in trace expressions, 154
ver (display software version numbers) command, 330
verifying performance, 259
very fast (VF) analyzer clock speed, 286-287
W
w (wait) command, 331
wait (in command sequence), 331
warnings, power must be OFF during installation, 418
weight of the emulator, 395
whisper mode, 268, 316
windows of activity, using the analyzer to trace, 185
write-only registers, 126
X
x (start synchronous CMB execution) command, 200, 332
DECLARATION OF CONFORMITY
according to ISO/IEC Guide 22 and EN 45014
Manufacturer’s Name:
Hewlett-Packard Company
Manufacturer’s Address:
Colorado Springs Division
1900 Garden of the Gods Road
Colorado Springs, CO 80907 USA
declares, that the product
Product Name:
Microprocessor Emulator (HP 64700 Series)
Model Number(s):
HP 64751A/B
Product Option(s):
All
conforms to the following Product Specifications:
Safety:
IEC 348:1978 / HD 401 S1:1981
UL 1244
CSA-C22.2 No. 231 (Series M-89)
EMC:
CISPR 11:1990 / EN 55011:1991
IEC 801-2:1991 / EN 50082-1:1992
IEC 801-3:1984 / EN 50082-1:1992
IEC 801-4:1988 / EN 50082-1:1992
Group 1 Class A
4 kV CD, 8 kV AD
3 V/m, {1kHz 80% AM, 27-1000 MHz}
0.5 kV Sig. Lines, 1 kV Power Lines
Supplementary Information:
The product herewith complies with the requirements of the Low Voltage Directive 73/23/EEC and the
EMC Directive 89/336/EEC.
This product was tested in a typical configuration with Hewlett-Packard test systems.
Colorado Springs, 9/30/96
John Strathman, Quality Manager
European Contact: Your local Hewlett-Packard Sales and Service Office or Hewlett-Packard GmbH, Department ZQ / Standards
Europe, Herrenberger Strasse 130, D-71034 Böblingen Germany (FAX: +49-7031-14-3143)
Product Regulations
Safety
IEC 348 / HD 401
UL 1244
CSA-C22.2 No.231 (Series M-89)
EMC
This Product meets the requirement of the European Communities (EC)
EMC Directive 89/336/EEC.
Emissions EN55011/CISPR 11 (ISM, Group 1, Class A equipment)
Immunity
EN50082-1
IEC 801-2 (ESD) 4 kV CD, 8 kV AD
IEC 801-3 (Rad.) 3 V/m
IEC 801-4 (EFT) 0.5 kV, 1 kV
Sound Pressure
Level
Code1
3
1
1
Notes2
A, B, C
A
B
1
Performance Codes:
1 PASS - Normal operation, no effect.
2 PASS - Temporary degradation, self recoverable.
3 PASS - Temporary degradation, operator intervention required.
4 FAIL - Not recoverable, component damage.
2
Notes:
A Electrostatic discharge (ESD) to the 64700B mainframe may cause
degradation in performance requiring operator intervention.
B The active probe assembly is sensitive to ESD events. Use standard
ESD preventative practices to avoid component damage.
C The CMB and active probe power connectors were not subjected to
immunity testing.
Less than 60 dBA
Certification and Warranty
Certification
Hewlett-Packard Company certifies that this product met its published
specifications at the time of shipment from the factory. Hewlett-Packard further
certifies that its calibration measurements are traceable to the United States
National Bureau of Standards, to the extent allowed by the Bureau’s calibration
facility, and to the calibration facilities of other International Standards
Organization members.
Warranty
This Hewlett-Packard system product is warranted against defects in materials and
workmanship for a period of 90 days from date of installation. During the warranty
period, HP will, at its option, either repair or replace products which prove to be
defective.
Warranty service of this product will be performed at Buyer’s facility at no charge
within HP service travel areas. Outside HP service travel areas, warranty service
will be performed at Buyer’s facility only upon HP’s prior agreement and Buyer
shall pay HP’s round trip travel expenses. In all other cases, products must be
returned to a service facility designated by HP.
For products returned to HP for warranty service, Buyer shall prepay shipping
charges to HP and HP shall pay shipping charges to return the product to Buyer.
However, Buyer shall pay all shipping charges, duties, and taxes for products
returned to HP from another country. HP warrants that its software and firmware
designated by HP for use with an instrument will execute its programming
instructions when properly installed on that instrument. HP does not warrant that
the operation of the instrument, or software, or firmware will be uninterrupted or
error free.
Limitation of Warranty
The foregoing warranty shall not apply to defects resulting from improper or
inadequate maintenance by Buyer, Buyer-supplied software or interfacing,
unauthorized modification or misuse, operation outside of the environment
specifications for the product, or improper site preparation or maintenance.
No other warranty is expressed or implied. HP specifically disclaims the
implied warranties of merchantability and fitness for a particular purpose.
Exclusive Remedies
The remedies provided herein are buyer’s sole and exclusive remedies. HP
shall not be liable for any direct, indirect, special, incidental, or consequential
damages, whether based on contract, tort, or any other legal theory.
Product maintenance agreements and other customer assistance agreements are
available for Hewlett-Packard products.
For any assistance, contact your nearest Hewlett-Packard Sales and Service Office.
Safety
Summary of Safe Procedures
The following general safety precautions must be observed during all phases of
operation, service, and repair of this instrument. Failure to comply with these
precautions or with specific warnings elsewhere in this manual violates safety
standards of design, manufacture, and intended use of the instrument.
Hewlett-Packard Company assumes no liability for the customer’s failure to
comply with these requirements.
Ground The Instrument
To minimize shock hazard, the instrument chassis and cabinet must be connected to
an electrical ground. The instrument is equipped with a three-conductor ac power
cable. The power cable must either be plugged into an approved three-contact
electrical outlet or used with a three-contact to two-contact adapter with the
grounding wire (green) firmly connected to an electrical ground (safety ground) at
the power outlet. The power jack and mating plug of the power cable meet
International Electrotechnical Commission (IEC) safety standards.
Do Not Operate In An Explosive Atmosphere
Do not operate the instrument in the presence of flammable gases or fumes.
Operation of any electrical instrument in such an environment constitutes a definite
safety hazard.
Keep Away From Live Circuits
Operating personnel must not remove instrument covers. Component replacement
and internal adjustments must be made by qualified maintenance personnel. Do not
replace components with the power cable connected. Under certain conditions,
dangerous voltages may exist even with the power cable removed. To avoid
injuries, always disconnect power and discharge circuits before touching them.
Do Not Service Or Adjust Alone
Do not attempt internal service or adjustment unless another person, capable of
rendering first aid and resuscitation, is present.
Do Not Substitute Parts Or Modify Instrument
Because of the danger of introducing additional hazards, do not install substitute
parts or perform any unauthorized modification of the instrument. Return the
instrument to a Hewlett-Packard Sales and Service Office for service and repair to
ensure that safety features are maintained.
Dangerous Procedure Warnings
Warnings, such as the example below, precede potentially dangerous procedures
throughout this manual. Instructions contained in the warnings must be followed.
WARNING
Dangerous voltages, capable of causing death, are present in this instrument. Use
extreme caution when handling, testing, and adjusting.
Safety Symbols Used In Manuals
The following is a list of general definitions of safety symbols used on equipment
or in manuals:
Instruction manual symbol: the product is marked with this symbol when it is
necessary for the user to refer to the instruction manual in order to protect against
damage to the instrument.
Indicates dangerous voltage (terminals fed from the interior by voltage exceeding
1000 volts must be marked with this symbol).
Protective conductor terminal. For protection against electrical shock in case of a
fault. Used with field wiring terminals to indicate the terminal which must be
connected to ground before operating the equipment.
Low-noise or noiseless, clean ground (earth) terminal. Used for a signal common,
as well as providing protection against electrical shock in case of a fault. A terminal
marked with this symbol must be connected to ground in the manner described in
the installation (operating) manual before operating the equipment.
Frame or chassis terminal. A connection to the frame (chassis) of the equipment
which normally includes all exposed metal structures.
Alternating current (power line).
Direct current (power line).
Alternating or direct current (power line).
Caution
The Caution sign denotes a hazard. It calls your attention to an operating procedure,
practice, condition, or similar situation, which, if not correctly performed or
adhered to, could result in damage to or destruction of part or all of the product.
Warning
The Warning sign denotes a hazard. It calls your attention to a procedure, practice,
condition or the like, which, if not correctly performed, could result in injury or
death to personnel.