1
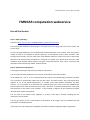
Documentation, version April 16, 2015 FMNEAR computation webservice Use of the Service Step 1 “data uploading”: Connect to http://source.unice.fr:8080/FMNEAR_website/fmnear.html You access to the webservice home page. In the upper part of the page you have a link to access the service itself. On the new page displayed, you can download the documentation (user manual, Data and velocity model) as well as an example of dataset (presently an earthquake in the French Pyrenees, with strong motion records). You can enter your email address (optional, used to send you an email with the link to the results when computation is finished). To upload your data archive from your local computer, tape the path and file name or using the “search directories”, then “send”. Please see the document “Data and velocity model” for data format. Step 2 “parameters and options”: A new page is displayed, with all the parameters and options. You may check that the parameters are correctly retrieved from the SAC hearders. In the station list, “vel” or “acc” is indicated after the station name, depending on whether the data are in velocity or acceleration (taken from the file names, see Data section). The P wave pick times appears as “0” if not picked beforehand (“a” variable of the SAC headers undefined, see Data section). “0” is used here as an indication for undefined pick time. If this is the case, FMNEAR will search to pick the P wave automatically (next step). “Distance” is the horizontal distance in km from the epicentre to the station, and “azimuth” is the azimuth in degrees of the epicentre‐to‐station direction with respect to the North. You can click on the station name (appears as a link), it will open a window showing the raw waveforms of that station. You may go directly to the “send” button at the bottom of the page if you are satisfied with the parameters and default options. If you want you may modify the earthquake parameters (latitude, longitude, depth, magnitude). You may define a fixed frequency band for the filtering of the waveforms (default choice “Auto” means that filtering will be automatically defined for each component individually), either by choosing a range in the running menu or by ticking the checkbox “Define custom band” and providing the minimum and maximum frequencies in the input boxes (left and right respectively). If you fix the frequency band, this single range will be applied to all components of all the stations. You may use the checkbox “select all stations” to select (tick) or unselect (untick) all stations. You may use the checkboxes at the end of each station lines to select (tick) or unselect (untick) stations individually. Four options are proposed at the bottom of the page (tick checkboxes to fix): ‐ You may fix the focal depth (otherwise the FMNEAR codes will try to optimize depth) ‐ You may fix the focal mechanism. Enter strike dip rake values in the input boxes. ‐ You may force the codes to keep all components (see remark 1 below), even those associated with a poor waveform fit. ‐ You may define a pre‐event time. Automatic picking will then start after pre‐event time. Be sure that pre‐event time is smaller than the P wave arrival at the nearest station. This option is to avoid picking on noise events or pre‐shocks that may be present in the pre‐event time window. This will be used only for those stations whose pick time is “0” (undefined pick time). A map showing the all stations included in the archive (white triangles) and the epicentre (orange star) is displayed below the options. When all values and options are OK for you, click on the “send” button at the bottom of the page. Remark 1: if you choose the “Use all components” option, and if the filtering option is “Auto” (automatic filtering), some components may be nonetheless discarded if the search for optimal filtering does not end up with an acceptable frequency band. The only way to insure that all components will be kept in the process is to tick the “Use all components” checkbox and impose a fixed band of filtering (see above). Of course, in that case, very poor waveform modelling may occur for components affected by a high level of noise in the frequency band imposed. Remark 2: if you want to force automatic picking of the P wave, P wave pick time should be “0”. Step 3 “Checking the results”: On the new page, copy the process number, and click on “back to home page” On the home page, paste the process number in the “check your process” box, and then click on “check” If computation is not finished, you obtain the message “Not Yet”. Use the back‐page of your navigator, and check again latter. If computation is finished, you obtain a page displaying the results. You will find the following: ‐ The strike, dip, rake of the best focal mechanism solution found (or fixed if you used this option) ‐ The RMS, which is the normalized Root Mean Square misfit function of the waveforms. The lower the RMS (nearer to zero) the best is the waveform fit. Variance reduction in percentage would be (1 – RMS)*100. ‐ The selected depth, which is the depth optimized by waveform modelling (except if you used the option of fixing depth). ‐ The number of components retained at the end. It is considered that the frequency band should be larger than 0.015Hz to be meaningful (otherwise the frequency range is too narrow). ‐ The index of confidence (in %), which is a measure of the quality and uniqueness of the solution (solution considered reliable when index > 70% generally). The index will not be computed if the option of fixing the focal mechanism is used. ‐ The moment magnitude Mw issued from the waveform modelling (associated with the best solution) A map is shown with the focal mechanism, the stations retained in the modelling in green and the stations not used in white. Modelling of the waveforms appears as a series of graphs, station by station. The three components of a given station are shown on the same line, in the order N, E, Z from left to right. Names of components appear as “XSTATv” for stations equipped with velocimeters and “XSTATa” for stations equipped with accelerometers, where X is either N, E, or Z. However, waveforms are displayed in displacement, with amplitude in centimetres (vertical axis). Time is in seconds (horizontal axis). STAT is the name of the station. Near the bottom of the page, the list of selected stations (before computation) is printed, with corresponding parameters. P time is either the input pick time (originally included in the SAC header), or the time automatically picked, or “0” if the automatic picker failed. This list may display more stations than finally retained by the programs. The distribution of seismic moment is provided for earthquakes with initial magnitude larger or equal to 5.5. !!! If you want to save the results, click on the link “Download result archive”!!! Remark 3: it may happen that the program does not provide any result. The most common cause is that stations were discarded but the program. This may happen because no adequate filtering could be found or because the waveforms could not be modelled properly. If this happens case, check the filtering parameters; think about signal/noise ratio as a function of magnitude and distance (far away stations will be commonly discarded for small magnitudes). Step 4 “looping”: By clicking on “Looping: going back to parameters and options” you can loop with the same dataset and run a new computation with different parameters and/or a different selection of stations and/or different options. If stations were not initially picked (from the SAC header variable “a”, see Data section), the pick time determined automatically is printed in the last column of the station list. If automatic picking failed, pick time remains “0”. If you publish/show results obtained with this webservice, please include reference "FMNEAR webservice, Delouis, Gerakis, Deschamps, Geoazur/Observatoire de la Côte d'Azur". Concerning the method FMNEAR, please include reference to the article " "Delouis, B., 2014. FMNEAR: determination of focal mechanism and first estimate of rupture directivity using near source records and a linear distribution of point sources, Bulletin of the Seismological Society of America, 104 (3), 1479‐1500, doi:10.1785/0120130151." Bertrand Delouis [email protected]