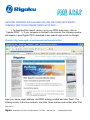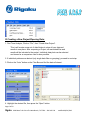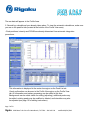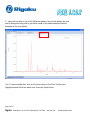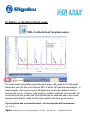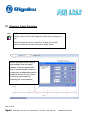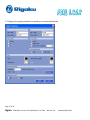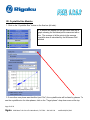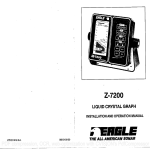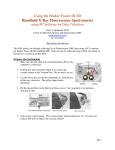
1
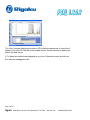
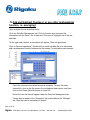
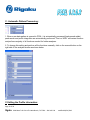
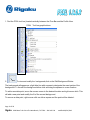
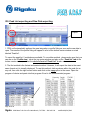
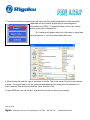
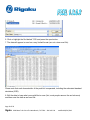
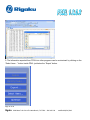
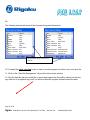
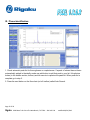
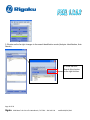
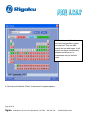
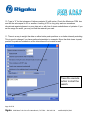
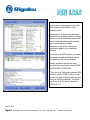
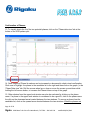
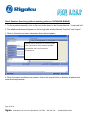
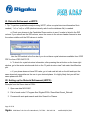
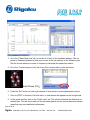
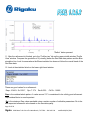
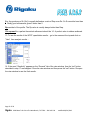
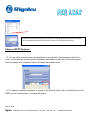
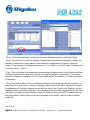
Rigaku PDXL Software
Version 1.8.0.3
Copyright 2007 - 2010 Rigaku Corporation,
All rights reserved.
Page 1 of 59
Rigaku
9009 New Trails Drive The Woodlands, TX 77381 281-362-230
modified 06/14/2012
Table of Contents:
Opening PDXL-login, Architecture or Screen Layout
4
Create a New Project File (PDS)
5
Open a Single Raw Data Pattern
6
Open/Delete Multiple Raw Data Patterns, add & subtract overlays
7, 9
Editing Tool Bar descriptions
10
Editing the background
11
Editing the Peak Search List / changing Peak shape or adding peaks
12
K beta peaks
13
Changing graph properties for printing
14, 15
Exporting Peak Search List as CSV tables into Excel
16-20
Exporting Raw Data as Ascii
21-22
SPECIAL ANALYSIS MODULES:
Search Database for Phase identification, direct search, opening CIF
23 - 33
Setting up Plots for Printing a Report
34 - 36
Percent Crystallinity Calculations
37 - 44
Rietveld / Quantitative Analysis & Preferred Orientation Correction
45 - 54
Crystallite Size Module
55
Page 2 of 59
Rigaku
9009 New Trails Drive The Woodlands, TX 77381 281-362-230
modified 06/14/2012
FREE PDXL UPGRADES ARE AVAILABLE ON-LINE FOR THOSE WITH RECENT
VERSIONS. KEEP YOUR LICENSED COPIES UP TO DATE …
1. To download the newest version, go to your PDXL help menu, click on
“ Update PDXL”. 2. If your computer is hooked to the internet, the following window
will appear or type Rigaku PDXL download in any search engine such as Google.
Website: http://www.rigaku.com/downloads/software/pdxl.html
Input your name, email address, and PDXL catalog number and click "Next". The
catalog number is the four numbers, one letter, three number code written after "Cat.
Page 3 of 59
Rigaku
9009 New Trails Drive The Woodlands, TX 77381 281-362-230
modified 06/14/2012
No." on the top page of the PDXL User's Manual. Also, a copy of the PDXL should be
located on your computer desktop and a third source of the catalogue number can be
found on your PDXL CD Label.
Page 4 of 59
Rigaku
9009 New Trails Drive The Woodlands, TX 77381 281-362-230
modified 06/14/2012
I. Opening the Program
To open PDXL:
Use “Administrator as the User login:
No Password is needed; just press the “OK” button:
II. Window Layout:
1. When the Program opens, you will see the following series of windows:
Profile View—
Visual Display for Data
Analysis Bar
Results are
displayed here:
PDXL Tool bar-graph buttons:
Phase Id,
Crystallite size,
Percent
Crystallinity.
Flow Bar—
Peak List , Multiple Pattern
Analysis
information, PDF cards,
ModulesSingle Data Files or Multiple Files:
3. Opening
Page 5 of 59
Rigaku
9009 New Trails Drive The Woodlands, TX 77381 281-362-230
modified 06/14/2012
III Creating a New Project/Opening Data:
1. First Time Analysis, Click on “File”, then “Create New Project”.
This is will create a new set of data folders to store all your data and
results in one place. After reopening a Project, all associated files and
results will be included in the project. Individual data plots can be selected
and viewed or a comparison view is also possible.
2. If individual patterns are desired (only single data files-no grouping), proceed to next step.
3. Click on the “Auto” button on the Flow Bar and find the data of interest.
4 .Highlight the desired file, then press the “Open” button.
Page 6 of 59
Rigaku
9009 New Trails Drive The Woodlands, TX 77381 281-362-230
modified 06/14/2012
The raw data will appear in the Profile Area.
5. Several key calculations have already taken place. To view the automatic calculations, make sure
you are on the peak list tab (located at the bottom of the Profile View area).
--Peak positions, intensity and FWHM are already determined from automatic integration
procedures.
This information is displayed in the center low region on the Peak List tab.
Visual confirmation can be seen in the Profile View region on the Profile View
tab. All information and pattern processing can be edited at this time:
Backgrounds can be made visible for editing (adjusting), additional peaks may
be added, existing peaks may be modified or deleted, and intensities may also
be adjusted (see page 10 for editing instructions).
Page 7 of 59
Rigaku
9009 New Trails Drive The Woodlands, TX 77381 281-362-230
modified 06/14/2012
6. Using the five tabs on top of the diffraction pattern (see red tab below) the view
can be changed at any point to get better visual of the pattern/analysis bar/flow
bar/peak list etc (see below).
7(a). To open multiple files, click on the Auto button on the Flow Tool bar and
highlight several files at the same time. Press the Open button.
Page 8 of 59
Rigaku
9009 New Trails Drive The Woodlands, TX 77381 281-362-230
modified 06/14/2012
7(b). Also, consider displaying the data in 3D for better comparisons of more than 2
patterns. Go to the 3D view tab in the middle section. Rotate patterns to display the
data in the best format.
8. To delete an overlaid raw data pattern, go to the “Information area” and click on
the “data set management tab”:
Page 9 of 59
Rigaku
9009 New Trails Drive The Woodlands, TX 77381 281-362-230
modified 06/14/2012
8. Expand the file to see the data file that needs to be deleted. Right mouse click
on the data and click on delete. Press the Yes button when asked to delete.
9. Right mouse click on the data and click
delete.
10. Click on the “yes” option when asked to
confirm.
Page 10 of 59
Rigaku
9009 New Trails Drive The Woodlands, TX 77381 281-362-230
modified 06/14/2012
IV Add and Subtract Overlays ( or any other mathematical
function, i.e. averaging):
Open multiple files as illustrated above.
Go to the Data Set Management tab. Click on the plus sign to expand the
information until the Data 1 file is observed. Click once to highlight one of the raw
data files.
On the right side a button, a new button will appear, “Data set operations”.
Click on Data set operations”. Double click on each raw data file to be calculated,
add a mathematical function between the file names. For subtraction see example:
Press the execute button when formula is complete. To save the newly
created file, click on the file name in the multiplexed data column, and then
click on the Create Data Set button on lower left.
Notice the new file that will appear under the Data Set Management tab.
Please also be aware of the “Normalize” tab located behind the “Multiplex”
tab. Data files can be normalized if desired.
Page 11 of 59
Rigaku
9009 New Trails Drive The Woodlands, TX 77381 281-362-230
modified 06/14/2012
V . Automatic Pattern Processing:
1. When a raw data pattern is opened in PDXL, it is automatically processed (background added,
peak search and profile integration are automatically performed. This is a VERY convenient function
and performs majority of all functions needed for further analyses.
2. To change this setting and perform all the functions manually, click on the manual button on the
right side of the analysis window as shown below.
V. Editing the Profile information:
Page 12 of 59
Rigaku
9009 New Trails Drive The Woodlands, TX 77381 281-362-230
modified 06/14/2012
1. Find the PDXL tool bar (located vertically between the Flow Bar and the Profile View.
PDXL Tool bar-graph buttons:
2.
To view and modify the background,click on the Edit Background Button
The background will appear as a light blue line with squares to designate the exact points of the
background. To the edit the background either click and drag the squares to a new location.
To add a new data point, move the mouse cursor to the desired location and right mouse click. This
will add a new point and modify the fit of the current background.
To remove a data point, right mouse click on a blue square and the point will be deleted..
Page 13 of 59
Rigaku
9009 New Trails Drive The Woodlands, TX 77381 281-362-230
modified 06/14/2012
3.
To add peaks click on the Add Peak Button, move the cursor to the desired location and
right mouse click to add peaks (makesure your Y scale is in cps mode).
To edit peak position, shape and intensities (if needed), UNCHECK the Add Peak button, and click
on the peak position in peak list. Then, 3 red squares will appear on the peak (in Profile view).
These squares will edit the shape and intensity of the peak. To edit the position, click and hold the
peak bar and drag to new location.
Edit the peaks until the blue difference line matches the red raw data pattern.
Page 14 of 59
Rigaku
9009 New Trails Drive The Woodlands, TX 77381 281-362-230
modified 06/14/2012
VI. Editing or Identifying Kbeta peaks:
PDXL Cu Kbeta Peak Template cursor
The small peaks immediately preceding each major LaB6 peak are Cu Kβ peaks.
Remember your Kβ filter only removes 99% of all the Kβ radiation wavelengths. In
most samples with average counts Kβ peaks are not usually visible above the
background counts. However, with a highly crystalline material, such as LaB6, the
counts will be much greater and the Kβ peaks will be observed above the normal
background fluctations. Note the Kβ cursor position left (lime green marker).
If your system has a monochromator, no k beta peaks will be observed
Page 15 of 59
Rigaku
9009 New Trails Drive The Woodlands, TX 77381 281-362-230
modified 06/14/2012
VII. Changing Graph Properties:
1. To change colors of overlays or to offset patterns for better
visibility, click on the “Profile Properties” button on the vertical tool
bar.
Select the pattern that you would like to change in the profile
window. Select the line color, then press “apply” button.
Notice any offset in the y axis is
also possible from this same
window. If there is a peak shift
due to curved sample surface or
roughness, an adjustment can be
made as well l(in X axis). There
must be a valid reason for
adjusting the X-axis position.
.
Page 16 of 59
Rigaku
9009 New Trails Drive The Woodlands, TX 77381 281-362-230
modified 06/14/2012
2. Changing the graph properties for printing or visual presentations
Page 17 of 59
Rigaku
9009 New Trails Drive The Woodlands, TX 77381 281-362-230
modified 06/14/2012
VIII. Peak List exporting and Raw Data exporting:
Export
1. PDXL will automatically perform the area integration or profile fitting as soon as the raw data is
open. The results of the profile fitting will appear in a list at the bottom center window on a tab
labeled “Peak list”.
To export the peak list, 2 methods are available. To use either method, please make sure that you
can are on the “Profile view “ tab at the top center window and also on the “Peak list” tab at the
bottom center window, and that the circle in front of “Peak List” is also selected.
2. The first method is the fastest and easiest method. However, it will export the data in the exact
same format as it is visually displayed. To use this method, click anywhere within the peak list on
any cell, then click the right mouse button and click on the copy option in the menu. Open the
program of choice and paste into that program. Excel is the recommended program.
Page 18 of 59
Rigaku
9009 New Trails Drive The Woodlands, TX 77381 281-362-230
modified 06/14/2012
3. The second method to export peaks will export all of the peak information but with everything
separated into a list format (profile fitting or area integration
information from PDXL). To export this data, click on the “Export”
button to the right of the peak list…
3b. A window will appear asking for a file name to export and
save the data as a *.csv file (column separated view)
4. When saving the peak list, type in the name of the file. This is the name of the file to be retrieved
in excel. It is a good idea to use the same raw data name but just change the file extension (i.e.
2spin-1hrmono. Raw should be saved as 2spin-1hrmono. Csv).
5. Open MS Excel, use the “all files” view and look for the csv file you just created:
Page 19 of 59
Rigaku
9009 New Trails Drive The Woodlands, TX 77381 281-362-230
modified 06/14/2012
6. Click or highlight the file labeled *CSV and press the open button.
7. The data will appear in excel on a very limited format (csv not a true excel file).
Please note that each characteristic of the peak list is separated, including the estimated standard
deviations (ESD).
8. Edit the data to keep what you would like to save (hint, most people remove the esd columns)
and then save the data as an excel file.
Page 20 of 59
Rigaku
9009 New Trails Drive The Woodlands, TX 77381 281-362-230
modified 06/14/2012
9. The information exported from PDXL into other programs can be customized .by clicking on the
“Select Items…” button Inside PDXL just below the “Export “button.
Page 21 of 59
Rigaku
9009 New Trails Drive The Woodlands, TX 77381 281-362-230
modified 06/14/2012
9b.
The following window will reveal all the choices of exported information:
Move toolbar down to see more
choices
10 To export the entire raw data to plot or view in another program as either a csv or an ascii file:
11. Click on the “Data Set Management” tab on the bottom center window.
12. Find the data file that you would like to export and expand the file path by clicking on the plus
sign (will turn to a negative sign) until you see the data with a purple square beside the name:
Page 22 of 59
Rigaku
9009 New Trails Drive The Woodlands, TX 77381 281-362-230
modified 06/14/2012
13. Click on the file name Data 1
14. To the bottom center right of the Data 1 area, find the button that is labeled “Export” and click.
15. A window will appear asking for a file name to save the data. The standard default is csv, but the
ascii or text format can also be selected. Save the data.
Page 23 of 59
Rigaku
9009 New Trails Drive The Woodlands, TX 77381 281-362-230
modified 06/14/2012
16. Open it in excel using the format above..
The entire raw data will be available in MS Excel as either a csv or ascii format:
Page 24 of 59
Rigaku
9009 New Trails Drive The Woodlands, TX 77381 281-362-230
modified 06/14/2012
IX. Phase identification:
1. Check automatic peak list for thoroughness or completeness. If a peak of interest has not been
automatically picked in the deafly mode use add button to add that peak in your list. Hit optimize
button (in the middle section, bottom) and hit execute to optimize the peak list. When peak list is
complete go to step 2.
2. Press the next button on the flow chart (on left toolbar) called Auto Search.
Page 25 of 59
Rigaku
9009 New Trails Drive The Woodlands, TX 77381 281-362-230
modified 06/14/2012
3. Window on the far right changes to the search identification mode (Analysis- Identification, Auto
Search).
4. Press the Auto
Search (blue) button
on the right tool bar.
Page 26 of 59
Rigaku
9009 New Trails Drive The Woodlands, TX 77381 281-362-230
modified 06/14/2012
5. Select a subfile or series of subfiles to search. If you do not know which files to search, start with
a wide approach and check the “All sub-files” option.
6. Press the “Elements filter “tab at the bottom of this menu.
down the choices.
Set your chemistry filter to narrow
7. Grey is no filter, red is excluded or NOT in Boolean logic, light blue is REQUIRED or must be
present) AND in boolean logic, green is possible (OR in Boolean logic)
8. Chemistry filters for “common” geological material. Set the filter for a fairly wide search…
Page 27 of 59
Rigaku
9009 New Trails Drive The Woodlands, TX 77381 281-362-230
modified 06/14/2012
Notice that most of the elements
are listed as possible or green,
not required. This is a wide
search but not wide open. It will
screen out some unnecessary
phases and allow you to
concentrate on just the best
ones
9. Next tab at the bottom “Other” is advanced or special options.
Page 28 of 59
Rigaku
9009 New Trails Drive The Woodlands, TX 77381 281-362-230
modified 06/14/2012
10. Type in “0” for the tolerance of lattice constants (5) shift option. Check the Maximum FOM box
and set the value equal to 5.0 or smaller. A setting of 3.0 is very picky and can sometimes
discriminate against phases in a poor data set or with lots of atomic substitutions or hydrates. If you
set the range too small, you may not find the material you seek.
11. There is a way to weight the data on either better peak positions or on better intensity matching.
This is good to change if you have preferred orientation in a sample. Move the slide closer to peak
position for preferred orientation as the intensities will not match as well.
Press the execute
button to start the
search.
Page 29 of 59
Rigaku
9009 New Trails Drive The Woodlands, TX 77381 281-362-230
modified 06/14/2012
12. A list of possible options based on
your search criteria appear in the right
side “Analysis-Identification (Auto
Search) menu.
Information is listed in three windows;
top window is possible matches, middle
window is Good Candidate phases that
have a high statistical match potential,
and lower window is a detail
information view of the selected or
highlighted phase in the candidate
window.
A search on this XRD pattern, revealed
two good potential candidates (boxes
are green in front of both phases):
Quartz and Albite are the two best
possible Primary phases found (FROM
OUR SEARCH CRITERIA).
They are both Star quality phases (QM
column) and the FOM or figure of merit
number for both of these phases is very
low (low FOM are desired). The ROM
for Quartz is 0.387 and for albite the
FOM is 0.784.
Page 30 of 59
Rigaku
9009 New Trails Drive The Woodlands, TX 77381 281-362-230
modified 06/14/2012
Confirmation of Phases:
13. To visually check the fit of the two potential phases, click on the “Phase data view “tab at the
bottom of the XRD pattern plot:
14. Peak Heights of Phase Id markers can be increased or decreased to check visual confirmation.
Click once to highlight the phase in the candidate list to the right and then click on the graph ( in the
“Phase Data view” tab. Roll the mouse wheel up or down or move the mouse up and down while
holding the left mouse button, to increase the Phase id bars on top of the graph.
15. Other choices from the upper level window can also be evaluated by clicking on the phase
name. If a phase in the upper level window is considered to be a good fit, click on the phase name
the click on the downward arrow located between the two windows. To remove a phase from the
candidate list, click on the upward arrow located between the two windows. When the phases are
Page 31 of 59
Rigaku
9009 New Trails Drive The Woodlands, TX 77381 281-362-230
modified 06/14/2012
considered to be accurate, press the “Set” button on the lower right side window to lock in the
results of the phase identification.
If phases need to be removed after the set button has been pressed, click on the “phase
information” tab located on the lower center window, highlight the incorrect phase, and click on the
large black ”x” for removal.
Page 32 of 59
Rigaku
9009 New Trails Drive The Woodlands, TX 77381 281-362-230
modified 06/14/2012
Direct Database Searching (without matching pattern or DATABASE MINING).
1. To find a pattern manually, click on the next button down in the flow bar labeled --“Load card info”.
2. Two additional buttons will appear on the far right side window labeled “Card Info” and “Import”.
3. Click on Card info and enter information about desired phase…
Possible search conditions are common phase
name, chemical formula, elements possible,
card number and crystal symmetry
classifications.
4. When the search conditions are entered, click on the search button to observe all phases that
meet listed requirements.
Page 33 of 59
Rigaku
9009 New Trails Drive The Woodlands, TX 77381 281-362-230
modified 06/14/2012
5. Results will appear in the same window to the right of the search parameters.
6. Possible phases can be visually evaluated by clicking on the boxes in front of each phase.
7. To add all selected phases( check boxes in front of each line) to the Search Match window , click
on the “Add “ button in the “Add Card Info” window. Close this window. Elevate the FOM and visual
goodness of fit for newly added phases. If chosen, click on the phase in the upper window and then
move into the Candidate window by pressing the downward arrow.
9. Don’t forget to press “Set” that registers the results when finished with the Search Match.
Page 34 of 59
Rigaku
9009 New Trails Drive The Woodlands, TX 77381 281-362-230
modified 06/14/2012
To add CIF directly, Click on the LOAD CARD INFO button on flow diagram (on left
hand side).
1. Click on the “import” button on the far right hand side and locate cif file. Click to open.
2.
Page 35 of 59
Rigaku
9009 New Trails Drive The Woodlands, TX 77381 281-362-230
modified 06/14/2012
3. Once phase is loaded, click on the downward arrow to move it into the Candidate Window.
Press set button on lower right hand side then click on the Crystal View tab to see 3D view.
4.
PRINTING PHASE IDENTIFICATION REPORTS
1. When phase identification is complete, this information can be put into a report format. Make sure
that the difference window appears under the plot. If it does not click on the last button in the PDXL
tool bar (vertical one)—button is called “Residual Graph”
Page 36 of 59
Rigaku
9009 New Trails Drive The Woodlands, TX 77381 281-362-230
modified 06/14/2012
2. Then Click on the third peak bar button on the same vertical tool bar. Button is labeled
“Peak Bar (3)”
3. Then delete the “unknown” phase from the “Phase List” tab located in the lower center
window. To delete, highlight the “unknown” phase with a single click and then click on the
X or delete button at the top of the same window…
20
30
40
50
60
70
4. To remove labels on
top of peaks, click on the
first “Peak Bar (1) button
that looks like this…
Siliconsyn
Carbon
moissanite-8H,
Corundum, syn
Corundum, syn
Rutile, syn
moissanite-8H,Silicon
syn Carbon
moissanite-8H, syn
0.0e+000
Corundum, syn
Quartz
1.0e+003
Rutile, syn
2.0e+003
Corundum, syn
Intensity (counts)
3.0e+003
Corundum, syn
4.0e+003
Meas. data:GRND-BBm1-GreyPowder/Data 1
moissanite-8H, syn,04-007-1601
Silicon Carbon,04-002-0291
Corundum, syn,01-089-7717
Quartz,01-070-7344
Rutile, syn,01-076-1940
Corundum, syn
5.0e+003
moissanite-8H, syn
Silicon Carbon
moissanite-8H,
syn
Corundum, synsyn
Silicon Carbon
moissanite-8H,
Silicon Carbon
Rutile, syn
moissanite-8H,
syn
Corundum, synsyn Silicon Carbon
moissanite-8H,
Graph should look like
this…
80
moissanite-8H, syn, 04-007-1601
Silicon Carbon, 04-002-0291
Corundum, syn, 01-089-7717
Quartz, 01-070-7344
100
50
0
20
Rutile, syn, 01-076-1940
30
40
50
60
70
80
2-theta(deg)
Page 37 of 59
Rigaku
9009 New Trails Drive The Woodlands, TX 77381 281-362-230
modified 06/14/2012
5. Plot should look like
this…Right mouse click on
the Red raw data pattern, till
you see the word “Copy”
appear. Click on the word
“Copy”. Open a document or
excel spreadsheet or power
point and press “Paste” in
the document to paste image
of plot.
…
6. An alternative method to
copying the plot is to go to the
menus at the
top of PDXL…”Edit” then “Copy
Image”…then open the
document and paste into your
normal report format.
Page 38 of 59
Rigaku
9009 New Trails Drive The Woodlands, TX 77381 281-362-230
modified 06/14/2012
X.
Crystallinity
( ALWAYS ALLOW FOR EXTRA DATA COLLECTION RANGE TO ENSURE PROPER
BACKGROUND FITTING):
1. Open data. Click on edit background button. Adjust background to form a linear (straight)
background. Be sure to allow for amorphous regions (do not model out the amorphous areas by
allowing the background to rise up under the crystalline peaks).
2. Usually a right mouse click on blue squares (when in background edit mode) will remove
curvature and allow for a more linear background model….
Page 39 of 59
Rigaku
9009 New Trails Drive The Woodlands, TX 77381 281-362-230
modified 06/14/2012
3. Automatic background fitting allows for curvature to remove amorphous regions for Search Match
of crystalline phases.
4. The appropriate background model for calculating percent crystallinity uses a linear model. Adjust
the current background model to simulate a linear background fit or manually add a linear
background. Insert additional peak(s) for amorphous region(s):
Page 40 of 59
Rigaku
9009 New Trails Drive The Woodlands, TX 77381 281-362-230
modified 06/14/2012
5. Edit all peak position, shape and intensities (if needed). To edit, click on the peak position in peak
list (while in Add peak mode) and 3 red squares will appear on the peak (in Profile view). These
squares will edit the shape and intensity of the peak. To edit the position, click and hold the peak bar
and drag to new location.
Page 41 of 59
Rigaku
9009 New Trails Drive The Woodlands, TX 77381 281-362-230
modified 06/14/2012
6. Edit all peaks until blue difference line matches the experimental data.
Page 42 of 59
Rigaku
9009 New Trails Drive The Woodlands, TX 77381 281-362-230
modified 06/14/2012
7. Edit all peaks until blue summation line (in Profile View) line matches the experimental data.
Page 43 of 59
Rigaku
9009 New Trails Drive The Woodlands, TX 77381 281-362-230
modified 06/14/2012
8. Additional confirmation of good fitting can be found on the purple difference located on strip under
Profile view. Line should be linear or flat if a perfect fit is achieved.
9. Find all amorphous peaks and click on the box preceding the peak on the peak list tab.
Page 44 of 59
Rigaku
9009 New Trails Drive The Woodlands, TX 77381 281-362-230
modified 06/14/2012
10. Click on the “Identify Peak” button located on the right of the Information window:
11. Click on Amorphous material button to Tag or identify the peaks as “Amorphous”. Click on the
“Ok” button.
12. Usually, by average definition peaks with a fwhm of 5 degrees or greater are typically regarded
as amorphous. Definitions vary depending on the industry and the material properties.
Page 45 of 59
Rigaku
9009 New Trails Drive The Woodlands, TX 77381 281-362-230
modified 06/14/2012
13. After the peaks are designated or tagged as Amorphous, click on the flow bar button
“Crystallinity”
14. Immediately the results should be displayed on the far right side in the analysis window.
Page 46 of 59
Rigaku
9009 New Trails Drive The Woodlands, TX 77381 281-362-230
modified 06/14/2012
XI. Rietveld Refinement or WPPF:
1. Tip: To perform quantitative analysis using WPPF, either a crystal structure information file is
needed ( *.cif, or *csf) or a RIR (relative intensity ratio from the database file) is needed.
a. Check your phases in the Candidate Phase section to see if a value is listed in the RIR
column. If you cannot see the RIR column, move the cursor to the column header line and re-size
the column widths until the RIR column is visible.
Use the RIR method in the flow bar if you do not have crystal structures available from ICDD
PDF4 or from ICSD /NIST/ FIZ.
b. To check for crystal structure information, after pressing the set button on the lower right
window, go to the center window and click on the “Crystal structure view” tab under the diffraction
plot.
c. If your phase does not have RIR value, go to load card info tab on the left and input the
same chemical composition as the one in your desired phase. It is highly likely that you will find
same phase with RIR.
XII .Setting up the Rietveld Refinement (WPPF):
Example from the Demo data in PDXL:
1. Open raw data MIX2.ASC.
2. File is found under C:/Program files/ Rigaku/PDXL/ DemoData/ Quant_Rietveld
3. Process with auto peak search and Auto Search for Phases
Page 47 of 59
Rigaku
9009 New Trails Drive The Woodlands, TX 77381 281-362-230
modified 06/14/2012
4. Go to the “Phase Data view” tab, to see the fit of each of the candidate phases. Click on
phase in Candidate phases list and move cursor to the line markers on the diffraction plot.
Roll the mouse wheel up or down to increase or decrease the phase line marker.
5. Go to the “Crystal structure view” tab to see if the phases have crystal structures
Rutile Phase (TiO2)
6. Press the “Set” button on lower right window of auto search to ensure phases are locked.
7. Click on WPPF in flow bar of left side menu. A new window will appear on the far right side.
8. In the center window, click on the “Profile view” tab. This window will show the difference or
residual plot. This will show results of the simulated pattern versus the raw data and indicate
areas that may need additional refinements.
Page 48 of 59
Rigaku
9009 New Trails Drive The Woodlands, TX 77381 281-362-230
modified 06/14/2012
9. Go to the Phase Information tab at the bottom of the center window. Click on the “Unknown”
phase and press the delete button (looks like a large “X”).
10. On the lower right side, press the “Simulate” button, then press the “Refine” button and watch
the difference plot in the center middle window. The purple difference plot of an ideal refinement
would be perfectly flat. When the analysis is completed, press the “set” button on the lower right
window. This saves all the results of the refinement.
“Simulate” button pressed.
Page 49 of 59
Rigaku
9009 New Trails Drive The Woodlands, TX 77381 281-362-230
modified 06/14/2012
”Refine” button pressed.
11. After the refinement is finished, go to the “Profile view” tab on the upper middle window-“Profile
View” window. Compare the goodness of fit (visually) better the Red Raw data pattern and the Blue
simulation line. Look for areas where the Blue simulation line does not follow the overall trend of the
Red Raw data.
12. Look at the statistics listed on the lower right hand window.
These are good values for a refinement:
Rwp= 10.46% S=1.2917, Rp=:7.17%
Re=8.09%
Chi^2= 1.6685.
Rwp is the residual whole pattern. A value around “10” is considered to be a fairly good refinement.
Rwp residual factor is most important.
Re is the minimum Rwp value reachable using a certain number of refinable parameters. Re is the
best expected refinement value based on the raw data quality.
Page 50 of 59
Rigaku
9009 New Trails Drive The Woodlands, TX 77381 281-362-230
modified 06/14/2012
S or the goodness of fit (Gof) is usually defined as a ratio of Rwp over Re. So S cannot be less than
1. Really good refinements gives S lower than 2.
Rp=residual of the profile. The Rp value is usually always better than Rwp.
Chi squared for a perfect theoretical refinement should be 1.0. A perfect value is seldom achieved.
13. To see the results of the WPPF quantitative results… go to the menus at the top and click on
“View” then analysis results…
14. If the word “Simplicity” appears on the “General” tab of the view window, then the “set” button
described in step 11 was skipped. Close the view window and then press the “set” button. Re-open
the view window to see the final results.
Page 51 of 59
Rigaku
9009 New Trails Drive The Woodlands, TX 77381 281-362-230
modified 06/14/2012
15. If the word “WPPF” appears on the “General” tab of the view window, click on the “Quantity” tab.
Click once on the WPPF word to highlight the cell and drag down to highlight, then click on the
“Graph” menu at the top of the view window and click on the “Pie” chart option. A pie chart should
appear in the window to the right…
Page 52 of 59
Rigaku
9009 New Trails Drive The Woodlands, TX 77381 281-362-230
modified 06/14/2012
17.
17. Right Mouse click on the pie chart to copy
the image and paste into a document
17. Or for an alternative method of reporting, click on the “File” menu and then the “Create Report”
option…
Page 53 of 59
Rigaku
9009 New Trails Drive The Woodlands, TX 77381 281-362-230
modified 06/14/2012
Another menu will open listing all the options for creating and printing an MS word report.
This will automatically create a report with a much or as little data as selected.
Advance WPPF Features :
18. You can refine crystal structure provided there is enough data ( data/parameter ratio is 5 or
more). In that case one should check bond distance and angles to make sure if they make sense
(from the perspective of literature values) and esds associated are low.
19. To adjust for preferred orientation or a skew in the intensity fitting, click on the Edit button in the
WPPF (on the lower left side). A window will appear.
Page 54 of 59
Rigaku
9009 New Trails Drive The Woodlands, TX 77381 281-362-230
modified 06/14/2012
.
20 (a). In the drop down menu, choose the Preferred Orientation option under Model Name:
20 (b). Check the box in front of the phase or phases that have preferred orientation. Identify the
direction in reflections or miller indices of the orientation (exaggeration of intensity). Enter the
number of the reflection in individual components (i.e. if oriented on the (002)) enter “0”under h and
“0” under k and “2” under l).
20(c). Then by trial and error determine a good starting orientation vector for the March coefficient.
For March coefficient the smaller the number, the larger the degree of orientation—1.0 is random
and has no additional orientation—0.9 is a very smaller degree of orientation—0.5 is a high degree
of orientation.
20 (d). Start with a value of 0.8 for the March coefficient on the phase that has low intensity on a
peak. Press the “okay” button. Press the “simulate” button back on the WPPF window and observe
the goodness of fit (visually) between the red and blue lines of the “Profile View” Window. Are the
intensities going in the correct direction or are they getting worse? Make more adjustments until the
“simulation” is going in the right direction. Press the “Refine” button in the WPPF window when you
are getting closer. Has the Rwp and Rp value changed for the better? (Gone to lower or smaller
numbers?).
Page 55 of 59
Rigaku
9009 New Trails Drive The Woodlands, TX 77381 281-362-230
modified 06/14/2012
Still not matching
raw data well for
the second phase
of SiC
32
34
32
34
Simulation
matches raw data
better for the first
phase
36
38
36
38
2-theta(deg)
Difference Pattern indicates under
simulated raw data intensity
21. If you have a solid solution or if your phase has a different chemical composition but the space
group is same. You can modify the database entry and refine the occupancy values to get the bestfit model.
Example: The XRD pattern shown below is a mixture of Quartz (SiO2) and Beryl (Be3Al2Si6O18)
However for a synthetic Beryl prepared in lab may have additional elements (different composition,
the elemental composition can be determined by any elemental; technique such as XRF, SEM, ICP
etc). A possible combination of formula for Beryl to begin with based on elemental analysis can be
(Be2.978 Li0.022) Al2 Si6 O18.
Assuming space group is same (this can be checked if all the peaks are present, their intensity and
position may change). It is clear that the atomic site to make changes is one of Be. Next few screen
Page 56 of 59
Rigaku
9009 New Trails Drive The Woodlands, TX 77381 281-362-230
modified 06/14/2012
shots shows how to change the composition of Beryl from Be3Al2Si6O18 to Be2.978 Li0.022) Al2
Si6 O18 (caution, it has been determined by powder pattern that space group has not changed).
Note the multiplicity of the site is 3 so we divide each occupancy by 3. This part will be disucces
more in lecture.
Page 57 of 59
Rigaku
9009 New Trails Drive The Woodlands, TX 77381 281-362-230
modified 06/14/2012
Page 58 of 59
Rigaku
9009 New Trails Drive The Woodlands, TX 77381 281-362-230
modified 06/14/2012
XII. Crystallite Size Module:
1. Click on the “Crystallite Size” button on the flow bar (left side).
2. A window will appear on the right hand side with a
graph showing the individual points connected with a
line. The average of all the points is the average
crystallite size as calculated by the Willamson-Hall
method
3. If more than one phase was identified (and “Set”), the crystallite size will be listed by phases. To
see the crystallite size for other phases, click on the “Target phase:” drop down menu at the top.
Page 59 of 59
Rigaku
9009 New Trails Drive The Woodlands, TX 77381 281-362-230
modified 06/14/2012