1
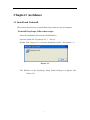
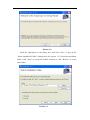
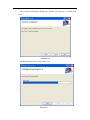
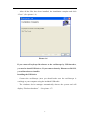
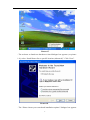
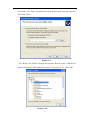
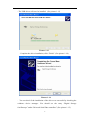
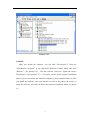
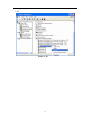
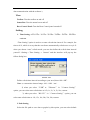
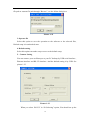
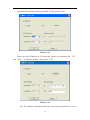
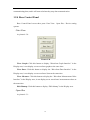
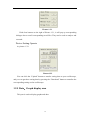
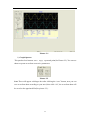
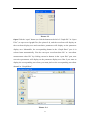
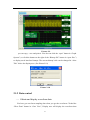
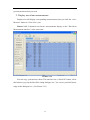
EasyScope User Manual
Version No:1.0
I
Copyright Information
1. Atten company all rights reserved.
2. Atten company reserves all rights of the EasyScope software.
II
Introduction
EasyScope Software introduces a family of windows 95/98/XP/2000(Intel)/NT
4.0(Intel) applications that connect your oscilloscopes to your PC desktop by USB
serial interface,RS-232 interface and Ethernet interface. The software provide the
display area to display captured waveforms data、 measurements data、waveforms and
the LCD waveform interface. Waveforms can refresh automatically, which is help to
users analyzing and researching data further; Meanwhile, the software can
upload/download setups of the oscilloscope; Further, the software also have control
panel setup function, save and print measurements and sampling data functions.
III
Preface
This manual is the user guide for the EasyScope software, and it contains four
chapters.
Chapter1: Accidence
This chapter guides you install or uninstall the software and introduces you the
interface,
Chapter 2: Operating the EasyScope
This chapter introduces how to use mostly function of the EasyScope software.
Chapter 3: Troubleshooting
This chapter introduces ways to solve frequently encountered problems.
Chapter 4: Contract us
This chapter introduces ways to contract our company.
IV
Catalogue
Introduction..................................................................................................................III
Preface..........................................................................................................................IV
Catalogue ......................................................................................................................V
Chapter1 Accidence .......................................................................................................1
1.1 Install and Uninstall ..........................................................................................1
1.2 Software Interface...........................................................................................12
1.2.1 Menu Bar ..............................................................................................12
1.2.2 Toolbar ..................................................................................................16
1.2.3 Link state display .................................................................................17
1.2.4 Base Control Panel................................................................................18
1.2.5 Data、Graph display area.....................................................................19
1.2.6 Status Bar ..............................................................................................20
Chapter 2 Operating the EasyScope ............................................................................21
2.1 Graph、Data control operate..........................................................................21
2.1.1 Graph control ........................................................................................21
2.1.2 Data control...........................................................................................27
2.2 Device Setting operate ....................................................................................31
2.3 Virtual panel operation....................................................................................32
Chapter 3 Troubleshooting...........................................................................................34
Chapter 4 Contract us...................................................................................................35
V
Chapter1 Accidence
1.1 Install and Uninstall
This section describes how to install EasyScope software on your computer.
To install EasyScope, follow these steps:
.
Insert the installation disk into the CD-ROM drive.
.
Open the install file “EasyScope3.0”→ “Set up”.
.
Double click “Setup. Exe” to start the installation wizard(See picture 1-1).
Picture 1-1
.
The Welcome to the EasyScope Setup Wizard dialog box appears (See
Picture1-2)
1
Picture 1-2
.
Read the information in the dialog box, and click “Next” to pop up the
“Select Installation Folder” dialogue box (See picture 1-3). Select the installation
folder, click “Next” to accept the default location or click “Browse” to select
other folder.
Picture 1-3
2
.
The Confirm Installation dialog box appears (See picture 1-4) and click
“Next”.
Picture 1-4
.
Installing EasyScope3.0 (See picture 1-5)
Picture 1-5
3
.
After all the files have been installed, the installation complete and click
“Close”. (See picture 1-6)
Picture 1-6
If you connect EasyScope3.0 software to the oscilloscope by USB interface,
you need to install USB driver; If you connect them by Ethernet or RS-232,
you will need not to install it.
Installing the USB driver
. Connect the oscilloscope (now you should make sure the oscilloscope is
working) to your computer using the included USB cable.
. The windows device manager automatically detects the system and will
display “Find new hardware”.(See picture 1-7)
4
Picture1-7
. The welcome to found new hardware wizard dialogue box appears (see picture
1-8), select “Install from a list or specific location (Advanced)”. Click “Next”.
Picture1-8
. The “Please choose your search and installation options” dialogue box appears
5
(See picture 1-9). Select “Include this location in the search” and click “Browse”.
Then click “Next”.
Picture 1-9
. The “Browse For Folder” dialogue box appears. Browse to the “USB Driver”
folder in EasyScope intall folder(See picture 1-10, picture 1-11). Click “OK”.
Picture 1-10
6
Picture 1-11
. Now you have chosen your search and installation options, Click “ok” in
dialogue box 1-12:
Picture 1-12
7
. The USB driver will now be installed. (See picture 1-13)
Picture 1-13
. Complete the driver installation, click “Finish”. (See picture 1-14)
Picture 1-14
. You can check if the installation of the driver was successful by checking the
windows device manager. You should see the entry “Digital Storage
Oscilloscope” under‘Universal Serial Bus controllers”.(See picture 1-15)
8
Picture 1-15
Uninstall
After you install the software, you can find “EasyScope3.0” from the
“Add/Remove program” in the Microsoft Windows Control Panel and click
“Remove”(See picture1-16). You also can run “Setup.exe” again and remove
EasyScope3.0 (See picture1-17). Of course, please check original installation
path, if you are not delete the software completely, please manual delete it.(After
you install the software, once you add the new file to the path in the course of
using the software, you will not delete the software completely when you delete
it.)
9
Picture1-16
Picture1-17
. Remove USB driver, please follow next steps: Right-Click “My computer”→
“Manager”→ “Device Manager” →“Universal Serial Bus controllers” →“Digital
oscilloscope” →Right-click “Digital oscilloscope” →click “Uninstall”.(See picture
10
1-18)
Picture 1-18
11
1.2 Software Interface
Menu Bar
Data 、 Graph Display
Area
Toolbar
Link state lamp
Base Control
Panel
Status Bar
Picture 1-19
1.2.1 Menu Bar
Picture 1-20
Panel
Connect: Connect the oscilloscope to the software, make them communicate the
data .
Disconnect: Disconnect the link between the oscilloscope and the software, they
will not communicate the data
Exit: Exit EasyScope (you can’t exit the software while the oscilloscope is in
12
data communication with the software.)
View
Toolbar: Turn the toolbar on and off
Status Bar: Turn the status bar on and off
Base Control Panel: Turn the Base Control panel on and off
Setting
1. Time Setting→0.5s\12s、1s\15s、2s\18s、3s\20s、5s\22s、10s\24s、
custom.
“Time Setting” option is used to set auto refresh time interval. For example, Set
time to 0.5s, which is to say that the waveforms automatically refresh once every 0.5s
when you choose “auto” refresh mode; you can also define the refresh time interval
yourself: “Setting→ Time Setting → Custom” and the interface will pop up the
follow dialog box:
Picture 1-21
Define refresh time interval according to your need, then click “OK”.
Note: 1) custom time interval range: 100~9999(ms).
2) when you select “USB”or “Ethernet” in “Connect Setting”
option, you can select auto refresh time as 0.5s, 1s, 2s, 3s, 5s, 10s, custom.
3) when you select “RS-232” in “Connect Setting” option, you can
select auto refresh time as 12s, 15s, 18s, 20s, 22s, 24s, custom.
2. Path Setting
Select the file path to save data or graphs by this option, you can select default
13
file path or custom file path through “Browse”, see the follow dialog box:
Picture 1-22
3. Operate file
Select this option to save the operation to the software to the selected files,
Default setup is in unchecked state.
4. Default setting
Select this option can make setup recover to the default setup.
5. Connect Setting
You can connect your oscilloscopes to your PC desktop by USB serial interface ,
Ethernet interface and RS-232 interface. And the default setting is by USB. See
picture 1-23
Picture 1-23
When you select ‘RS-232’ in “IO Selecting” option, You should set up the
14
same baud rate with the oscillscope By RS-232(See picture 1-24).
Picture 1-24
When you select ‘Ethernet’ in “IO Selecting” option, you should set the “IP”
and“Port” in ‘Ethernet Setting’ . (See picture 1-25).
Picture 1-25
The “IP” should set the address that don’t used in the net with the PC, or you
15
can’t connection successful. When you set the IP address, you can use the
all-purpose button. Turn the button to change the address. And press the button to
move the next position.
“Port” is the changeless value: 8001. you should not change anyway. Then
press the “OK” button, if the IP address is suitable. The light in the soft interface
turn green. (see picture 1-26)
Picture 1-26
If
the light doesn’t change color, you should set other IP address, and try it
again.
6. Test Link State
Select this option to detect the link state between the oscilloscope and software
automatically. If the link is not in normal state, the system will give you the
follow prompting message:
Picture 1-27
Now you need to check whether the oscilloscope connecting with the PC is ok.
Help
About EasyScope: Display information about EasyScope software
1.2.2 Toolbar
Picture 1-28
Put the mouse on icons, It will appears the following prompt
16
messages:
Connect: Bind DSO by Interface.
Disc: Unbind the link
Exit: Exits the App.
Basebar: View the Base Control Panel.
Panel: View the stimulant panel.
About: Show the info of EasyScope3.0.
Basebar
Click this button to turn the Base Control Panel on or off.
Panel
Click this button to pop up the virtual panel, you can operate the oscilloscope
through this panel.
Note:
1.
“Connect” 、 “Disc” and “Exit” have the same function as submenus
“Connect”、
“Disconnect”and “Exit” of the “panel” menu .
2.
“About” have the same function as submenus “About EasyScope” of the
“Help” menu.
1.2.3 Link state display
Pictutre1-29
There are two link status Lamps in the right of the menu bar, they are used to
detect whether the link between PC and the oscilloscope is normal and whether
EasyScope and the oscilloscope is communicating data or not.
The first lamp on the left will turn green in connecting status, and it will turn red
after disconnect the link between PC and Oscilloscope.
Second lamp will turn green when the oscilloscope and EasyScope is
17
communicating data, and it will turn red when they stop data communication.
1.2.4 Base Control Panel
Base Control Panel covers three parts: Goto View、Open files、Device setting
operate.
Goto View
As picture1-30:
Picture1-30
Wave Graph: Click this button to display “Waveform Graph Interface” in the
Display area; it can display seven waveform graphs at the same time.
Wave Data: Click this button to display the “Waveform Data Interface” in the
Display area; it can display seven waveforms’ data at the same time.
Wave Measure: Click this button to display the “Waveform Measurement Value
Interface” in the Display area; it can display seven waveforms’ measurement values at
the same time.
DSO Bitmap: Click this button to display “DSO bitmap” in the Display area.
Open files
As picture1-31:
18
Picture 1-31
Clicks four buttons on the right of Picture 1-31, it will pop up corresponding
dialogue box to recall corresponding saved files. They can be used to analyze and
research.
Device Setting Operate
As picture 1-32:
Picture1-32
You can click the “Upload” button to transfer setting data to your oscilloscope,
and you can get these setting data by pressing the “Download” button to actualize the
corresponding setting on the oscilloscope.
1.2.5 Data、Graph display area
This part is used to display graphs and data.
19
Fourth Part
1.2.6 Status Bar
Picture 1-32
First Part
Second Part
Third Part
Status Bar covers five parts:
First Part: Displays current operation
Second Part: Displays communication status.
Third Part: Displays communication schedule
Fourth Part: Displays communication mode
Fifth Part: Displays current date
20
Fifth Part
Chapter 2 Operating the EasyScope
This chapter covers the following topics:
◆ Graph、Data control operate
◆ Device Setting operate
◆ Virtual panel operate
2.1 Graph、Data control operate
First,Connect the oscilloscope to the computer by interface and open the
oscilloscope ,now the left link lamp turns green. EasyScope and the oscilloscope can
communicate data after clicking the “connect” button in the Toolbar, now you can
click buttons which are in the base control panel and in the corresponding interface in
the display area to actualize control operation for graphs and data.
2.1.1 Graph control
一、Wave Graph control
1. Wave Graph
To display “Waveform Graph” interface in the display area, clicks the “Wave
Graph” button in “Goto View”. The left of the interface covers three parts: Graph
Operate、Refresh Operate、Graph Show; the right of the waveform graph interface is
waveform graph display area; Blow the waveform graph display area is parameters
display area , which displays waveform correlative parameters: Sec/div、Horizontal
position、Volts/div、Vertical Position、Trigger level. (See picture 2-1)
21
Picture 2-1
1). Graph Operate
This part has four buttons: save、copy、open and print(See Picture2-2). You can use
them to operate waveform corrective parameters.
Picture 2-2
Save There will appear a dialogue box after clicking the “save” button, now you can
save waveform data according to your need, then click “ok”, the waveform data will
be saved to the appointed file(See picture 2-3).
22
Picture 2-3
Open Click the “open” button (or click the button on the left of “Graph file” in “Open
Files”) to open saved graph files (See picture2-4), and the waveform will display on
the waveform display area and correlative parameters will display on the parameter
display area. Meanwhile, the corresponding button in the “Graph Show” part is in
selected state automatically. You also can open “waveform data file” or “waveform
measurement value file” by clicking corrective buttons in the “open files” part, now
corrective parameters will display on the parameter display area. But if you want to
display the corresponding waveform, you must pitch on the corresponding waveform
channel in “Graph Show”.
Picture 2-4
23
Print Click this button to pop up the print preview interface. See picture 2-5:
Picture 2-5
Toolbar instruction on the preview page:
First page
Previous page
Go to page Last page
Next page
Print
Close
Picture 2-6
2) Refresh operate
EasyScope software has two refresh modes: “Auto” mode and “manu” mode.
See Picture 2-7
24
Picture 2-7
“Auto” mode: Selects the channel what your need in the “Graph Show” part、
Select auto refresh time interval in submenu “Time Setting” of “setting” menu and
clicks the “auto” button, the waveform will auto refresh according to time interval
setting and waveform sampling data also will refresh automatically at the same time.
“Manual” mode: The “Manu” button is visible in “Auto” mode (Because the
default refresh mode is “Manu” when you start up the software).After you click the
“manu” button and “refresh” button , the waveform and waveform data will be
refreshed once.
Wave Data:If you select this option, you will get 9K or 12K data of the
waveform (you can see them in “Wave Data” interface) when you refresh waveforms
in time base scale 2.5μs/div-50s/div except in scan mode.
Measure: you can select “CH1” , “CH2”,or select them at the same time, then
click the “refresh” button to get waveform measurements. You can see them in the
measurement interface.
Note: You need to open the auto measurement function of the oscilloscope and
the waveform measurement value can be refreshed when you refresh waveforms.
3) Graph Show
CH1,CH2
buttons correspond to channel 1 and channel 2 of the oscilloscope,
and other buttons are used to display saved waveform. See Picture2-8:
25
Picture 2-8
2. Obtain and display wave Graph
When Communication between the oscilloscope and EasyScope is in normal
status(Now two status lamps all display green) and 2 Channels waveform display
on the oscilloscope screen at the same time, you want to display them on the
waveform graph interface at the same time, please carry out the following steps:
First, select a refresh mode in the waveform graph interface. If you want to select
“manu” refresh mode, click the “manu” button.
Then clicks the “refresh” button. Now you have got four channels waveform and
waveform sampling data (you can see them in the waveform data interface).
Parameters in the parameter display area are four channels waveform’ corrective
parameters.
Picture 2-1: Selects “manual” refresh mode to get CH1, CH2 waveforms at the
same time.
Note: If you only need to display one channel waveform, you can only select CH1
or CH2 in “Graph Show” part.
二、DSO Bitmap Control
To display the current LCD waveform bitmap interface on the display area,
Clicks “DSO Bitmap” button in “Goto View”. Click the “refresh” button to get
current LCD waveform interface bitmap. (See picture 2-9).
26
Picture 2-9
you can copy、save and print it. You also can click the “open” button in “Graph
Operate” (or click the button on the right of the “Bitmap file” button in “open files”)
to display saved interface bitmaps. The current bitmap’s title can be changed in “Alter
Title” below the display area. (See Picture2-10)
Picture 2-10
2.1.2 Data control
一、Obtain and display waveform data
You have got waveform sampling data when you get the waveform. Clicked the
“Wave Data” button in “Goto View”, Display area will display the waveform data
27
interface. Seven waveforms’ data can be displayed on the waveform data interface at
the same time, and you can copy、print and save them.
Picture 2-11: CH1, CH2 waveforms’ data display on the wave data interface
Picture 2-11
Note: you can recall saved waveform data by clicking the button on the right of
the “Data file” button in “Open Files” and observe them in the waveform data
interface.
二、Obtain and display waveform measurements
This digital storage oscilloscopes can automatically measure thirty two
parameters, so the software also can obtain these thirty two parameters value.
If you want to get 2 channels waveforms’ measurement value, please follow next
steps:
1. Selects “CH1”, “CH2”,at the same time in “Graph Show” item of the “Wave
Graph interface” .
2. If you select “manu” refresh mode, click the “refresh” button, now you have
28
get measurement what you need.
2. Display waveform measurements
Display area will display corresponding measurements when you click the “wave
Measure” button in “Goto View” part.
Picture 2-12: 2 channels waveforms’ measurements display on the “Waveform
Measurement Interface” at the same time.
Picture 2-12
You can copy、print and save them. This interface has a “Pass/Fail” button, clicks
this button to pop up the Pass/Fail setting dialogue box, You can set pass/fail factors
range in this dialogue box. (See Picture 2-13)
29
Picture 2-13
Note: you can input valid number is: -999~999 in max and min editor box . If
the measurement value is in this range, it will show “pass” on the Pass/Fail list in the
measurement panel; If the measurement value is not in this range, the measurement
panel will display test result as “Fail”.
To set the range of these pass/fail factors according to the following steps:
1.
Select parameters for pass/fail factors from the list, and pitch up
“Enable”option.
2.
Input number and select unit for this parameter to set pass/fail range.
Note: you can recall saved waveform measurements by clicking the
corresponding button on the right of the “Measure file” in the “Open Files” part and
you can see them in the waveform measurements interface.
Open the saved “waveform measurements file”, not only measurements can be
displayed on the waveform measurements interface 、waveform data can be displayed
on the waveform data interface but also waveform graph can be displayed on the
waveform graph interface after pitching on the corresponding channel in “Graph
Show”. This owing to before obtaining waveform measurements we must obtain the
waveform, and the waveform is composed of sample data.
30
2.2 Device Setting operate
Upload
You can click the “upload” button to transfer the oscilloscope setup data to your
computer, then you can click the “save” button or “save as” button to save them to the
appointed file.
◇ Clicks the “save” button: Save the oscilloscope setup data to the default
configure file.
◇ Clicks the “save as” button: Save the oscilloscope setup data to the
appointed configure file.
Download
You can download the setup data from saved configure file to the oscilloscope by
clicking the “Download” button, and the oscilloscope will actualize the corresponding
setup. Please follow nest steps:
1. Click the “open” button
2. Select saved Device configure file and clicks the “open” button
3. Click the “Download” button and the oscilloscope will execute the
corresponding setup operation.
31
2.3 Virtual panel operation
Click the “connect” button in Toolbar. If you use “manual” refresh mode, there
will pop up the virtual panel as picture 2-14 when you click the “panel” button in
Toolbar. If you use “auto” refresh mode, there is no “Refresh” button on the virtual
panel. The arrangement of the software key on the virtual panel is the same as those
buttons and knobs on the front panel of the oscilloscope basically. You can click these
software key to control the oscilloscope by PC.
Picture 2-14
Button
Click buttons on the virtual panel, which can actualize the same function as press
the corresponding button on the front panel of the oscilloscope. “MB_N (N=1,2,…5)”
buttons respectively correspond to five option buttons on the left of the front panel of
the oscilloscope.
Note:If the display waveform on the oscilloscope screen is in trigger status when
you click the “SINGLE” button on the virtual panel, the “RUN/STOP” button on the
32
virtual panel should turn red and the “SINGLE” button should turn green. But now
the “RUN/STOP” button and the “SINGLE” button may all turn green owing to
period of time communication delay between the oscilloscope and PC, now you need
to click the “manual” button for several times and the “RUN/STOP” button on the
virtual panel can turn red accord with the oscilloscope.
Knob
◇ Click once
button on the virtual panel and “Knob Scale” will subtract
1, which be equal to anticlockwise turn the corresponding button a scale.
◇ Click once
button on the virtual panel and “Knob Scale” will add 1,
which be equal to clockwise turn the corresponding button a scale.
◇ “s/div” knob and “volts/div” knob of the oscilloscope can be pressed, you
can double-click
button and click the “Knob Done” button to actualize the
corresponding function.
33
Chapter 3 Troubleshooting
Note:
1. You’d better set the screen resolution rate to “1024×768” and set font to
“small font” when you use this software, which can reach the best vision interface
effect.
Set the System, follow next steps:
Click the blank area of the desktop using the right key of mouse→ “property”
→“Setting” →set the screen resolution rate to “1024×768” →click the “advanced”
option button →set the font to small font→ click “OK”.
2. In the course of using the software, if you use “Auto” refresh mode, you’d
better not set the waveform status to stop when you use virtual panel. Because when
waveforms of the oscilloscope stop, the software will get data fail.
3. In the course of using the software, if you use “Auto” refresh mode, please
disconnect “Auto” refresh first when you need to reinstall refresh time interval and
select “Auto” refresh mode after setting the new refresh time interval, or else, the new
setup will be ignored.
4. You need to open the auto measure function of the oscilloscope when you
measure waveform parameter values using the software, or else waveform measure
value will not be refreshed when you refresh the waveform; If you select “manual”
refresh mode, you need to click the “Refresh” button several times when you click
“Refresh” button in the “Wave Graph” interface but you can’t get measurement value
in the “Wave measure” interface.
5. In the course of using the software, sometimes the top right sign not display on
the software interface, now please move or drag the main frame of the software
interface.
6. In the course of using the software, if you are not connect or disconnect it in
normal, you can turn on/off the oscilloscope over again and connect or disconnect the
software again.
34
Chapter 4 Contract us
MTR Add:Building A29,Tanglang Industrial zone,Xili,Nanshan,
Shenzhen,518057,P.R.China
Tel:86-755-8602 1372
Fax:86-755-8602 1337
E-mail:[email protected]
http://www.atten.com.cn
35