1
User Manual
Revision Date: 12/15/2015
ComProbe BPA 600 User Manual
Copyright © 2000-2015 Frontline Test Equipment, Inc.
FTS, Frontline, Frontline Test System, ComProbe Protocol Analysis System and ComProbe are registered
trademarks of Frontline Test Equipment, Inc.
The following are trademarks of Frontline Test Equipment, Inc.
l
BPA 600
l
Sodera
The Bluetooth SIG, Inc. owns the Bluetooth® word mark and logos, and any use of such marks by Frontline is under
license. All other trademarks and registered trademarks are property of their respective owners.
-i-
ComProbe BPA 600 User Manual
Contents
Chapter 1 ComProbe Hardware & Software
1
1.1 What is in this manual
2
1.2 Computer Minimum System Requirements
2
1.3 Software Installation
2
1.3.1 From CD:
2
1.3.2 From Download:
3
Chapter 2 Getting Started
5
2.1 BPA 600 Hardware
5
2.1.1 Attaching Antennas
5
2.1.1.1 Status LED
6
2.1.2 Connecting/Powering the ComProbe BPA 600 Hardware
6
2.1.3 BPA 600 ProbeSync
7
2.2 Data Capture Methods
8
2.2.1 Opening ComProbe Data Capture Method
8
2.2.2 BPA 600 Data Capture Methods
9
2.2.2.1 BPA 600 ProbeSync Data Capture Methods
2.2.3 Virtual Sniffing
10
11
2.3 Control Window
11
2.3.1 Control Window Toolbar
12
2.3.2 Configuration Information on the Control Window
13
2.3.3 Status Information on the Control Window
13
2.3.4 Frame Information on the Control Window
14
2.3.5 Control Window Menus
14
2.3.6 Minimizing Windows
19
Chapter 3 Configuration Settings
21
3.1 BPA 600 Configuration and I/O
21
3.1.1 BPA 600 - Update Firmware
21
3.1.2 BPA 600 IO Datasource Settings
22
3.1.2.1 Classic Bluetooth® Roleless Connection
22
3.1.2.2 Datasource Toolbar/Menu
23
- ii -
ComProbe BPA 600 User Manual
3.1.2.3 Selecting BPA 600 Devices Under Test
24
3.1.2.4 BPA 600 Devices Under Test
25
3.1.2.4.1 BPA 600 Devices Under Test - LE Only
25
3.1.2.4.2 BPA 600 Devices Under Test - Classic Single Connection
28
3.1.2.4.3 BPA 600 Devices Under Test- Dual Mode
30
3.1.2.4.4 BPA 600 Devices Under Test - Classic Only Multiple Connection
34
3.1.2.4.5 SSP Debug Mode
37
3.1.2.4.6 Programmatically Update Link Key from 3rd Party Software
37
3.1.2.5 BPA 600 Device Database
38
3.1.2.6 BPA 600 low enegy Device Database
39
3.1.2.7 BPA 600 - Information
41
3.1.2.8 BPA 600 Advanced Classic Settings
42
3.2 Decoder Parameters
45
3.2.1 Decoder Parameter Templates
47
3.2.1.1 Select and Apply a Decoder Template
47
3.2.1.2 Adding a New or Saving an Existing Template
48
3.2.1.3 Deleting a Template
48
3.2.2 Selecting A2DP Decoder Parameters
49
3.2.3 AVDTP Decoder Parameters
49
3.2.3.1 About AVDTP Decoder Parameters
49
3.2.3.2 AVDTP Missing Decode Information
51
3.2.3.3 AVDTP Override Decode Information
52
3.2.4 L2CAP Decoder Parameters
54
3.2.4.1 About L2CAP Decoder Parameters
54
3.2.4.2 L2CAP Override Decode Information
55
3.2.5 RFCOMM Decoder Parameters
56
3.2.5.1 About RFCOMM Decoder Parameters
56
3.2.5.2 RFCOMM Missing Decode Information
57
3.2.5.3 RFCOMM Override Decode Information
58
3.3 Mesh Security
59
Chapter 4 Capturing and Analyzing Data
63
- iii -
ComProbe BPA 600 User Manual
4.1 Capture Data
63
4.1.1 Air Sniffing: Positioning Devices
63
4.1.2 Capturing Data to Disk - General Procedure
66
4.1.3 Capturing Data with BPA 600 Analyzer
68
4.1.3.1 BPA 600 Capture with ProbeSync
69
4.1.4 Combining BPA 600, 802.11, and HSU with ProbeSync
71
4.1.5 Extended Inquiry Response
73
4.2 Protocol Stacks
74
4.2.1 Protocol Stack Wizard
74
4.2.2 Creating and Removing a Custom Stack
75
4.2.3 Reframing
76
4.2.4 Unframing
76
4.2.5 How the Analyzer Auto-traverses the Protocol Stack
77
4.2.6 Providing Context For Decoding When Frame Information Is Missing
77
4.3 Analyzing Byte Level Data
78
4.3.1 Event Display
78
4.3.2 The Event Display Toolbar
79
4.3.3 Opening Multiple Event Display Windows
81
4.3.4 Calculating CRCs or FCSs
81
4.3.5 Calculating Delta Times and Data Rates
81
4.3.6 Switching Between Live Update and Review Mode
82
4.3.7 Data Formats and Symbols
82
4.3.7.1 Switching Between Viewing All Events and Viewing Data Events
82
4.3.7.2 Switching Between Hex, Decimal, Octal or Binary
83
4.3.7.3 Switching Between ASCII, EBCDIC, and Baudot
84
4.3.7.4 Selecting Mixed Channel/Sides
84
4.3.7.5 List of all Event Symbols
85
4.3.7.6 Font Size
86
4.4 Analyzing Protocol Decodes
87
4.4.1 Frame Display Window
87
4.4.1.1 Frame Display Toolbar
90
- iv -
ComProbe BPA 600 User Manual
4.4.1.2 Frame Display Status Bar
93
4.4.1.3 Hiding and Revealing Protocol Layers in the Frame Display
94
4.4.1.4 Physical vs. Logical Byte Display
94
4.4.1.5 Sorting Frames
94
4.4.1.6 Frame Display - Find
95
4.4.1.7 Synchronizing the Event and Frame Displays
97
4.4.1.8 Working with Multiple Frame Displays
97
4.4.1.9 Working with Panes on Frame Display
97
4.4.1.10 Frame Display - Byte Export
98
4.4.1.11 Panes in the Frame Display
100
4.4.1.11.1 Summary Pane
100
4.4.1.11.2 Customizing Fields in the Summary Pane
102
4.4.1.11.3 Frame Symbols in the Summary Pane
103
4.4.1.11.4 Decode Pane
104
4.4.1.11.5 Radix or Hexadecimal Pane
105
4.4.1.11.6 Character Pane
105
4.4.1.11.7 Binary Pane
105
4.4.1.11.8 Event Pane
106
4.4.1.11.9 Change Text Highlight Color
106
4.4.1.12 Protocol Layer Colors
106
4.4.1.12.1 Data Byte Color Notation
106
4.4.1.12.2 Changing Protocol Layer Colors
107
4.4.1.13 Filtering
107
4.4.1.13.1 Display Filters
108
4.4.1.13.1.5 Defining Node and Conversation Filters
4.4.1.13.1.6 The Difference Between Deleting and Hiding Display Filters
4.4.1.13.1.7 Editing Filters
4.4.1.13.2 Connection Filtering
116
4.4.1.13.2.1 Creating a Connection Filter
4.4.1.13.2.2 Connection Filter Display
4.4.1.13.3 Protocol Filtering from the Frame Display
-v-
121
ComProbe BPA 600 User Manual
4.4.1.13.3.1 Quick Filtering on a Protocol Layer
4.4.1.13.3.2 Easy Protocol Filtering
4.4.2 BPA 600 Baseband Layer Signal Strength
123
4.4.3 Bluetooth Timeline
123
4.4.3.1 Bluetooth Timeline Packet Depiction
124
4.4.3.2 Bluetooth Timeline Packet Navigation and Selection
127
4.4.3.3 Bluetooth Timeline Toolbar
128
4.4.3.4 Bluetooth Timeline Menu Bar
129
4.4.3.5 Bluetooth Timeline Visual Elements
131
4.4.3.6 Bluetooth Timeline Zooming
133
4.4.3.7 Bluetooth Timeline Throughput Displays
133
4.4.3.7.1 Bluetooth Timeline Average Payload Throughput
134
4.4.3.7.2 Bluetooth Timeline 1 Second Throughput Indicators
134
4.4.3.7.3 Average Payload Throughput (bits/s) (Selected)
134
4.4.3.7.4 Bluetooth Payload Throughput Over Time Graph
135
4.4.3.8 Export Payload Throughput Over Time
136
4.4.3.9 Object Throughput Stats File
136
4.4.3.10 Bluetooth Timeline Discontinuities
137
4.4.3.11 Legend
138
4.4.3.12 Bluetooth Timeline: Packets Missing Bluetooth Clock
138
4.4.4 low energy Timeline
139
4.4.4.1 low energy Timeline Toolbar
140
4.4.4.2 low energy Timeline Menu Bar
141
4.4.4.3 low energy Timeline Legend
145
4.4.4.4 Throughput Displays
145
4.4.4.5 Average and 1 Second Packet Throughput
145
4.4.4.6 Average and 1 Second Payload Throughput
145
4.4.4.7 Throughput Graph
145
4.4.4.8 The Timeline
147
4.4.4.9 How Packets Are Displayed
147
4.4.4.10 Format Menu
148
- vi -
ComProbe BPA 600 User Manual
4.4.4.11 low energy Timeline Visual Elements
150
4.4.4.12 low energy Packet Discontinuities
152
4.4.4.13 low energy Timeline Navigating and Selecting Data
153
4.4.4.14 low energy Timeline Zooming
154
4.4.4.15 Zoom menu
155
4.4.4.16 Single Segment Zoom
156
4.4.4.17 Multiple Segments
156
4.4.5 Coexistence View
157
4.4.5.1 Coexistence View Menus
157
4.4.5.2 Coexistence View - Toolbar
164
4.4.5.3 Coexistence View - Throughput Indicators
166
4.4.5.4 Throughput
166
4.4.5.5 Radio Buttons
167
4.4.5.6 All radio button
167
4.4.5.7 Selected radio button
167
4.4.5.8 Viewport radio button
167
4.4.5.9 Indicator width
168
4.4.5.10 Coexistence View - Throughput Graph
169
4.4.5.11 Throughput Graph Y-axis labels
169
4.4.5.12 Excluded packets
170
4.4.5.13 Tooltips
170
4.4.5.14 Discontinuities
170
4.4.5.15 Viewport
171
4.4.5.16 Swap button
172
4.4.5.17 Dots button
173
4.4.5.18 Zoomed Throughput Graph
174
4.4.5.19 Zoom Cursor
176
4.4.5.20 Comparison with the Bluetooth Timeline's Throughput Graph
176
4.4.5.21 Coexistence View - Set Button
177
4.4.5.22 Coexistence View - Throughput Radio Buttons
178
4.4.5.23 Coexistence View - Timeline Radio Buttons
178
- vii -
ComProbe BPA 600 User Manual
4.4.5.24 Coexistence View – low energy Devices Radio Buttons
178
4.4.5.25 Coexistence View – Legend
179
4.4.5.26 Coexistence View – Timelines
179
4.4.5.27 Packet information
179
4.4.5.28 Relocating the tool tip
182
4.4.5.29 The two Timelines
184
4.4.5.30 Bluetooth slot markers
186
4.4.5.31 Zooming
186
4.4.5.32 Discontinuities
187
4.4.5.33 High-Speed Bluetooth
188
4.4.5.34 Coexistence View - No Packets Displayed with Missing Channel Numbers
189
4.4.5.35 High Speed Live View
190
4.4.6 About The Message Sequence Chart (MSC)
191
4.4.6.1 Message Sequence Chart - Search
196
4.4.6.2 Message Sequence Chart - Go To Frame
197
4.4.6.3 Message Sequence Chart - First Error Frame
198
4.4.6.4 Message Sequence Chart - Printing
198
4.5 Packet Error Rate Statistics
200
4.5.1 Packet Error Rate - Channels (Classic and low energy)
202
4.5.2 Packet Error Rate - Pie Chart and Expanded Chart
204
4.5.3 Packet Error Rate - Legend
205
4.5.4 Packet Error Rate - Additional Statistics
206
4.5.5 Packet Error Rate - Sync Selected Packets With Other Windows
207
4.5.6 Packet Error Rate - Export
207
4.5.7 Packet Error Rate - Scroll Bar
208
4.5.8 Packet Error Rate - Excluded Packets
210
4.6 Bluetooth Audio Expert System
211
4.6.1 Supported Codec Parameters
212
4.6.2 Starting the AudioExpert System (BPA 600 only)
213
4.6.3 Operating Modes
213
4.6.3.1 Non-Referenced Mode
213
- viii -
ComProbe BPA 600 User Manual
4.6.3.2 Referenced Mode
214
4.6.3.3 Referenced Mode Testing Processes
216
4.6.3.3.1 System Calibration for Referenced Mode
219
4.6.3.3.2 Adjusting for Optimal Volume Levels
221
4.6.4 Audio Expert System Event Type
222
4.6.4.1 Event Type: Bluetooth Protocol
222
4.6.4.2 Event Type: Codec
223
4.6.4.3 Event Type: Audio
225
4.6.5 Audio Expert System Window
231
4.6.5.1 Global Toolbar
232
4.6.5.2 Wave Panel
234
4.6.5.2.1 Audio Stream Info
235
4.6.5.2.2 Local Controls
236
4.6.5.2.3 Audio Waveform Panel
237
4.6.5.2.4 Event Timeline
239
4.6.5.3 Event Table
241
4.6.5.4 Wave Panel & Event Table Pop-up Menu
243
4.6.5.5 Export Audio Data
244
4.6.5.6 Export Event Table
246
4.6.6 Frame, Packet, and Protocol Analysis Synchronization
4.7 Data/Audio Extraction
246
247
Chapter 5 Navigating and Searching the Data
251
5.1 Find
251
5.1.1 Searching within Decodes
252
5.1.2 Searching by Pattern
254
5.1.3 Searching by Time
256
5.1.4 Using Go To
258
5.1.5 Searching for Special Events
259
5.1.6 Searching by Signal
260
5.1.7 Searching for Data Errors
263
5.1.8 Find - Bookmarks
265
- ix -
ComProbe BPA 600 User Manual
5.1.9 Changing Where the Search Lands
266
5.1.10 Subtleties of Timestamp Searching
267
5.2 Bookmarks
267
5.2.1 Adding, Modifying or Deleting a Bookmark
267
5.2.2 Displaying All and Moving Between Bookmarks
268
Chapter 6 Saving and Importing Data
271
6.1 Saving Your Data
271
6.1.1 Saving the Entire Capture File
271
6.1.2 Saving the Entire Capture File with Save Selection
272
6.1.3 Saving a Portion of a Capture File
273
6.2 Adding Comments to a Capture File
273
6.3 Confirm Capture File (CFA) Changes
274
6.4 Loading and Importing a Capture File
274
6.4.1 Loading a Capture File
274
6.4.2 Importing Capture Files
275
6.5 Printing
275
6.5.1 Printing from the Frame Display/HTML Export
275
6.5.2 Printing from the Event Display
278
6.6 Exporting
279
6.6.1 Frame Display Export
279
6.6.2 Exporting a File with Event Display Export
279
6.6.2.1 Export Filter Out
282
6.6.2.2 Exporting Baudot
282
Chapter 7 General Information
283
7.1 System Settings and Progam Options
283
7.1.1 System Settings
283
7.1.1.1 System Settings - Disabled/Enabled Options
285
7.1.1.2 Advanced System Options
285
7.1.1.3 Selecting Start Up Options
286
7.1.2 Changing Default File Locations
287
7.1.3 Side Names
289
-x-
ComProbe BPA 600 User Manual
7.1.4 Timestamping
290
7.1.4.1 Timestamping Options
290
7.1.4.2 Enabling/Disabling Timestamp
291
7.1.4.3 Changing the Timestamp Resolution
291
7.1.4.4 Switching Between Relative and Absolute Time
292
7.1.4.5 Displaying Fractions of a Second
293
7.2 Technical Information
293
7.2.1 Performance Notes
293
7.2.2 BTSnoop File Format
294
7.2.3 Ring Indicator
296
7.2.4 Progress Bars
297
7.2.5 Event Numbering
297
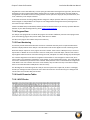
7.2.6 Useful Character Tables
297
7.2.6.1 ASCII Codes
297
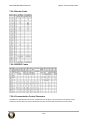
7.2.6.2 Baudot Codes
298
7.2.6.3 EBCDIC Codes
298
7.2.6.4 Communication Control Characters
298
7.2.7 The Frontline Serial Driver
300
7.2.8 DecoderScript Overview
300
7.2.9 Bluetooth low energy ATT Decoder Handle Mapping
301
7.3 Contacting Technical Support
302
Appendicies
303
Appendix A: Application Notes
305
A.1 Audio Expert System: aptX 'hiccup' Detected
306
A.1.1 Background
306
A.1.2 Test Setup
306
A.1.3 Discussion
307
A.1.4 Conclusions
311
A.2 Getting the Android Link Key for Classic Decryption
313
A.2.1 What You Need to Get the Android Link Key
313
A.2.2 Activating Developer options
313
- xi -
ComProbe BPA 600 User Manual
A.2.3 Retrieving the HCI Log
314
A.2.4 Using the ComProbe Software to Get the Link Key
315
A.3 Bluetooth Conductive Testing—Isolating the Environment
319
A.3.1 Bluetooth Transmitter Classes
319
A.3.2 Test Equipment
319
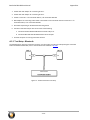
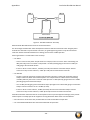
A.3.3 Test Setup - Bluetooth
320
A.3.4 Test Process
322
A.4 Decrypting Encrypted Bluetooth®data with ComProbe BPA 600
324
A.4.1 How Encryption Works in Bluetooth
324
A.4.2 Legacy Pairing (Bluetooth 2.0 and earlier)
324
A.4.3 Secure Simple Pairing (SSP) (Bluetooth 2.1 and later)
326
A.4.4 How to Capture and Decrypt Data (Legacy Pairing)
326
A.4.5 How to tell if a device is in Secure Simple Pairing Debug Mode
328
A.5 Decrypting Encrypted Bluetooth® low energy
332
A.5.1 How Encryption Works in Bluetooth low energy
332
A.5.2 Pairing
332
A.5.3 Pairing Methods
333
A.5.4 Encrypting the Link
334
A.5.5 Encryption Key Generation and Distribution
334
A.5.6 Encrypting The Data Transmission
335
A.5.7 Decrypting Encrypted Data Using ComProbe BPA 600 low energy Capture
335
A.6 Bluetooth® low energy Security
342
A.6.1 How Encryption Works in Bluetooth low energy
343
A.6.2 Pairing
343
A.6.3 Pairing Methods
344
A.6.4 Encrypting the Link
345
A.6.5 Encryption Key Generation and Distribution
345
A.6.6 Encrypting The Data Transmission
346
A.6.7 IRK and CSRK Revisited
346
A.6.8 Table of Acronyms
347
A.7 Bluetooth Virtual Sniffing
349
- xii -
ComProbe BPA 600 User Manual
A.7.1 Introduction
349
A.7.2 Why HCI Sniffing and Virtual Sniffing are Useful
349
A.7.3 Bluetooth Sniffing History
350
A.7.4 Virtual Sniffing—What is it?
350
A.7.5 The Convenience and Reliability of Virtual Sniffing
351
A.7.6 How Virtual Sniffing Works
351
A.7.7 Virtual Sniffing and Bluetooth Stack Vendors
351
A.7.8 Case Studies: Virtual Sniffing and Bluetooth Mobile Phone Makers
352
A.7.9 Virtual Sniffing and You
352
List of Figures
Figure 2.1 - BPA 600 Antenna Connectors
5
Figure 2.2 - ComProbe BPA 600 with both antennas attached
5
Figure 2.3 - BPA 600 Hardware LEDs
6
Figure 2.4 - BPA 600 USB Connector
7
Figure 2.5 - BPA 600 Hardware ProbeSync connection
7
Figure 2.6 - Desktop Folder Link
8
Figure 2.7 - Two BPA 600 Analyzer Data Capture Method using ProbeSync
10
Figure 2.8 - ComProbe Analyzer Control Window
11
Figure 3.1 - BPA 600 Datasource LE Device Database Tab
40
Figure 3.2 - Add Menu Option Fields Display
40
Figure 3.3 - Editing IRK Field
41
Figure 3.4 - Select Set Initial Decoder Parameters... from Control window
46
Figure 3.5 - Tabs for each decoder requiring parameters.
46
Figure 3.6 - Set Subsequent Decoder Parameters... from Control window
47
Figure 3.7 - Example: Set Subsequent Decode for Frame #52, RFCOMM
47
Figure 3.8 - A2DP Decoder Settings
49
Figure 3.9 - AVDTP parameters tab
50
Figure 3.10 - Parameters Added to Decoder
50
Figure 3.11 - Look in Decoder pane for profile hints
51
- xiii -
ComProbe BPA 600 User Manual
Figure 3.12 - AVDTP Override of Frame Information, Item to Carry
53
Figure 3.13 - AVDTP Override of Frame Information, Media Codec Selection
53
Figure 3.14 - L2CAP Decoder parameters tab
54
Figure 3.15 - Parameters Added to Decoder
55
Figure 3.16 - RFCOMM parameters tab
56
Figure 3.17 - Parameters Added to Decoder
57
Figure 3.18 - Set Subsequent Decoder Parameters selection list
59
Figure 3.19 - CSRmesh Bad MAC
61
Figure 4.1 - Devices Equally Spaced in the Same Horizontal Plane
64
Figure 4.2 - For Audio A2DP, Position Closer to SINK DUT
65
Figure 4.3 - Example: Poor Capture Environment
66
Figure 4.4 - Packet Transfer Dialog
67
Figure 4.5 - Start Sniffing from Datasource Toolbar.
68
Figure 4.6 - Incorrect ProbeSync Hardware Connection Error
70
Figure 4.7 - Incorrect ProbeSync Hardware Connection Message In Datasource Status
70
Figure 4.8 - BPA 600 ProbeSync Synchronizing Device Status Message
71
Figure 4.9 - BPA 600 ProbeSync Synchronized Device Status Message
71
Figure 4.10 - Incorrect ProbeSync Hardware Connection Error
72
Figure 4.11 - Incorrect ProbeSync Hardware Connection Message In Datasource Status
72
Figure 4.12 - ProbeSync Synchronizing Device Status Message
73
Figure 4.13 - ProbeSync Synchronized Device Status Message
73
Figure 4.14 - Frame Display Extended Inquire Response
73
Figure 4.15 - Format Menu
83
Figure 4.16 - Header labels, right click
83
Figure 4.17 - Data display right click menu
84
Figure 4.18 - Event Display Options menu
87
Figure 4.19 - Event Display Font Size Selection
87
Figure 4.20 - Frame Display with all panes active
88
Figure 4.21 - Frame Display Find text entry field
95
Figure 4.22 - Search/Find Dialog
95
Figure 4.23 - Frame Display File menu, Byte Export
98
- xiv -
ComProbe BPA 600 User Manual
Figure 4.24 - Byte Export dialog
99
Figure 4.25 - Save As dialog
99
Figure 4.26 - Sample Exported Frames Text File
100
Figure 4.27 - Example Protocol Tags
101
Figure 4.28 - Summary pane (right) with Tooltip on Column 5 (Tran ID)
102
Figure 4.29 - Frame Display Protocol Layer Color Selector
107
Figure 4.30 - Example: Set Conditions Self Configuring Based on Protocol Selection
109
Figure 4.31 - Example: Set Conditions Self Configuring Based on Frame Range
109
Figure 4.32 - Two Filter Conditions Added with an AND Operator
111
Figure 4.33 - Save Named Filter Condition Dialog
112
Figure 4.34 - Using Named Filters Section of Quick Filters to Show/Hide Filters
114
Figure 4.35 - Set Condition Dialog in Advanced View
115
Figure 4.36 - Rename Filters Dialog
116
Figure 4.37 - Connection Filter from the Frame Display Menu
117
Figure 4.38 - Connection Filter from the Frame Display Toolbar right-click
118
Figure 4.39 - Connection Filter from the Frame Display Pane right-click
118
Figure 4.40 - Connection Filter from frame selection right-click
119
Figure 4.41 - Front Display: Filtered on Access Address 0x8e89bed6
120
Figure 4.42 - Unfiltered: Capture File with Classic, low energy, and 802.11
121
Figure 4.43 - Connection Filter selecting All 802.11 frames, front
121
Figure 4.44 - Frame Display Quick Filtering and Hiding Protocols Dialog
122
Figure 4.45 - Bluetooth Timeline window
123
Figure 4.46 - Bluetooth Timeline Packet Depiction with Packet Information Shown
124
Figure 4.47 - Missing packets message in timeline pane.
139
Figure 4.48 - Bluetooth low energy Timeline
139
Figure 4.49 - Bluetooth low energy Timeline Throughput Graph
146
Figure 4.50 - Creating Encrypted MIC in Frame Display Summary pane
147
Figure 4.51 - Bluetoothlow energy Timeline
147
Figure 4.52 - Diagram of low energy Timeline Flow with Segment and Row Relationship
148
Figure 4.53 - Device Address Rows
149
Figure 4.54 - Radio Rows
149
- xv -
ComProbe BPA 600 User Manual
Figure 4.55 - low energy Timeline and Frame Display Packet Synchronization
150
Figure 4.56 - Timeline Markers Shown Snapped to End of Packet
150
Figure 4.57 - Bluetooth le Timeline Segment Timestamp and Zoom Value
151
Figure 4.58 - Bluetooth le Timeline Packet Info Line
151
Figure 4.59 - Bluetooth le Timeline Packet Info Line for Multiple Selected Packets
152
Figure 4.60 - Bluetooth® low energy Packet Discontinuity
152
Figure 4.61 - low energy Timeline Zoom menu
155
Figure 4.62 - Coexistence View Window
157
Figure 4.63 - Coexistence View Toolbar
164
Figure 4.64 - Coexistence View Throughput Indicators
166
Figure 4.65 - Throughput Graph viewport.
168
Figure 4.66 - Average throughput indicators show a plus sign (+) when the indicator width is exceeded. 168
Figure 4.67 - A single selected packet
168
Figure 4.68 - Coexistence View Throughput Graph
169
Figure 4.69 - Throughput Graph y-axis labels.
170
Figure 4.70 - Data point tooltip
170
Figure 4.71 - A negative discontinuity.
171
Figure 4.72 - Three positive discontinuities.
171
Figure 4.73 - Throughput Graph Viewport
172
Figure 4.74 - Small Timeline and large Throughput Graph after pressing the Swap button.
173
Figure 4.75 - Dots Toggled On and Off
173
Figure 4.76 - Overlapping Dots Information Display
174
Figure 4.77 - Synchronized Zoomed Throughput Graph and View Port
175
Figure 4.78 - Zoomed Throughput Graph- Largest Value Snaps to Top
175
Figure 4.79 - Zoomed Throughput Graph - Freeze Y keeps the y-axis constant
176
Figure 4.80 - 802.11 Source Address Dialog
177
Figure 4.81 - 802.11 Source Address Drop Down Selector
178
Figure 4.82 - Coexistence View Legend
179
Figure 4.83 - Coexistence View Timelines
179
Figure 4.84 - Each packet is color-coded
180
Figure 4.85 - Highlighted entries in the legend for a selected packet.
180
- xvi -
ComProbe BPA 600 User Manual
Figure 4.86 - Timeline header for a single selected packet.
180
Figure 4.87 - Timeline header for multiple selected packets
181
Figure 4.88 - Descriptive text on timeline packets.
181
Figure 4.89 - A tool tip for a Classic Bluetooth packet.
182
Figure 4.90 - Coexistence View Format Menu - Show Tooltips on Computer Screen
183
Figure 4.91 - Coexistence View Timeline Tool Tip Shown Anchored to Computer Screen
184
Figure 4.92 - 5 GHz and 2.4 GHz 802.11 packets
185
Figure 4.93 - 5 GHz information window
186
Figure 4.94 - 2.4 GHz information windows
186
Figure 4.95 - Vertical blue lines are Bluetooth slot markers
186
Figure 4.96 - A negative discontinuity
187
Figure 4.97 - A positive discontinuity
188
Figure 4.98 - Timeline header with discontinuity
188
Figure 4.99 - Timeline duration footer with discontinuity
188
Figure 4.100 - High-speed Bluetooth packets have a blue frequency box and a two-tone tool tip
189
Figure 4.101 - Missing Channel Numbers Message in Timelines
189
Figure 4.102 - Message Sequence Chart Window
192
Figure 4.103 - Classic and LE tabs
193
Figure 4.104 - Frame# and Time Display, inside red box.
194
Figure 4.105 - MSC Synchronization with Frame Display
194
Figure 4.106 - Control and Signaling Frames Summay
195
Figure 4.107 - Packet Layers Shown in Different Colors
195
Figure 4.108 - Right-Click in Ctrl Summary to Display Show in MSC
195
Figure 4.109 - MSC View of Selected Packet from Ctrl Summary
196
Figure 4.110 - Return to Text View Using Right-Click Menu
196
Figure 4.111 - Highlighted First Search Result
197
Figure 4.112 - Message Sequence Chart Print Preview
199
Figure 4.113 - Print Preview Toolbar
199
Figure 4.114 - Classic Bluetooth PER Stats Window
201
Figure 4.115 - Bluetooth low energy PER Stats Window
202
Figure 4.116 - Classic Bluetooth Packet Error Rate Channels
203
- xvii -
ComProbe BPA 600 User Manual
Figure 4.117 - Bluetooth low energy Packet Error Rate Channels
203
Figure 4.118 - Save As dialog in PER Stats Export
208
Figure 4.119 - PER Stats Scroll Bar
208
Figure 4.120 - Example: Excluded Packets Message in Scroll Bar (Classic Bluetooth)
211
Figure 4.121 - Test Cases for Referenced Mode Testing
219
Figure 4.122 - Test_1.02_44.1kHz_16Bit.wav Waveform
219
Figure 4.123 - Test 1.02 Test ID Segment
220
Figure 4.124 - Dropout: Measurement and Silence Threshold
230
Figure 4.125 - Audio Expert System Window
231
Figure 4.126 - Wave Panel
234
Figure 4.127 - Audio Stream Info in the Wave Panel
235
Figure 4.128 - SBC Codec Information Pop-Up on Cursor Hover Over
235
Figure 4.129 - Wave Panel Local Controls
236
Figure 4.130 - Collapsed Wave Panel
237
Figure 4.131 - Audio Waveform Panel in the Wave Panel
237
Figure 4.132 - Selection in the Audio Waveform
238
Figure 4.133 - Actual Bitrate Overlay
239
Figure 4.134 - Average Bitrate Overlay
239
Figure 4.135 - Event Timeline Shown with Wave Panel
239
Figure 4.136 - Example: Event Table Selection Shown in Event Timeline
240
Figure 4.137 - Event Timeline Selected Event Pop Up
241
Figure 4.138 - Event Table
241
Figure 4.139 - Export Audio Data dialog
245
Figure 5.1 - Find Dialog
251
Figure 5.2 - Find Decode Tab Search for String
252
Figure 5.3 - Find Decode Tab Side Restriction
253
Figure 5.4 - Find Pattern Tab
255
Figure 5.5 - Find Pattern Tab Side Restrictions
255
Figure 5.6 - Find by Time tab
256
Figure 5.7 - Find Go To tab
258
Figure 5.8 - Find Special Events tab
260
- xviii -
ComProbe BPA 600 User Manual
Figure 5.9 - Find Signal tab.
261
Figure 5.10 - Find Error tab.
263
Figure 5.11 - Find Bookmark tab.
266
Figure 5.12 - Bookmarked Frame (3) in the Frame Display
267
Figure 5.13 - Find Window Bookmark tab Used to Move Around With Bookmarks
269
Figure 6.1 - Windows Save dialog
272
Figure 6.2 - Frame Display Print Dialog
276
Figure 6.3 - Frame Display Print Preview Dialog
277
Figure 6.4 - Event Display Print Dialog
279
Figure 6.5 - Event Display Export Example: .csv file.
280
Figure 6.6 - Example: .csv Event Display Export, Excel spreadsheet
282
Figure 7.1 - System Settings Single File Mode
284
Figure 7.2 - Advanced System Options dialog 286
Figure 7.3 - Start Up Options dialog
287
Figure 7.4 - File Locations dialog
288
Figure 7.5 - File Locations Browse dialog
288
Figure 7.6 - Example: Side Names Where "Slave" and "Master" are current
290
- xix -
Chapter 1 ComProbe Hardware & Software
Frontline Test Equipment ComProbe family of protocol analyzers work with the following technologies.
l
Classic Bluetooth®
l
Bluetooth low energy
l
Dual Mode Bluetooth (simultaneous Classic and low energy)
l
Bluetooth Coexistence with 802.11
l
Bluetooth HCI (USB, SD, High Speed UART)
l
NFC
l
802.11 (Wi-Fi)
l
SD
l
USB
l
HSU (High Speed UART)
The ComProbe hardware interfaces with your computer that is running our robust software engine called the
ComProbe Protocol Analysis System or ComProbe software. Whether you are sniffing the air or connecting
directly to the chip Frontline analyzers use the same powerful ComProbe software to help you test, troubleshoot,
and debug communications faster.
ComProbe software is an easy to use and powerful protocol analysis platform. Simply use the appropriate
ComProbe hardware or write your own proprietary code to pump communication streams directly into the
ComProbe software where they are decoded, decrypted, and analyzed. Within the ComProbe software you see
packets, frames, events, coexistence, binary, hex, radix, statistics, errors, and much more.
This manual is a user guide that takes you from connecting and setting up the hardware through all of the
ComProbe software functions for your ComProbe hardware. Should you have any questions contact the Frontline
Technical Support Team.
-1-
ComProbe BPA 600 User Manual
Chapter 1 ComProbe Hardware & Software
1.1 What is in this manual
The ComProbe User Manual comprises the following seven chapters. The chapters are organized in the sequence
you would normally follow to capture and analyze data: set up, configure, capture, analyze, save. You can read
them from beginning to end to gain a complete understanding of how to use the ComProbe hardware and
software or you can skip around if you only need a refresher on a particular topic. Use the Contents, Index, and
Glossary to find the location of particular topics.
l
l
l
l
l
l
l
Chapter 1 ComProbe Hardware and Software. This chapter will describe the minimum computer
requirements and how to install the software.
Chapter 2 Getting Started. Here we describe how to set up and connect the hardware, and how to apply
power. This chapter also describes how to start the ComProbe software in Data Capture Methods. You will be
introduced to the Control window that is the primary operating dialog in the ComProbe software.
Chapter 3 Configuration Settings. The software and hardware is configured to capture data. Configuration
settings may vary for a particular ComProbe analyzer depending on the technology and network being sniffed.
There are topics on configuring protocol decoders used to disassemble packets into frames and events.
Chapter 4 Capturing and Analyzing Data. This Chapter describes how to start a capture session and how to
observe the captured packets, frames, layers and events.
Chapter 5 Navigating and Searching the Data. Here you will find how to move through the data and how to
isolate the data to specific events, often used for troubleshooting device design problems.
Chapter 6 Saving and Importing Data. When a live capture is completed you may want to save the captured
data for future analysis, or you may want to import a captured data set from another developer or for use in
interoperability testing. This chapter will explain how to do this for various data file formats.
Chapter 7 General Information. This chapter provides advanced system set up and configuration information,
timestamping information, and general reference information such as ASCII, baudot, and EBCDIC codes. This
chapter also provides information on how to contact Frontline's Technical Support team should you need
assistance.
1.2 Computer Minimum System Requirements
Frontline supports the following computer systems configurations:
l
Operating System: Windows 7 and 8
l
USB Port: USB 2.0 High-Speed or USB 3.0 Super-Speed
The ComProbe software must operate on a computer with the following minimum characteristics.
l
Processor: Core i5 processor at 2.7 GHz
l
RAM: 4 GB
l
Free Hard Disk Space: 20 GB
1.3 Software Installation
1.3.1 From CD:
Insert the ComProbe installer disc into your DVD drive. Click on the Install CPAS shortcut and follow the
directions.
-2-
Chapter 1 ComProbe Hardware & Software
ComProbe BPA 600 User Manual
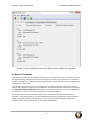
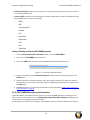
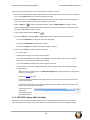
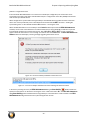
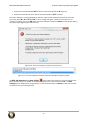
1.3.2 From Download:
Download the latest CPAS installer from FTE.com. Once downloaded, double-click the installer and follow the
directions.
-3-
ComProbe BPA 600 User Manual
Chapter 1 ComProbe Hardware & Software
-4-
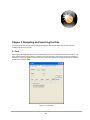
Chapter 2 Getting Started
In this chapter we introduce you to the ComProbe hardware and show how to start the ComProbe analyzer
software and explain the basic software controls and features for conducting the protocol analysis.
2.1 BPA 600 Hardware
2.1.1 Attaching Antennas
When you remove the ComProbe BPA 600 hardware from the box, the first step is to attach the antennas (Figure
2.1).
Figure 2.1 - BPA 600 Antenna Connectors
1. Attach antennas to the SMA connectors.
Figure 2.2 - ComProbe BPA 600 with both antennas attached
-5-
ComProbe BPA 600 User Manual
Chapter 2 Getting Started
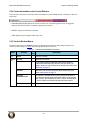
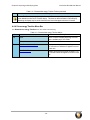
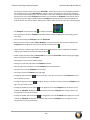
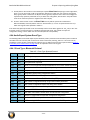
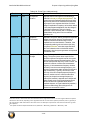
2.1.1.1 Status LED
The ComProbe BPA 600 has two Status LEDs on the RF panel. In the front panel center are the LOW ENERGY
and BR/EDR LEDs.
Figure 2.3 - BPA 600 Hardware LEDs
LED Color
Table 2.1 - ComProbe BPA 600 LED Status
ComProbe BPA 600 Activity
LED Off
ComProbe BPA 600 device is idle.
Green
ComProbe BPA 600 is actively sniffing waiting for configured devices to connect.
Blue
The configured devices have connected (Asynchronous Connectionless Link (ACL)).
Intermittent
Blue
Configured devices are in "Sniff mode" (slave is listening at a reduced rate, conserving
device power).
2.1.2 Connecting/Powering the ComProbe BPA 600 Hardware
Once you have attached the antennas, the next step is to power up and connect the ComProbe BPA 600
hardware to the computer.
1. Insert the USB cable into the USB port on the ComProbe BPA 600 hardware. The ComProbe BPA 600
analyzer requires no external power (Figure 2.4).
-6-
Chapter 2 Getting Started
ComProbe BPA 600 User Manual
Figure 2.4 - BPA 600 USB Connector
2. Insert the other end of the USB cable into the PC.
The next thing to do is to turn on the devices that you will be testing.
2.1.3 BPA 600 ProbeSync
Any ComProbe hardware with ProbeSync™ can be connected together to run off of a common clock, ensuring
precise timestamp synchronization.
Simply plug the supplied Cat 5 cable into the OUT connector on the sniffer that will be supplying the clock and
connect the other end to the IN connector on the sniffer receiving the clock. ( Figure 2.5 - ). If using a BPA 600
analyzer with a different ComProbe analyzer, the BPA 600 analyzer must provide the clock. Combined cable
length of all the ProbeSync cables connected at a given time should not exceed 1.5 meters (4.5 feet).
Figure 2.5 - BPA 600 Hardware ProbeSync connection
Connect the CAT 5 cable before connecting the USB cable to the BPA 600 hardware. If you must change the
ProbeSync connections it may be necessary to cycle the power to the devices to ensure proper synchronization.
-7-
ComProbe BPA 600 User Manual
Chapter 2 Getting Started
Should the CAT5 cable be connected incorrectly, that is OUT to OUT or IN to IN, an error message will appear
when the BPA 600 software is run. Refer to BPA 600 Capture with ProbeSync on page 69
2.2 Data Capture Methods
This section describes how to load Frontline Test Equipment, Inc ComProbe Protocol Analysis System software,
and how to select the data capture method for your specific application.
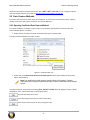
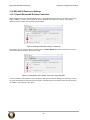
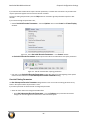
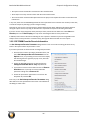
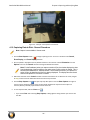
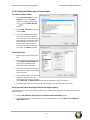
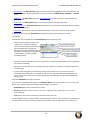
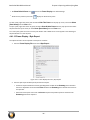
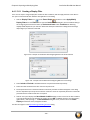
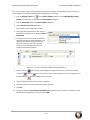
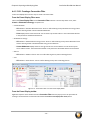
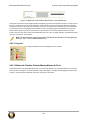
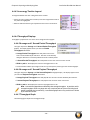
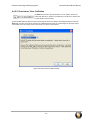
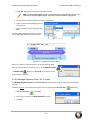
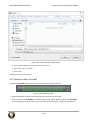
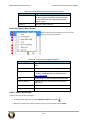
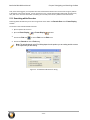
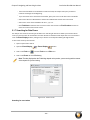
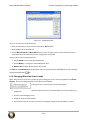
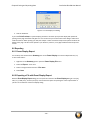
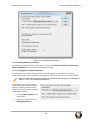
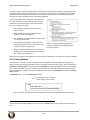
2.2.1 Opening ComProbe Data Capture Method
On product installation, the installer creates a folder on the windows desktop labeled "Frontline ComProbe
Protocol Analysis System <version#>".
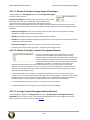
1. Double-click the "Frontline ComProbe Protocol Analysis System" desktop folder
This opens a standard Windows file folder window.
Figure 2.6 - Desktop Folder Link
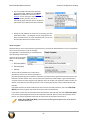
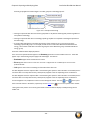
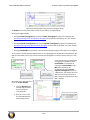
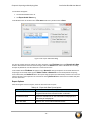
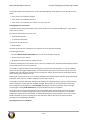
2. Double-click on Frontline ComProbe Protocol Analysis System and the system displays the Select Data
Capture Method dialog.
Note: You can also access this dialog by selecting Start > All Programs > Frontline
ComProbe Protocol Analysis System (Version #) > Frontline ComProbe Protocol Analysis
System
Three buttons appear at the bottom of the dialog; Run, Cancel, and Help. When the dialog first opens, Cancel
and Help are active, and the Run button is inactive (grayed out).
starts the selected protocol stack.
closes the dialog and exits the user back to the desktop.
takes the user to this help file as does pressing the F1 key.
-8-
Chapter 2 Getting Started
ComProbe BPA 600 User Manual
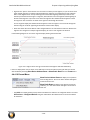
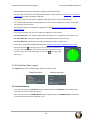
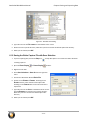
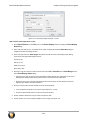
3. Expand the folder and select the data capture method that matches your configuration.
4. Click on the Run button and the ComProbe Control Window will open configured to the selected capture
method.
Note: If you don't need to identify a capture method, then click the Run button to start the
analyzer.
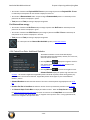
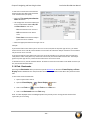
Creating a Shortcut
A checkbox labeled Create Shortcut When Run is located near the bottom of the dialog. This box is un-checked
by default. Select this checkbox, and the system creates a shortcut for the selected method, and places it in the
"Frontline ComProbe Protocol Analysis System <version#>" desktop folder and in the start menu when you click
the Run button. This function allows you the option to create a shortcut icon that can be placed on the desktop. In
the future, simply double-click the shortcut to start the analyzer in the associated protocol.
Supporting Documentation
The Frontline ComProbe Protocol Analysis System directory contains supporting documentation for development
(Automation, DecoderScript, application notes), user documentation (Quick Start Guides and User Manual), and
maintenance tools.
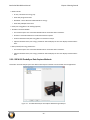
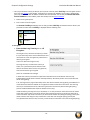
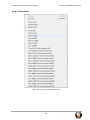
2.2.2 BPA 600 Data Capture Methods
ComProbe Protocol Analysis System has different data capture methods to accommodate various applications.
l
l
l
BR/EDR - low energy Air Sniffing
This method requires one ComProbe BPA 600 and is used to capture combined BR/EDR and Bluetooth® low
energy data. Used for typical applications to capture Classic Bluetooth and Bluetooth low energy data.
-9-
ComProbe BPA 600 User Manual
l
Modes include:
l
LE Only - Bluetooth low energy only
l
Classic Only Single Connection
l
Dual Mode - Classic Bluetooth and Bluetooth low energy.
l
Classic Only Multiple Connections
l
Classic/low energy/802.11 Air Sniffing (optional)
l
Two 802.11 and One BPA600
l
This method requires one ComProbe BPA 600 and two ComProbe 802.11 hardware.
l
An 802.11 ComProbe hardware is included with the Wi-Fi Option.
l
Used for Bluetooth Classic/low energy/802.11 coexistence analysis.
l
l
Chapter 2 Getting Started
Captures Bluetooth Classic, low energy, and 802.11 data and displays in the Frame Display and Coexistence
View.
802.11/Classic/low energy Coexistence
l
l
This method requires one ComProbe BPA 600 and one ComProbe 802.11 hardware.
Captures Bluetooth Classic, low energy, and 802.11 data and displays in the Frame Display and Coexistence
View.
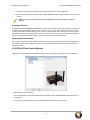
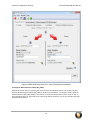
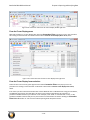
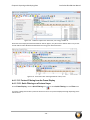
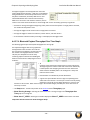
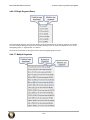
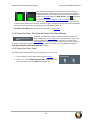
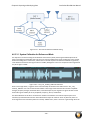
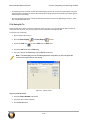
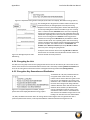
2.2.2.1 BPA 600 ProbeSync Data Capture Methods
ComProbe® Protocol Analysis System has different data capture methods to accommodate various applications.
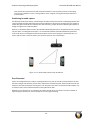
Figure 2.7 - Two BPA 600 Analyzer Data Capture Method using ProbeSync
- 10 -
Chapter 2 Getting Started
ComProbe BPA 600 User Manual
ProbeSync™ allows multiple ComProbe analyzers to work seamlessly together and to share a common clock.
Clock sharing allows the analyzers to precisely synchronize communications streams and to display resulting
packets in a single shared or coexistent view.
l
Classic and low energy Bluetooth sniffing
l
Two BPA 600 devices
2.2.3 Virtual Sniffing
The Virtual Sniffer is a live import facility within ComProbe software that makes it possible to access any layer in a
stack that the programmer has access to and feed this data into the Virtual Sniffer. Please refer to the “Show Live
Import Information“ button on the Virtual Sniffer Datasource window in ComProbe software. More information is
available in the Live Import Developer's Kit located in the Development Tools folder in Frontline ComProbe
Protocol Analysis System desktop folder, and a white paper is available at Bluetooth Virtual Sniffing
l
l
FTS Side
o
No hardware required.
o
ComProbe software acquires data via user-developed software.
IEEE 11073+
o
No hardware required
o
for sniffing data virtually from the continua Enabling Software Library (CESL) IEEE 11073 tester.
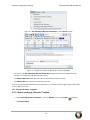
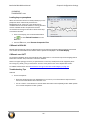
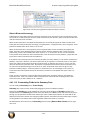
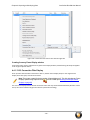
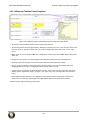
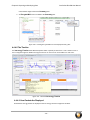
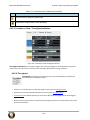
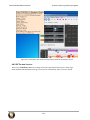
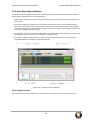
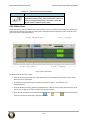
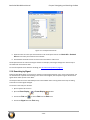
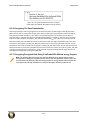
2.3 Control Window
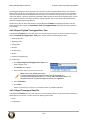
The analyzer displays information in multiple windows, with each window presenting a different type of
information. The Control window opens when the Run button is clicked in the Select Data Capture Method
window. The Control window provides access to each ComProbe analyzer functions and settings as well as a brief
overview of the data in the capture file. Each icon on the toolbar represents a different data analysis function. A
sample Control Window is shown below.
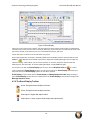
Figure 2.8 - ComProbe Analyzer Control Window
Because the Control window can get lost behind other windows, every window has a Home icon
that brings
the Control window back to the front. Just click on the Home icon to restore the Control window.
When running the Capture File Viewer, the Control window toolbar and menus contain only those selections
needed to open a capture file and display the About box. Once a capture file is opened, the analyzer limits Control
window functions to those that are useful for analyzing data contained in the current file. Because you cannot
- 11 -
ComProbe BPA 600 User Manual
Chapter 2 Getting Started
capture data while using Capture File Viewer, data capture functions are unavailable. For example, when viewing
Ethernet data, the Signal Display is not available. The title bar of the Control window displays the name of the
currently open file. The status line (below the toolbar) shows the configuration settings that were in use when the
capture file was created.
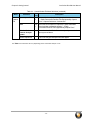
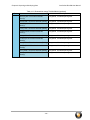
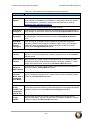
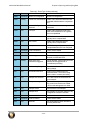
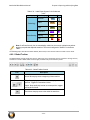
2.3.1 Control Window Toolbar
Toolbar icon displays vary according to operating mode and/or data displayed. Available icons appear in color,
while unavailable icons are not visible. Grayed-out icons are available for the ComProbe hardware and software
configuration in use but are not active until certain operating conditions occur. All toolbar icons have
corresponding menu bar items or options.
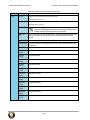
Table 2.2 - Control Window Toolbar Icon List
Icon
Description
Open File - Opens a capture file.
I/O Settings - Opens settings
Start Capture - Begins data capture to disk
Stop Capture - Available after data capture has started. Click to stop data capture. Data can
be reviewed and saved, but no new data can be captured.
Save - Saves the capture file.
Clear - Clears or saves the capture file.
Event Display - (framed data only) Opens a Event Display, with the currently selected bytes
highlighted.
Frame Display - (framed data only) Opens a Frame Display, with the frame of the currently
selected bytes highlighted.
Notes - Opens the Notes dialog.
Cascade - Arranges windows in a cascaded display.
Bluetooth Packet Timeline - Opens the Packet Timeline dialog.
Coexistence View - Opens the Coexistence View dialog.
Low energy - Opens the low energy Timeline dialog.
Extract Data/Audio - Opens the Extract Data/Audio dialog.
- 12 -
Chapter 2 Getting Started
ComProbe BPA 600 User Manual
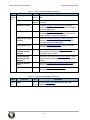
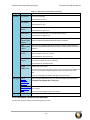
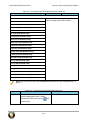
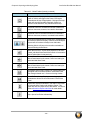
Table 2.2 - Control Window Toolbar Icon List (continued)
Icon
Description
MSC Chart - Opens the Message Sequence Chart
Bluetooth low energy Packet Error Rate Statistics - Opens the Packet Error Rate Statistics
window.
Bluetooth Classic Packet Error Rate Statistics - Opens the Packet Error Rate Statistics
window.
Audio Expert System - Opens Audio Expert System window
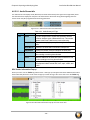
2.3.2 Configuration Information on the Control Window
The Configuration bar (just below the toolbar) displays the hardware configuration and may include I/O settings. It
also provides such things as name of the network card, address information, ports in use, etc.
2.3.3 Status Information on the Control Window
The Status bar located just below the Configuration bar on the Control window provides a quick look at current
activity in the analyzer.
l
l
Capture Status, or Status for Sodera, displays Not Active, Paused or Running and refers to the state of data
capture
o
Not Active means that the analyzer is not currently capturing data.
o
Paused means that data capture has been suspended.
o
Running means that the analyzer is actively capturing data.
% Used
The next item shows how much of the buffer or capture file has been filled. For example, if you are
capturing to disk and have specified a 200 Kb capture file, the bar graph tells you how much of the capture
file has been used. When the graph reaches 100%, capture either stops or the file begins to overwrite the
oldest data, depending on the choices you made in the System Settings.
l
Utilization/Events
The second half of the status bar gives the current utilization and total number of events seen on the
network. This is the total number of events monitored, not the total number of events captured. The
analyzer is always monitoring the circuit, even when data is not actively being captured. These graphs
allow you to keep an eye on what is happening on the circuit, without requiring you to capture data.
- 13 -
ComProbe BPA 600 User Manual
Chapter 2 Getting Started
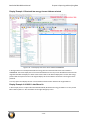
2.3.4 Frame Information on the Control Window
Frame Decoder information is located just below the Status bar on the Control window. It displays two pieces of
information.
l
Frame Decoder (233 fps) displays the number of frames per second being decoded. You can toggle this
display on/off with Ctrl-D, but it is available only during a live capture.
l
#132911 displays the total frames decoded.
l
100% displays the percentage of buffer space used.
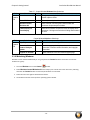
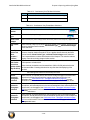
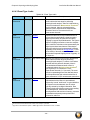
2.3.5 Control Window Menus
The menus appearing on the Control window vary depending on whether the data is being captured live or
whether you are looking at a .cfa file. The following tables describe each menu.
Mode
Table 2.3 - Control Window File Menu Selections
Hot
Selection
Description
Key
Live
Close
Closes Live mode.
Capture
File
Go Live
Returns to Live mode
Reframe
If you need to change the protocol stack used to interpret a
capture file and the framing is different in the new stack, you
need to reframe in order for the protocol decode to be correct. See
Reframing on page 76
Unframe
Removes start-of-frame and end-of-frame markers from your
data. SeeUnframing on page 76
Recreate
Companion File
This option is available when you are working with decoders. If
you change a decoder while working with data, you can recreate
the ".frm file", the companion file to the ".cfa file". Recreating the
".frm file" helps ensure that the decoders will work properly.
Reload Decoders
The plug-ins are reset and received frames are decoded again.
- 14 -
Chapter 2 Getting Started
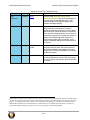
Table 2.3 - Control Window File Menu Selections (continued)
Hot
Selection
Description
Key
Mode
Live &
Capture
File
ComProbe BPA 600 User Manual
Open Capture File
Ctrl- Opens a Windows Open file dialog. at the default location
-O
"...\Public Documents\Frontline Test Equipment\My Capture
Files\". Capture files have a .cfa extension.
Save
Ctrl- Saves the current capture or capture file. Opens a Windows
S
Save As dialog at the default location "...\Public
Documents\Frontline Test Equipment\My Capture Files\".
Exit ComProbe
Protocol Analysis
System
Shuts down the ComProbe Protocol Analysis System and all
open system windows.
Recent capture files
A list of recently opened capture files will appear.
The View menu selections will vary depending on the ComProbe analyzer in use.
- 15 -
ComProbe BPA 600 User Manual
Table 2.4 - Control Window View Menu Selections
Selection
Hot key
Description
Mode
Live &
Capture
File
Event Display
CtrlShift-E
Opens the Event Display window for analyzing byte level
data.
Frame Display
CtrlShift-M
Opens the Frame Display window for analyzing protocol
level data
Bluetooth Timeline
Opens the Bluetooth Timeline window for analyzing
protocol level data in a packet chronological format and in
packet throughput graph.
Coexistence View
Opens the Coexistence View window that can
simultaneously display Classic Bluetooth, Bluetooth low
energy, and 802.11 packets and thourghput.
Bluetooth low energy
Timeline
Opens the Bluetooth low energy Timeline window for
analyzing protocol level data in a packet chronological
format and in packet throughput graph.
Extract Data Audio...
Opens the Data/Audio Extraction dialog for pulling data
from decoded Bluetooth protocols.
Bluetooth low energy
Packet Error Rate
Statistics
Opens the Bluetooth low energy PER Stats window to
show a dynamic graphical representation of the error rate
for each low energy channel.
Classic Bluetooth
Packet Error Rate
Statistics
Opens the Classic Bluetooth PER Stats window to show a
dynamic graphical representation of the error rate for each
channel.
Bluetooth Protocol
Expert
Opens the Bluetooth Protocol Expert System window to
assist in the analysis of Bluetooth protocol issues.
Audio Expert System
Opens the Audio Expert System window for the purpose of
detecting and reporting audio impairments.
Table 2.5 - Control Window Edit Menu Selections
HotSelection
Description
key
Mode
Capture
File
Chapter 2 Getting Started
Notes
CtrlOpens the Notes window that allows the user to add
Shift-O comments to a capture file.
- 16 -
Chapter 2 Getting Started
Mode
Live
Selection
ComProbe BPA 600 User Manual
Control Window Live Menu Selections
Hot-Key
Description
Start Capture
Shift-F5
Begins data capture from the configured wireless
devices.
Stop Capture
F10
Stops data capture from the configured wireless devices.
Clear
ShiftF10
Clears or saves the capture file.
- 17 -
ComProbe BPA 600 User Manual
Mode
Live &
Capture
File
Chapter 2 Getting Started
Table 2.6 - Control Window Options Menu Selections
HotSelection
Description
Key
0 - Classic
Hardware Settings
1 - Bluetooth low energy
0 - Classic
I/O Settings
1 - Bluetooth low energy
System Settings
AltEnter
Opens the System Settings dialog for configuring capture
files.
Directories...
Opens the File Locations dialog where the user can change
the default file locations.
Check for New
Releases at Startup
When this selection is enabled, the program automatically
checks for the latest Frontline protocol analyzer software
releases.
Side Names...
Opens the Side Names dialog used to customize the names
of the slave and master wireless devices.
Protocol Stack...
Opens the Select a Stack dialog where the user defines the
protocol stack they want the analyzer to use when decoding
frames.
Set Initial Decoder
Parameters...
Opens the Set Initial Decoder Parameters window. Each
entry in the window takes effect from the beginning of the
capture onward or until redefined in the Set Subsequent
Decoder Parameters dialog. This selection is not present if no
decoder is loaded that supports this feature.
Set Subsequent
Decoder
Parameters...
Opens the Set Subsequent Decoder Parameters dialog
where the user can override an existing parameter at any
frame in the capture. Each entry takes effect from the
specified frame onward or until redefined in this dialog on a
later frame. This selection is not present if no decoder is
loaded that supports this feature.
Automatically
Request Missing
Decoder Information
When checked, this selection opens a dialog that asking for
missing frame information. When unchecked, the analyzer
decodes each frame until it cannot go further and it stops
decoding. This selection is not present if no decoder is loaded
that supports this feature.
Enable/Disable
Audio Expert
System
When enabled, the Audio Expert System is active, other wise
it is not available. Only available when an Audio Expert
System licensed device is connected.
The Windows menu selection applies only to the Control window and open analysis windows: Frame Display,
Event Display, Message Sequence Chart, Bluetooth Timeline, Bluetooth low energy Timeline, and
Coexistence View. All other windows, such as the datasource, are not affected by these selections.
- 18 -
Chapter 2 Getting Started
Mode
Live &
Capture
File
Mode
Live &
Capture
File
ComProbe BPA 600 User Manual
Table 2.7 - Control Window Windows Menu Selections
Selection
Hot-Key
Description
Cascade
Ctrl-W
Arranges open analysis windows in a cascaded view with
window captions visible.
Close All Views
Closes Open analysis windows.
Minimize Control
Minimizes All
When checked, minimizing the Control window also
minimizes all open analysis windows.
Frame Display and
Event Display
When these windows are open the menu will display these
selections. Clicking on the selection will bring that window to
the front.
Selection
Control Window Help Menu Selections
Hot-Key
Description
Help Topics
Opens the ComProbe Help window.
About ComProbe
Protocol Analysis
System
Provides a pop-up showing the version and release
information, Frontline contact information, and copyright
information.
Support on the Web
Opens a browser to fte.com technical support page.
2.3.6 Minimizing Windows
Windows can be minimized individually or as a group when the Control window is minimized. To minimize
windows as a group:
1. Go to the Window menu on the Control
window.
2. Select Minimize Control Minimizes All. The analyzer puts a check next to the menu item, indicating
that when the Control window is minimized, all windows are minimized.
3. Select the menu item again to deactivate this feature.
4. The windows minimize to the top of the operating system Task Bar.
- 19 -
ComProbe BPA 600 User Manual
Chapter 2 Getting Started
- 20 -
Chapter 3 Configuration Settings
In this section the ComProbe software is used to configure an analyzer for capturing data .
3.1 BPA 600 Configuration and I/O
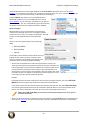
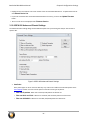
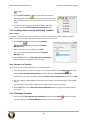
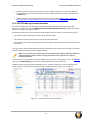
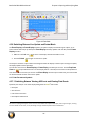
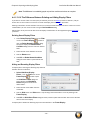
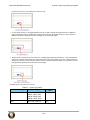
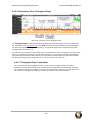
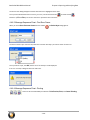
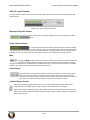
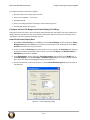
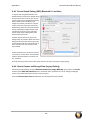
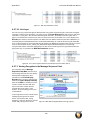
3.1.1 BPA 600 - Update Firmware
When you select the Update Firmware on the BPA 600 Information, the Update ComProbe BPA 600
firmware dialog appears. You use this dialog to update your ComProbe hardware with the latest firmware.
It is very important that you update the firmware. If the firmware versions are not the same, you will not be able
to start sniffing.
BPA 600 Update Firmware Dialog
1. Make sure the cabling is attached to the ComProbe hardware.
2. Select Flash Device.
The download begins, with the Status bar displaying the progress. When the download is complete, you
can check the firmware version by checking the Status dialog.
- 21 -
ComProbe BPA 600 User Manual
Chapter 3 Configuration Settings
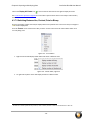
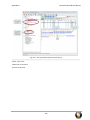
3.1.2 BPA 600 IO Datasource Settings
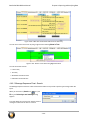
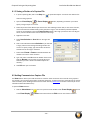
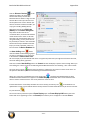
3.1.2.1 Classic Bluetooth® Roleless Connection
When configuring the ComProbe BPA 600 devices for a Classic Bluetooth connection it is no longer necessary to
assign a “Master” or “Slave” role to each of the devices. All Classic connection are “roleless”. For example,
suppose you have a phone and a speaker as shown below:
Figure 3.1 Example of BPA 600 "roleless" Connection
Alternatively, you can enter the devices as follows where Classic Device drop down controls have reversed
the devices under test shown in the previous image.
Figure 3.2 Example BPA 600 "roleless" Connection - Switching DUT
It does not matter which position you enter the device. After you have started sniffing and a connection is made,
the arrow will indicate the direction of the connection. In the following screen shot the phone has connected as
the “Master” to the speaker as the “Slave”.
- 22 -
Chapter 3 Configuration Settings
ComProbe BPA 600 User Manual
Figure 3.3 Arrow Shows master-slave Relationship
Should the roles change during the connection the arrow will change to show the new "Master/Slave"
connection. In the following screen shot the speaker has connected as the “Master” to the phone as the “Slave”.
Figure 3.4 Arrow Showing Results of Role Switch
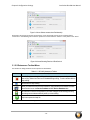
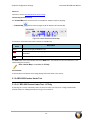
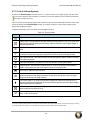
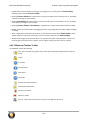
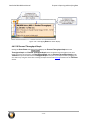
3.1.2.2 Datasource Toolbar/Menu
The Datasource dialog toolbar and menu options are listed below.
Table 3.5 - BPA 600 datasource Toolbar
Icon
Description
Start Sniffing button to begin sniffing. All settings are saved automatically when you
start sniffing. Selection of devices is disabled during sniffing. To select another device
stop sniffing.
Pause button to stop sniffing
When you select the Discover Devices button, the software lists all the discoverable
Bluetooth devices on the Device Database and LE Device Database tabs.
Save button to save the configuration if you made changes but did not begin sniffing.
All settings are saved automatically when you start sniffing.
Help button opens the help file.
Grayed-out icons are inactive and do not apply to ComProbe BPA 600
- 23 -
ComProbe BPA 600 User Manual
Chapter 3 Configuration Settings
Table 3.6 - BPA 600 datasource Menu
Description
Menu Item
File
Save and Exit options, self explanatory.
View
Hides or displays the toolbar.
BPA 600
Start Sniffing, Stop Sniffing, Discover Devices
Help
Opens ComProbe Help, and About BPA 600.
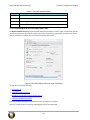
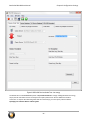
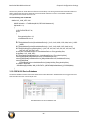
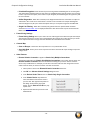
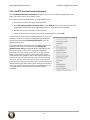
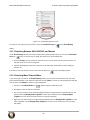
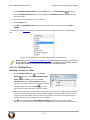
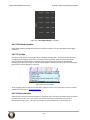
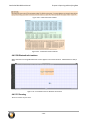
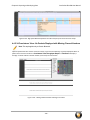
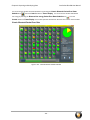
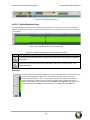
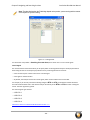
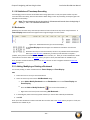
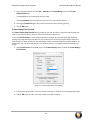
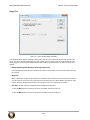
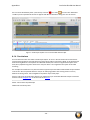
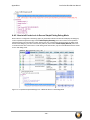
3.1.2.3 Selecting BPA 600 Devices Under Test
The Devices Under Test dialog has all the setup information the analyzer needs in order to synchronize with the
piconet and capture data. The analyzer requires information on the clock synchronization method and the device
address of the device to initially sync to. You must also choose what to sniff.
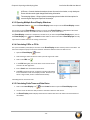
Figure 3.7 BPA 600 Datasource Devices Under Test Dialog
You can choose to capture data using:
l
low energy only
l
Classic Only, Single Connection
l
Dual Mode - Combination of Classic and low energy
l
Classic Only, Multiple Connections
Select one of these links above for explanations on how to configure each option.
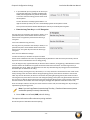
There are a couple of other functions on the dialog that you need to understand.
- 24 -
Chapter 3 Configuration Settings
ComProbe BPA 600 User Manual
Advanced
Click here to see the BPA 600 Advanced Classic Settings.
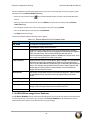
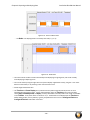
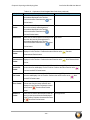
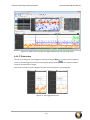
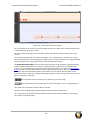
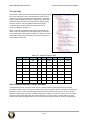
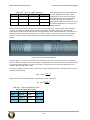
Channel Map (Classic Bluetooth)
The Channel Map shows which channels are available for Adaptive Frequency Hopping.
l
Channel Map
Click this button to toggle on/off the display of the Channel Map.
Figure 3.8 Classic Bluetooth Channel Map
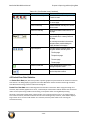
This display is used to determine which channels are available with
Channel
Color
Description
White
Channel is currently available for use.
Red
When Adaptive Frequency Hopping is in use, red indicates that the channel is marked as
unavailable
Blue
Indicates that a packet was captured on the channel.
The Clear button resets each indicator back to the White state. The indicators are also reset whenever a new
Channel Map goes into effect.
Note: Channel Map is not available for LE Only.
Status Window
A status window at the bottom of the dialog displays information about recent activity.
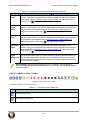
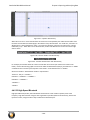
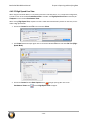
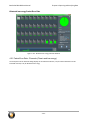
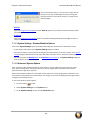
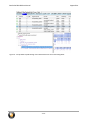
3.1.2.4 BPA 600 Devices Under Test
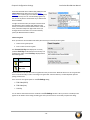
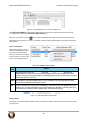
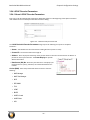
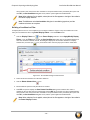
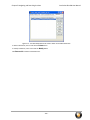
3.1.2.4.1 BPA 600 Devices Under Test - LE Only
By selecting the "LE Only" radio button under the "Devices Under Test" tab you can configure the BPA 600
protocol analyzer for sniffing Bluetooth low energy communications.
- 25 -
ComProbe BPA 600 User Manual
Chapter 3 Configuration Settings
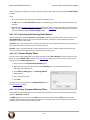
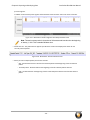
Figure 3.9 BPA 600 Devices Under Test - low energy
The default value in the LE Device drop down is Sync with First Master. To begin sniffing Bluetooth low energy
simply click the red button to start. The analyzer will capture packets from the first Master that makes a
connection . To capture the advertising traffic and the connection(s), you must specify a device address.
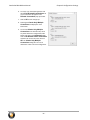
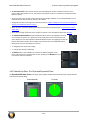
Specifying the LE Device Address and Encryption
- 26 -
Chapter 3 Configuration Settings
ComProbe BPA 600 User Manual
1. If you would like you may specify the LE device you
are testing by typing in or choosing its address (BD_
ADDR). You can type it directly into the drop down,
or choose it from the existing previous values list in
the drop down.
To enter the device manually type the address - 12
digit hex number (6 octets). The "0x" is automatically typed in the drop down control.
Once you have the devices address identified, the next step is to identify the Encryption.
2. Enter the Long Term Key for the LE Encryption.
The Long Term Key is similar to the Link key in Classic. It is a
persistent key that is stored in both devices and used to
derive a fresh encryption key each time the devices go
encrypted.
Learn more about the Long Term Key.
The Long Term Key is similar to the Link key in Classic; it is a
persistent key that is stored in both devices and used to
derive a fresh encryption key each time the devices go
encrypted.
There are a few differences though:
In Classic the Link key is derived from inputs from both
devices and is calculated in the same way independently by both devices and then stored persistently. The link
key itself is never transmitted over the air during pairing.
In LE, the long term key is generated solely on the slave device and then, during pairing, is distributed to a master
device that wants to establish an encrypted connection to that slave in the future. Thus the long term key is
transmitted over the air, albeit encrypted with a one-time key derived during the pairing process and discarded
afterwards (the so called short term key).
Unlike the link key, this long term key is directional, i.e. it is only used to for connections from the master to the
slave (referring to the roles of the devices during the pairing process). If the devices also want to connect the
other way round in the future, the device in the master role (during the pairing process) also needs to send its
own long term key to the device in the slave role during the pairing process (also encrypted with the short term
key of course), so that the device which was in the slave during the pairing process can be a master in the future
and connect to the device which was master during the pairing process (but then would be in a slave role).
Since most simple LE devices are only ever slave and never master at all, the second long term key exchange is
optional during the pairing process.
Note: If you use Copy/Paste to insert the Long Term Key , Frontline will auto correct (remove
invalid white spaces) to correctly format the key.
3. Enter a PIN or out-of-band (OOB) value for Pairing.
This optional information offers alternative pairing methods.
One of two pieces of data allow alternative pairing:
- 27 -
ComProbe BPA 600 User Manual
Chapter 3 Configuration Settings
1. PIN is a six-digit (or less if leading zeros are omitted) decimal number.
2. Out-of-Band (OOB) data is a 16-digit hexadecimal code which the devices exchange via a channel
that is different than the le transmission itself. This channel is called OOB. For off-the-shelf
devices we cannot sniff OOB data, but in the lab you may have access to the data exchanged
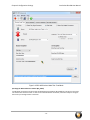
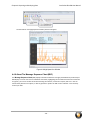
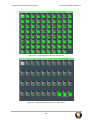
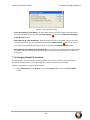
through this channel. 3.1.2.4.2 BPA 600 Devices Under Test - Classic Single Connection
Figure 3.10 BPA 600 Devices Under Test - Classic Only Single Connection
Specifying the Bluetooth Device Address (BD_ADDR)
- 28 -
Chapter 3 Configuration Settings
ComProbe BPA 600 User Manual
Select the Bluetooth device address (BD_ADDR) form the
Classic Device: drop down list or from the Device
Database. You can also type in the address as a 12 digit hex
number (6 octets). The "0x" is automatically typed in by
the control. Any devices entered this way is added to the
Device Database
In single connection mode, the analyzer needs to know
the Bluetooth® Device Address (BD_ADDR) for each
device, but it does not need to know which is master or
slave, ComProbe analyzercan figure that out for you
through roleless connection. You can also manually
specify the Bluetooth Device Address.
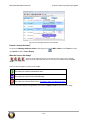
Classic Encryption
Once you have the devices address identified, the next step is to identify the Encryption.
1. Select an Encryption option.
2. Enter a value for the encryption.
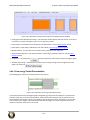
The Current Link Key field displays the currently
provided Link Key and the date and time the key was
provided. The status of the Link Key is displayed with
the following icons:
Icon
Link Key Status
Valid
Not Valid
Bluetooth devices can have their data encrypted when they communicate. Bluetooth devices on an encrypted link
share a common link key in order to exchange encrypted data. How that link key is created depends upon the
pairing method used.
There are three encryption options in the I/O Settings dialog.
a. PIN Code (ASCII)
b. PIN Code (Hex)
c. Link Key
You are able to switch between these methods in the I/O Settings window. When you select a method, a note
appears at the bottom of the dialog reminding you what you need to do to successfully complete the dialog.
- 29 -
ComProbe BPA 600 User Manual
l
Chapter 3 Configuration Settings
The first and second options use a PIN Code to generate the Link Key. The devices generate link Keys during
the Pairing Process based on a PIN Code. The Link Key generated from this process is also based on a random
number so the security cannot be compromised. If the analyzer is given the PIN Code it can determine the
Link Key using the same algorithm. Since the analyzer also needs the random number, the analyzer must catch
the entire Pairing Process or else it cannot generate the Link Key and decode the data.
Example:
If the ASCII character PIN Code is ABC and you choose to enter the ASCII characters, then select PIN Code
(ASCII) from the Encryption drop down list and enter ABC in the field below.
If you choose to enter the Hex equivalent of the ASCII character PIN Code ABC, then select PIN Code (Hex)
from the Encryption drop down list and enter 0x414243 in the field. Where 41 is the Hex equivalent of the
letter A, 42 is the Hex equivalent of the letter B, and 43 is the Hex equivalent of the letter C.
Note: When PIN Code (Hex) is selected from the Encryption drop down list, the 0x prefix is entered
automatically.
l
Third, if you know the Link Key in advance you may enter it directly. Select Link Key in the Encryption list and
then enter the Link Key in the edit box. If the link key is already in the database, the Link Key is automatically
entered in the edit box after the Master and Slave have been selected. You can also select a Master, Slave and
Link Key from the Device Database.
Note: When the devices are in the Secure Simple Pairing (SSP) Debug Mode, SSP is
automatically supported regardless of encryption configuration.
o
If any one of the Bluetooth devices is in SSP Debug Mode then the BPA 600 analyzer can automatically
figure out the Link Key, and you do not have to do anything.
o
If the Bluetooth devices do not allow Debug Mode activation, enter the Link Key as described above or
import the Link Key using the procedure in Programmatically Update Link Key from 3rd Party Software.
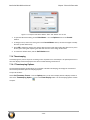
3.1.2.4.3 BPA 600 Devices Under Test- Dual Mode
Note: When selecting and using either "Dual Mode" or "Classic Only Multiple Connection" you
must connect both antennas (LE and Classic) to the ComProbe BPA 600 hardware.
- 30 -
Chapter 3 Configuration Settings
ComProbe BPA 600 User Manual
Figure 3.11 BPA 600 Devices Under Test - Dual Mode
Specifying the Bluetooth Device Address (BD_ADDR)
In Dual Mode, the analyzer needs to know the Bluetooth Device Address (BD_ADDR) for each device, but it does
not need to know which is master or slave for the Classic Bluetooth connection, ComProbe analyzser can figure
that out for you through roleless connection.
- 31 -
ComProbe BPA 600 User Manual
Chapter 3 Configuration Settings
1. You can manually select Select the Bluetooth
device address (BD_ADDR) form the Classic
Device: drop down list or from the Device
Database. You can also type in the address as a 12
digit hex number (6 octets). The "0x" is
automatically typed in by the control. Any devices
entered this way is added to the Device Database.
2. Specify the "BD_ADDR for the LE Device" by selecting "Sync with
Classic Devices Only". By doing this, the low energy device will
follow connections from or to the specified device, or from or to
the first Classic device that connects over LE.
Classic Encryption
Bluetooth devices can have their data encrypted when they communicate. Bluetooth devices on an encrypted link
share a common link key in order to exchange
encrypted data. How that link key is created depends
upon the pairing method used.
There are three encryption
options in the I/O Settings
dialog.
a. PIN Code (ASCII)
b. PIN Code (Hex)
c. Link Key
l
The first and second options use a PIN Code to
generate the Link Key. The devices generate link
Keys during the Pairing Process based on a PIN Code. The second Link Key generated from this process is also
based on a random number so the security cannot be compromised. If the analyzer is given the PIN Code it
can determine the Link Key using the same algorithm. Since the analyzer also needs the random number, the
analyzer must catch the entire Pairing Process or else it cannot generate the Link Key and decode the data.
Example:
If the ASCII character PIN Code is ABC and you choose to enter the ASCII characters, then select PIN Code
(ASCII) from the Encryption drop down list and enter ABC in the field below.
If you choose to enter the Hex equivalent of the ASCII character PIN Code ABC, then select PIN Code (Hex)
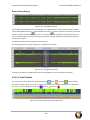
from the Encryption drop down list and enter 0x414243 in the field. Where 41 is the Hex equivalent of the
letter A, 42 is the Hex equivalent of the letter B, and 43 is the Hex equivalent of the letter C.
Note: When PIN Code (Hex) is selected from the Encryption drop down list, the 0x prefix is
entered automatically.
- 32 -
Chapter 3 Configuration Settings
l
ComProbe BPA 600 User Manual
Third, if you know the Link Key in advance you may enter it directly. Select Link Key in the Encryption list and
then enter the Link Key in the edit box. If the link key is already in the database, the Link Key is automatically
entered in the edit box after the Master and Slave have been selected. You can also pick Choose Pair from
Device Database to select a Master, Slave and Link Key from the Device Database.
1. Select an Encryption option.
2. Enter a value for the encryption.
The Current Link Key field displays the currently provided Link Key and the date and time the key was
provided. The status of the Link Key is displayed with the following icons:
Icon
Link Key Status
Valid
Not Valid
LE Encryption
1. Enter the New Long Term Key for the LE
Encryption.
The long term key is similar to the Link key in Classic.
It is a persistent key that is stored in both devices and
used to derive a fresh encryption key each time the
devices go encrypted.
Learn more about the Long Term Key.
The Long Term Key is similar to the Link key in
Classic; it is a persistent key that is stored in both
devices and used to derive a fresh encryption key
each time the devices go encrypted.
There are a few differences though:
In Classic the Link key is derived from inputs from both devices and is calculated in the same way
independently by both devices and then stored persistently. The link key itself is never transmitted over
the air during pairing.
In LE, the long term key is generated solely on the slave device and then, during pairing, is distributed to a
master device that wants to establish an encrypted connection to that slave in the future. Thus the long
term key is transmitted over the air, albeit encrypted with a one-time key derived during the pairing
process and discarded afterwards (the so called short term key).
Unlike the link key, this long term key is directional, i.e. it is only used to for connections from the master
to the slave (referring to the roles of the devices during the pairing process). If the devices also want to
connect the other way round in the future, the device in the master role (during the pairing process) also
needs to send its own long term key to the device in the slave role during the pairing process (also
encrypted with the short term key of course), so that the device which was in the slave during the pairing
- 33 -
ComProbe BPA 600 User Manual
Chapter 3 Configuration Settings
process can be a master in the future and connect to the device which was master during the pairing
process (but then would be in a slave role).
Since most simple LE devices are only ever slave and never master at all, the second long term key
exchange is optional during the pairing process.
Note: If you use Copy/Paste to insert the Long Term Key , Frontline will auto correct (remove
invalid white spaces) to correctly format the key.
2. Enter a PIN or out-of-band (OOB) value for Pairing.
This optional information offers alternative pairing methods.
One of two pieces of data allow alternative pairing:
1. PIN is a six-digit (or less if leading zeros are omitted) decimal number.
2. Out-of-Band (OOB) data is a 16-digit hexadecimal code which the devices exchange via a
channel that is different than the le transmission itself. This channel is called OOB.
For off-the-shelf devices we cannot sniff OOB data, but in the lab you may have access to
the data exchanged through this channel.
3.1.2.4.4 BPA 600 Devices Under Test - Classic Only Multiple Connection
Note: When selecting and using either Dual Mode or Classic Only Multiple Connection you
must connect both antennas (LE and Classic) to the ComProbe BPA 600 hardware.
- 34 -
Chapter 3 Configuration Settings
ComProbe BPA 600 User Manual
Figure 3.12 BPA 600 Devices Under Test - Classic Only Multiple Connections
Specifying the Bluetooth Device Address (BD_ADDR)
Multiple connection refers to connecting one master with two slave Bluetooth devices. The analyzer needs to
know the Bluetooth Device Address (BD_ADDR) for the Slaves and the Master. The analyzer needs to know the
Bluetooth Device Address (BD_ADDR) for each device, but it does not need to know which is master or slave as
the ComProbe analyzer can figure that out for you through roleless connection. You can also manually specify the
Bluetooth Device Address.
- 35 -
ComProbe BPA 600 User Manual
Chapter 3 Configuration Settings
Select the Bluetooth device address (BD_ADDR) form the Classic Device: drop down list or from the Device
Database. You can also type in the address as a 12 digit hex number (6 octets). The "0x" is automatically typed in by
the control. Any devices entered this way is added to the Device Database.
Using the Device drop down list, elect the Bluetooth Device
Address (BD_ADDR) : from a list of available devices from the
Device Database. You can also type in the address as a 12 digit hex
number (6 octets). The "0x" is automatically typed in by the control.
Any devices entered this way is added to the Device Database.
Classic Encryption
Bluetooth devices can have their data encrypted when they
communicate. Bluetooth devices on an encrypted link share a
common link key in order to exchange encrypted data. How that
link key is created depends upon the pairing method
used.
There are three encryption options in the I/O Settings
dialog.
a. PIN Code (ASCII)
b. PIN Code (Hex)
c. Link Key
You are able to switch between these methods in the I/O
Settings window. When you select a method, a note
appears at the bottom of the dialog reminding you what
you need to do to successfully complete the dialog.
l
The first and second options use a PIN Code to generate the Link Key. The
devices generate link Keys during the Pairing Process based on a PIN Code. The
Link Key generated from this process is also based on a random number so the
security cannot be compromised. If the analyzer is given the PIN Code it can
determine the Link Key using the same algorithm. Since the analyzer also needs
the random number, the analyzer must catch the entire Pairing Process or else
it cannot generate the Link Key and decode the data.
Example:
If the ASCII character PIN Code is ABC and you choose to enter the ASCII characters, then select PIN Code
(ASCII) from the Encryption drop down list and enter ABC in the field below.
If you choose to enter the Hex equivalent of the ASCII character PIN Code ABC, then select PIN Code (Hex)
from the Encryption drop down list and enter 0x414243 in the field. Where 41 is the Hex equivalent of the
letter A, 42 is the Hex equivalent of the letter B, and 43 is the Hex equivalent of the letter C.
Note: When PIN Code (Hex) is selected from the Encryption drop down list, the 0x prefix is
entered automatically.
l
Third, if you know the Link Key in advance you may enter it directly. Select Link Key in the Encryption list and
then enter the Link Key in the edit box. If the link key is already in the database, the Link Key is automatically
- 36 -
Chapter 3 Configuration Settings
ComProbe BPA 600 User Manual
entered in the edit box after the Master and Slave have been selected. You can also select a Master, Slave and
Link Key from the Device Database.
Note: When the devices are in the Secure Simple Pairing (SSP) Debug Mode, SSP is
automatically supported regardless of encryption configuration.
o
If any one of the Bluetooth devices is in SSP Debug Mode then the BPA 600 analyzer can automatically
figure out the Link Key, and you do not have to do anything.
o
If the Bluetooth devices do not allow Debug Mode activation, enter the Link Key as described above or
import the Link Key using the procedure in Programmatically Update Link Key from 3rd Party Software.
1. Select an Encryption option.
2. Enter a value for the encryption.
The Current Link Key field displays the currently provided Link Key and the date and time the key was
provided. The status of the Link Key is displayed with the following icons:
Icon
Link Key Status
Valid
Not Valid
3.1.2.4.5 SSP Debug Mode
Bluetooth Core Version 2.1 and later specifications require Bluetooth compliant chip manufactures to include
Secure Simple Pairing (SSP) Debug Mode in the Host Controller. Debug Mode allows developers to debug and
analyze data without exposing any information that is intended to be kept secret. SSP Debug Mode uses a different
Link Key for encryption than is used during normal Bluetooth device operation. Debug Mode is activated in the
Host Controller to allow for data analysis. Once the analysis is complete Debug Mode can be switched off.
While Bluetooth device 2.1 compliance applies to chip manufacturers, device manufacturers do not have the
same obligation to support SSP Debug Mode therefore some devices may not have this feature enabled.
Debug Mode enables interoperability testing and analysis at all development stages, decreasing time to market.
3.1.2.4.6 Programmatically Update Link Key from 3rd Party Software
Now the BPA 600 protocol analyzer user can update the link keys for either of the classic links using a very
common Windows message WM_COPYDATA. The mechanism is to send a WM_COPYDATA message to the BPA
600 datasource.
The best scenario for doing this is when the devices are doing SSP and they are NOT in debug mode. The following
is a snippet of code that gives an example of programmatically sending link key to the ComProbe Protocol Analysis
System software. In order to do this the user needs to know both addresses of the devices in the link for which
they wish to update the link key. Also, the Datasource expects the master and slave addresses in LSB to MSB
format.
If the link key is sent to ComProbe software after encryption has been turned on over the air, ComProbe software
will flag an error on the Start Encryption packet. Depending on when the link key has been sent down, ComProbe
- 37 -
ComProbe BPA 600 User Manual
Chapter 3 Configuration Settings
software may however still be able to sniff the link successfully. In order to guarantee that ComProbe software is
able to sniff the link the link key should be sent to ComProbe software as soon as it is available and before
encryption has been turned on over the air.
Use the following code for BPA 600:
#define HCI_LINK_KEY 1000
HWND nHandle = ::FindWindow(NULL,"BPA 600 datasource");
if(nHandle != 0)
{
COPYDATASTRUCT ds;
enum
{
EncryptionKeySize = 16,
sizeAddressDevice = 6
};
BYTE abytAddressDevice1[sizeAddressDevice] = { 0x12, 0x34, 0x56, 0x78, 0x9a, 0xbc }; //LSB>MSB
BYTE abytAddressDevice2[sizeAddressDevice] = { 0x21, 0x43, 0x65, 0x87, 0xa9, 0xcb };
BYTE abytLinkKey[EncryptionKeySize] = { 0xff, 0xff, 0xff, 0xff, 0xff, 0xff, 0xff, 0xff, 0xff, 0xff,
0xff, 0xff, 0xff, 0xff, 0xff, 0xff };
ds.cbData = sizeAddressDevice + sizeAddressDevice + EncryptionKeySize;
ds.dwData = HCI_LINK_KEY;
BYTE bytData[sizeAddressDevice + sizeAddressDevice + EncryptionKeySize];
memcpy(&bytData,&abytAddressDevice1,sizeAddressDevice);
memcpy(&bytData[sizeAddressDevice],&abytAddressDevice2,sizeAddressDevice);
memcpy(&bytData
[sizeAddressDevice+sizeAddressDevice],&abytLinkKey,EncryptionKeySize);
ds.lpData = &bytData;
::SendMessage(nHandle, WM_COPYDATA, (WPARAM)GetSafeHwnd(), (LPARAM)&ds);
}
3.1.2.5 BPA 600 Device Database
The Device Database contains information about all the Classic Bluetooth® and Bluetooth low energy devices that
have been discovered or entered by the user.
BPA 600 Datasource Device Database Tab
- 38 -
Chapter 3 Configuration Settings
ComProbe BPA 600 User Manual
The Device Database is automatically updated when you perform certain operation such as entering encryption
information from the Devices Under Test dialog.
l
When you select Discover Device
on the toolbar, BPA 600 analyzer lists all the discoverable Bluetooth®
devices.
l
When you select a device from the list, then click Select, the information is transferred to the Devices
Under Test dialog.
l
You can delete records one at a time by selecting the record, then selecting Delete.
l
You can also delete all the records by selecting Delete All.
l
The Help opens this help topic.
In the Device Database table the following columns appear.
Column
Table 3.13 - BPA 600 Datasource Device Database Fields
Description
BD_ADDR
The address of the Bluetooth device
Friendly Name
If available the friendly name of the device
Services
An attribute of the Class of Device (COD) such as Networking, Rendering,
Audio, etc. Data provided from devices supporting Extended Inquiry Response
(EIR).during discovery. Service Class identifies a particular type of
service/functionality provided by the device. Multiple services can occur. If the
device does not support EIR the field will be empty.
Class of Device
A particular type of device such as phone, laptop, wearable, etc. Data provided
from devices supporting Extended Inquiry Response (EIR).during discovery.
COD is a value which identifies a particular type of functionality provided by the
device. For example, there would be a Service Class to identify a printer, and
another Service Class to identify a stereo headset. If the device does not
support EIR the field will be empty.
Service/COD
Universally Unique Identifier (UUID) of the Services and COD. 128 bits, shown
in hexadecimal format. If the device does not support EIR the field will be
empty.
Paired BD_ADDR
The address of the Bluetooth device this device is paired with.
Paired Friendly Name
The friendly name of the device this device is paired with.
Link Key
The Link Key in Classic Bluetooth or the Long Term Key (LTK) in Bluetooth low
energy used for encrypted data sent between paired devices.
Last Updated
The date the device was entered into the database.
3.1.2.6 BPA 600 low enegy Device Database
The LE Device Database contains information about Bluetooth® low energy devices that have been discovered
or entered by the user. These devices are also listed in the Device Database, but this dataabase list contains
additional information specific only to Bluetooth low energy technology.
- 39 -
ComProbe BPA 600 User Manual
Chapter 3 Configuration Settings
Figure 3.1 - BPA 600 Datasource LE Device Database Tab
The LE Device Database is automatically updated when you perform certain operation such as entering
encryption information from the Devices Under Test dialog.
When you select Discover Device
on the toolbar, BPA 600 analyzer adds to the lists any new discovered
Bluetooth low energy devices. The list is cumulative and will contain all Bluetooth low energy devices previously
add to the list.
Device Control Menu
Right-clicking anywhere in the
device list will display the device
control menu that will Select,
Delete, or Add a device.. Clicking
on one of these menu items will
perform the following actions.
LE Device Database Control Menu
Menu
Item
Action
Select Will place this device into the LE Device field in the LE Only or Dual Mode options of the Device
Under Test tab. The device must be selected/highlighted in the list prior to making this menu
selection. If multiple devices have been selected/highlighted in the list, the first device in the list is
placed in the Device Under Test.
Delete Will deleted the selected/highlighted device from the database. Selecting/highlighting multiple
devices in the list will delete all of those devices.
Add
Used for manual entry of a device into the database. A new device entry will append to the end of
the device list. To enter data double click on the field and type in the data. For the BD_Addr Type
field, double click and tab to select available types. See the following image.
Figure 3.2 - Add Menu Option Fields Display
Editing a Device
Any device entry can be edited by double-clicking in the field. An edit box will open and new device information
can be typed in.
- 40 -
Chapter 3 Configuration Settings
ComProbe BPA 600 User Manual
Figure 3.3 - Editing IRK Field
When editing the BD_Addr Type field "<Tab to toggle>" appears. Press the keyboard Tab key until your selected
device address type appears.
LE Device Database Fields
In the LE Device Database table the following columns appear.
Column
Table 3.14 - BPA 600 Datasource LE Device Database Fields
Description
BD_Addr
The address of the Bluetooth low energy device
BD_Addr Type
May be either "Public" or "Random". "Public"addresses are set to BD_Addr.
"Random" is either a 'static" or "private" address. "Static" address is a 48 bit
randomly generated address. "Private" address is a 48 bit "non-resolvable"
address or "resolvable' address. A "resolvable" address is generated using
an IRK.
Identity Resolving Key
(IRK)
Will appear when BD_Addr Type is Random, Private, and Resolvable. A
host device with a list of IRKs can search the list to identify a peer device
that has previously authenticated with the host. This field can be used to
identify Bluetooth low energy devices that have previously authenticated.
Nickname
A user-added name for the device, often used to make device identification
easier during the analysis. Can be any alpha-numeric string.
3.1.2.7 BPA 600 - Information
The BPA 600 Information dialog is one of the four tabs that appear when you first start ComProbe BPA 600
analyzer.
Figure 3.15 BPA 600 Information Tab
You can also access these tabs by selecting I/O Settings or Hardware Settings from the Options menu on the
Control window toolbar.
There are several pieces of information on this display:
- 41 -
ComProbe BPA 600 User Manual
l
l
l
Chapter 3 Configuration Settings
Displayed in the text window is the serial number of the connected BPA 600 devices. To update the device list
click Refresh Device List.
If you want to load the latest ComProbe BPA 600 hardware firmware, you select the Update Firmware
button..
The current firmware is displayed under Firmware Version.
3.1.2.8 BPA 600 Advanced Classic Settings
The Advanced Classic Settings dialog contains additional options for synchronizing the analyzer with the link to
capture data.
Figure 3.16 BPA 600 Advanced Classic Settings
1. ComProbe
Some packet types can be so numerous that they may make it more difficult to locate data packets in the
Frame Display window. You have several options to exclude certain types of packets.
l
Filter out ID packets - When this is checked, all ID packets are filtered out.
l
Filter out Nulls and Polls - When this is checked, Nulls and Polls packets are filtered out.
l
Filter out SCO/eSCO - When this is checked, SCO/eSCO packets are filtered out.
- 42 -
Chapter 3 Configuration Settings
l
l
l
ComProbe BPA 600 User Manual
Prioritized Decryption can be selected if you are having trouble establishing the correct decryption.
This option adjusts the data capture to give priority to establishing the proper decryption over receiving
frames. If you select this option, some frames may be dropped, but establishing the decryption key will
be more efficient.
Sniffer Diagnostics - When this is checked, some diagnostic data from the ComProbe are captured
and stored in the .cfa file. This is useful when a .cfa file is sent to Frontline for analysis and diagnosis.
Technical Support may ask you to check this option when you are experiencing issues with BPA 600.
Single Link Filtering - When this is checked, only packets from the specific Master and Slave
selected in Devices Under Test are displayed. Data from other devices that may be connected to the
Master will be filtered out.
2. Frame Slicing Settings
l
Frame Slicing Settings allows you to enter the size of the largest frame allowed to pass the analyzer
without having any bytes removed. The second field tells the analyzer the number of bytes you would
like to capture if the frame is larger than the allowable value indicated in the first field.
3. Channel Map
l
l
Clear on Resync -used to clear the map each time a re-synchronization occurs
Send with Data - allows you to send a map each time data is sent instead of just sending a map when
changes occur.
4. Other Features
l
Directed Classic Connection - Applies to Classic Only Multiple Connections
The default configuration for Classic Only Multiple Connections is one master and two slaves. The
Directed Classic Connection allows for simultaneous sniffing of up to three masters and three
slaves in any combination. For example you can have one master with one slave along with a second
master with two slaves, or three one-master one-slave connections.
1. Click to place a check in the Directed Classic Connection check box.
2. Click OK. The Advance Classic Settings dialog will close.
3. In the Devices Under Test tab click on Classic Only Single Connection.
4. In the Classic Device drop-down lists
select the address of the devices to be in
your first link. Then right-click anywhere in
the dialog. A link selector pop-up will
appear. Click on Save to Link #1. The popup will close.
5. Repeat the link selection process for each
additional link.
- 43 -
ComProbe BPA 600 User Manual
Chapter 3 Configuration Settings
6. To review your saved links right-click and
select View Directed Connecctions. All
of your selections will appear in the
Directed Connections pop-up window.
7. Click on OK to close the pop-up.
8. Selecting the Classic Only Multiple
Connections will display the same
information.
9. To reset the Classic Only Multiple
Connections to its default mode, select
any other datasource configuration radio
button and click on the Advanced button.
Click on the Dircted Classic Connection
check box to remove the check. Click on
OK. The Classic Only Multiple
Connections dialog will return to its
default one master two slave configuration.
- 44 -
Chapter 3 Configuration Settings
ComProbe BPA 600 User Manual
Figure 3.17 Classic Only Multiple Connections in Directed Classic Connections configuration
3.2 Decoder Parameters
Some protocol decoders have user-defined parameters. These are protocols where some information cannot be
discovered by looking at the data and must be entered by the user in order for the decoder to correctly decode
the data. For example, such information might be a field where the length is either 3 or 4 bytes, and which length
is being used is a system option.
There may be times when the context for decoding a frame is missing. For example, if the analyzer captures a
response frame but does not capture the command frame, then the decode for the response may be incomplete.
The Set Initial Decoder Parameters window allows you to supply the context for any frame. The dialog allows
you to define any number of parameters and save them in a template for later use
The decoder template function provides the capacity to create multiple templates that contain different
parameters. This capability allows you to maintain individual templates for each Bluetooth® network monitored.
Applying a template containing only those parameters necessary to decode transmissions particular to an
individual network, enhances the efficiency of the analyzer to decode data.
- 45 -
ComProbe BPA 600 User Manual
Chapter 3 Configuration Settings
If you have decoders loaded which require decoder parameters, a window with one tab for every decoder that
requires parameters appears the first time the decoder is loaded.
For help on setting the parameters, click the Help button on each tab to get help information specific to that
decoder.
If you need to change the parameters later,
l
Choose Set Initial Decoder Parameters... from the Options menu on the Control and Frame Display
windows.
Figure 3.4 - Select Set Initial Decoder Parameters... from Control window
The Set Initial Decoder Parameters window opens with a tab for each decoder that requires parameters.
Figure 3.5 - Tabs for each decoder requiring parameters.
l
Each entry in the Set Initial Decoder Parameters window takes effect from the beginning of the capture
onward or until redefined in the Set Subsequent Decoder Parameters dialog.
Override Existing Parameters
The Set Subsequent Decoder Parameters dialog allows the user to override an existing parameter at any
frame in the capture where the parameter is used.
If you have a parameter in effect and wish to change that parameter
l
Select the frame where the change should take effect
l
Select Set Subsequent Decoder Parameters... from the Options menu, and make the needed
changes. You can also right-click on the frame to select the same option.
- 46 -
Chapter 3 Configuration Settings
ComProbe BPA 600 User Manual
Figure 3.6 - Set Subsequent Decoder Parameters... from Control window
Figure 3.7 - Example: Set Subsequent Decode for Frame #52, RFCOMM
l
Each entry in the Set Subsequent Decoder Parameters dialog takes effect from the specified frame
onward or until redefined in this dialog on a later frame.
l
The Remove Override button will remove the selected decode parameter override.
l
The Remove All button will remove all decoder overrides.
If you do not have decoders loaded that require parameters, the menu item does not appear and you don't need
to worry about this feature.
3.2.1 Decoder Parameter Templates
3.2.1.1 Select and Apply a Decoder Template
1. Select Set Initial Decoder Parameters... from the Options menu on the Control
the Frame Display
- 47 -
window or
ComProbe BPA 600 User Manual
Chapter 3 Configuration Settings
window.
2. Click the Open Template
icon in the toolbar and select the
desired template from the pop up list. The system displays the content
of the selected template in the Initial Connections list at the top of the
dialog
3. Click the OK button to apply the selected template and decoders'
settings and exit the Set Initial Decoder Parameters dialog.
3.2.1.2 Adding a New or Saving an Existing Template
Add a Template
A template is a collection of parameters required to completely decode communications between multiple
devices. This procedure adds a template to the system and saves it for later use:
1. Click the Save
button at the top of the Set Initial
Decoder Parameters dialog to display the Template
Manager dialog.
2. Enter a name for the new template and click OK.
The system saves the template and closes the Template
Manager dialog.
3. Click the OK button on the Set Initial Decoder Parameters
window to apply the template and close the dialog.
Save Changes to a Template
This procedure saves changes to parameters in an existing template.
1. After making changes to parameter settings in a user defined template, click the Save
button at the
top of the Set Initial Decoder Parameters window to display the Template Manager dialog.
2. Ensure that the name of the template is listed in the Name to Save Template As text box and click OK.
3. The system displays a dialog asking for confirmation of the change to the existing template. Click the Yes
button.
The system saves the parameter changes to the template and closes the Save As dialog.
4. Click the OK button on the Set Initial Decoder Parameters window to apply the template and close
the window.
3.2.1.3 Deleting a Template
1. After opening the Set Initial Decoder Parameters window click the Delete
The system displays the Template Manager dialog with a list of saved templates.
- 48 -
button in the toolbar.
Chapter 3 Configuration Settings
ComProbe BPA 600 User Manual
2. Select (click on and highlight) the template marked for deletion and click the Delete button.
The system removes the selected template from the list of saved templates.
3. Click the OK button to complete the deletion process and close the Delete dialog.
4. Click the OK button on the Set Initial Decoder Parameters window to apply the deletion and close
the dialog.
3.2.2 Selecting A2DP Decoder Parameters
Decoding SBC frames in the A2DP decoder can be slow if the analyzer decodes all the parts (the header, the scale
factor and the audio samples) of the frame. You can increase the decoding speed by decoding only the header
fields and disregarding other parts. You can select the detail-level of decoding using the Set Initial Decoder
Parameters window.
Note: By default the decoder decodes only the header fields of the frame.
1. Select Set Initial Decoder Parameters from the Options menu on the Control window or the Frame
Display window.
2. Click on the A2DP tab.
3. Choose the desired decoding method.
Figure 3.8 - A2DP Decoder Settings
4. Follow steps to save the template changes or to save a new template.
5. Click the OK button to apply the selection and exit the Set Initial Decoder Parameters window.
3.2.3 AVDTP Decoder Parameters
3.2.3.1 About AVDTP Decoder Parameters
Each entry in the Set Initial Decoder Parameters window takes effect from the beginning of the capture
onward or until redefined in the Set Subsequent Decoder Parameters window.
- 49 -
ComProbe BPA 600 User Manual
Chapter 3 Configuration Settings
Figure 3.9 - AVDTP parameters tab
The AVDTP tab requires the following user inputs to complete a parameter:
l
Piconet (Data Source (DS) No.) - When only one data source is employed, set this parameter to 0 (zero),
otherwise, set to the desired number of data sources.
l
Role - This identifies the role of the device initiating the frame (Master or Slave)
l
L2CAP Channel - The channel number 0 through 78.
o
l
L2CAP channel is Multiplexed - when checked indicates that L2CAP is multiplexed with upper layer
protocols.
AVDTP is carrying - Select the protocol that AVDTP traverses to from the following:
o
AVDTP Signaling
o
AVDTP Media
o
AVDTP Reporting
o
AVDTP Recovery
o
-Raw Data-
Adding, Deleting, and Saving AVDTP Parameters
1. From the Set Initial Decoder Parameters window, click on the AVDTP tab.
2. Set or select the AVDTP decoder parameters.
3. Click on the ADD button. The Intial Connection window displays the added parameters.
Figure 3.10 - Parameters Added to Decoder
4. To delete a parameter from the Initial Connections window, select the parameter and click on the
Delete button.
- 50 -
Chapter 3 Configuration Settings
ComProbe BPA 600 User Manual
5. Decoder parameters cannot be edited. The only way to change a parameter is to delete the original as
described above, and recreate the parameter with the changed settings and selections and then click on
the Add button.
6. AVDTP parameters are saved when the template is saved as described in Adding a New or Saving an
Existing Template on page 48Adding a New or Saving an Existing Template on page 48
3.2.3.2 AVDTP Missing Decode Information
The analyzer usually determines the protocol carried in an AVDTP payload by monitoring previous traffic.
However, when this fails to occur, the Missing Decoding Information Detected dialog appears and requests
that the user supply the missing information.
The following are the most common among the many possible reasons for a failure to determine the traversal:
l
The capture session started after transmission of the vital information.
l
The analyzer incorrectly received a frame with the traversal information.
l
The communication monitored takes place between two players with implicit information not included in the
transmission.
In any case, either view the AVDTP payload of this frame (and other frames with the same channel) as hex data, or
assist the analyzer by selecting a protocol using this dialog.
Note: You may use the rest of the analyzer without addressing this dialog. Additional information
gathered during the capture session may help you decide how to respond to the request for
decoding information.
If you are not sure of the payload carried by the subject frame, look at the raw data shown “data” in the Decoder
pane on the Frame Display. You may notice something that hints as to the profile in use.
In addition, look at some of the frames following the one in question. The data may not be recognizable to the
analyzer at the current point due to connection setup, but might be discovered later on in the capture.
Figure 3.11 - Look in Decoder pane for profile hints
- 51 -
ComProbe BPA 600 User Manual
Chapter 3 Configuration Settings
3.2.3.3 AVDTP Override Decode Information
The Set Subsequent Decoder Parameters dialog allows the user to override an existing parameter at any
frame in the capture where the parameter is used.
If you have a parameter in effect and wish to change that parameter:
1. Select the frame where the change should take effect.
2. Select Set Subsequent Decoder Parameters from the Options menu, or by selecting a frame in the
frame display and choosing from the right-click pop-up menu, and make the needed changes.
3. Select the rule you wish to modify from the list of rules.
4. Choose the protocol the selected item carries from the drop-down list, and click OK.
If you do not have any previously overridden parameters, you may set
parameters for the current frame and onwards by right-clicking the
desired frame and choosing Provide AVDTP Rules... from the
right-click pop-up menu.
If you have a parameter in effect and wish to change it, there are two
parameters that may be overridden for AVDTP: Change the
Selected Item to Carry, and if AVDTP Media is selected. the codec
type. Because there are times when vital AVDTP configuration
information may not be transferred over the air, we give users the
ability to choose between the four AVDTP channel types for each
L2CAP channel carrying AVDTP as well as codec type. We attempt to
make our best guess at codec information when it is not transferred
over the air, but we realize we may not always be correct. When we
make a guess for codec type, we specify it in the summary and decode
panes by following the codec with the phrase '(best guess by analyzer).
This is to let you know that this information was not obtained over the
air and that the user may wish to alter it by overriding AVDTP
parameters.
- 52 -
Chapter 3 Configuration Settings
ComProbe BPA 600 User Manual
Figure 3.12 - AVDTP Override of Frame Information, Item to Carry
Figure 3.13 - AVDTP Override of Frame Information, Media Codec Selection
Each entry in the Set Subsequent Decoder Parameters dialog takes effect from the specified frame onward
or until redefined in this dialog on a later frame. If you are unhappy with your changes, you can undo them by
simply choosing your override from the dialog box and pressing the 'Remove Override' button. After pressing
'OK,' the capture file will recompile as if your changes never existed, so feel free to experiment with desired
changes if you are unsure of what configuration to use.
Note: If the capture has no user defined overrides,
then the system displays a dialog stating that no user
defined overrides exist.
- 53 -
ComProbe BPA 600 User Manual
Chapter 3 Configuration Settings
3.2.4 L2CAP Decoder Parameters
3.2.4.1 About L2CAP Decoder Parameters
Each entry in the Set Initial Decoder Parameters dialog takes effect from the beginning of the capture onward or
until redefined in the Set Subsequent Decoder Parameters dialog.
Figure 3.14 - L2CAP Decoder parameters tab
The L2CAP Set Initial Decoder Parameters dialog requires the following user inputs to complete a
Parameter :
l
Stream - This identifies the role of the device initiating the frame (master or slave)
l
Channel ID - The channel number 0 through 78
l
l
Address - This is the physical connection values for the devices. Each link in the net will have an address. A
piconet can have up to seven links. The Frame Display can provide
address information.
Data Source (DS) No. -When only one data source is employed, set
this parameter to 0 (zero), otherwise, set to the desired data source
number.
Carries (PSM) - Select the protocol that L2CAP traverses to from the
following:
l
AMP Manager
l
AMP Test Manager
l
SDP
l
RFCOMM
l
TCS
l
LPMP
l
BNEP
l
HCRP Control
l
HCRP Data
l
HID
- 54 -
Chapter 3 Configuration Settings
l
AVCTP
l
AVDTP
l
CMTP
l
MCAP Control
l
IEEE P11073 20601
l
-Raw Data-
ComProbe BPA 600 User Manual
Adding, Deleting, and Saving L2CAP Parameters
1. From the Set Initial Decoder Parameters window, click on the L2CAP tab.
2. Set or select the L2CAP decoder parameters.
3. Click on the ADD button. The Intial Connection window displays the added parameters.
Figure 3.15 - Parameters Added to Decoder
4. To delete a parameter from the Initial Connections window, select the parameter and click on the
Delete button.
5. Decoder parameters cannot be edited. The only way to change a parameter is to delete the original as
described above, and recreate the parameter with the changed settings and selections and then click on
the Add button.
6. L2CAP parameters are saved when the template is saved. Adding a New or Saving an Existing Template
on page 48
3.2.4.2 L2CAP Override Decode Information
The Set Subsequent Decoder Parameters dialog allows the user to override an existing parameter at any
frame in the capture where the parameter is used.
If you have a parameter in effect and wish to change that parameter:
- 55 -
ComProbe BPA 600 User Manual
Chapter 3 Configuration Settings
1. Select the frame where the change should take effect
2. Select Set Subsequent Decoder Parameters from the
Options menu, or by selecting a frame in the frame display
and choosing from the right-click pop-up menu, and make the
needed changes. Refer to
3. Change the L2CAP parameter by selecting from the rule to
change, and click on the listed parameters.
4. If you wish to remove an overridden rule click on Remove
Override button. If you want to remove all decoder
parameter settings click on Remove All.
5. Click OK.
Each entry in the Set Subsequent Decoder Parameters dialog
takes effect from the specified frame onward or until redefined in
this dialog on a later frame.
Note: If the capture has no user defined overrides, then the
system displays a dialog stating that no user defined overrides
exist.
3.2.5 RFCOMM Decoder Parameters
3.2.5.1 About RFCOMM Decoder Parameters
Each entry in the Set Initial Decoder Parameters dialog takes effect from the beginning of the capture onward
or until redefined in the Set Subsequent Decoder Parameters dialog.
Figure 3.16 - RFCOMM parameters tab
The RFCOMM Set Initial Decoder Parameters tab requires the following user inputs to complete a
parameter:
l
Stream - Identifies the role of the device initiating the frame (master or slave)
l
Server Channel - The Bluetooth® channel number 0 through 78
l
DLCI - This is the Data Link Connection Identifier, and identifies the ongoing connection between a client and
a server
- 56 -
Chapter 3 Configuration Settings
l
l
ComProbe BPA 600 User Manual
Data Source (DS) No.- When only one data source is employed, set this parameter to 0 (zero), otherwise,
set to the desired data source
Carries (UUID) - Select from the list to apply the Universal Unique Identifier (UUID) of the application layer
that RFCOMM traverses to from the following:
o
OBEX
o
SPP
o
encap asyncPPP
o
Headset
o
FAX
o
Hands Free
o
SIM Access
o
VCP
o
UDI
o
-Raw Data-
Adding, Deleting, and Saving RFCOMMParameters
1. From the Set Initial Decoder Parameters window, click on the RFCOMMtab.
2. Set or select the RFCOMMdecoder parameters.
3. Click ont he ADD button. The Intial Connection window displays the added parameters.
Figure 3.17 - Parameters Added to Decoder
4. To delete a parameter from the Initial Connections window, select the parameter and click on the
Delete button.
5. Decoder parameters cannot be edited. The only way to change a parameter is to delete the original as
described above, and recreate the parameter with the changed settings and selections and then click on
the Add button.
6. RFCOMM parameters are saved when the template is saved as described in Adding a New or Saving an
Existing Template on page 48
3.2.5.2 RFCOMM Missing Decode Information
ComProbe software usually determines the protocol carried in an RFCOMM payload by monitoring previous
traffic. However, when this fails to occur, the Missing Decoding Information Detected dialog appears and
requests that the user supply the missing information.
The following are the most common among the many possible reasons for a failure to determine the traversal:
- 57 -
ComProbe BPA 600 User Manual
Chapter 3 Configuration Settings
l
The capture session started after transmission of the vital information
l
The analyzer incorrectly received a frame with the traversal information
l
The communication monitored takes place between two players with implicit information not included in the
transmission
In any case, either view the RFCOMM payload of this frame (and other frames with the same channel) as hex data,
or assist the analyzer by selecting a protocol using this dialog.
Note that you may use the rest of the analyzer without addressing this dialog. Additional information gathered
during the capture session may help you decide how to respond to the request for decoding information.
If you are not sure of the payload carried by the subject frame, look at the raw data shown under data in the
Decode pane in the Frame Display. You may notice something that hints as to the profile in use.
In addition, look at some of the frames following the one in question. The data may not be recognizable to the
analyzer at the current point due to connection setup, but might be discovered later on in the capture.
3.2.5.3 RFCOMM Override Decode Information
The Set Subsequent Decoder Parameters dialog allows the user to override an existing parameter at any
frame in the capture where the parameter is used.
If you have a parameter in effect and wish to change that parameter:
1. Select the frame where the change should take effect, and
select Set Subsequent Decoder Parameters from the
Options menu, or by selecting a frame in the frame display
and choosing from the right-click pop-up menu, and make
the needed changes.
2. Change the RFCOMM parameter by selecting from the
Change the Selected Item to Carry drop down list.
3. If you wish to remove an overridden rule click on Remove
Override button. If you want to remove all decoder
parameter settings click on Remove All.
4. Choose the protocol the selected item carries from the
drop-down list, and click OK.
Each entry in the Set Subsequent Decoder Parameters dialog
takes effect from the specified frame onward or until redefined in
this dialog on a later frame.
- 58 -
Chapter 3 Configuration Settings
ComProbe BPA 600 User Manual
Figure 3.18 - Set Subsequent Decoder Parameters selection list
Note: If the capture has no user defined overrides, then the system displays a dialog stating that
no user defined overrides exist.
3.3 Mesh Security
Bluetooth low energy mesh technology decryption requires a key or passphrase. This information must be
manually entered into the MeshOptions.ini file located in the system My Decoders folder. Refer to Changing
Default File Locations on page 287 for information on folder locations.
Open a text editor program, such as Windows Notepad, and make the following changes to the MeshOptions.ini
file.
For Smart Mesh,
Table 3.18 - Smart Mesh Keys Format
Name
Enter as
Description
Technology Identifier [SmartMesh]
IV Index
IV INDEX
2 bytes, hexadecimal
Application Key
APP KEY
16 bytes, hexadecimal
Network Key
NET KEY
16 bytes, hexadecimal
The following code is an example of Smart Mesh decryption key entry.
[SmartMesh]
IV INDEX = 0000
APP KEY = 00000000000000000000000000000001
NET KEY = 00000000000000000000000000000002
For CSRmesh,
Name
Enter as
CSRmesh Passphrase Format
Description
Technology
Identifier
[CSRMESH]
Passphrase
PASSPHRASE character string identical to the one used in CSRmesh
Android/iOS App
The following code is an example of CSRmesh decryption passphrase entry.
- 59 -
ComProbe BPA 600 User Manual
Chapter 3 Configuration Settings
[CSRMESH]
PASSPHRASE = test
Loading keys or passphrase
When the ComProbe software is initially loaded, keys or the
passphrase will be automatically read from the
MeshOptions.ini file. If the keys or the passphrase are
modified while the ComProbe software is running, decoders
must be reloaded and the companion files must be
recreated for the change to take effect. Follow these steps
to reload the decoders.
1. In the Frame Display, click on the Reload Decoders
icon
, or select Reload Decoders from the
File menu.
2. From the File menu, select Recreate Companion Files.
CSRmesh in BPA 600
BPA 600 will automatically capture any Bluetooth low energy Advertising packets. CSRmesh packets transmitted
over random Non Resolvable Private Address will be captured and displayed in the Frame Display.
CSRmesh over GATT
ATT maintains a database which maps handles & UUIDs. When there is a connection request the mappings will be
loaded to the initiator and/or advertiser sides of the database.
Phones can bypass pairing process for pre-paired devices. In this case, handle/UUID can be mapped by brute
force using ATT_Handle_UUID_PreLoad.ini file. This file is to be placed in the root of My Decoders Folder.
For additional information refer to Bluetooth low energy ATT Decoder Handle Mapping on page 301.
Troubleshooting Tips
CSRmesh
a. Incorrect Passphrase
l
l
When the passphrase entered in MeshOptions.ini is incorrect, most of the Mesh Transport Protocol
frames will contain Mesh Protocol Detected: Error.
The term “Most” is used because it excludes Mesh Association Protocol (MASP) packets. MASP packets
use a constant Passphrase of 0x00 || MASP.
- 60 -
Chapter 3 Configuration Settings
ComProbe BPA 600 User Manual
Figure 3.19 - CSRmesh Bad MAC
l
An error message will also be displayed, saying “MAC doesn’t match MASP or MCP”.
This error simply means that the generated MAC does not match the received MAC. This error will also
be generated in the case of a bad packet
b. Decryption Error
l
The error message associated with a decryption error will say "Decryption Error".
c. Payload Size
l
l
MTL payload<=9 bytes (MAC+TTL)
o
This error is implying that the Mesh Transport Layer (MTL or MTP) has a payload of less than 9
bytes.
o
Message Authentication Code (MAC) is 8 bytes and Time to live (TTL) is 1 byte.
HML payload is not available
o
l
This error indicates that MTP payload contains MAC and TTL but HLM payload is missing or is 0
bytes.
MCP data has no encrypted payload
o
This error indicates that the MCP payload contains the nonce (sequence number and source
address) but encrypted payload is missing from the packet.
Smart Mesh
a. "Reserved" Opcode
l
This is most likely the scenario when incorrect keys have been entered. Correct the keys in the
MeshOptions.ini file and reload decoders.
b. Decryption Error
l
Some of the possible decryption errors are:
o
Error in net decryption
o
Possible error in net decryption
o
Error in app decryption
o
Possible error in app decryption
- 61 -
ComProbe BPA 600 User Manual
Chapter 3 Configuration Settings
- 62 -
Chapter 4 Capturing and Analyzing Data
The following sections describe the various ComProbe software functions that capture and display data packets.
4.1 Capture Data
4.1.1 Air Sniffing: Positioning Devices
When capturing over the air packets, proper positioning of the ComProbe hardware and the Devices Under Test
(DUTs) will result in the best possible captures and will mitigate sources of path loss and interference. The
following procedures will help optimize the capture process especially if you are have problems obtaining reliable
…captures.
Problems with indoor radio propagation
Even in free space, it is well understood that radio frequencies attenuate over distance. The free-space rule-ofthumb dictates that radio energy decreases in strength by 20 dB by each 10-to-1 increase in range. In the realworld, the effects of objects in an outdoor environment cause reflection, diffraction, and scattering resulting in
greater signal losses. Indoors the situation can be worse. Reflections occur from walls and other large flat surfaces.
Diffraction occurs from objects with sharp edges. Scattering is produced from objects with rough surfaces and
from small objects. Also any object directly in the path of the radiation can present a hard or soft partition
depending on the partition's material properties. Path losses from partitions are difficult to estimate.
Estimating indoor propagation loss
1
One estimate of indoor path loss, based on path loss data from a typical building, provides a
2.4 GHz, the following relationship provides an approximate estimate of indoor path loss:
range
3.5
power rule. At
Indoor Path Loss (in dB) = 40 + 35Log 10(range, in meters)
This approximation is expected to have a variance of 13 dB.
Mitigating path loss and interference
Bluetooth device design contributes to mitigating environmental effects on propagation through spread spectrum
radio design, for example. However, careful planning of the testing environment can also contribute to reliable
data capture process.
- 63 -
ComProbe BPA 600 User Manual
Chapter 4 Capturing and Analyzing Data
The first step to ensuring reliable air-sniffing data capture is to understand the RF characteristics of the Devices
Under Test (DUTs). The Bluetooth Class, antenna types, and radiation patterns are all important factors that can
affect the placement of the DUTs and the ComProbe analyzer. Radiation patterns are rarely spherical, so
understanding your device's radiation patterns can greatly enhance successful data capture. Position devices to
avoid radiation attenuation by the surroundings.
This step is optional: Consider conductive testing to establish a baseline capture. Conductive testing isolates the
DUTs and analyzer from environmental effects.
The next step is to ensure that the testing environment is as clutter-free as possible.
l
l
l
Line-of-sight obstructions should be eliminated between the ComProbe hardware and the DUTs because they
cause a reduction in signal strength. Obstructions include, but are not limited to: water bottles, coffee cups,
computers, computer screens, computer speakers, and books. A clear, unobstructed line-of-sight is preferred
for DUT and ComProbe hardware positioning.
If using an analyzer connected to a computer, position the computer on an adjacent table or surface away
from the analyzer and DUTs, taking advantage of the cables' length. If this is not possible, position the
computer behind the analyzer as far away as possible. If using the ComProbe FTS4BT, which is a dongle, either
use an extension USB cable or position the computer such that the dongle is positioned towards the DUTs.
The preferred placement is positioning the DUTs and the ComProbe hardware at the points of an equilateral
triangle in the same horizontal plane, i.e. placed on the same table or work surface. The sides of the triangle
should be between 1 and 2 meters for Bluetooth transmitter classes 1 and 2. The distance for transmitter class
3 should be 1/2 meter.
Figure 4.1 - Devices Equally Spaced in the Same Horizontal Plane
Finally, eliminate other RF sources.
l
Wi-Fi interference should be minimized or eliminated. Bluetooth shares the same 2.4 GHz frequency bands as
Wi-Fi technology. Wi-Fi interference can cause loss of packets and poor captures. In a laboratory or testing
- 64 -
Chapter 4 Capturing and Analyzing Data
ComProbe BPA 600 User Manual
environment do not place the DUTs and ComProbe hardware in close proximity with Wi-Fi transmitting
sources such as laptops or routers. Turning off Wi-Fi on the computer running the ComProbe software is
recommended.
Positioning for audio capture
The Bluetooth Audio Expert System provides analysis of audio streams and can assist in identifying problems with
capture methods including positioning and environment because it will point out missing frames. For hands-free
profile data captures both DUTs send and receive data. Therefore, position the devices following the equilateral
triangle arrangement as mentioned above.
However, in A2DP data capture scenario, the equilateral positioning of devices is not optimum because, normally,
only one device is sending data to the other. It is recommended that the ComProbe hardware be positioned
closer to the device receiving data so that ComProbe better mimics the receiving DUT. Position the DUTs 1 -2
meters apart for Class 1 and 2 transmitters, and 1/2 meter apart for Class 3 transmitters.
Figure 4.2 - For Audio A2DP, Position Closer to SINK DUT
Poor Placement
A poor test configuration for the analyzer is placing the DUTs very close to each other and the analyzer far away.
The DUTs, being in close proximity to each other, reduce their transmission power and thus make it hard for the
analyzer to hear the conversation. If the analyzer is far away from DUTs, there are chances that the analyzer may
miss those frames, which could lead to failure in decryption of the data.
Obstacles in close proximity to or in between the analyzer and the DUTs can interfere and cause reduction in
signal strength or interference. Even small objects can cause signal scattering.
- 65 -
ComProbe BPA 600 User Manual
Chapter 4 Capturing and Analyzing Data
Figure 4.3 - Example: Poor Capture Environment
4.1.2 Capturing Data to Disk - General Procedure
Note: Capture is not available in Viewer mode.
1. Click the Start Capture button
to begin capturing to a file. This icon is located on the Control ,
Event Display, and Frame Display windows.
2. Files are placed in My Capture Files by default and have a .cfa extension. Choose Directories from the
Options menu on the Control window to change the default file location.
Note: For the Dashboard, when you capture to series of files, the window displays the data
from the beginning of the first capture, even when a new file in the series is created. This is
because the Dashboard is a "Session Monitor", which means that even if you capture to a
series of files, the data from the first file is always displayed. The display does not refresh
when a new capture file in a series is created.
3. Watch the status bar on the Control window to monitor how full the file is. When the file is full, it begins
to wrap, which means the oldest data will be overwritten by new data.
4. Click the Stop Capture icon
to temporarily stop data capture. Click the Start Capture icon again to
resume capture. Stopping capture means no data will be added to the capture file until capture is
resumed, but the previously captured data remains in the file.
5. To clear captured data, click the Clear icon
l
.
If you select Clear after selecting Stop Capture, a dialog appears asking whether you want to save
the data.
- 66 -
Chapter 4 Capturing and Analyzing Data
l
ComProbe BPA 600 User Manual
o
You can click Save File and enter a file name when prompted .
o
If you choose Do Not Save, all data will be cleared.
o
If you choose Cancel, the dialog closes with no changes.
If you select the Clear icon while a capture is occurring:
o
The capture stops.
o
A dialog appears asking if you want to save the capture
o
You can select Yes and save the capture or select No and close the dialog. In either case, the
existing capture file is cleared and a new capture file is started.
o
If you choose Cancel, the dialog closes with no changes.
To see how to capture to a single file, choose System Settings from the Options menu on the Control window.
When live capture stops, no new packets are sniffed but there can still be packets that were previously sniffed but
not yet read by the ComProbe analyzer. This happens when packets are being sniffed faster than the ComProbe
analyzer can process them. These packets are stored either on the ComProbe hardware itself or in a file on the
PC. If there are remaining packets to be processed when live capture stops the Transferring Packets dialog
below is displayed showing the packets yet to be read by the ComProbe analyzer. The dialog shows the name of
each ComProbe hardware device, its process id in square brackets, and the number of packets remaining. These
stored packets are read until they’re exhausted or the user clicks the Discard button on the dialog.
Unlike 802.11, Bluetooth packets never come in faster than the datasource can process them. However, Bluetooth
packets must still be stored so that they can be read in chronological order with the 802.11 packets.
Figure 4.4 - Packet Transfer Dialog
- 67 -
ComProbe BPA 600 User Manual
Chapter 4 Capturing and Analyzing Data
4.1.3 Capturing Data with BPA 600 Analyzer
So, now we have our ComProbe BPA 600 analyzer installed, devices under test turned on and identified in
BPA 600 datasource; it is time to sniff the communication between the devices and capture data.
Once you have completed the Devices Under Test selection, you are ready to capture data.
1. Select Start Sniffing on the Datasource dialog from the toolbar (Figure 4.5) .
Figure 4.5 - Start Sniffing from Datasource Toolbar.
2. Begin the pairing process between the devices (Only if you are using Classic or Classic/low energy. Low
energy by itself does not require that devices be paired.)
As data is being captured, the Capture Status message in the Control window indicates the synchronization
status of the ComProbe BPA 600 analyzer as well as the Master-Slave relationship. The colored arrows change
depending on the synchronization state and the direction of the arrow points from Master (arrow tail) to Slave
(arrow head). There are five states:
Table 4.1 - BPA 600 Roleless Arrows
Arrow
Description
Blue = synchronized with the Master clock - link active.
Green = running and waiting for Master to connect to the Slave. A double headed arrow means
that the master and slave have yet to be determined.
Red = initializing or halted. A double headed arrow means that the master and slave have yet
to be determined.
Yellow = waiting for the Master to resume transmission.
Gray = synchronized with the Master clock - link inactive.
- 68 -
Chapter 4 Capturing and Analyzing Data
ComProbe BPA 600 User Manual
When you are capturing data, there are several important concepts to consider.
l
l
l
Files are placed in My Capture Files by default and have a .cfa extension. Choose Directories from the Options
menu on the Control window to change the default file location.
Watch the status bar on the Control window to monitor how full the file is. When the file is full, it begins to
wrap , which means the oldest data will be overwritten by new data.
Click the Stop icon
to temporarily stop data capture. Click the Start Capture icon again to resume
capture. Stopping capture means no data will be added to the capture file until capture is resumed, but the
previously captured date remains in the file.
l
To clear captured data, click the Clear icon
l
If you select Clear after selecting Stop, a dialog appears asking whether you want to save the data.
l
.
o
You can click Save File and enter a file name when prompted .
o
If you choose Do Not Save, all data will be cleared.
o
If you choose Cancel, the dialog closes with no changes to the data.
If you select the Clear icon while a capture is occurring:
o
The capture stops.
o
A dialog appears asking if you want to save the capture
o
You can select Yes and save the capture or select No and close the dialog. In either case, the existing
capture file is cleared and a new capture file is started.
o
If you choose Cancel, the dialog closes with no changes to the data.
l
The link key/pin code can be changed while sniffing and the changes will be automatically saved in the
configuration file.
o
While the device is sniffing click in the Classic Encryption link key/pin code field. This action places
the focus on that window.
o
Change the link key/pin code.
o
The Status window at the bottom of the page will inform the user to move focus away from the link
key/pin code window.
o
Click the mouse outside the link key/pin code field or press the Tab key. This action will remove the
focus from the link key/pin code window.
o
The link key/pin code
changes are
automatically saved to
the configuration file.
4.1.3.1 BPA 600 Capture with ProbeSync
ProbeSync™ allows multiple ComProbe analyzers to work seamlessly together and to share a common clock.
Clock sharing allows the analyzers to precisely synchronize communications stream and to display resulting
- 69 -
ComProbe BPA 600 User Manual
Chapter 4 Capturing and Analyzing Data
packets in a single shared view.
If two ComProbe BPA 600 hardware are connected in a ProbeSync configuration, two to four links can be
synchronized. Four links result when each BPA 600 analyzer is configured for Classic Only Multiple Connections
with two links per BPA 600 device.
When configured for synchronization through ProbeSync one BPA 600 device provides the clock to the other
device. The clock is provided by a CAT 5 cable between the master BPA 600 OUT connector—sending the
synchronizing clock—to the BPA 600 hardware IN connector—receiving the clock.
When the BPA 600 software runs in ProbeSync one Control window opens with two BPA 600 datasource
windows, one for each connected device. Each device datasource is setup individually to sniff their respective
link. Should the hardware be connected incorrectly, that is IN to IN or OUT to OUT, an error message will
appear. Follow the instructions in error message. To continue click on the OK button. The BPA 600 datasource
Status window will also display a warning message suggesting information sources.
Figure 4.6 - Incorrect ProbeSync Hardware Connection Error
Figure 4.7 - Incorrect ProbeSync Hardware Connection Message In Datasource Status
In the device providing the clock, the BPA 600 datasource dialog the Start Sniffing
button initiates the
capture for both devices. On the device receiving the clock—cable connected to IN— the BPA 600 datasource
dialog Start Sniffing button is disabled when using ProbeSync. In the both device's status window in the BPA
600 Datasource dialog will announce the synchronizing function of each.
- 70 -
Chapter 4 Capturing and Analyzing Data
ComProbe BPA 600 User Manual
Figure 4.8 - BPA 600 ProbeSync Synchronizing Device Status Message
Figure 4.9 - BPA 600 ProbeSync Synchronized Device Status Message
Data captured in the synchronized device will appear in the Frame Display, Event Display, Bluetooth
Timeline, Bluetooth low energy Timeline, and Coexistence View. Data saved as a capture file will include
data captured on both devices. Within these dialogs the packets identified as link 1, 2, and 3 were captured on the
synchronizing device that provides the clock. Those packets captured on the synchronized device carry link 4, 5,
and 6 identifiers.
BPA 600 hardware can also be connected via ProbeSync to ComProbe 802.11 hardware, but the BPA 600 device
must be connected to provide the clock—the CAT5 cable connected to the BPA 600 OUT jack.
4.1.4 Combining BPA 600, 802.11, and HSU with ProbeSync
ProbeSync™ allows multiple ComProbe analyzers to work seamlessly together and to share a common clock.
Clock sharing allows the analyzers to precisely synchronize communications stream and to display resulting
packets in a single shared view.
The ComProbe BPA 600, ComProbe 802.11, and ComProbe HSU analyzers have ProbeSync capability allowing
timestamp synchronization of captured data. Synchronizing the clock for these ComProbe devices used in
combination requires attention to the sequence of hardware connection. It is important to remember the
following key points.
l
l
l
ComProbe devices are connected serially in a daisy-chain fashion. The combined length of all cables in the
chain cannot exceed 1.5 meters (4.5 ft.).
The "master" ComProbe device provides the clock to the other devices. All other ComProbe devices are
"slaves" and received the clock from the "master" device.
On ComProbe devices with an OUT and IN connector, the function of these connectors is dependent on if
they are a "master" or a "slave".
o
"master" device: OUT connector provides the clock to all "slave" devices. IN connector is not used.
o
"slave" device: IN connector receives the clock from the OUT connector of the prior device in the chain.
The OUT connector is just a pass-through connector on a "slave" device.
l
BPA 600 is always the "master" device and the first device in the chain, if being used.
l
HSU is always the last "slave" device in the chain, if being used.
l
HSU maximum capture data rate is 6 Mbit/sec.
Connecting ComProbe BPA 600, ComProbe 802.11, and ComProbe HSU devices in ProbeSync takes place in the
following steps.
- 71 -
ComProbe BPA 600 User Manual
Chapter 4 Capturing and Analyzing Data
1. Connect the ComProbe BPA 600 OUT connector to the ComProbe 802.11 IN connector.
2. Connect the ComProbe HSU Cat 5 cable to the ComProbe 802.11 OUT connector.
Each device datasource is setup individually to sniff their respective link. Should the hardware be connected
incorrectly, that is IN to IN or OUT to OUT, an error message will appear. Follow the instructions in error
message. To continue click on the OK button. The ComProbe device datasource Status window will also display a
warning message suggesting information sources.
Figure 4.10 - Incorrect ProbeSync Hardware Connection Error
Figure 4.11 - Incorrect ProbeSync Hardware Connection Message In Datasource Status
The BPA 600 datasource dialog Start Sniffing
button initiates the capture for all connected ComProbe
802.11 and HSU devices. On the 802.11 and HSU receiving the clock—cable connected to IN— the Start
Sniffing button is disabled when using ProbeSync. In each ComProbe device's Control window status window
will announce the synchronizing function.
- 72 -
Chapter 4 Capturing and Analyzing Data
ComProbe BPA 600 User Manual
Figure 4.12 - ProbeSync Synchronizing Device Status Message
Figure 4.13 - ProbeSync Synchronized Device Status Message
Data captured in the synchronized device will appear in the Frame Display, Event Display, Bluetooth
Timeline, Bluetooth low energy Timeline, and Coexistence View. Data saved as a capture file will include
data captured on each devices. Within these dialogs the packets identified as link 1, 2, and 3 were captured on the
synchronizing device that provides the clock. Those packets captured on the synchronized device carry link 4, 5,
and 6 identifiers.
4.1.5 Extended Inquiry Response
Extended Inquiry Response (EIR) is a tab that appears automatically on the Frame Display window when
you capture data.
Figure 4.14 - Frame Display Extended Inquire Response
EIR displays extensive information about the Bluetooth® devices that are discovered as data is being captured. EIR
provides more information during the inquiry procedure to allow better filtering of devices before connection;
and sniff subrating, which reduces the power consumption in low-power mode. Before the EIR tab was created,
- 73 -
ComProbe BPA 600 User Manual
Chapter 4 Capturing and Analyzing Data
this type of information was not available until a connection was made to a device. Therefore, EIR can be used to
determine whether a connection can/should be made to a device prior to making the connection.
Note: If a Bluetooth device does not support Extended Inquiry Response, the tab displays
Received Signal Strength Indication (RSSI) data, which is less extensive than EIR data.
4.2 Protocol Stacks
4.2.1 Protocol Stack Wizard
The Protocol Stack wizard is where you define the
protocol stack you want the analyzer to use when
decoding frames.
To start the wizard:
1. Choose Protocol Stack from the Options
menu on the Control window or click the
Protocol Stack icon
on the Frame
Display.
2. Select a protocol stack from the list, and click
Finish.
Most stacks are pre-defined here. If you have special
requirements and need to set up a custom stack, see
Creating and Removing a Custom Stack on page 75.
1. If you select a custom stack (i.e. one that was defined by a user and not included with the analyzer), the
Remove Selected Item From List button becomes active.
2. Click the Remove Selected Item From Listbutton to remove the stack from the list. You cannot
remove stacks provided with the analyzer. If you remove a custom stack, you need to define it again in
order to get it back.
If you are changing the protocol stack for a capture file, you may need to reframe. See Reframing on page 76 for
more information.
You cannot select a stack or change an existing one for a capture file loaded into the Capture File Viewer (the
Capture File Viewer is used only for viewing capture files and cannot capture data). Protocol Stack changes can
only be made from a live session.
- 74 -
Chapter 4 Capturing and Analyzing Data
ComProbe BPA 600 User Manual
4.2.2 Creating and Removing a Custom Stack
To create a custom stack:
1. Choose Protocol Stack from the
Options menu on the Control
window or click the Protocol Stack
icon
on the Frame Display
toolbar.
2. Select Build Your Own from the list
and click Next.
3. The system displays an information
screen that may help you decide if
you need to define your own custom
stack. Defining a custom stack means
that the analyzer uses the stack for
every frame. Frames that do not
conform to the stack are decoded
incorrectly. Click Next to continue.
Select Protocols
1. Select a protocol from the list on the
left.
2. Click the right arrow button to move it
to the Protocol Decode Stack box
on the right, or double-click the
protocol to move it to the right.
3. To remove a protocol from the stack,
double-click it or select it and click the
left arrow button.
4. If you need to change the order of the
protocols in the stack, select the
protocol you want to move, and click
on the Move Up and Move Down buttons until the protocol is in the correct position.
5. The lowest layer protocol is at the top of the list, with higher layer protocols listed underneath.
Auto-traversal (Have the analyzer Determine Higher Layers)
If you need to define just a few layers of the protocol stack, and the remaining layers can be determined based on
the lower layers:
1. Click the All additional stack layers can be determined automatically button.
2. If your protocol stack is complete and there are no additional layers, click the There are no additional
stack layers button.
- 75 -
ComProbe BPA 600 User Manual
Chapter 4 Capturing and Analyzing Data
3. If you select this option, the analyzer uses the stack you defined for every frame. Frames that do use this
stack are decoded incorrectly.
Save the Stack
1. Click the Add To Predefined List button.
2. Give the stack a name, and click Add.
In the future, the stack appears in the Protocol Stack List on the first screen of the Protocol Stack wizard.
Remove a Stack
1. Select it in the first screen and click Remove Selected Item From List.
2. If you remove the stack, you must to recreate it if you need to use it again.
Note: If you do not save your custom stack, it does appear in the predefined list, but applies to the
frames in the current session. However, it is discarded at the end of the session.
4.2.3 Reframing
If you need to change the protocol stack used to interpret a capture file and the framing is different in the new
stack, you need to reframe in order for the protocol decode to be correct. You can also use Reframe to frame
unframed data. The original capture file is not altered during this process.
Note: You cannot reframe from the Capture File Viewer (accessed by selecting Capture File
Viewer or Load Capture File to start the software and used only for viewing capture files).
To reframe your data, load your capture file, select a protocol stack, and then select Reframe from the File
menu on the Control window. Reframe is only available if the frame recognizer used to capture the data is
different from the current frame recognizer.
In addition to choosing to Reframe, you can also be prompted to Reframe by the Protocol Stack Wizard.
1. Load your capture file by choosing Open from the File menu on the Control window, and select the file
to load.
2. Select the protocol stack by choosing Protocol Stack from the Options menu on the Control window,
select the desired stack and click Finish.
3. If you selected a protocol stack that includes a frame recognizer different from the one used to capture
your data, the Protocol Stack Wizard asks you if you want to reframe your data. Choose Yes.
4. The analyzer adds frame markers to your data, puts the framed data into a new file, and opens the new
file. The original capture file is not altered.
See Unframing on page 76 for instructions on removing framing from data.
4.2.4 Unframing
This function removes start-of-frame and end-of-frame markers from your data. The original capture file is not
altered during this process. You cannot unframe from the Capture File Viewer (accessed by selecting Capture File
Viewer or Load Capture File to start the software and used only for viewing capture files).
- 76 -
Chapter 4 Capturing and Analyzing Data
ComProbe BPA 600 User Manual
To manually unframe your data:
1. Select Unframe from the File menu on the Control window. Unframe is only available if a protocol
stack was used to capture the data and there is currently no protocol stack selected.
In addition to choosing to Unframe, you can also be prompted to Unframe by the Protocol Stack Wizard.
1. Load your capture file by choosing Open from the File menu on the Control window.
2. Select the file to load.
3. Choose Protocol Stack from the Options menu on the Control window
4. Select None from the list
5. Click Finish. The Protocol Stack Wizard asks you if you want to unframe your data and put it into a new
file.
6. Choose Yes.
The system removes the frame markers from your data, puts the unframed data into a new file, and opens the
new file. The original capture file is not altered.
See Reframing on page 76 for instructions on framing unframed data.
4.2.5 How the Analyzer Auto-traverses the Protocol Stack
In the course of doing service discovery, devices ask for and receive a Protocol Descriptor List defining which
protocol stacks the device supports. It also includes information on which PSM to use in L2CAP, or the channel
number for RFCOMM, or the port number for TCP or UDP. The description below talks about how the analyzer
auto-traverses from L2CAP using a dynamically assigned PSM, but the principle is the same for RFCOMM channel
numbers and TCP/UDP port numbers.
The analyzer looks for SDP Service Attribute Responses or Service Search Attribute Responses carrying protocol
descriptor lists. If the analyzer sees L2CAP listed with a PSM, it stores the PSM and the UUID for the next protocol
in the list.
After the SDP session is over, the analyzer looks at the PSM in the L2CAP Connect frames that follow. If the PSM
matches one the analyzer has stored, the analyzer stores the source channel ID and destination channel ID, and
associates those channel IDs with the PSM and UUID for the next protocol. Thereafter, when the analyzer sees
L2CAP frames using those channel IDs, it can look them up in its table and know what the next protocol is.
In order for the analyzer to be able to auto-traverse using a dynamically assigned PSM, it has to have seen the SDP
session giving the Protocol Descriptor Lists, and the subsequent L2CAP connection using the PSM and identifying
the source and channel IDs. If the analyzer misses any of this process, it is not able to auto-traverse. It stops
decoding at the L2CAP layer.
For L2CAP frames carrying a known PSM (0x0001 for SDP, for example, or 0x0003 for RFCOMM), the analyzer
looks for Connect frames and stores the PSM along with the associated source and destination channel IDs. In this
case the analyzer does not need to see the SDP process, but does need to see the L2CAP connection process,
giving the source and destination channel IDs.
4.2.6 Providing Context For Decoding When Frame Information Is Missing
There may be times when you need to provide information to the analyzer because the context for decoding a
frame is missing. For example, if the analyzer captured a response frame, but did not capture the command frame
- 77 -
ComProbe BPA 600 User Manual
Chapter 4 Capturing and Analyzing Data
indicating the command.
The analyzer provides a way for you to supply the context for any frame, provided the decoder supports it. (The
decoder writer has to include support for this feature in the decoder, so not all decoders support it. Note that not
all decoders require this feature.)
If the decoder supports user-provided context, three items are active on the Options menu of the Control
window and the Frame Display window. These items are Set Initial Decoder Parameters, Automatically
Request Missing Decoding Information, and Set Subsequent Decoder Parameters. (These items are
not present if no decoder is loaded that supports this feature.)
Set Initial Decoder Parameters is used to provide required information to decoders that is not context
dependent but instead tends to be system options for the protocol.
Choose Set Initial Decoder Parameters in order to provide initial context to the analyzer for a decoder. A
dialog appears that shows the data for which you can provide information.
If you need to change this information for a particular frame :
1. Right-click on the frame in the Frame Display window
2. Choose Provide <context name>.
Alternatively, you can choose Set Subsequent Decoder Parameter from the Options menu.
3. This option brings up a dialog showing all the places where context data was overridden.
4. If you know that information is missing, you can't provide it, and you don't want to see dialogs asking for it,
un-check Automatically Request Missing Decoding Information.
5. When unchecked, the analyzer doesn't bother you with dialogs asking for frame information that you don't
have. In this situation, the analyzer decodes each frame until it cannot go further and then simply stop
decoding.
4.3 Analyzing Byte Level Data
4.3.1 Event Display
To open this window click the Event Display icon
on the Control window toolbar.
The Event Display window provides detailed information about every captured event. Events include data
bytes, data related information such as start-of-frame and end-of-frame flags, and the analyzer information, such
as when the data capture was paused. Data bytes are displayed in hex on the left side of the window, with the
corresponding ASCII character on the right.
- 78 -
Chapter 4 Capturing and Analyzing Data
ComProbe BPA 600 User Manual
Figure 4.2 Event Display
Click on an event to find out more about it. The three status lines at the bottom of the window are updated with
information such as the time the event occurred (for data bytes, the time the byte was captured), the value of the
byte in hex, decimal, octal, and binary, any errors associated with the byte, and more.
Events with errors are shown in red to make them easy to spot.
When capturing data live, the analyzer continually updates the Event Display as data is captured. Make sure the
Lock icon
is displayed on the toolbar to prevent the display from updating (Clicking on the icon again will
unlock the display). While locked, you can review your data, run searches, determine delta time intervals
between bytes, and check CRCs. To resume updating the display, click the Lock icon again.
You can have more than one Event Display open at a time. Click the Duplicate View icon
to create a
second, independent Event Display window. You can lock one copy of the Event Display and analyze your
data, while the second Event Display updates as new data is captured.
Event Display is synchronized with the Frame Display and Mesage Sequence Chart dialogs. Selecting a
byte in Event Display will also select the related frame in the Frame Display and the related message in the
Message Sequence Chart.
4.3.2 The Event Display Toolbar
Home – Brings the Control window to the front.
Home – Brings the Control window to the front.
Start Capture - Begins data capture to disk.
Stop Capture - Closes a capture file and stops data capture to disk.
- 79 -
ComProbe BPA 600 User Manual
Chapter 4 Capturing and Analyzing Data
Save - Prompts user for a file name. If the user supplies a name, a .cfa file is saved.
Clear- Discards the temporary file and clears the display.
MSC Chart - Opens the Message Sequence Chart
Lock - In the Lock state, the window is locked so you can review a portion of data. Data
capture continues in the background. Clicking on the Lock icon unlocks the window.
Unlock - In the Unlock state, the screen fills in the data captured since the screen lock and
moves down to display incoming data again. Clicking on the Unlock icon locks the window.
Duplicate View - Creates a second Event Display window identical to the first.
Frame Display - (framed data only) Brings up a Frame Display, with the frame of the currently
selected bytes highlighted.
Display Capture Notes - Brings up the Capture Notes window where you can view or add
notes to the capture file.
Add/Modify Bookmark - Add a new or modify an existing bookmark.
Display All Bookmarks - Shows all bookmarks and lets you move between bookmarks.
Find - Search for errors, string patterns, special events and more.
Go To - Opens the Go To dialog, where you can specify which event number to go to.
CRC - Change the algorithm and seed value used to calculate CRCs. To calculate a CRC,
select a byte range, and the CRC appears in the status lines at the bottom of the Event
Display.
Mixed Sides - (Serial data only) By default, the analyzer shows data with the DTE side above
the DCE side. This is called DTE over DCE format. DTE data has a white background and
DCE data has a gray background. The analyzer can also display data in mixed side format. In
this format, the analyzer does not separate DTE data from DCE data but shows all data on
the same line as it comes in. DTE data is still shown with a white background and DCE data
with a gray background so that you can distinguish between the two. The benefit of using this
format is that more data fits onto one screen.
Character Only - The analyzer shows both the number (hex, binary, etc.) data and the
character (ASCII, EBCDIC or BAUDOT) data on the same screen. If you do not wish to see
the hex characters, click on the Character Only button. Click again to go back to both number
and character mode.
Number Only - Controls whether the analyzer displays data in both character and number
format, or just number format. Click once to show only numeric values, and again to show
both character and numeric values.
- 80 -
Chapter 4 Capturing and Analyzing Data
ComProbe BPA 600 User Manual
All Events - Controls whether the analyzer shows all events in the window, or only data bytes.
Events include control signal changes and framing information.
Timestamping Options – Brings up the timestamping options window which has options for
customizing the display and capture of timestamps.
4.3.3 Opening Multiple Event Display Windows
Click the Duplicate View icon
from the Event Display toolbar to open a second Event Display window.
You can open as many Event Display windows as you like. Each Event Display is independent of the others
and can show different data, use a different radix or character set, or be frozen or live.
The Event Display windows are numbered in the title bar. If you have multiple Event Displays open, click on
the Event Display icon
on the Control window toolbar to show a list of all the Event Displays currently
open. Select a window from the list to bring it to the front.
4.3.4 Calculating CRCs or FCSs
The cyclic redundancy check (CRC) is a function on the Event Display window used to produce a checksum. The
frame check sequence (FCS) are the extra checksum characters added to a frame to detect errors.
1. Open the Event Display
window.
2. Click and drag to select the data for which you want to generate a CRC.
3. Click on the CRC icon
.
4. In the CRC dialog box, click on the down arrow to show the list
of choices for CRC algorithms..
5. Enter a Seed value in hexadecimal if desired.
6. Click OK to generate the CRC. It appears in the byte information
lines at the bottom of the Event Display window. Whenever you
select a range of data, a CRC is calculated automatically.
Calculating CRC for interwoven data
4.3.5 Calculating Delta Times and Data Rates
1. Click on the Event Display icon
on the Control window to open the Event Display window.
2. Use the mouse to select the data you want to calculate a delta time and rate for.
3. The Event Display window displays the delta time and the data rate in the status lines at the bottom of
the window.
- 81 -
ComProbe BPA 600 User Manual
Chapter 4 Capturing and Analyzing Data
Figure 4.3 Delta fields
4.3.6 Switching Between Live Update and Review Mode
The Event Display and Frame Display windows can update to display new data during live capture, or be
frozen to allow data analysis. By default, the Event Display continually updates with new data, and the Frame
Display is locked.
1. Make sure the Lock icon
2. Click the Unlock
is active so the display is locked and unable to scroll.
icon again to resume live update.
The analyzer continues to capture data in the background while the display is locked. Upon resuming live update,
the display updates with the latest data.
You can have more than one Event Display or Frame Display window open at a time. Click the Duplicate
View icon
to open additional Event or Frame Display windows. The lock/resume function is independent on
each window. This means that you can have two Event Display windows open simultaneously, and one window
can be locked while the other continues to update.
4.3.7 Data Formats and Symbols
4.3.7.1 Switching Between Viewing All Events and Viewing Data Events
By default, the analyzer on the Event Display dialog shows all events1 that include:
l
Data bytes
l
Start-of-frame
l
End-of-frame characters
l
Data Captured Was Paused.
1An event is anything that happens on the circuit or which affects data capture. Data bytes, control signal changes, and long
and short breaks are all events, as are I/O Settings changes and Data Capture Paused and Resumed.
- 82 -
Chapter 4 Capturing and Analyzing Data
Click on the Display All Events icon
ComProbe BPA 600 User Manual
to remove the non-data events. Click again to display all events.
See List of all Event Symbols on page 85 for a list of all the special events shown in the analyzer and what they
mean.
4.3.7.2 Switching Between Hex, Decimal, Octal or Binary
On the Event Display window the analyzer displays data in Hex by default. There are several ways to change the
radix1 used to display data.
Go to the Format menu and select the radix you want. A check mark next to the radix indicates which set is
currently being used.
Figure 4.15 - Format Menu
1. Right-click on the data display header labels and choose a different radix.
Figure 4.16 - Header labels, right click
2. Or right-click anywhere in the data display and select a different radix.
1The base of a number system. Binary is base 2, octal is base 8, decimal is base 10 and hexadecimal is base 16.
- 83 -
ComProbe BPA 600 User Manual
Chapter 4 Capturing and Analyzing Data
Figure 4.17 - Data display right click menu
If you want to see only the numerical values, click on the Numbers Only icon
on the Event Display
toolbar.
4.3.7.3 Switching Between ASCII, EBCDIC, and Baudot
On the Event Display window, the analyzer displays data in ASCII by default when you click on the Characters
Only icon
. There are several ways to change the character set used to display data.
1. Go to the Format menu and select the character set you want. A check mark next to the character set
indicates which set is currently being used.
2. With the data displayed in characters, right-click on the data panel header label to choose a different
character set.
If you want to see only characters, click on the Characters Only icon
on the Event Display toolbar.
4.3.7.4 Selecting Mixed Channel/Sides
If you want to get more data on the Event Display window, you can switch to mixed sides mode. This mode
puts all the data together on the same line. Data from one side (Slave ) is shown on a white background and data
from the other side ( Master )is shown on a gray background.
1. Click once on the Mixed Sides icon
to put the display in mixed sides mode.
2. Click again to return to side over side mode.
3. You can right click in the center of the data display window to change between mixed and side over side
modes by selecting Display Sides Together. A check mark is displayed. Click on Display Sides
Together to remove the check mark and return to side-by-side display.
4. Right click in the sides panel on the right of the data display and select Display Sides Together. A check
mark is displayed. Click on Display Sides Together to remove the check mark and return to side-byside display.
- 84 -
Chapter 4 Capturing and Analyzing Data
ComProbe BPA 600 User Manual
4.3.7.5 List of all Event Symbols
By default, the Event Display shows all eventsevents1, which includes control signal changes, start and end of
frame characters and flow control changes. If you want to see only the data bytes, click on the All Events button
. Click again to display all events.
Click on a symbol, and the analyzer displays the symbol name and sometimes additional information in the status
lines at the bottom of the Event Display window. For example, clicking on a control signal change symbol
displays which signal(s) changed.
In addition to data bytes, the events shown are (in alphabetical order):
Table 4.4 - Event Symbols
Symbol
Event
Abort
Broken Frame - The frame did not end when the analyzer expected it to. This occurs most often
with protocols where the framing is indicated by a specific character, control signal change, or
other data related event.
Buffer Overflow - Indicates a buffer overflow error. A buffer overflow always causes a broken
frame.
Control Signal Change - One or more control signals changed state. Click on the symbol, and
the analyzer displays which signal(s) changed at the bottom of the Event Display window.
Data Capture Paused - The Pause icon was clicked, pausing data capture. No data is recorded
while capture is paused.
Data Capture Resumed - The Pause icon was clicked again, resuming data capture.
Dropped Frames - Some number of frames were lost. Click on the symbol, and the analyzer
displays many frames were lost at the bottom of the Event Display window.
End of Frame - Marks the end of a frame.
Flow Control Active - An event occurred which caused flow control to become active (i.e.
caused the analyzer to stop transmitting data) Events which activate flow control are signal
changes or the receipt of an XON character.
Flow Control Inactive - An event occurred which caused flow control to become inactive (i.e.
caused the analyzer to transmit data). Events which deactivate flow control are signal changes
or the receipt of an XOFF character.
Frame Recognizer Change - A lowest layer protocol was selected or removed here, causing the
frame recognizer to be turned off or on.
I/O Settings Change - A change was made in the I/O Settings window which altered the baud,
parity, or other circuit setting.
1An event is anything that happens on the circuit or which affects data capture. Data bytes, control signal changes, and long
and short breaks are all events, as are I/O Settings changes and Data Capture Paused and Resumed.
- 85 -
ComProbe BPA 600 User Manual
Chapter 4 Capturing and Analyzing Data
Table 4.4 - Event Symbols (continued)
Symbol
Event
Long Break
Low Power - The battery in the ComProbe® is low.
Short Break
SPY Event (SPY Mode only) - SPY events are commands sent by the application being spied on
to the UART.
Start of Frame - Marks the start of a frame.
Begin Sync Character Strip
End Sync Character Strip
Sync Dropped
Sync Found
Sync Hunt Entered
Sync Lost
Test Device Stopped Responding - The analyzer lost contact with the ComProbe for some
reason, often because there is no power to the ComProbe.
Test Device Began Responding - The analyzer regained contact with the ComProbe.
Timestamping Disabled - Timestamping was turned off. Events following this event are not
timestamped. Timestamping Enabled - Timestamping was turned on. Events following this event have
timestamps.
Truncated Frame- A frame that is not the same size as indicated within its protocol.
Underrun Error
Unknown Event
4.3.7.6 Font Size
The font size can be changed on several Event Display windows. Changing the font size on one window does not
affect the font size on any other window.
To change the font size:
- 86 -
Chapter 4 Capturing and Analyzing Data
ComProbe BPA 600 User Manual
1. Click on Event Display menu Options, and select Change the Font Size.
Figure 4.18 - Event Display Options menu
2. Choose a font size from the list.
Figure 4.19 - Event Display Font Size Selection
3. Click OK.
4.4 Analyzing Protocol Decodes
4.4.1 Frame Display Window
To open this window
Click the Frame Display icon
on the Control window toolbar, or select Frame Display from the View
menu.
- 87 -
ComProbe BPA 600 User Manual
Chapter 4 Capturing and Analyzing Data
Figure 4.20 - Frame Display with all panes active
Frame Display Panes
The Frame Display window is used to view all frame related information. It is composed of a number of
different sections or "panes", where each pane shows a different type of information about a frame.
l
Summary Pane - The Summary Pane displays a one line summary of each frame for every protocol found in
the data, and can be sorted by field for every protocol. Click here for an explanation of the symbols next to the
frame numbers.
- 88 -
Chapter 4 Capturing and Analyzing Data
l
l
l
l
l
ComProbe BPA 600 User Manual
Decode Pane - The Decode Pane displays a detailed decode of the highlighted frame. Fields selected in the
Decode Pane have the appropriate bit(s) or byte(s) selected in the Radix, Binary, Character , and Event
panes
Radix Pane - The Radix Pane displays the logical data bytes in the selected frame in either hexadecimal,
decimal or octal.
Binary Pane - The Binary Pane displays a binary representation of the logical data bytes.
Character Pane - The Character Pane displays the character representation of the logical data bytes in either
ASCII, EBCDIC or Baudot.
Event Pane - The Event Pane displays the physical data bytes in the frame, as received on the network.
By default, all panes except the Event Pane are displayed when the Frame Display is first opened.
Protocol Tabs
Protocol filter tabs are displayed in the Frame Display above the Summary pane.
l
l
l
l
These tabs are arranged in separate colorcoded groups. These groups and their
colors are General (white), Classic Bluetooth
(blue), Bluetooth low energy (green),
802.11 (orange), USB (purple), NFC (brown)
and SD (teal). The General group applies to
all technologies. The other groups are
technology-specific.
Clicking on a protocol filter tab in the General group filters in all packets containing that protocol regardless of
each packet’s technology.
Clicking on a protocol filter tab in a technology-specific group filters in all packets containing that protocol on
that technology.
A protocol filter tab appears in the General group only if the protocol occurs in more than one of the
technology-specific tab groups. For example, if L2CAP occurs in both Classic Bluetooth and Bluetooth low
energy , there will be L2CAP tabs in the General group, the Classic Bluetooth group, and the Bluetooth low
energy group.
Select the Unfiltered tab to display all packets.
There are several special tabs that appear in the Summary Pane when certain conditions are met. These tabs
appear only in the General group and apply to all technologies. The tabs are:
l
l
l
Bookmarks appear when a bookmark is first seen.
Errors appear when an error is first seen. An error is a physical error in a data byte or an error in the
protocol decode.
Info appears when a frame containing an Information field is first seen.
The tabs disappear when the capture buffer is cleared during live capture or when decoders are reloaded, even if
one of the tabs is currently selected. They subsequently reappear as the corresponding events are detected.
- 89 -
ComProbe BPA 600 User Manual
Chapter 4 Capturing and Analyzing Data
Comparing Frames
If you need to compare frames, you can open additional Frame Display windows by clicking on the Duplicate
View icon
. You can have as many Frame Display windows open at a time as you wish.
Frame Wrapping and Display
In order to assure that the data you are seeing in Frame Display are current, the following messages appear
describing the state of the data as it is being captured.
l
l
l
All Frame Display panes except the Summary pane display "No frame selected" when the selected frame is
in the buffer (i.e. not wrapped out) but not accessible in the Summary pane. This can happen when a tab is
selected that doesn’t filter in the selected frame.
When the selected frame wraps out (regardless of whether it was accessible in the Summary pane) all Frame
Display panes except the Summary pane display "Frame wrapped out of buffer".
When the selected frame is still being captured, all Frame Display panes except the Summary pane display
"Frame incomplete".
4.4.1.1 Frame Display Toolbar
The buttons that appear in the Frame Display window vary according to the particular configuration of the
analyzer. For controls not available the icons will be grayed-out.
Table 4.5 - Frame Display Toolbar Icons
Icon
Description
Control – Brings the Control window to
the front.
Open File - Opens a capture file.
I/O Settings - Opens the I/O Settings
dialog.
Start Capture - Begins data capture to a
user designated file.
Stop Capture - Closes a capture file and
stops data capture to disk.
Save - Save the currently selected bytes
or the entire buffer to file.
Clear- Discards the temporary file and
clears the display.
Event Display – Brings the Event Display
window to the front.
- 90 -
Chapter 4 Capturing and Analyzing Data
ComProbe BPA 600 User Manual
Table 4.5 - Frame Display Toolbar Icons(continued)
Icon
Description
Show Message Sequence Chart Message Sequence Chart (MSC)
displays information about the messages
passed between protocol layers.
Duplicate View - Creates a second Frame
Display window identical to the first.
Apply/Modify Display Filters - Opens the
Display Filter dialog.
Quick Protocol Filter - brings up a dialog
box where you can filter or hide one or
more protocol layers.
Protocol Stack - brings up the Protocol
Stack Wizard where you can change the
stack used to decode framed data
Reload Decoders - When Reload
Decoders is clicked, the plug-ins are
reset and received frames are redecoded. For example, If the first frame
occurs more than 10 minutes in the past,
the 10-minute utilization graph stays
blank until a frame from 10 minutes ago or
less is decoded.
Find - Search for errors, string patterns,
special events and more.
Display Capture Notes - Brings up the
Capture Notes window where you can
view or add notes to the capture file.
Add/Modify Bookmark - Add a new or
modify an existing bookmark.
Display All Bookmarks - Shows all
bookmarks and lets you move between
bookmarks.
Bluetooth Timeline - Opens the Bluetooth
Timeline
Coexistence View - Opens the
Coexistence View
low energy Timeline- Opens the low
energy Timeline
- 91 -
ComProbe BPA 600 User Manual
Chapter 4 Capturing and Analyzing Data
Table 4.5 - Frame Display Toolbar Icons(continued)
Icon
Description
Extract Data - Opens the Extract Data
dialog.
Bluetooth low energy Packet Error Rate
Statistics Opens the Packet Error Rate
Statistics display
Bluetooth Classic Packet Error Rate
Statistics - Opens the Packet Error Rate
Statistics display.
Audio Expert System - Opens Audio
Expert System Window
Reload Decoders - When Reload Decoders is clicked, the plug-ins are reset
and received frames are re-decoded. For example, If the first frame occurs
more than 10 minutes in the past, the 10-minute utilization graph stays blank
until a frame from 10 minutes ago or less is decoded.
Filter: Text giving the filter currently in
use. If no filter is being used, the text
reads "All Frames" which means that
nothing is filtered out. To see the text of
the entire filter, place the cursor over the
text and a ToolTip pops up with the full
text of the filter.
The following icons all change how the panes are arranged on the Frame
Display. Additional layouts are listed in the View menu.
Show Default Panes - Returns the panes
to their default settings.
Show Only Summary Pane - Displays
only the Summary pane.
Shall All Panes Except Event Pane Makes the Decode pane taller and the
Summary pane narrower.
Toggle Display Lock - Prevents the
display from updating.
Go To Frame
First Frame - Moves to the first frame in
the buffer.
Previous Frame - Moves to the previous
frame in the buffer.
- 92 -
Chapter 4 Capturing and Analyzing Data
ComProbe BPA 600 User Manual
Table 4.5 - Frame Display Toolbar Icons(continued)
Icon
Description
Next Frame - Moves to the next frame in
the buffer.
Last Frame - Moves to the last frame in
the buffer.
Find on Frame Display only searches the
Decode Pane for a value you enter in the
text box.
Find Previous Occurrence - Moves to the
previous occurrence of the value in the
Frame Display Find.
Find Next Occurrence - Moves to the next
occurrence of the value in the Frame
Display Find.
Cancel Current Search - Stops the
current Frame Display Find.
Summary Drop Down Box: Lists all the
protocols found in the data in the file. This
box does not list all the protocol decoders
available to the analyzer, merely the
protocols found in the data. Selecting a
protocol from the list changes the
Summary pane to display summary
information for that protocol. When a low
energy predefined Named Filter (like
Nulls and Polls) is selected, the
Summary drop-down is disabled.
Text with Protocol Stack: To the right of the Summary Layer box is some text
giving the protocol stack currently in use.
Note: If the frames are sorted in other than ascending frame number order, the order of the frames
in the buffer is the sorted order. Therefore the last frame in the buffer may not have the last frame
number.
4.4.1.2 Frame Display Status Bar
The Frame Display Status bar appears at the bottom of the Frame Display. It contains the following
information:
- 93 -
ComProbe BPA 600 User Manual
l
l
l
Chapter 4 Capturing and Analyzing Data
Frame #s Selected: Displays the frame number or numbers of selected (highlighted) frames, and the total
number of selected frames in parentheses
Total Frames: The total number of frames in the capture buffer or capture file in real-time
Frames Filtered In: The total number of frames displayed in the filtered results from user applied filters in
real-time
4.4.1.3 Hiding and Revealing Protocol Layers in the Frame Display
Hiding protocol layers refers to the ability to prevent a layer from being displayed on the Decode pane. Hidden
layers remain hidden for every frame where the layer is present, and can be revealed again at any time. You can
hide as many layers as you wish.
Note: Hiding from the Frame Display affects only the data shown in the Frame Display and not any
information in any other window.
There are two ways to hide a layer.
1. Right-click on the layer in the Decode pane, and choose Hide [protocol name] Layer In All Frames.
2. Click the Set Protocol Filtering button on the Summary pane toolbar. In the Protocols to Hide box
on the right, check the protocol layer(s) you want hidden. Click OK when finished.
To reveal a hidden protocol layer:
1. Right-click anywhere in the Decode pane
2. Choose Show [protocol name] Layer from the right-click menu, or click the Set Protocol Filtering
button and un-check the layer or layers you want revealed.
4.4.1.4 Physical vs. Logical Byte Display
The Event Display window and Event Pane in the Frame Display window show the physical bytes. In other
words, they show the actual data as it appeared on the circuit. The Radix, Binary and Character panes in the Frame
Display window show the logical data, or the resulting byte values after escape codes or other character altering
codes have been applied (a process called transformation).
As an example, bytes with a value of less than 0x20 (the 0x indicates a hexadecimal value) cannot be transmitted
in Async PPP. To get around this, a 0x7d is transmitted before the byte. The 0x7d says to take the next byte and
subtract 0x20 to obtain the true value. In this situation, the Event pane displays 0x7d 0x23, while the Radix pane
displays 0x03.
4.4.1.5 Sorting Frames
By default, frames are sorted in ascending numerical sequence by frame number. Click on a column header in the
Summary pane to sort the frames by that column. For example, to sort the frames by size, click on the Frame
Size column header.
An embossed triangle next to the header name indicates which column the frames are sorted by. The direction of
the triangle indicates whether the frames are in ascending or descending order, with up being ascending.
Note that it may take some time to sort large numbers of frames.
- 94 -
Chapter 4 Capturing and Analyzing Data
ComProbe BPA 600 User Manual
4.4.1.6 Frame Display - Find
Frame Display has a simple Find function that you can use to search the Decode Pane for any alpha numeric
value. This functionality is in addition to the more robust Search/Find dialog.
Frame Display Find is located below the toolbar on the Frame Display dialog.
Figure 4.21 - Frame Display Find text entry field
Where the more powerful Search/Find functionality searches the Decode, Binary, Radix, and Character panes
on Frame Display using TImestamps, Special Events, Bookmarks, Patterns, etc.,
Figure 4.22 - Search/Find Dialog
Find on Frame Display only searches the Decode Pane for a value you enter in the text box.
To use Find:
1. Select the frame where you want to begin the search.
2. Enter a value in the Find text box.
- 95 -
ComProbe BPA 600 User Manual
Chapter 4 Capturing and Analyzing Data
Note: Note: The text box is disabled during a live capture.
3.
Select Find Previous Occurrence
or Find Next Occurrence
to begin the search on frames prior to the frame you selected,
to begin the search on frames following the frame you selected.
The next occurrence of the value (if it is found) will be highlighted in
the Decode Pane.
4.
Select Find Previous Occurrence or Find Next Occurrence to
continue the search.
There are several important concepts to remember with Find.
l
l
l
l
When you enter a search string and select Enter, the search moves forward.
If you select Find Previous Occurrence, when the search reaches the first frame it will then cycle to the
last frame and continue until it reaches the frame where the search began.
Shift + F3 is a shortcut for Find Previous Occurrence.
If you select Find Next Occurrence, when the search reaches the last frame it will then cycle to the first
frame and continue until it reaches the frame where the search began.
l
F3 is a shortcut for Find Next Occurrence.
l
You cannot search while data is being captured.
l
After a capture is completed, you cannot search until Frame Display has finished decoding the frames.
l
Find is not case sensitive.
l
l
l
l
l
l
The status of the search is displayed at
the bottom of the dialog.
The search occurs only on the
protocol layer selected.
To search across all the protocols on
the Frame Display, select the
Unfiltered tab.
A drop-down list displays the search values entered during the current
session of Frame Display.
The search is cancelled when you select a different protocol tab during a
search.
You can cancel the search at any time by selecting the Cancel Current
Search
button.
- 96 -
Chapter 4 Capturing and Analyzing Data
ComProbe BPA 600 User Manual
4.4.1.7 Synchronizing the Event and Frame Displays
The Frame Display is synchronized with the Event Display. Click on a frame in the Frame Display and the
corresponding bytes is highlighted in the Event Display. Each Frame Display has its own Event Display.
As an example, here's what happens if the following sequence of events occurs.
1. Click on the Frame Display icon
in Control window toolbar to open the Frame Display.
2. Click on the Duplicate View icon
to create Frame Display #2.
3. Click on Event Display icon
in Frame Display #2. Event Display #2 opens. This Event
Display is labeled #2, even though there is no original Event Display, to indicate that it is synchronized
with Frame Display #2.
4. Click on a frame in Frame Display #2. The corresponding bytes are highlighted in Event Display #2.
5. Click on a frame in the original Frame Display. Event Display #2 does not change.
4.4.1.8 Working with Multiple Frame Displays
Multiple Frame Displays are useful for comparing two frames side by side. They are also useful for comparing all
frames against a filtered subset or two filtered subsets against each other.
l
To create a second Frame Display, click the Duplicate View icon
on the Frame Display toolbar.
This creates another Frame Display window. You can have as many Frame Displays open as you wish.
Each Frame Display is given a number in the title bar to distinguish it from the others.
l
To navigate between multiple Frame Displays, click on the Frame Display icon
in the Control window
toolbar.
A drop-down list appears, listing all the currently open Frame Displays.
l
Select the one you want from the list and it comes to the front.
Note: When you create a filter in one Frame Display, that filter does not automatically appear
in the other Frame Display. You must use the Hide/Reveal feature to display a filter created in
one Frame Display in another.
Note: When you have multiple Frame Display windows open and you are capturing data, you
may receive an error message declaring that "Filtering cannot be done while receiving data this
fast." If this occurs, you may have to stop filtering until the data is captured.
4.4.1.9 Working with Panes on Frame Display
When the Frame Display first opens, all panes are displayed except the Event pane (To view all the panes,
select Show All Panes from the View menu).
l
The Toggle Expand Decode Pane icon
makes the decode pane longer to view lengthy decodes
better.
- 97 -
ComProbe BPA 600 User Manual
Chapter 4 Capturing and Analyzing Data
l
The Show Default Panes icon
returns the Frame Display to its default settings.
l
The Show only Summary Pane icon
displays on the Summary Pane.
To close a pane, right-click on the pane and select Hide This Pane from the pop-up menu, or de-select Show
[Pane Name] from the View menu.
To open a pane, right-click on the any pane and select Show Hidden Panes from the pop-up menu and select
the pane from the fly-out menu, or select Show [Pane Name] from the View menu.
To re-size a pane, place the cursor over the pane border until a double-arrow cursor appears. Click and drag on
the pane border to re-size the pane.
4.4.1.10 Frame Display - Byte Export
The captured frames can be exported as raw bytes to a text file.
1. From the Frame Display File menu select Byte Export....
Figure 4.23 - Frame Display File menu, Byte Export
2. From the Byte Export window specify the frames to export.
l
l
All Frames exports all filtered-in frames including those scrolled off the Summary pane. Filtered-in
frames are dependent on the selected Filter tab above the Summary pane. Filtered-out frames are
not exported.
Selected Frames export is the same as All Frames export except that only frames selected in the
Summary pane will be exported.
- 98 -
Chapter 4 Capturing and Analyzing Data
ComProbe BPA 600 User Manual
Figure 4.24 - Byte Export dialog
Click the OK button to save the export. Clicking the Cancel button will exit Byte Export.
3. The Save As dialog will open. Select a directory location and enter a file name for the exported frames
file.
Figure 4.25 - Save As dialog
Click on the Save button.
The exported frames are in a text file that can be opened in any standard text editing application. The header
shows the export type, the capture file name, the selected filter tab, and the number of frames. The body shows
the frame number, the timestamp in the same format shown in the Frame Display Summary pane, and the
frame contents as raw bytes.
- 99 -
ComProbe BPA 600 User Manual
Chapter 4 Capturing and Analyzing Data
Figure 4.26 - Sample Exported Frames Text File
4.4.1.11 Panes in the Frame Display
4.4.1.11.1 Summary Pane
The Summary pane
displays a one-line summary of every frame in a capture buffer or file, including frame
number, timestamp, length and basic protocol information. The protocol information included for each frame
depends on the protocol selected in the summary layer box (located directly below the main toolbar).
On a two-channel circuit, the background color of the one-line summary indicates whether the frame came from
the DTE or the DCE device. Frames with a white background come from the DTE device, frames with a gray
background come from the DCE device.
The ComProbe USB Summary pane in displays a one-line summary of every transaction in a capture buffer or
file. Whenever there is a transaction it is shown on a single line instead of showing the separate messages that
comprise the transaction. The Msg column in that case says “Transaction”.
Each message in a transaction contains a packet identifier (PID). All of the PIDs in a transaction are shown in the
transaction line.
All "IN" transactions (i.e. transactions that contain an IN token message) are shown with a purple background. All
other transactions and all non-transactions are shown with a white background. "IN" transactions have special
coloring because that is the only place where the primary data flow is from a device to the Host.
The protocol information included for each frame depends on the protocol selected in the summary layer box
(located directly below the main toolbar).
Frame numbers in red indicate errors, either physical (byte-level) or frame errors. If the error is a frame error in
the displayed protocol layer, the bytes where the error occurred is displayed in red. The Decode Pane gives
precise information as to the type of error and where it occurred.
The Summary pane is synchronized with the other panes in this window. Click on a frame in the Summary
pane, and the bytes for that frame is highlighted in the Event pane while the Decode pane displays the full
decode for that frame. Any other panes which are being viewed are updated accordingly. If you use one pane to
select a subset of the frame, then only that subset of the frame is highlighted in the other panes.
Protocol Tabs
Protocol filter tabs are displayed in the Frame Display above the Summary pane.
l
These tabs are arranged in separate color-coded groups. These groups and their colors are General (white),
Classic Bluetooth® (blue), Bluetooth low energy (green), 802.11 (orange), USB (purple), and SD (brown). The
- 100 -
Chapter 4 Capturing and Analyzing Data
ComProbe BPA 600 User Manual
General group applies to all technologies. The other groups are technology-specific.
Figure 4.27 - Example Protocol Tags
l
l
l
Clicking on a protocol filter tab in the General group filters in all packets containing that protocol regardless of
each packet’s technology.
Clicking on a protocol filter tab in a technology-specific group filters in all packets containing that protocol on
that technology.
A protocol filter tab appears in the General group only if the protocol occurs in more than one of the
technology-specific tab groups. For example, if L2CAP occurs in both Classic Bluetooth and Bluetooth low
energy , there will be L2CAP tabs in the General group, the Classic Bluetooth group, and the Bluetooth low
energy group.
Select the Unfiltered tab to display all packets.
There are several special tabs that appear in the Summary pane when certain conditions are met. These tabs
appear only in the General group and apply to all technologies. The tabs are:
l
l
l
Bookmarks appear when a bookmark is first seen.
Errors appear when an error is first seen. An error is a physical error in a data byte or an error in the
protocol decode.
Info appears when a frame containing an Information field is first seen.
The tabs disappear when the capture buffer is cleared during live capture or when decoders are reloaded, even if
one of the tabs is currently selected. They subsequently reappear as the corresponding events are detected.
The tabs disappear when the capture buffer is cleared during live capture or when decoders are reloaded, even if
one of the tabs is currently selected. They subsequently reappear as the corresponding events are detected.
Use the navigation icons, keyboard or mouse to move through the frames. The icons
the first and last frames in the buffer, respectively. Use the Go To icon
and
move you to
to move to a specific frame number.
Placing the mouse pointer on a summary pane header with truncated text displays a tooltip showing the full
header text.
- 101 -
ComProbe BPA 600 User Manual
Chapter 4 Capturing and Analyzing Data
Figure 4.28 - Summary pane (right) with Tooltip on Column 5 (Tran ID)
Sides in Bluetooth low energy
A Bluetooth low energy data connection consists of connection events, which are a series of transmissions on the
same channel. In each connection event the master transmits first, then the slave, and then the devices take turns
until the connection event is finished.
When the data connection is encrypted and the packets are successfully decrypted, the sniffer can determine
exactly who sent which packet (only non-empty, encrypted packets – empty packets are never encrypted). These
packets are labeled either ‘M’ for master or ‘S’ for slave.
When the data connection is unencrypted or when encrypted packets are not successfully decrypted by the
sniffer, the sniffer cannot distinguish the two devices’ (master and slave) packets by their content, just by the
packet timing. In those cases we label each device as side ‘1’ or ‘2’, not as master or slave. In each connection
event, packets sent by the device which transmitted first in the connection event are labeled ‘1’, and packets sent
by the device which transmitted second are labeled ‘2’.
If no packets in the connection event are missed by the sniffer, the device labeled ‘1’ is the master and the device
labeled ‘2’ is the slave. However, if we do not capture the very first packet in a connection event (i.e. the packet
sent by the master) but do capture the packet sent by the slave, we label the slave as side ‘1’ since it is the first
device we heard in the connection event. Because there is potential clock drift since the last connection event,
we cannot use the absolute timing to correct this error; there would still be cases where we get it wrong.
Therefore we always assign ‘1’ to the first packet in a connection event. So even though it is rare, there are
connection events where packets sent by the slave device are labeled ‘1’ and packets sent by the master are
labeled ‘2’.
Finally, in a noisy environment it is also possible that the sniffer does not capture packets in the middle of a
connection event. If this occurs and the sniffer cannot determine the side for the remaining packets in that
connection event, the side is labeled ‘U’ for “unknown”.
4.4.1.11.2 Customizing Fields in the Summary Pane
You can modify the Summary Pane in Frame Display.
Summary pane columns can be reordered by dragging any column to a different position.
Fields from the Decode pane can be added to the summary pane by dragging any Decodepane field to the
desired location in the summary pane header. If the new field is from a different layer than the summary pane a
plus sign (+) is prepended to the field name and the layer name is added in parentheses. The same field can be
added more than once if desired, thus making it possible to put the same field at the front and back (for example)
of a long header line so that the field is visible regardless of where the header is scrolled to.
An added field can be removed from the Summary pane by selecting Remove New Column from the rightclick menu.
- 102 -
Chapter 4 Capturing and Analyzing Data
ComProbe BPA 600 User Manual
The default column layout (both membership and order) can be restored by selecting Restore Default
Columns from the Format or right-click menus.
Changing Column Widths
To change the width of a column:
1. Place the cursor over the right column divider until the cursor changes to a solid double arrow.
2. Click and drag the divider to the desired width.
3. To auto-size the columns, double-click on the column dividers.
Hiding Columns
To hide a column:
1. Drag the right divider of the column all the way to the left.
2. The cursor changes to a split double arrow when a hidden column is present.
3. To show the hidden column, place the cursor over the divider until it changes to a split double arrow, then
click and drag the cursor to the right.
4. The Frame Size, Timestamp, and Delta columns can be hidden by right-clicking on the header and
selecting Show Frame Size Column, Show Timestamp Column, or Show Delta Column. Follow
the same procedure to display the columns again.
Moving Columns - Changing Column Order
To move a column :
1. Click and hold on the column header
2. Drag the mouse over the header row.
3. A small white triangle indicates where the column is moved to.
4. When the triangle is in the desired location, release the mouse.
Restoring Default Column Settings
To restore columns to their default locations, their default widths, and show any hidden columns
1. Right-click on any column header and choose Restore Default Column Widths, or select Restore
Default Column Widths from the Format menu.
4.4.1.11.3 Frame Symbols in the Summary Pane
Symbol
Table 4.6 - Frame Symbols
Description
A green dot means the frame was decoded successfully, and the protocol listed in the Summary
Layer drop-down box exists in the frame. No dot means the frame was decoded successfully, but the
protocol listed in the Summary Layer drop-down box does not exist in the frame.
- 103 -
ComProbe BPA 600 User Manual
Chapter 4 Capturing and Analyzing Data
Table 4.6 - Frame Symbols (continued)
Description
Symbol
A green circle means the frame was not fully decoded. There are several reasons why this might
happen.
l
l
One reason is that the frame compiler hasn't caught up to that frame yet. It takes some time for
the analyzer to compile and decode frames. Frame compilation also has a lower priority than other
tasks, such as capturing data. If the analyzer is busy capturing data, frame compilation may fall
behind. When the analyzer catches up, the green circle changes to either a green dot or no dot.
Another reason is if some data in the frame is context dependent and we don't have the context.
An example is a compressed header where the first frame gives the complete header, and
subsequent frames just give information on what has changed. If the analyzer does not capture the
first frame with the complete header, it cannot decode subsequent frames with partial header
information.
A magenta triangle indicates that a bookmark is associated with this frame. Any comments associated
with the bookmark appear in the column next to the bookmark symbol.
4.4.1.11.4 Decode Pane
The Decode pane (aka detail pane)
is a post-process display that provides a detailed decode of each frame
transaction (sometimes referred to as a frame). The decode is presented in a layered format that can be
expanded and collapsed depending on which layer or layers you are most interested in. Click on the plus sign to
expand a layer. The plus sign changes to a minus sign. Click on the minus sign to collapse a layer. Select Show All
or Show Layers from the Format menu to expand or collapse all the layers. Layers retain their expanded or
collapsed state between frames.
Protocol layers can be hidden, preventing them from being
displayed on the Decode pane. Right-click on any protocol layer
and choose Hide [protocol name] from the right-click menu.
In a USB transaction, all messages that comprise the transaction
are shown together in the detail pane. The color coding that is
applied to layers when the detail pane displays a single message
is applied to both layers and messages when the detail pane displays a transaction. To keep the distinction
between layers and messages clear, each header of each message in the detail pane ends with the word
“Message” or “Messages”. The latter is used because data and handshake messages are shown as a single colorcoded entry
Each protocol layer is represented by a color, which is used to highlight the bytes that belong to that protocol
layer in the Event, Radix, Binary and Character panes. The colors are not assigned to a protocol, but are
assigned to the layer.
The Event, Radix, Binary, Character and Decode panes are all synchronized with one another. Clicking on an
element in any one of the panes highlights the corresponding element in all the other panes.
Click the Toggle Expand Decode Pane icon
to make the Decode pane taller. This allows for more of a
lengthy decode to be viewed without needing to scroll.
- 104 -
Chapter 4 Capturing and Analyzing Data
ComProbe BPA 600 User Manual
4.4.1.11.5 Radix or Hexadecimal Pane
The Radix pane displays the logical bytes in the frame in either
hexadecimal, decimal or octal. The radix can be changed from
the Format menu, or by right-clicking on the pane and
choosing Hexadecimal, Decimal or Octal.
Because the Radix pane displays the logical bytes rather than
the physical bytes, the data in the Radix pane may be different
from that in the Event pane. See Physical vs. Logical Byte Display
for more information.
Colors are used to show which protocol layer each byte belongs
to. The colors correspond to the layers listed in the Decode
pane.
The Event, Radix, Binary, Character and Decode panes are all synchronized with one another. Clicking on an
element in any one of the panes highlights the corresponding element in all the other panes.
4.4.1.11.6 Character Pane
The Character pane represents the logical bytes in the frame
in ASCII, EBCDIC or Baudot. The character set can be
changed from the Format menu, or by right-clicking on the
pane and choosing the appropriate character set.
Because the Character pane displays the logical bytes rather
than the physical bytes, the data in the Character pane may
be different from that in the Event pane. See Physical vs.
Logical Byte Display for more information.
Colors are used to show which protocol layer each byte
belongs to. The colors correspond to the layers listed in the
Decode pane.
The Event, Radix, Binary, Character and Decode panes
are all synchronized with one another. Clicking on an element
in any one of the panes highlights the corresponding element in all the other panes.
4.4.1.11.7 Binary Pane
The Binary pane displays the logical bytes in the frame in binary.
Because the Binary pane displays the logical bytes rather than the physical bytes, the data in the Binary pane may
be different from that in the Event pane. See Physical vs. Logical Byte Display for more information.
Colors are used to show which protocol layer each byte belongs to. The colors correspond to the layers listed in
the Decode pane.
The Event, Radix, Binary, Character and Decode panes are all synchronized with one another. Clicking on an
element in any one of the panes highlights the corresponding element in all the other panes.
- 105 -
ComProbe BPA 600 User Manual
Chapter 4 Capturing and Analyzing Data
4.4.1.11.8 Event Pane
The Event pane shows the physical bytes
in the frame. You can choose between
displaying only the data events or
displaying all events by clicking the All
Events icon
.
Displaying all events means that special
events, such as Start of Frame, End of
Frame and any signal change events, are
displayed as special symbols within the
data.
The status lines at the bottom of the pane give the same information as the status lines in the Event Display
window. This includes physical data errors, control signal changes (if appropriate), and timestamps.
Because the Event pane displays the physical bytes rather than the logical bytes, the data in the Event pane may
be different from that in the Radix, Binary and Character panes. See Physical vs. Logical Byte Display for more
information.
Colors are used to show which protocol layer each byte belongs to. The colors correspond to the layers listed in
the Decode pane.
The Event, Radix, Binary, Character and Decode panes are all synchronized with one another. Clicking on an
element in any one of the panes highlights the corresponding element in all the other panes.
4.4.1.11.9 Change Text Highlight Color
Whenever you select text in the Binary, Radix, or
Character panes in Frame Display, the text is displayed
with a highlight color. You can change the color of the
highlight.
1. Select Change Text Highlight Color from the
Options menu. You can also access the option by
right clicking in any of the panes.
2. Select a color from the drop-down menu.
3. Click OK.
The highlight color for the text is changed.
Select Cancel to discard any selection. Select Defaults to return the highlight color to blue.
4.4.1.12 Protocol Layer Colors
4.4.1.12.1 Data Byte Color Notation
The color of the data in the panes specifies which layer of the protocol stack the data is from. All data from the
first layer is bright blue, the data from the second layer is green, the third layer is pink, etc. The protocol name for
each layer in the Decode pane is in the same color. Note that the colors refer to the layer, not to a specific
protocol. In some situations, a protocol may be in two different colors in two different frames, depending on
where it is in the stack. You can change the default colors for each layer.
- 106 -
Chapter 4 Capturing and Analyzing Data
ComProbe BPA 600 User Manual
Red is reserved for bytes or frames with errors. In the Summary pane, frame numbers in red mean there is an
error in the frame. Also, the Errors tab is displayed in red. This could be a physical error in a data byte or an error
in the protocol decode. Bytes in red in the Radix, Character, Binary and Event panes mean there is a physical
error associated with the byte.
4.4.1.12.2 Changing Protocol Layer Colors
You can differentiate different protocol layers in the Decode, Event, Radix, Binary and Character panes.
1. Choose Select Protocol Layer Colors from the Options menu to change the colors used.
The colors for the different layers is displayed.
2. To change a color, click on the arrow next to each layer and select a new color.
3. Select OK to accept the color change and return to Frame Display.
Select Cancel to discard any selection. Select Defaults to return the highlight colors to the default settings.
Figure 4.29 - Frame Display Protocol Layer Color Selector
4.4.1.13 Filtering
Filtering allows the user to control the display which capture frames are displayed. Filters fall into two general
categories:
1. Display filters allow a user to look at a subset of captured data without affecting the capture content.
Frames matching the filter criteria appear in the Frame Display; frames not matching the criteria will not
appear.
2. Connection filters Two options are available.
a. A Bluetooth connection: Displays only the frames associated with a Classic Bluetooth link or a
Bluetooth low energy access address. A new Frame Display will open showing only the protocol
tabs, frames, summary, and events associated with that particular Bluetooth connection.
- 107 -
ComProbe BPA 600 User Manual
Chapter 4 Capturing and Analyzing Data
b. A specific wireless or wired technology. Displays all of the frames associated with:
l
Classic Bluetooth
l
Bluetooth low energy
l
802.11
l
HCI
A new Frame Display will open showing only the protocol tabs, frames, summary and events
associated with the selected technology.
4.4.1.13.1 Display Filters
A display filter looks at frames that have already been captured. It looks at every frame in the capture buffer and
displays those that match the filter criteria. Frames that do not match the filter criteria are not displayed. Display
filters allow a user to look at a subset of captured data without affecting the capture content. There are three
general classes of display filters:
l
Protocol Filters
l
Named Filters
l
Quick Filter
Protocol Filters
Protocol filters test for the existence of a specific single layer. The system creates a protocol filter for each
decoder that is loaded if that layer is encountered in a capture session.
There are also three special purpose filters that are treated as protocol filters:
l
All Frames with Errors
l
All Frames with Bookmarks
l
All Special Information Nodes
Named Filters
l
l
Named filters test for anything other than simple single layer existence. Named filters can be constructed that
test for the existence of multiple layers, field values in layers, frame sizes, etc., as well as combinations of
those things. Named filters are persistent across sessions.
Named filters are user-defined. User-defined filters persist in a template file. User defined filters can be
deleted.
Quick Filters
l
Quick Filters are combinations of Protocol Filters and/or Named Filters that are displayed on the Quick Filter
tab.
l
Quick Filters cannot be saved and do not persist across sessions.
l
Quick Filters are created on the Quick Filter Dialog.
- 108 -
Chapter 4 Capturing and Analyzing Data
ComProbe BPA 600 User Manual
4.4.1.13.1.1 Creating a Display Filter
There are two steps to using a display filter. Define the filter conditions, and then apply the filter to the data set.
The system combines both filter definition and application in one dialog.
1. Click the Display Filters icon
on the Frame Display
window or select Apply/Modify
Display Filters from the Filter menu to open the Set Condition dialog box. The Set Condition dialog is
self configuring which means that when you Select each frame under Conditions the following
displayed fields depend on your selection. With each subsequent selection the dialog fields will change
depending on you selection in that field.
Figure 4.30 - Example: Set Conditions Self Configuring Based on Protocol Selection
Figure 4.31 - Example: Set Conditions Self Configuring Based on Frame Range
2. Select Include or Exclude to add filtered data or keep out filtered data respectively.
3. Select the initial condition for the filter from the drop-down list.
4. Set the parameters for the selected condition in the fields provided. The fields that appear in the dialog
box are dependent upon the previous selection. Continue to enter the requested parameters in the fields
provided until the condition statement is complete.
5. Click OK. The system displays the Save Named Condition dialog. Provide a name for the filter condition
or accept the default name provided by the system and click OK. Prohibited characters are left bracket '[',
right bracket ']' and equal sign '='. The Set Condition dialog box closes, creates a tab on the Frame
Display with the filter name, and applies the filter.
The filter also appears in the Quick Filtering and Hiding Protocols dialog.
- 109 -
ComProbe BPA 600 User Manual
Chapter 4 Capturing and Analyzing Data
When a display filter is applied, a description of the filter appears to the right of the toolbar in the Frame Display
windows.
Notes:
l
l
l
The system requires naming and saving of all filters created by the user.
The OK button on the Set Condition dialog box is unavailable (grayed out) until the condition selections are
complete.
When you have multiple Frame Display windows with a display filter or filters, those filter do not automatically
appear in other Frame Display windows. You must use the Hide/Reveal feature to display a filter created in
one Frame Display in different Frame Display window.
4.4.1.13.1.2 Including and Excluding Radio Buttons
All filter dialog boxes contain an Include and an Exclude radio button. These buttons are mutually exclusive. The
Include/Exclude selection becomes part of the filter definition, and appears as part of the filter description
displayed to the right of the Toolbar.
Include: A filter constructed with the "Include" button selected, returns a data set that includes frames that meet
the conditions defined by the filter and omits frames that do not.
Exclude: A filter constructed with the "Exclude" button selected, returns a data set that excludes frames that
meet the conditions defined by the filter and consists of frames that do not.
4.4.1.13.1.3 Named Display Filters
You can create a unique display filter by selecting a data type on the Frame Display and using a right click menu.
When you create a Name Filter, it appears in the Quick Filtering dialog, where you can use it do customize the
data you see in the Frame Display panes.
1. Select a frame in the Frame Display Summary Pane.
2. Right click in the one of the data columns in the Summary Pane: CRC, NESN, DS, Packet Success,
Ethertype, Source Address, etc.
3. Select Filter in (data type) = . The Filtering Results
dialog appears.
4. Enter a name for the filter
5. Select OK.
The filter you just created appears in the Named Filters section
of the Quick Filtering dialog.
4.4.1.13.1.4 Using Compound Display Filters
Compound filters use boolean logic to create complex and precise filters. There are three primary Boolean logic
operators: AND, OR, and NOT.
The AND operator narrows the filter, the OR operator broadens the filter, and the NOT operator excludes
conditions from the filtered results. Include parentheses in a compound filter to nest condition sets within larger
condition sets, and force the filter-processing order.
- 110 -
Chapter 4 Capturing and Analyzing Data
ComProbe BPA 600 User Manual
There are two steps to using a compound filter. Define the filter conditions, and then apply the filter to the data
set. The analyzer combines both filter definition and application in one dialog.
1. Click the Display Filters icon
on the Frame Display window or select Apply/Modify Display
Filters… from the filter menu to open the Set Condition dialog box.
2. Click the Advanced button on the Set Condition dialog box.
3. Select Include or Exclude radio button.
Now you can set the conditions for the filter.
4. Select the initial condition for the filter from the
combo box at the bottom of the dialog for Select
each frame.
5. Set the parameters for the selected condition in
the fields provided. The fields that appear in the
dialog box are dependent upon the previous
selection. Continue to enter the requested
parameters in the fields provided until the
conditions statement is complete.
Figure 4.32 - Two Filter Conditions Added with an AND Operator
6. Click the plus icon
Use the up
on the left side of the dialog box and repeat steps 4 and 5 for the next condition.
and down
the delete button
arrow icons on the left side of the dialog box to order your conditions, and
to delete conditions from your filter.
7. Continue adding conditions until your filter is complete.
8. Include parentheses as needed and set the boolean operators.
9. Click OK.
10. The system displays the Save Named Condition dialog. Provide a name for the filter condition or accept
the default name provided by the system and click OK.
- 111 -
ComProbe BPA 600 User Manual
Chapter 4 Capturing and Analyzing Data
Figure 4.33 - Save Named Filter Condition Dialog
The Set Condition dialog box closes, creates a tab on the Frame Display with the filter name, and applies the
filter.
When a display filter is applied, a description of the filter
appears to the right of the toolbar in the Frame
Display windows.
Note: The OK button on the Set Condition dialog box is unavailable (grayed out) until the
condition selections are complete.
4.4.1.13.1.5 Defining Node and Conversation Filters
There are two steps to using Node and Conversation display filter. Define the filter conditions, and then apply the
filter to the data set. The analyzer combines both filter definition and application in one dialog.
1. Click the Display Filters icon
on the Frame Display window or select Apply/Modify Display
Filters… from the filter menu to open the Set Condition dialog box.
2. From the Select each frame combo box choose frames with the conversation as the initial condition.
3. Select an address type—IP, MAC, TCP/UDB—from the Typecombo box (The address type selection
populates both Address combo boxes with node address in the data set that match the type selection).
4. Select a node address from the first Address combo box.
5. Choose a direction arrow from the direction box . The left arrow filters on all frames
where the top node address is the destination, the right arrow filters on all frames
where the top node address is the source, and the double arrow filters on all frames
where the top node address is either the source or the destination.
6. If you want to filter on just one node address, skip step 7 and continue with step 8.
7. If you want to filter on traffic going between two address nodes (i.e. a conversation), select a node address
from the second Address combo box..
8. Click OK. The Set Condition dialog box closes and the analyzer applies the filter.
When a display filter is applied, a description of the filter appears to the right of the toolbar in the Frame Display
windows.
- 112 -
Chapter 4 Capturing and Analyzing Data
ComProbe BPA 600 User Manual
Note: The OK button is unavailable (grayed out) until the condition selections are complete.
4.4.1.13.1.6 The Difference Between Deleting and Hiding Display Filters
If you wish to remove a filter from the system permanently, then use the Delete procedure. However, if all you
want to do is remove a filter as a means to un-clutter the display, then use the Hide procedure.
Deleting a saved filter removes the filter from the current session and all subsequent sessions. In order to retrieve
a deleted filter, the user must recreate it using the Set Conditions dialog.
Hiding a filter merely removes the filter from the display. A hidden filter can be reapplied using the Show/Hide
procedure.
Deleting Saved Display Filters
1. Select Delete Display Filters from the Filter
menu in the Frame Display
window to
open the Delete Named Condition dialog.
The system displays the Delete Named
Condition dialog with a list of all user defined
filters.
2. Select the filter to be deleted from the list.
3. Click the Delete button.
4. Click OK. The Delete Named Condition
dialog box closes and the system deletes the
filter.
Hiding and Revealing Display Filters
If a display filter is showing the following steps will hide
that filter but will not delete it.
1. Select Hide/Show Display
Filters… from the Filter menu on the
Frame Display
window to open
the Hide/Show Filters dialog. The
system displays the Hide/Show
Filters dialog with a list of all user
defined filters.
2. Select the filter to be hidden from the
combo box.
3. Click the Hide button. The Hide button is only showing if the selected filter is currently showing in the
Frame Display.
4. Click OK. The Hide/Show Filters dialog box closes, and the system hides the filter and removes the filter
tab from the Frame Display.
If a display filter is hidden the following steps will reveal that filter in the Frame Display.
- 113 -
ComProbe BPA 600 User Manual
Chapter 4 Capturing and Analyzing Data
1. Select Hide/Show Display Filters… from the Filter menu in the Frame Display
window to
open the Hide/Show Filters dialog. The system displays the Hide/Show Filters dialog with a list of all
user defined filters.
2. Select the filter to be revealed from the combo box.
3. Click the Show button.
4. Click OK. The Hide/Show Filters dialog box closes and the system reveals the filter in the Frame
Display.
You can also open the Quick Filter dialog and check the box next to the hidden filter to show or hide a display
filter.
Figure 4.34 - Using Named Filters Section of Quick Filters to Show/Hide Filters
Note: When you have multiple Frame Display windows with a display filter or filters, those filter do
not automatically appear in other Frame Display windows. You must use the Hide/Show dialog to
display a filter created in one Frame Display in different Frame Display window.
4.4.1.13.1.7 Editing Filters
Modifying a Condition in a Filter
1. Click the Display Filters icon
Display
on the Frame
window or select Apply/Modify Display
Filters… from the Filter menu to open the Set
Condition dialog box. The Set Condition dialog box
displays the current filter definition at the top of the dialog.
To display another filter, click the Open
icon, and
select the filter from the pop-up list of all the saved filters.
2. Edit the desired parameter of the condition: Because the required fields for a condition statement depend
upon previously selected parameters, the Set Condition dialog box may display additional fields that were
not present in the original filter. In the event this occurs, continue to enter the requested parameters in
the fields provided until the condition statement is complete.
3. Click OK. The system displays the Save Named Condition dialog. Ensure that the filter name is
displayed in the text box at the top of the dialog, and click OK. If you choose to create an additional filter,
- 114 -
Chapter 4 Capturing and Analyzing Data
ComProbe BPA 600 User Manual
then provide a new name for the filter condition or accept the default name provided by the system and
click OK.) The Set Condition dialog box closes, and the system applies the modified filter.
Note: When a display filter is applied, a description of the filter appears to the right of the toolbar in
the Frame Display windows.
Note: The OK button on the Set Condition dialog box is unavailable (grayed out) until the
condition selections are complete.
Deleting a Condition in a Filter
If a display filter has two or more conditions you can delete conditions. If there is only one condition set in the
filter you must delete the filter using Delete Display Filters… from the Filters menu.
1. Click the Display Filters icon
on the Frame Display window or select Apply/Modify Display
Filters… from the Filter menu to open the Set Condition dialog box. Click on the Advanced button to
show the condition in Boolean format. The dialog box displays the current filter definition. To display
another filter, click the Open
icon, and select the filter from the pop-up list of all the saved filters.
Figure 4.35 - Set Condition Dialog in Advanced View
2. Select the desired condition from the filter definition.
3. Click the Delete Selected Line
icon.
4. Edit the Boolean operators and parentheses as needed.
5. Click OK. The system displays the Save Named Condition dialog. Ensure that the filter name is
displayed in the text box at the top of the dialog, and click OK. (If you choose to create an additional filter,
then provide a new name for the filter condition or accept the default name provided by the system and
click OK.) The Set Condition dialog box closes, and the system applies the modified filter.
Note: When a display filter is applied, a description of the filter appears to the right of the toolbar in
the Frame Display windows.
- 115 -
ComProbe BPA 600 User Manual
Chapter 4 Capturing and Analyzing Data
Note: The OK button on the Set Condition dialog box is unavailable (grayed out) until the
condition selections are complete.
Renaming a Display Filter
1. Select Rename Display Filters… from the Filter menu in the Frame Display
window to open
the Rename Filter dialog. The system displays the Rename Filter dialog with a list of all user defined
filters in the Filters combo box.
Figure 4.36 - Rename Filters Dialog
2. Select the filter to be renamed from the combo box.
3. Enter a new name for the filter in the New Name box. Optionally click the Apply button and the new
name will appear in the Filters combo box and the New Name box will empty. This option allows you to
rename several filters without closing the Rename Filter dialog each time.
4. Click OK. The Rename Filter dialog box closes and the system renames the filter.
4.4.1.13.2 Connection Filtering
Connection Filtering allows the user to view a subset of the total available packets within the Frame Display. The
subset can include data from a single Bluetooth connection, or all of the BR/EDR packets, all of the low energy
packets, all of the 802.11 packets, or all of the HCI packets.
Bluetooth Applicability
A connection (device pair) is identified by
1. A Link for Classic Bluetooth,
2. An Access Address for Bluetooth low energy.
The link ID is a number that the ComProbe software assigns to identify a pair of devices in a BR/EDR connection. In
the Frame Display details pane, the Baseband layer contains the link ID field if the field’s value is not 0.
An Access Address is contained in every Bluetooth low energy packet. The Access Address identifies a connection
between a slave and a master or an advertising packet.
Connection filtering displays only the frames, protocols, summary, details, and events for the selected
connections.
Note: Connection Filters are not persistent across sessions.
- 116 -
Chapter 4 Capturing and Analyzing Data
ComProbe BPA 600 User Manual
4.4.1.13.2.1 Creating a Connection Filter
In the Frame Display there are four ways to create a connection filter.
From the Frame Display Filter menu
Click on the Frame Display Filter menu Connection Filter selection. From the drop down menu, select
Classic or Bluetooth low energy. The options are
l
l
l
Classic Bluetooth:
o
All will filter in all Classic Bluetooth frames. You are in effect filtering out any Bluetooth low energy frames
and are selecting to filter in all the Classic Bluetooth links.
o
Links displays all the master-slave links. You can select only one link to filter in. The selected link will filter
in only the frames associated with that link.
Bluetooth low energy:
o
All will filter in all Bluetooth low energy frames. You are in effect filtering out any Classic Bluetooth frames
and are selecting to filter in all Bluetooth low energy access addresses.
o
Access Addresses displays all the low energy slave device's access address. You can select only one
access address to filter. The selected link will filter in only the frames associated with that access address.
802.11:
o
l
All will filter in all 802.11 frames. You are in effect filtering out any other technology frames.
HCI:
o
All will filter in all HCI frames. You are in effect filtering out any other technology frames.
Figure 4.37 - Connection Filter from the Frame Display Menu
From the Frame Display toolbar
Right-click anywhere in the toolbar and select Connection Filter from the pop-up menu. The procedure for
creating a connection filter are identical as described in From the Frame Display Filter menu, above.
- 117 -
ComProbe BPA 600 User Manual
Chapter 4 Capturing and Analyzing Data
Figure 4.38 - Connection Filter from the Frame Display Toolbar right-click
From the Frame Display panes
Right-click anywhere in a Frame Display pane and select Connection Filter in the pop-up menu. The procedure
for creating a connection filter are identical as described in From the Frame Display Filter menu, above.
Figure 4.39 - Connection Filter from the Frame Display Pane right-click
From the Frame Display frame selection
Select a frame in the summary pane. Right-click and select Connection Filter in the pop-up menu. The
procedure for creating a connection filter are identical as described in From the Frame Display Filter menu,
above.
If the frame you have selected is associated with a Classic Bluetooth link or a Bluetooth low energy access address,
an additional pop-up menu item will appear as shown in the example image below. This selection is a
predetermined filter based on your selection. In the example, frame "6471" is associated with "Link 4", so the
predetermined filter assumes that you may want create a connection filter for that link. Clicking on Connection
Filter Link = 4 will filter in "Link 4" frames without opening all the drop-down menus.
- 118 -
Chapter 4 Capturing and Analyzing Data
ComProbe BPA 600 User Manual
Figure 4.40 - Connection Filter from frame selection right-click
Creating from any Frame Display window
A Connection Filter can be created from any open Frame Display window, and the filtering will always be applied
to the original captured data set.
4.4.1.13.2.2 Connection Filter Display
Once you have selected which connections to filter in, another Frame Display will open. The original Frame
Display will remain open, and can be minimized.
Note: The system currently limits the number of frame displays to 5. This limit includes any Frame
Displays opened using Duplicate View
from the Toolbar (see Working with Multiple Frame
Displays on page 97)
The new Frame Display with the filtered connection frames will only contain the data defined by the filter criteria.
That is, the criteria could be a single link or data for a particular technology.
- 119 -
ComProbe BPA 600 User Manual
Chapter 4 Capturing and Analyzing Data
Display Example 1: Bluetooth low energy Access Address selected
Figure 4.41 - Front Display: Filtered on Access Address 0x8e89bed6
In the figure above is an example Bluetooth low energy data set connection filtered on Access Address =
0x8e89bed6. The Frame Display in the front is the filtered data set. One way to note the difference between the
original and the filtered display is to observe the Protocol Tabs. In the filtered display there are four low energy
protocol tabs as compared to nine in the original display. This access address connection is not using five of the
protocols.
From any open Frame display the user can set another Connection Filter based on the original data set.
Display Example 2: All 802.11 data filtered in
In this example, there is a capture file with Classic Bluetooth, Bluetooth low energy, and 802.11. To view just the
802.11 data set, 802.11 = All is selected from the right-click pop up menu.
- 120 -
Chapter 4 Capturing and Analyzing Data
ComProbe BPA 600 User Manual
Figure 4.42 - Unfiltered: Capture File with Classic, low energy, and 802.11
When the Frame Display with the filtered 802.11 data set appears, only the Protocol Tabs for 802.11 are present
and the tabs for Classic Bluetooth and Bluetooth low energy have been filtered out.
Figure 4.43 - Connection Filter selecting All 802.11 frames, front
4.4.1.13.3 Protocol Filtering from the Frame Display
4.4.1.13.3.1 Quick Filtering on a Protocol Layer
On the Frame Display , click the Quick Filtering icon
or select Quick Filtering from the Filter menu.
This opens a dialog that lists all the protocols discovered so far. The protocols displayed change depending on the
data received.
- 121 -
ComProbe BPA 600 User Manual
Chapter 4 Capturing and Analyzing Data
Figure 4.44 - Frame Display Quick Filtering and Hiding Protocols Dialog
The box on the left is Protocols To Filter In. When you select the checkbox for a protocol in the Protocols to
Filter In, the Summary pane will only display those frames that contain data from that protocol.
If you filter on more than one protocol, the result are all frames that contain at least one of
those protocols. For example, if you filter on IP and IPX NetBIOS, you receive all frames that
contain either IP or IPX NetBIOS (or both). A Quick Filter tab then appears on the Frame
Display. Changing the filter definition on the Quick Filter dialog changes the filter applied on the Quick Filter
tab. Quick filters are persistent during the session, but are discarded when the session is closed.
The box in the center is the Protocols To Hide. When you select the checkbox for a protocol in the Protocols
To Hide, data for that protocol will not appear in the Decode, Binary, Radix, and Character panes. The
frames containing that type data will still appear in the Summary pane, but not in the Decode, Binary, Radix,
and Character panes.
The box on the right is the Named Filters. It contains filters that you create
using the Named Filter and Set Condition dialogs. When you select the
checkbox for the Name Filters, a tab appears on the Summary Pane that
displays the frame containing the specific data identified in the filter. The
named Filter tab remains on the Frame Display Summary
Pane unless you hide it using the Hide/Show Display Filters
dialog.
With low energy, the Configured BT Low energy devices and Exclude NULLS
and POLLs are default named filters.
Check the small box next to the name of each protocol you want to filter in,
hide, or Named Filter to display.
Then click OK
4.4.1.13.3.2 Easy Protocol Filtering
There are two types of easy protocol filtering. The first method lets you filter on the protocol shown in the
Summary pane, and the second lets you filter on any protocol discovered on the network so far.
- 122 -
Chapter 4 Capturing and Analyzing Data
ComProbe BPA 600 User Manual
4.4.2 BPA 600 Baseband Layer Signal Strength
The BPA 600 calculates the ‘Signal Strength’ value, a representation of the radio signal strength relative to the
position of the sniffer, for every Bluetooth® packet that it captures. The Signal Strength is not the true RSSI
observed at the Bluetooth devices in the network being sniffed.
The Signal Strength is a value in the range from 1 through 14 with 1 being weakest and 14 being strongest . The
BPA 600 firmware uses the built-in radio firmware features to calculate the Signal Strength value of the signal
received at the ComProbe hardware. This calculated value is then mapped to the range of 1 to 14. This is an
arbitrary range and does not have any units.
The Signal Strength value is shown as an additional decoded field in the Baseband layer. The field is called “Signal
Strength at Sniffer” and will have a value in the range of 1 to 14 decimal. A value of 15 means that the signal
strength was not reported. The field is also visible in the Summary Pane of the Frame Display.
4.4.3 Bluetooth Timeline
In addition to the Coexistence View, which displays both Bluetooth® and 802.11 data together, you can also see
more information about Bluetooth in a separate dialog. The Bluetooth Timeline displays packet information with
an emphasis on temporal information and payload throughput. The timelines also provide selected information
from Frame Display.
The timelines provide a rich set of diverse information about Bluetooth packets, both individually and as a range.
Information is conveyed using text, color, graphic size, line type, and position.
Figure 4.45 - Bluetooth Timeline window
You access the Bluetooth Timeline by selecting Bluetooth Timeline from the Control window View menu
or by clickingthe Bluetooth Timeline icon
on the Control window toolbar or Frame Display.
- 123 -
ComProbe BPA 600 User Manual
Chapter 4 Capturing and Analyzing Data
4.4.3.1 Bluetooth Timeline Packet Depiction
Figure 4.46 - Bluetooth Timeline Packet Depiction with Packet Information Shown
l
l
l
The timeline shows Bluetooth packets within a specific period of time.
The time segments flow left to right and down, following a complete row across. Then you move down to the
next row, go across, then down to the next row, just like reading a book, upper left corner to lower right
corner.
Within each row are two divisions: M (master) and S (Slave). Packets are placed on M or S depending on the
data's role.
l
Placing the mouse pointer on a packet displays information about that packet in an information box.
l
Selecting a packet by clicking on it shows information about that packet above the timeline.
l
l
l
You can use the arrow keys to move to the next or previous packet. You can select multiple packets by
dragging within the timeline or by holding the SHIFT key down while arrowing.
Using the mouse scroll wheel scrolls the timeline vertically. You can also zoom by using a right click (which
displays specific magnification values), using the + and - Zoom tools, or by selecting a value from the Zoom
menu.
Packet height indicates speed (1, 2, or 3 Mbits/sec). Packet length indicates duration (for reference, the
duration of a slot is 625-µs). Packet height and length together indicate size (speed times duration).
A packet is drawn using the following components:
- 124 -
Chapter 4 Capturing and Analyzing Data
l
l
l
l
ComProbe BPA 600 User Manual
A “max packet on wire reference” rectangle (light solid lines). This indicates the packet in the air with a max
payload.
A “max actual payload reference” rectangle (dark solid lines). This indicates a max payload as would be
extracted by the receiving device (if the payload in the air contains forward error correction (FEC), it is longer
than the actual payload). The position of the beginning of the rectangle indicates where the payload begins in
time.
An “actual payload” colored sub-rectangle (packet category-specific; blue here). This indicates the actual
received payload with FEC (if any) removed. It is the beginning portion of the “max actual payload reference”
rectangle. If the actual payload is of max size, the entire “max actual payload reference” rectangle is colored.
An “unused payload reference” sub-rectangle (always white). This indicates the unused portion of a maximum
payload. It is the remaining portion of the “max actual payload reference” rectangle. The packet in the air does
- 125 -
ComProbe BPA 600 User Manual
Chapter 4 Capturing and Analyzing Data
not leave room for this. It is indicated for reference only.
l
l
A “max speed reference” rectangle (dashed lines). This is used to extend the height to that of a 3 Mbits/sec
packet, and appears only for packets whose speed is less than that. The packet shown here has a speed of 1
Mbit/sec because the height of the other rectangles is 1/3 of the total height.
The part of the “max packet on wire reference” rectangle (light solid lines) that trails the “max actual payload
reference” rectangle (dark solid lines) is partly packet in the air (if the payload on the wire contained FEC) and
partly trailer (CRC, etc). There is always a trailer, so there is always a little space (subject to round off error and
pixel granularity) between the ends of the two rectangles.
This table shows how packets are colored:
Table 4.7 - Packet Type Colors
Packet Category
Packet Types
Color
ALC
DM1, DM3, DM5, DH1,
2-DH1, 3-DH1, DH3,
2-DH3, 3-DH3, DH5,
2-DH5, 3-DH5, AUX1
Black
SCO
HV1, HV2, HV3, DV
Pink
- 126 -
Chapter 4 Capturing and Analyzing Data
ComProbe BPA 600 User Manual
Table 4.7 - Packet Type Colors (continued)
Packet Category
Packet Types
Color
eSCO
EV3, 2-EV3, 3-EV3, EV4, Purple
EV5, 2-EV5, 3-EV5
LMP*
DM1, DV
Dark Blue
FHS
FHS
Light Blue
NULL
NULL
Light Gray
POLL
POLL
Light Brown
Filler
Filler provided by
ComProbe software
Dark Gray
*LMP is a protocol layer that uses either DM1 or DV packets. If a packet
has an LMP layer, the LMP color is used instead of the packet type color.
This table summarizes the various ways in which packet information is presented:
Table 4.8 - Packet Information Presentation
Graphic
Information
Text
Color
size
Packet Type
Position
X
Packet Category
X
Protocol
X
X
Time of occurence
X
X
Source device
X
X
Duration
X
Size in bytes
X
X
Size as a percent of max size for
that packet type
X
X
Speed
Status
X
X
X
4.4.3.2 Bluetooth Timeline Packet Navigation and Selection
l
l
Buttons, menu items, and keystrokes can be used to go to the next or previous packet, next or previous error
packet, next or previous retransmitted packet (Bluetooth only), and the first or last packet.
If there is no selected packet in the timeline, First Packet
are enabled, but Previous Packet
is not.
- 127 -
, Next Packet
, and Last Packet
ComProbe BPA 600 User Manual
l
l
l
l
l
l
l
Chapter 4 Capturing and Analyzing Data
A single packet is selected either by clicking on it, navigating to it, or selecting it in the Frame Display.
Selecting a packet activates Previous Packet.
Selecting Previous Packet with a packet that is currently not visible, places it in the top row (i.e. the display
scrolls up just enough to make it visible).
Selecting Next Packet with a packet that is currently not visible, places it in the bottom row (i.e. the display
scrolls down just enough to make it visible).
Selecting Previous Packet or Next Packet for a packet that’s currently visible selects it without scrolling.
Multiple packets are selected either by dragging the mouse or by holding down the shift key while navigating
or clicking.
When a single packet is selected in the timeline, it is also becomes selected in the Frame Display. When
multiple packets are selected in the timeline, only one of them is selected in the Frame Display.
The left arrow key goes to the previous packet. The right arrow key goes to the next packet. The Ctrl-left
arrow key goes to the previous error packet. The Ctrl-right arrow key goes to the next error packet.
4.4.3.3 Bluetooth Timeline Toolbar
The toolbarbar contains the following:
Lock - The Lock button only appears in live mode and is automatically depressed when the user
scrolls.
Unlock
First Packet
Previous Packet
Next Packet
Last Packet
Previous Retransmitted Packet
Next Retransmitted Packet
Previous Error Packet
Next Error Packet
Zoom In - Click on the icon each time to zoom in from 4800 slots to 12 slots
- 128 -
Chapter 4 Capturing and Analyzing Data
ComProbe BPA 600 User Manual
Zoom Out - Click on the icon each time to zoom out from 12 slots to 4800 slots
Reset - The Reset button appears only in live mode. Reset causes all packet data up to that point to
be deleted from the Packet Timeline display. This does not affect the data in Frame Display.
Resetting the display may be useful when the most recent throughput values are of interest.
4.4.3.4 Bluetooth Timeline Menu Bar
The Bluetooth Timeline menu bar contains the following:
Table 4.9 - Bluetooth Timeline Menus
Menu
File
Selection
Description
Reset
Resets Timeline to display beginning at current frame. Available only in Live
mode.
Exit
Closes the timeline window
- 129 -
ComProbe BPA 600 User Manual
Chapter 4 Capturing and Analyzing Data
Table 4.9 - Bluetooth Timeline Menus (continued)
Menu
Zoom
Selection
Zoom In
Description
Displays less of the timeline, but in greater detail.
Keyboard Shortcut: (Ctrl +)
Zoom Out
Displays more of the timeline, in less detail.
Keyboard Shortcut: (Ctrl -)
Zoom In Tool
Zoom Out
Tool
Displays a magnifying glass icon with a + and an arrow that allows
for precise positioning on the timeline. Clicking will show less of the
timeline around the point where the tools is clicked.
Similar to the Zoom In Tool except with a "-" sign in the magnifying glass, and
clicking will show more of the timeline around the point where the tool is
clicked.
Selection Tool
12 Slots (3x4) Display 12 timeline slots arranged in (row x time slots), that is, three row with
4 time slots.
36 Slots (6x6) Displays 36 slots.
144 Slots
(12x12)
Displays 144 slots
324 Slots
(18x18)
Displays 324 slots
576 Slots
(24x24)
Displays 576 slots
900 Slots
(30x30)
Displays 900 slots
1296 Slots
(36x36)
Displays 1296 slots
1764 Slots
(42x42)
Displays 1764 slots
2304 Slots
(48x48)
Displays 2304 slots
2916 Slots
(54x54)
Displays 2916 slots
3600 Slots
(60x60)
Displays 3600 slots
4356 Slots
(66x66)
Displays 4356 slots
5184 Slots
(72x72)
Displays 5184 slots
- 130 -
Chapter 4 Capturing and Analyzing Data
ComProbe BPA 600 User Manual
Table 4.9 - Bluetooth Timeline Menus (continued)
Menu
Selection
Navigate
First Packet
Description
Goes to the first packet.
Keyboard Shortcut: Home
Last Packet
Goes to the last packet.
Keyboard Shortcut: End
Previous
Packet
Goes to the packet prior to the currently selected packet.
Next Packet
Goes to the next packet after the currently selected packet.
Keyboard Shortcut: Left Arrow
Keyboard Shortcut: Right Arrow
Previous
Goes to the previous retransmitted packet from the currently selected packet.
Retransmitted If there is no previous retransmission this item is not active.
Packet.
Next
Goes to the next retransmitted packet from the currently selected packet. If
Retransmitted there are no retransmitted packets following the current selection, this item is
Packet
not active.
Previous Error Goes to the first error packet prior to the current selection. If there are no error
packets available, this item is not active.
Packet
Keyboard Shortcut: Ctrl+Left Arrow
Next Error
Packet
Goes to the first error packet following the current selection. If there are no
error packets available, this item is not active.
Keyboard Shortcut: Ctrl+Right Arrow
Toggle
Display Lock
Available only in Live mode.
To prevent timeline scrolling during capture, click on this time and the display will
lock in its current position. Capture will continue but the displays will remain
static.
To resume scrolling during capture, click again on this menu item.
Throughput Export
Payload
throughput
over time.
Save a comma-separated values (.csv) file that contains information about
the Payload Throughput Over Time graph
Export Object Save a comma-separated values (.csv) file that contains information about objects
in the timeline.
Throughput
Stats
Assumes at most one object transfer per capture.
Help
Help Topics
Displays Bluetooth Timeline help topics.
4.4.3.5 Bluetooth Timeline Visual Elements
The Bluetooth Timeline consists of the following visual elements:
- 131 -
ComProbe BPA 600 User Manual
Chapter 4 Capturing and Analyzing Data
l
The timeline shows Bluetooth packets within a specific period of time.
l
The timeline shows Bluetooth packets within a specific period of time.
l
l
The time segments flow left to right and down, following a complete row across. Then you move down to the
next row, go across, then down to the next row, just like reading a book, upper left corner to lower right
corner.
Within each row are two divisions: M (master) and S (Slave). Packets are placed on M or S depending on
source of the data withing the link.
l
Placing the mouse pointer on a packet displays information about that packet in an information box.
l
Selecting a packet by clicking on it shows information about that packet above the timeline.
l
l
l
l
l
l
l
You can use the arrow keys to move to the next or previous packet.You can select multiple packets by
dragging within the timeline or by holding the SHIFT key down while arrowing.
Using the mouse scroll wheel scrolls the timeline vertically. You can also zoom by using a right click (which
displays specific magnification values), using the + and - Zoom tools, or by selecting a value from the Zoom
menu.
Packet height indicates speed (1, 2, or 3 Mbits/sec). Packet length indicates duration (for reference, the
duration of a slot is 625-µs). Packet height and length together indicate size (speed times duration).
Rows of Bluetooth Slots: Each slot begins at the left edge of the vertical blue bar. There are two Bluetooth
clocks per slot. Each slot represents 0.000625 seconds, or 625 µs.
‘M’ and ‘S’ labels: Within each row, master and slave packets are indicated on the left side of the row. By
default, all possible slave devices (there can be up to 7) are put on the S sub-row, but checking the Show
slave LT_ADDR checkbox shows all existing slave device sub-rows with numbered labels (some or all of S1,
S2, …, S7).
Bluetooth Clock: The Bluetooth clock of the first slot in each row is shown underneath each row.
Packet Info Line: The packet info line appears just above the timeline and displays information for the
currently selected packet(s). If only one packet is selected, this information consists of the packet number,
packet type, Bluetooth clock (Bluetooth only), Timestamp, and Duration. Duration is shown as
"Unknown" when the selected packet has an error.
If multiple packets are selected, this information consists of the packet range, the Bluetooth clock delta
(Bluetooth only), the Timestamp delta, and Span. Span is shown as "Unknown" when the last packet in the
selected range has an error since its duration is unknown. A user can use these to verify the average
throughput calculations.
Selected packets are bounded by a magenta rectangle. See the Packet Navigation and Selection section.
l
Floating Information Window (aka Tooltip): The information window displays when the mouse cursor hovers
on a packet (not slot). It persists as long as the mouse cursor stays on the packet or tooltip. For Bluetooth, the
tooltip shows the packet number (in bold), the Baseband layer decode from the decode pane of the Frame
Display (with the percentage of the Payload Length max added).
Discontinuities are indicated by cross-hatched slots. See the Discontinuities section.
- 132 -
Chapter 4 Capturing and Analyzing Data
l
l
l
l
l
l
l
ComProbe BPA 600 User Manual
Zoom Tools: Zoom tools zoom in or out while maintaining the position on the screen of the area under the
zoom tool. This makes it possible to zoom in or out for a specific packet or area of the timeline. See the
“Zooming” section.
Packet Status: Packet status is indicated by color codes. A yellow slot indicates a re-transmitted packet, a dark
red slot indicates a CRC error, and a small red triangle in the upper-left corner of the packet (not the slot)
indicates a decode error.
Right-Click Menu: The right-click menu provides zooming and tool selection. See the “Zooming” section.
Graphical Packet Depiction: Each packet within the visible range is graphically depicted. See the “Packet
Depiction” section.
Swap Button: The Swap button switches the position of the Timeline and the Throughput graph.
Show Running Average: Selecting this check box shows a running average in the Throughput Over Time graph
as an orange line.
Show slave LT_ADDR: Selecting this checkbox displays the Slave LT_ADDR in the timeline row labels
Note: The raw timestamp value is the number of 100-nanosecond intervals since the beginning of
January 1, 1601. This is standard Windows time.
4.4.3.6 Bluetooth Timeline Zooming
Zoom features can be accessed from the Zoom menu, clicking a zoom tool on the toolbar, or by right clicking on
the Timeline window.
A couple of things to remember about Zooming.
l
l
l
Zoom tools accessed using the right click menu allow you to maintain the current position on the screen and
precisely zoom in to a specific packet.
Selecting a Zoom icon (+ or -) on the toolbar does not change the pointer to a Zoom tool. Each distinct click
only zooms in our out.
Zoom tools accessed from the Zoom menu have a pointer in
the upper-left corner which is useful for specifying the zoom
location and bringing up a tool tip of a specific packet.
4.4.3.7 Bluetooth Timeline Throughput Displays
In computing throughput, payload is not counted from Bluetooth packets that have a CRC error (dark red slot) or
that are a retransmission (yellow slot).
- 133 -
ComProbe BPA 600 User Manual
Chapter 4 Capturing and Analyzing Data
4.4.3.7.1 Bluetooth Timeline Average Payload Throughput
The figure depicts the Throughput display with the Average Throughput
indicators in the left column.
Average Throughput is the total payload over the entire session divided
by the total time. Total time is calculated by taking the difference in
timestamps between the first and last packet. In Bluetooth, timestamp
difference is used instead of Bluetooth clock count because timestamp difference is immune to role switches.
However, this can result in inaccuracies when the duration is small enough that a coarse timestamp granularity is
significant.
l
l
l
Average Throughput is shown as 0 when there is only one packet, because in that case the timestamp
difference is 0 and an average cannot be computed.
Duration is the beginning of the first packet to the end of the last packet.
Duration for average throughput is beginning of first packet to end of last packet. If a single packet is selected,
the duration of that packet is used.
l
Average Throughput is shown for all devices, master devices, and slave devices.
l
A horizontal bar indicates relative percentage. Text displays the throughput value.
4.4.3.7.2 Bluetooth Timeline 1 Second Throughput Indicators
1-Second Payload Throughput is the total payload over the most
recent one second of duration (This is determined by counting
Bluetooth clocks). It is cleared after each discontinuity. A discontinuity
is when the Bluetooth clock goes forward more than two (2) seconds
or goes backwards any amount. This is caused by either a role switch
or Bluetooth clock rollover . The Bluetooth clock count is used
instead of timestamp difference because the Bluetooth clock count is precise; however, if timestamp
difference were used it would not be necessary to clear the 1-second throughput after each discontinuity.
Note: The raw timestamp value is the number of 100-nanosecond intervals since the beginning of January 1,
1601. This is standard Windows time.
l
l
1-second throughput is not an average. It is simply the total payload over the most recent one second of
duration. Since it’s not an average, it behaves differently than average throughput. In particular, while average
throughput can be very large with only a couple of packets (since it’s dividing small payload by small time), 1second throughput is very small (since it counts only what it sees and doesn't try to extrapolate).
l
A 1-second throughput is shown for all devices, master devices, and slave devices.
l
A horizontal bar indicates percentage of max, and text gives the actual throughput.
4.4.3.7.3 Average Payload Throughput (bits/s) (Selected)
The following figure depicts the Throughput display with the Average Payload Throughput (bits/sec)
(Selected) indicators in the left column. This portion of the dialog displays average throughput for a selected
packet range when you select a packet from the Timeline.
- 134 -
Chapter 4 Capturing and Analyzing Data
ComProbe BPA 600 User Manual
Average throughput is the total payload over the entire
session divided by the total time. Total time is calculated by
taking the difference in timestamps between the first and
last packet. In Bluetooth, timestamp difference is used
instead of Bluetooth clock count because timestamp
difference is immune to role switches. However, this can
result in inaccuracies when the duration is small enough that a coarse timestamp granularity is significant.
l
Duration for average throughput is beginning of first packet to end of last packet. If a single packet is selected,
the duration of that packet is used.
l
Average throughput can be nonzero when a single packet is selected.
l
Average throughput is shown for all devices, master devices, and slave devices.
l
A horizontal bar indicates relative percentage. Text displays the throughput value
4.4.3.7.4 Bluetooth Payload Throughput Over Time Graph
The following figure depicts the Payload Throughput Over Time graph.
The Payload Throughput Over Time graph shows
total payload for each successive time interval.
The time interval is initially 0.1 second. Each time
the number of throughput elements reaches
100, they are collapsed into a set of 50 by
combining adjacent elements and doubling the
duration of each element. Collapsing thus occurs
as follows:
l
l
Th
e bottom of the graph shows a beginning time and an ending time.
The beginning time is relative to the start of the session and initially
0. When packets start wrapping out it becomes the relative time
offset of the first available packet. The ending time is always the
total time of the session.
Discontinuities are indicated by vertical dashed lines.
A green view port indicates the time range corresponding to the
visible slots in the timeline. The view port can be moved by clicking
elsewhere in the graph or by dragging. Whenever it is moved, the
timeline scrolls to match. When the slot range in the timeline changes, the view port moves and resizes as
necessary to match.
l
l
l
l
The Swap button - switches the position of the Timeline and the Throughput graph.
Show Running Average - Selecting this check box shows a running average in the Throughput Over
Time graph as an orange line.
Show slave LT_ADDR - Selecting this checkbox displays the Slave LT_ADDR in the timeline row labels.
Comparison with the Coexistence View Throughput Graph
- 135 -
ComProbe BPA 600 User Manual
Chapter 4 Capturing and Analyzing Data
The throughput graphs for Classic Bluetooth in the Coexistence View and the Bluetooth Timeline can look quite
different even though they are plotting the same data. The reason is that the Coexistence View uses timestamps
while the Bluetooth Timeline uses Bluetooth clocks, and they do not always match up exactly. This mismatch can
result in the data for a particular packet being included in different intervals in the two throughput graphs, and can
have a significant impact on the shapes of the two respective graphs. This can also result in the total duration of
the two throughput graphs being different.
Another factor that can affect total duration is that the Bluetooth Timeline’s throughput graph stops at the last
Classic Bluetooth packet while the Coexistence View’s Throughput Graph stops at the last packet regardless
of technology.
4.4.3.8 Export Payload Throughput Over Time
In the Bluetooth Timeline you can create and save a comma-separated values (.csv) file that contains information
about the Payload Throughput Over Time graph. The file contains the following information:
l
Sequence Number
l
Beginning Packet
l
Ending Packet
l
Bit Count
l
Duration (Secs)
l
Bits/Sec
l
Running Average (Bits/Sec)
To create the file:
1. Select Export Payload Throughput Over Time from
the Throughput menu.
The Save As menu appears.
2. Select a location where you want to save the file.
Note: In live mode, default path name is
C:\Users\Public\Public Documents\Frontline Test Equipment\My Log
Files\PayloadThroughputOverTime.csv. In view mode, default path name is cfa
basepathname with " (PayloadThroughputOverTime).csv" appended.
3. Enter a File Name.
4. Select Save.
The file is saved and you can open it in a simple text editor or database application.
4.4.3.9 Object Throughput Stats File
In the Bluetooth Timeline you can create and save a comma-separated values (.csv) file that contains information
about objects in the timeline. The file contains the following information:
l
Name
l
Length (bytes)
- 136 -
Chapter 4 Capturing and Analyzing Data
ComProbe BPA 600 User Manual
l
Connection Packet Number
l
Begin Transfer Packet Number
l
End Transfer Packet Number
l
Disconnection Packet Number
l
Connection Duration
l
(Fractional Seconds)
l
Transfer Duration
l
(Fractional Seconds)
l
Connection Throughput (bits/s)
l
Transfer Throughput (bits/s)
l
Transfer Duration Percentage of Connection Duration
l
No Errors Packet Count (Includes Decode Errors) (While Connected)
l
Retransmitted Packet Count (While Connected)
l
Header Errors Packet Count (While Connected)
l
Payload/CRC Errors Packet Count (While Connected)
To create the file:
1. Select Export Object Throughput Stats from the
Throughput menu.
The Save As menu appears.
2. Select a location where you want to save the file.
Note: In live mode, the default path name is
C:\Users\Public\Publick Documents\Frontline Test Equipment\My Log
Files\ObjectThroughputStats.csv. In view mode, default path name is cfa basepathname
with " (ObjectThroughputStats).csv" appended.
3. Enter a File Name.
4.
Select Save.
The file is saved and you can open it in a simple text editor or database application
4.4.3.10 Bluetooth Timeline Discontinuities
The following figure depicts a discontinuity between two packets.
- 137 -
ComProbe BPA 600 User Manual
Chapter 4 Capturing and Analyzing Data
Figure 4.10 Bluetooth Timeline Packet Discontinuity, cross-hatched area.
To keep the timeline and the throughput graph manageable, big jumps in the Bluetooth clock are not represented
linearly. Instead, they are shown as discontinuities. A discontinuity is said to exist when the Bluetooth clock goes
forward more than two (2) seconds or backwards any amount. A discontinuity is indicated by a cross-hatched slot
in the timeline and a corresponding vertical dashed line in the throughput graph. The Bluetooth clock can jump
forward when capture is paused or when there is a role switch (in a role switch, a different device becomes
master, and since each device keeps its own Bluetooth clock, the clock can change radically), and backwards when
there is a role switch or clock rollover
Note: The raw timestamp value is the number of 100-nanosecond intervals since the beginning of
January 1, 1601. This is standard Windows time.
4.4.3.11 Legend
This legend identifies the color coding found in the timeline.
4.4.3.12 Bluetooth Timeline: Packets Missing Bluetooth Clock
Captured data that is missing the Bluetooth clock, such as HCI and BTSnoop, will not display packets. In an instance
when the data is missing the clock the Bluetooth Timeline will display a message in the Throughput Graph and the
Timeline: "Packets without a Bluetooth clock (such as HCI) won't be shown."
- 138 -
Chapter 4 Capturing and Analyzing Data
ComProbe BPA 600 User Manual
Figure 4.47 - Missing packets message in timeline pane.
4.4.4 low energy Timeline
The Bluetooth low energy Timeline displays packet information with an emphasis on temporal information
and payload throughput. The timeline also provides selected information from Frame Display.
The timeline provides a rich set of diverse information about low energy packets, both individually and as a range.
Information is conveyed using text, color, packet size, and position.
Figure 4.48 - Bluetooth low energy Timeline
- 139 -
ComProbe BPA 600 User Manual
Chapter 4 Capturing and Analyzing Data
You access the Timeline by selecting Bluetooth low energy Timeline from the View menu or by pressing the
Bluetooth low energy Timeline icon
on the Control window toolbar and Frame Display toolbar.
In computing throughput, packets that have a CRC error are excluded.
4.4.4.1 low energy Timeline Toolbar
The toolbar contains the following:
Table 4.11 - Bluetooth low energy Timeline Toolbar
Icon
Description
Lock - The Lock button only appears in live mode and is automatically depressed when the user
scrolls.
Unlock
First Packet
Previous Packet
Next Packet
Last Packet
Previous Interframe Spacing (IFS) Error
l
l
Interframe Spacing is considered valid if it is within 150 μs + or – 2us
If the Interframe Spacing is less than 148 us or greater than 152 us but less than or equal to 300 μs,
it is considered an IFS error.
Next Interframe Spacing (IFS) Error
l
l
Interframe Spacing is considered valid if it is within 150 μs + or – 2us
If the Interframe Spacing is less than 148 us or greater than 152 μs but less than or equal to 300 us,
it is considered an IFS error.
Previous Error Packet
Next Error Packet
Zoom In
Zoom Out
- 140 -
Chapter 4 Capturing and Analyzing Data
ComProbe BPA 600 User Manual
Table 4.11 - Bluetooth low energy Timeline Toolbar (continued)
Icon
Description
Reset - The Reset button appears only in live mode. Reset causes all packet data up to that point
to be deleted from the Packet Timeline display. This does not affect the data in Frame Display.
Resetting the display may be useful when the most recent throughput values are of interest.
4.4.4.2 low energy Timeline Menu Bar
The Bluetooth low energy Timeline menu bar contains the following:
Table 4.12 - Bluetooth low energy Timeline Menus
Menu
File
Format
Selection
Description
Reset
Resets Timeline to display beginning at current
frame. Available only in Live mode.
Exit
Closes the timeline window
Show Device Address Rows
Displays rows of packets from sending devices.
The source device address will appear on the left
of each row.
Show Radio Rows
Displays rows packets received on radios 0,1, or
2. The radio number will appear on the left of each
row.
- 141 -
ComProbe BPA 600 User Manual
Chapter 4 Capturing and Analyzing Data
Table 4.12 - Bluetooth low energy Timeline Menus (continued)
Menu
Zoom
Selection
Description
Zoom In
Displays less of the timeline, but in greater detail.
Keyboard Shortcut: (Ctrl +)
Zoom Out
Displays more of the timeline, in less detail.
Keyboard Shortcut: (Ctrl -)
Zoom In Tool
Displays a magnifying glass icon with a
+ and an arrow that allows for precise
positioning on the timeline. Clicking will
show less of the timeline around the
point where the tools is clicked.
Zoom Out Tool
Similar to the Zoom In Tool except with a "-" sign
in the magnifying glass, and clicking will show
more of the timeline around the point where the
tool is clicked.
Selection Tool
Single Segment Zoom: Each selection defines the time displayed, "1" segment, and number of
1.25 ms markers withing the segment.
2.5 ms (1x2)
Displays one 2.5 ms segment with 2 markers.
11.25 ms (1x9)
Displays one 11.25 ms segment with 9 markers.
33.75 ms (1x27)
Displays one 33.75 ms segment with 27 markers.
125 ms (1x100)
Displays one 125 ms segment with 100 markers.
437.5 ms (1x350)
Displays one 437.5 ms segment with 350
markers.
1.875 s (1x1500)
Displays one 1.875 s segment with 1500 markers.
3.75 s (1x3000)
Displays one 3.75 ms segment with 3000
markers.
Multiple Segment Zoom: Each selection defines the timeline view port, the number of segments,
and number of 1.25 ms markers withing the segment. For example, selecting "7.5 ms (6 1.25 ms
time intervals (3x2))" will display "7.5 ms" of the total timeline in "3" segments of with "2"
markers per segment for a total of "6" markers.
7.5 ms (6 1.25 ms time intervals (3x2))
3 segments, 2 markers per segment: 1.25 ms x 6
= 7.5 ms total; 1.25 ms x 2 = 2.5 ms per segment.
22.5 ms (18 1.25 ms time intervals (6x3))
6 segment, 3 markers per segment
90 ms (72 1.25 ms time intervals (12x6))
12 segments, 6 markers per segment
202.5 ms (162 1.25 ms time intervals
(18x9))
18 segments, 9 markers per segment
360 ms (288 1.25 ms time intervals (24x12)) 24 segments, 12 markers per segment
- 142 -
Chapter 4 Capturing and Analyzing Data
ComProbe BPA 600 User Manual
Table 4.12 - Bluetooth low energy Timeline Menus (continued)
Menu
Selection
562.5 ms (450 1.25 ms time intervals
(30x15))
Description
30 segments, 15 markers per segment
810 ms (648 1.25 ms time intervals (36x18)) 36 segments, 18 markers per segment
1.1025 s (882 1.25 ms time intervals
(42x21))
30 segments, 15 markers per segment
1.44 s (1152 1.25 ms time intervals (48x24)) 48 segments, 24 markers per segment
1.8225 s (1458 1.25 ms time intervals
(54x27))
45 segments, 27 markers per segment
2.25 s (1800 1.25 ms time intervals (60x30)) 60 segments, 30 markers per segment
2.7225 s (2178 1.25 ms time intervals
(66x33))
66 segments, 33 markers per segment
3.24 s (2592 1.25 ms time intervals (72x36)) 72 segments, 36 markers per segment
3.8025 s (30421.25 ms time intervals
(78x39))
78 segments, 39 markers per segment
4.41 s (3528 1.25 ms time intervals (84x42)) 84 segments, 42 markers per segment
5.0625 s (4050 1.25 ms time intervals
(90x45))
90 segments, 45 markers per segment
- 143 -
ComProbe BPA 600 User Manual
Chapter 4 Capturing and Analyzing Data
Table 4.12 - Bluetooth low energy Timeline Menus (continued)
Menu
Selection
Navigate First Packet
Description
Goes to the first packet.
Keyboard Shortcut: Home
Last Packet
Goes to the last packet.
Keyboard Shortcut: End
Previous Packet
Goes to the packet prior to the currently selected
packet.
Keyboard Shortcut: Left Arrow
Next Packet
Goes to the next packet after the currently selected
packet.
Keyboard Shortcut: Right Arrow
Previous Invalid IFS Packet.
Goes to the previous invalid IFS packet from the
currently selected packet. If there is no previous
invalid IFS packet this item is not active.
Next Invalid IFS Packet
Goes to the next invalid IFS packet from the
currently selected packet. If there are no invalid
IFS packets following the current selection, this
item is not active.
Previous Error Packet
Goes to the first error packet prior to the current
selection. If there are no error packets available, this
item is not active.
Keyboard Shortcut: Ctrl+Left Arrow
Next Error Packet
Goes to the first error packet following the current
selection. If there are no error packets available, this
item is not active.
Keyboard Shortcut: Ctrl+Right Arrow
Selected Packet
Keyboard Shortcut: Enter
Toggle Display Lock
Available only in Live mode.
To prevent timeline scrolling during capture, click on
this time and the display will lock in its current
position. Capture will continue but the displays will
remain static.
To resume scrolling during capture, click again on
this menu item.
Help
Help Topics
Displays Bluetooth low energy Timeline help
topics.
- 144 -
Chapter 4 Capturing and Analyzing Data
ComProbe BPA 600 User Manual
4.4.4.3 low energy Timeline Legend
This legend identifies the color coding found in the timeline.
l
l
When you select a packet in the timeline, items in the legend that relate to
the packet are highlighted.
Bold text indicates that the type of packet has been seen in the timeline.
4.4.4.4 Throughput Displays
Throughput is payload over time. There are 3 categories of throughput:
4.4.4.5 Average and 1 Second Packet Throughput
The figure depicts the Average and 1 Second Packet Throughput
displays. This display appears when you select the Packet
Throughput radio button.
l
Average Packet Throughput is the total packet size over the
entire session divided by the total time. Total time is calculated by
taking the difference in timestamps between the first and last packet.
l
1-Second Packet Throughput is the total packet size over the most recent one second.
l
Width = peak =: This displays the maximum throughput seen so far.
l
A horizontal bar indicates percentage of max seen up to that point, and text gives the actual throughput.
4.4.4.6 Average and 1 Second Payload Throughput
The figure depicts the Average and One Second Payload Throughput display. This display appears when
you select the Payload Throughput radio button.
l
Average Payload Throughput is the total payload over the entire session divided by the total time.
l
1-second Payload Throughputis the total payload over the most recent one second.
l
Width = peak =: This displays the maximum throughput seen so far.
Note: 1-second throughput behaves differently than average throughput. In particular, while
average throughput can be very large with only a couple of packets (since it’s dividing small
packet or payload size by small time), 1-second throughput can be very small since it divides
by an entire one second.
4.4.4.7 Throughput Graph
The following figure depicts the Throughput Graph.
- 145 -
ComProbe BPA 600 User Manual
Chapter 4 Capturing and Analyzing Data
Figure 4.49 - Bluetooth low energy Timeline Throughput Graph
The Swap button switches the position of the Timeline and the Throughput graph.
Selecting Throughput Display
l
l
l
Selecting Packet Throughput displays just the Packet Throughput in graph form and displays the
Average and Average and 1 Second Packet Throughput on the left side of the dialog. The y-axis numbers
appear in blue.
Selecting Payload Throughput displays just the Payload Throughput in graph form and displays the
Average and Average and 1 Second Payload Throughput on the left side of the dialog.. The y-axis numbers
appear in green.
Selecting Include MIC will include the transmitted 32 bit Message Integrity Check data in the throughput.
You may want to include Message Integrity Checks in your throughput even though MIC is not application data.
MICs are transmitted and you may want to included in the throughput as a measure of how active your radio
was.
In this example the 1 Second Payload
Throughput is 1,360 bits/sec when
Include MIC is not checked. By
checking the Include MIC box the
MIC data is included in the
throughput data and 1 Second
Payload Throughput increases to
1,840 bits/sec. This capture file has 15
MICs in the last second of the file. A
MIC is 32 bits for a total of 32 bits X 15
MICs = 480 bits.
The easiest way to view MIC data is
to use the Frame Display.
1. Using the Decoder pane
scroll through the frames
until LE Data shows
"Encrypted MIC".
2. Place the cursor on the
Encrypted MIC data and
while holding the left
- 146 -
Chapter 4 Capturing and Analyzing Data
ComProbe BPA 600 User Manual
mouse button drag the field to the Summary pane.
3. An Encrypted MIC column is added to the Summary pane.
Figure 4.50 - Creating Encrypted MIC in Frame Display Summary pane
4.4.4.8 The Timeline
The low energy Timeline shows Bluetooth packets within a specific period of time. Time is shown as one or
more contiguous segments. Within each segment are one or more source access address or radio rows.
Figure 4.51 - Bluetoothlow energy Timeline
4.4.4.9 How Packets Are Displayed
Bluetooth low energy packets are displayed in the low energy timeline in Segments and Rows.
- 147 -
ComProbe BPA 600 User Manual
l
Chapter 4 Capturing and Analyzing Data
Segments are "pieces" of the timeline. You can zoom in to show just one segment, or you can zoom out to
show multiple segments. In multiple segment displays the segments are contiguous from top to bottom.
Refer to the diagram below. The top-most segment contains the beginning timestamp on the left. The
timeline proceeds from left to right in a segment, and continues in the next segment down beginning on
the left of that segment. If you zoom out to show two segments the viewable timeline appears in those
two segments. You will use the scroll bar on the right to scroll through the timeline.
In a one-segment display the viewable timeline appears in that one segment. You will scroll through the
timeline using the scroll bar appearing at the bottom of the timeline display.
l
Rows show either the access address of the configured devices or of all discovered devices. Because the
segments are contiguous in multiple segment displays, the rows in each segment are identical.
In the following diagram we see a three segment display showing the timeline flow.
Figure 4.52 - Diagram of low energy Timeline Flow with Segment and Row Relationship
l
Rows can display either source device access addresses or the three radios receiving the data..You choose
with methods by selecting Show Device Address Rows or Show Radio Rows from the Format menu.
4.4.4.10 Format Menu
Show Device Address Rows will display rows of packets
from sending devices. The source device address will appear
on the left of each row.
Show Radio Rows will display rows packets received on
radios 0,1, or 2. The radio number will appear on the left of
each row.
o
The Addr rows display packets sent by that access address for all devices or configured devices. You select
All Devices or Configured Devices using the radio buttons.The address shown is the access address
for the device.
- 148 -
Chapter 4 Capturing and Analyzing Data
ComProbe BPA 600 User Manual
Figure 4.53 - Device Address Rows
o
The Radio rows display packets received by that radio ( 0, 1, or 2).
Figure 4.54 - Radio Rows
l
l
l
l
The mouse wheel scrolls the timeline horizontally when displaying a single segment, and scrolls vertically
when displaying multiple segments
You can also zoom by using the right-click menu (which displays magnification values), using the + and - Zoom
buttons on the toolbar, or by selecting a value from the Zoom menu.
Packet length indicates duration
The Timeline and Frame Display are synchronized so the packet range selected by the user in one is
automatically selected in the other. For the selected packet range, the Timeline shows various duration
values (Gap, Timestamp Delta, and Span), but only if both the first and last packet in the range are available
in the Timeline. If not, those values are shown as “n/a”. Packets that are not displayed in the Timeline are
Sniffer Debug packets, non-LE packets (e.g. WiFi), and packets that are not from a Configured Device the
Configured Devices radio button is checked.
- 149 -
ComProbe BPA 600 User Manual
Chapter 4 Capturing and Analyzing Data
Figure 4.55 - low energy Timeline and Frame Display Packet Synchronization
4.4.4.11 low energy Timeline Visual Elements
The low energy Timeline consists of the following visual elements:
l
Time Markers - Time markers indicated by vertical blue lines are shown at 1.25 ms intervals. The markers are
provided to help visualize the timescale and are also useful when using dual-mode chips that do BR/EDR and
LE at the same time. Time markers snap to the beginning of the first data packet by default, but they can be
snapped to the beginning or end of any packet by right-clicking on a packet and selecting Align Time Marker
to Beginning of Packet or Align Time Marker to End of Packet. All other markers will shift relative to
that new reference point.
Figure 4.56 - Timeline Markers Shown Snapped to End of Packet
l
Timestamp - The beginning and ending timestamp for each segment is displayed beneath each segment.
When showing multiple segments the beginning timestamp is the same as the ending timestamp of the
- 150 -
Chapter 4 Capturing and Analyzing Data
ComProbe BPA 600 User Manual
previous segment.
In addition to the timestamps the segment information bar shows the zoom value in the center of the bar.
Figure 4.57 - Bluetooth le Timeline Segment Timestamp and Zoom Value
Note: The raw timestamp value is the number of 100-nanosecond intervals since the beginning
of January 1, 1601. This is standard Windows time.
l
Packet Info Line - The packet info line appears just above the timeline and displays information for the
currently selected packet.
Figure 4.58 - Bluetooth le Timeline Packet Info Line
l
When you select multiple packets, the info line includes:
o
Gap - duration between the end of the first selected packet and the beginning of the last selected
packet.
o
Timestamp Delta - Duration between the beginnings of the first and last packets selected.
o
Span - Duration between the beginning of the first selected packet and the end of the last selected
packet
- 151 -
ComProbe BPA 600 User Manual
Chapter 4 Capturing and Analyzing Data
Figure 4.59 - Bluetooth le Timeline Packet Info Line for Multiple Selected Packets
l
Floating Information Window (aka Tooltip) - The information window displays when the mouse cursor hovers
on a packet. It persists as long as the mouse cursor stays on the packet.
l
Discontinuities - Discontinuities are indicated by cross-hatched slots. See the Discontinuities section.
l
Packet Status - Packet status is indicated by color codes. Refer to low energy Timeline Legends.
l
Right-Click Menu. - The right-click menu provides zooming and time marker alignment.
l
l
l
Graphical Packet Depiction - each packet within the visible range is graphically depicted. See the Packet
Depiction section.
Swap Button - The Swap button
switches the position of the Timeline and the Throughput graph.
Show Running Average - -Selecting this check box shows a running average in the Throughput Over Time
graph as an orange line
.
4.4.4.12 low energy Packet Discontinuities
The following figure depicts a discontinuity between two packets.
Figure 4.60 - Bluetooth® low energy Packet Discontinuity
To keep the timeline and the throughput graph manageable, big jumps in the timestamp are not represented
linearly. Instead, they are shown as discontinuities. A discontinuity exists between a pair of packets when the
timestamp delta (the timestamp of the second packet minus the timestamp of the first packet) is (1) more than
4.01 seconds or (2) is negative. The reason that the discontinuity trigger is set at 4.01 seconds is because the
maximum connection interval time is 4 seconds.
- 152 -
Chapter 4 Capturing and Analyzing Data
ComProbe BPA 600 User Manual
A discontinuity is indicated by a cross-hatched pattern drawn between two packets and a corresponding vertical
dashed line in the throughput graph. When the timestamp delta is greater than 4.01 seconds, the discontinuity is a
cosmetic convenience that avoids excessive empty space. When the timestamp delta is negative, the discontinuity
is necessary so that the packets can be drawn in the order that they occur.
4.4.4.13 low energy Timeline Navigating and Selecting Data
Buttons, menu items, and keystrokes can be used to go to the next or previous packet, next or previous invalid
interframe spacing (IFS), next or previous error packet, and the first or last packet.
l
If there is no selected packet in the timeline, First Packet
are enabled, but Previous Packet
l
, Next Packet
, and Last Packet
is not.
A single packet is selected either by clicking on it, navigating to it, or selecting it in the Frame Display.
o
o
Single Segment Navigation:
n
Selecting Previous Packet will select the next packet in time (moving back in time to the left)
regardless of which row it is on. If the previous packet is not in the display or if a portion of the packet
is visible, the display will scroll to the next packet and it will appear selected on the left of the display.
The timestamp will change with the scrolling of the display.
n
Selecting Next Packet will select the next packet in time (moving forward in time to the right). If the
next packet is not in the display, the display will scroll to the next packet and it will appear selected on
the right of the display. The timestamp will change with the scrolling of the display.
Multiple Segment Navigation:
n
Selecting Previous Packet will select the next packet moving back in time (to the left) on the
segment and will select the previous packet regardless of which or segment it is in.
If the selected packet overlaps with the previous segment, the display will show the packet selected in
both segments.
If the previous packet is not shown in the timeline display or a portion of the packet is displayed,the
display will move the view port back in time and will display the selected packet in the top segment on
the left edge. Each segment's timestamps will synchronously change as the view port scrolls backwards
in time.
n
Selecting Next Packet will select the next packet moving forward in time (to the right)on the to the
next packet regardless of which row or segment it is in.
If the next packet overlaps on a following segment, the display will show the packet selected in both
segments.
If the next packet is not shown in the timeline display on any segment or a portion of the packet is
displayed, the display will move the view port forward in time and will display the selected packet in
the bottom segment on the right edge. Each segment's timestamps will synchronously change as the
view port scrolls forward in time. All subsequent selected next packets will appear on the right of the
bottom segment.
- 153 -
ComProbe BPA 600 User Manual
l
l
l
l
Chapter 4 Capturing and Analyzing Data
Multiple packets are selected either by dragging the mouse or by holding down the shift key while navigating
or clicking.
When a single packet is selected in the timeline it is also becomes selected in the Frame Display. When
multiple packets are selected in the timeline, only one of them is selected in the Frame Display.
The keyboard left arrow key goes to the previous packet. The right arrow key goes to the next packet. The
Ctrl-left arrow key goes to the previous error packet. The Ctrl-right arrow key goes to the next error packet.
The mouse scroll wheel will scroll the timeline as long as the cursor is in the dialog.
4.4.4.14 low energy Timeline Zooming
Zoom features can be accessed from the Bluetooth low energy Timeline Zoom menu by right-clicking on the
Timeline window.
A couple of things to remember about Zooming.
l
l
l
l
l
Zooming using the toolbar buttons in a single segment display is relative to the center of the display. That is as
you zoom out those packets on the left and right halves will move closer to the center. If you zoom in, those
packets in the left and right halves will move towards the left and right edges respectively.
Zooming using the toolbar buttons in a multiple segment display is relative to the number of segments. If you
have a single display and zoom out they will become two segments, then three segments, then six, and so
forth.
Selecting a Zoom icon (+ or -) on the toolbar zooms in our out.
The current Zoom setting is shown in the center of the timeline segment information bar at the bottom of
each timeline segment.
If you are in multiple segments the segment information bar will show the zoom level with the text "
(Contiguous time segment x/n)" where "x" is 1,2, 3... segment and "n" is the total number of segments. For
example: :"(Contiguous time segment 2/3)".
- 154 -
Chapter 4 Capturing and Analyzing Data
ComProbe BPA 600 User Manual
4.4.4.15 Zoom menu
Figure 4.61 - low energy Timeline Zoom menu
- 155 -
ComProbe BPA 600 User Manual
Chapter 4 Capturing and Analyzing Data
4.4.4.16 Single Segment Zoom
Zoom Menu Single Segment: Each selection defines the timeline displayed, the number of segments, and number
of 1.25 ms markers withing the segment. For example, selecting "33.75 ms (1x27)" will display "33.75 ms" of the
throughput graph in "1" segment with "27" markers.
The scroll bar at the bottom of the segment will scroll the throughput graph view port.
4.4.4.17 Multiple Segments
- 156 -
Chapter 4 Capturing and Analyzing Data
ComProbe BPA 600 User Manual
Zoom Menu Multiple Segment: Each selection defines the timeline view port, the number of segments, and
number of 1.25 ms markers withing the segment. For example, selecting "7.5 ms (6 1.25 ms time intervals (3x2))"
will display "7.5 ms" of the total timeline in "3" segments of with "2" markers per segment for a total of "6"
markers.
The scroll bar at the left of the segments will scroll the view through the timeline.
4.4.5 Coexistence View
The Coexistence View displays Classic Bluetooth, Bluetooth low energy, and 802.11 packets and throughput in
one view. You access the Coexistence View by clicking its button
in the Control window or Frame
Display toolbars, or Coexistence View from the View menus.
Figure 4.62 - Coexistence View Window
4.4.5.1 Coexistence View Menus
The following tables
describe each of the
Coexistence View Menus.
- 157 -
ComProbe BPA 600 User Manual
Chapter 4 Capturing and Analyzing Data
Table 4.13 - Coexistence View File Menu Selections
Selection
Description
Selection
Reset
Resets the Coexistence View window to its default settings.
Exit
Closes the Coexistence View window.
Table 4.14 - Coexistence View Format Menu Selections
Description
Show Packet
Number
When checked, the packet number shows below the packet in the Viewport.
Show Packet
Type
When checked, the packet type shows below the packet in the Viewport.
Show Packet
Subtype
When checked, the packet subtype shows below the packet in the Viewport, if applicable.
Hide Packet
Text
When checked, hides any text shown below the packet in the Viewport. Applies the text
shown by the Show Packet Number, Show Packet Type, and Show Packet Subtype
menu selections.
Auto Hide
Packet Text
When
Duration >
31.25 ms.
When checked, automatically hides any text shown below the packet in the Viewport
when the Viewport duration exceeds 31.25 ms. Applies the text shown by the Show
Packet Number, Show Packet Type, and Show Packet Subtype menu selections.
The Viewport duration is shown at the bottom of the Viewport. This selection reduces
display clutter when viewing a larger timeline section.
Increase Auto
Hide Packet
Count from
4,000 to 20,000
(May Be Slow)
When not checked, the default, the packets in the viewport are hidden if the number of
visible packets exceeds 4,000.
When checked, the default count increased from 4,000 to 20,000 packets before the
packets are hidden. Choosing this selection may slow down the displaying of the
packets.
The following three selections are mutually exclusive.
Use All
Packets for
Throughput
Indicators
When checked, all captured packets are used for average throughput calculations and
all packets in the last one second of the capture session are used for the 1 sec
throughput. See Coexistence View - Throughput Indicators on page 166 for more
information. Performs the same function as the throughput indicator All radio button.
Use Selected
Packets for
Throughput
Indicators
When checked, the packets selected in the Viewport are used for average throughput
calculations, and selected packets in the one second before the last selected packet are
used for the 1 sec throughput. See Coexistence View - Throughput Indicators on page
166 for more information. Performs the same function as the throughput indicator
Selected radio button.
Use Viewport
Packets for
Throughput
Indicators
When checked, all packets appearing in the Viewport are used for average throughput
calculations, and all packets in the one second before the last packet in the Viewport are
used for the 1 sec throughput. See Coexistence View - Throughput Indicators on page
166 for more information. Performs the same function as the throughput indicator
Viewport radio button.
- 158 -
Chapter 4 Capturing and Analyzing Data
Selection
Set 802.11 Tx
Address
ComProbe BPA 600 User Manual
Table 4.14 - Coexistence View Format Menu Selections (continued)
Description
When checked, this selection is used to specify the 802.11 source address, where any
packet with that source address is considered a Tx packet and is shown with a purple
border in the timelines. Performs the same function as the SET button. Refer to
Coexistence View - Set Button on page 177
The following three selections are mutually exclusive.
Show Packet
Throughput
When checked, the Throughput Graph and Throughput Indicator shows data based on
packet throughput. Performs the same function as the Throughput Packet radio button.
Show Payload
Throughput
When checked, the Throughput Graph and Throughput Indicator shows data based on
payload throughput. Performs the same function as the Throughput Payload radio
button.
Show Both
Packet And
Payload
Throughput
When checked, the Throughput Graph will graph both the data based on packets
throughput in darker colors and payloay throughput in lighter colors. The Throughput
Indicator will show calculations based on packet throughput. Performs the same
function as the Throughput Both radio button.
The following four selections are mutually exclusive.
Show 5 GHz
Timeline
When checked, the 5 GHz Timeline is visible and the 2.4 GHz Timeline is not visible.
Only 802.11 5 GHz packets are shown. Performs the same function as the Timeline 5
GHz radio button.
Show 2.4 GHz
Timeline
When checked, the 2.4 GHz Timeline is visible and the 5 GHz Timeline is not visible.
The timeline will show Classic Bluetooth, Bluetooth Low Energy, and 802.11 2.4 GHz
packets. Performs the same function as the Timeline 2.4 GHz radio button.
Show Both 2.4 When checked, the 2.4 GHz Timeline and the 5GHZ Timeline is visible. Performs the
GHz and 5
same function as the Timeline Both radio button.
GHZ Timelines
Show
When check,shows only timelines which have had packets at some point during this
Timelines
session. If no packets are present, the 2.4 GHz Timeline is visible. Performs the same
Which Have or function as the Timeline Auto radio button.
Had Packets
(Auto Mode)
The following two selections are mutually exclusive.
Show Low
Energy
Packets From
Configurated
Devices Only
When checked, shows in the 2.4 GHz Timeline only packets from Bluetooth low enegry
devices configured for this session, and uses these packets for throughput calculations.
Performs the same function as the LE Devices Configured radio button.
Show All Low
Energy
Packets
When checked, shows in the 2.4 GHz Timeline all Bluetooth low energy packets
captured in this session, and uses these packets for throughput calculations. Performs
the same function as the LE Devices All radio button.
- 159 -
ComProbe BPA 600 User Manual
Selection
Large
Throughput
Graph
Chapter 4 Capturing and Analyzing Data
Table 4.14 - Coexistence View Format Menu Selections (continued)
Description
When checked, the Throughput Graph appears in the bottom half of the window,
swapping position with the timeline.
When not checked, the Throughput Graph appears in its default position at the top of the
window.
Performs the same function as clicking the Swap button. See Coexistence View Throughput Graph on page 169.
Show Dots in
Throughput
Graph ( Dots
Reveal
Overlapped
Data Points)
When checked, displays dots on the Throughput Graph. Dots are different sizes for each
technology so that they reveal overlapping data points which otherwise wouldn’t be
visible. A tooltip can be displayed for each dot. Performs the same function as the Dots
button. See Coexistence View - Throughput Graph on page 169.
Show Zoomed
Throughput
Graph
When checked, dispalys a Zoomed Throughput Graph above the Throughput Graph. The
Zoomed Throughput Graph shows the details of the throughput in the time range covered
by the viewport in the Throughput Graph. Performs the same function as the Show
Zoom button.
When not checked, the Zoomed Throughput Graph is hidden. Performs the same
function as the Hide Zoom button.
See Coexistence View - Throughput Graph on page 169
.
Freeze Y
Scales in
Zoom
Throughput
Graph
Only active when the Zoomed Throughput Graph is visible.
When checked, it freezes the y-axis scales and makes it possible to compare all time
ranges and durations. Performs the same fuction as the Freeze Y button, which appears
with the Zoomed Throughput Graph.
When not checked, the y-axis scales are unfroozen. Performs the same function as the
Unfreeze Y button, which appears with the Zoomed Throughput Graph.
See Coexistence View - Throughput Graph on page 169
Show Tooltips
in Upper-Left
Corner of
Screen
When checked, Timeline and Throughput Graph tooltips will appear in the upper-left
corner of your computer sceen. You can relocate the tool tip for convenience or to see
the timeline or throughput graph unobstructed while displaying packet information. See
Coexistence View – Timelines on page 179.
Table 4.15 - Coexistence View Zoom Menu Selections
Selection
Description
Zoom In
When clicked,
Viewport time duration
decreased.
- 160 -
Hot Key
Ctrl+Plus
Chapter 4 Capturing and Analyzing Data
ComProbe BPA 600 User Manual
Table 4.15 - Coexistence View Zoom Menu Selections (continued)
Selection
Description
Zoom Out
When clicked,
Viewport time duration
increases
Hot Key
Ctrl+Minus
The following two selectioins are mutually exclusive.
Scroll Tool (Mouse Wheel Scrolls - Ctrl Key
Switches to Zoom Tool)
When checked, sets the mouse wheel to scroll
the Viewport. Pressing the Ctrl key while
scrolling switches to zooming the Viewport.
Zoom Tool (Mouse Wheel Zooms- Ctrl Key
Switches to Scroll Tool)
When checked, sets the mouse wheel to zoom
the Viewport. Pressing the Ctrl key while
zooming switches to scrolling the Viewport.
Zoom To Time Range of Selected Packets
Active only when packets are selected.
When clicked, the Viewport duration changes to
the time range covered by the selected packets.
Zoom To Throughput Graph Data Point
When clicked, the Viewport duration changes to
the time range of the Throughput Graph selected
data point.
Custom Zoom (Set by Zoom To Time Range of
Selected Packets, Zoom To Throughput Graph
Data Point, or dragging Viewport Slide)
Automatically checked when taking any zoom
action other than the fixed Viewport zoom
durations listed below.
- 161 -
ComProbe BPA 600 User Manual
Chapter 4 Capturing and Analyzing Data
Table 4.15 - Coexistence View Zoom Menu Selections (continued)
Selection
Description
Hot Key
The following 21 selections are mutually exclusive.
150 usec
Each of these Zoom selections sets the Viewport
and the Timeline to a fixed time duration.
300 usec
625 usec (1 Bluetooth slot)
1.25 msec (2 Bluetooth slots)
1.875 msec (3 Bluetooth slots)
2.5 msec (4 Bluetooth slots)
3.125 msec (5 Bluetooth slots)
6.25 msec (10 Bluetooth slots)
15.625 msec (25 Bluetooth slots)
31.25 msec (30 Bluetooth slots)
62.5 msec (100 Bluetooth slots)
156.255 msec (250 Bluetooth slots)
31.25 msec (500 Bluetooth slots)
625 msec (1,000 Bluetooth slots)
1 sec (1,600 Bluetooth slots)
2 sec (3,200 Bluetooth slots)
3 sec (4,800 Bluetooth slots)
4 sec (6,400 Bluetooth slots)
5 sec (8,000 Bluetooth slots)
10 sec (16,000 Bluetooth slots)
20 sec (32,000 Bluetooth slots)
Note: Right-clicking anywhere in the Coexistence View window will open the Zoom menu in a
pop-up.
Selection
First Packet
Table 4.16 - Coexistence View Navigate Menu Selections
Description
Hot key
When clicked, the first packet in the session is Home
selected and displayed in the Timeline.
Performs the same function as the
First
Packet button.
- 162 -
Chapter 4 Capturing and Analyzing Data
Selection
Last Packet
ComProbe BPA 600 User Manual
Table 4.16 - Coexistence View Navigate Menu Selections (continued)
Description
Hot key
When clicked, the last packet in the session is
selected and displayed in the Timeline.
Performs the same function as the
Last
End
Packet button.
Previous
Packet
When clicked, the first packet occurring in time Left Arrow
prior to the currently selected packet is
selected and displayed in the Timeline.
Performs the same function as the
Previous Packet button.
Next Packet
When clicked, the first packet occurring next in Right Arrow
time from the currently selected packet is
selected and displayed in the Timeline.
Performs the same function as the
Next
Packet button.
Previous
When clicked, selects the first prior retransmitted packet from the current selection and
Retransmitted displays it in the Timeline.. Performs the same function as the
Previous
Packet
Retransmitted Packet button.
Next
When clicked, selects the next retransmitted packet from the current selection and
Retransmitted displays it in the Timeline.. Performs the same function as the
Next Retransmitted
Packet
Packet.
Previous
Invalid IFS
Packet
When clicked, selects the first prior invalid Bluetooth low energy IFS packet from the
current selection and displays it in the Timeline. Performs the same function as the
Previous Invalid IFS Packet button.
Next Invalid
IFS Packet
When clicked, selects the next invalid Bluetooth low energy IFS packet from the current
selection and displays it in the Timeline. Performs the same function as the
Next
Invalid IFS Packet button.
Previous
Error Packet
When clicked, selects the first prior packet
with an error from the current selection and
displays it in the Timeline. Performs the same
function as the
Previous Error Packet
Ctrl+Left Arrow
button.
Next Error
Packet
When clicked, selects the next packet with an Ctrl+Right Arrow
error from the current selection and displays it
in the Timeline. Performs the same function as
the
Next Error Packet button.
- 163 -
ComProbe BPA 600 User Manual
Selection
Chapter 4 Capturing and Analyzing Data
Table 4.16 - Coexistence View Navigate Menu Selections (continued)
Description
Hot key
First Legend
Packet
When clicked, selects the first legend packet in the session and displays it in the
Timeline. This control is enabled when a bold packet type is selected in the Coexistence
View Legend. Refer to Coexistence View – Legend on page 179. Performs the same
functions as the
First Legend Packet button.
Previous
Legend
Packet
When clicked, selects the first prior legend packet in time from the current selection and
displays it in the Timeline. This control is enabled when a bold packet type is selected in
the Coexistence View Legend. Refer to Coexistence View – Legend on page 179.
Performs the same functions as the
Previous Legend Packet button.
Next Legend
Packet
When clicked, selects the next legend packet in time from the current selection and
displays it in the Timeline. This control is enabled when a bold packet type is selected in
the Coexistence View Legend. Refer to Coexistence View – Legend on page 179.
Performs the same functions as the
Next Legend Packet button.
Last Legend
Packet
When clicked, selects the last legend packet in the session and displays it in the
Timeline. This control is enabled when a bold packet type is selected in the Coexistence
View Legend. Refer to Coexistence View – Legend on page 179. Performs the same
functions as the
Last Legend Packet button.
Toggle
Display Lock
This selection is active during Live capture mode only. Checking this selection will lock
the Throughput Graph and the Timeline in its current position, however the capture will
continue. Not checking this selection will cause the Throughput Graph and the Timeline
to scroll as data is collected.
Note: Navigate menu selections are context sensitive. For example, If the first packet is
selected, the Next Packet and the Last Packet selections are active, but the Previous Packet
selection is inactive.
4.4.5.2 Coexistence View - Toolbar
Figure 4.63 - Coexistence View Toolbar
The toolbar contains the following selections:
Table 4.17 - Coexistence View Toolbar icons
Icon
Description
Move to the first packet.
Move to the previous packet.
- 164 -
Chapter 4 Capturing and Analyzing Data
ComProbe BPA 600 User Manual
Table 4.17 - Coexistence View Toolbar icons (continued)
Icon
Description
Move to the next packet.
Move to the last packet.
Move to the previous retransmitted packet.
Move to the next retransmitted packet
Move to the previous invalid IFS for Bluetooth low energy.
Move to the next invalid IFS for Bluetooth low energy.
Move to the previous bad packet.
Move to the next bad packet.
Move to the first packet of the type selected in the legend.
Move to the previous packet of the type selected in the legend
Move to the next packet of the type selected in the legend.
Move to the last packet of the type selected in the legend.
Zoom in.
Zoom out.
Scroll cursor.
When selected the cursor changes from Scroll
normal cursor to remove the zooming cursor.
Zooming cursor.
- 165 -
to a context-aware zooming cursor. Click on
ComProbe BPA 600 User Manual
Chapter 4 Capturing and Analyzing Data
Table 4.17 - Coexistence View Toolbar icons (continued)
Icon
Description
Scroll Lock/Unlock during live capture mode.
Reset during live capture mode. Clears the display.
4.4.5.3 Coexistence View - Throughput Indicators
Figure 4.64 - Coexistence View Throughput Indicators
Throughput indicatorsshow average throughput and 1 second throughput for Classic Bluetooth® (all devices,
master devices, and slave devices are each shown separately), Bluetooth low energy, and 802.11. 4.4.5.4 Throughput
Throughput is total packet or payload size in bits of the included packets divided by the
duration of the included packets, where:
l
Packet size is used if the Packet or Both radio button is selected in the Throughput group. l
Payload size is used if the Payload radio button is selected in the Throughput group. l
l
Included packets are defined separately for each of the radio buttons that appear above the throughput
indicators. Duration of the included packets is measured from the beginning of the first included packet to the end of
the last included packet. - 166 -
Chapter 4 Capturing and Analyzing Data
ComProbe BPA 600 User Manual
4.4.5.5 Radio Buttons
The radio buttons above the throughput indicators specify
which packets are included. Radio button descriptions are modified per the following:
l
l
Bluetooth low energy packets from non-configured devices are excluded if the
Configured radio button in the LE Devices group is selected.
Frame Display filtering has no effect here in that packets that are filtered-out in
Frame Display are still used here as long as they otherwise meet the criteria for
each radio button as described below.
4.4.5.6 All radio button
All packets are used for average throughput, and packets
occurring in the last 1 second of the session are used for 1
second throughput, except that Bluetooth low energy
packets from non-configured devices can be excluded as noted above.
4.4.5.7 Selected radio button
Selected packets (the selected packet range is shown in
the timeline header) are used for average throughput,
and packets in the 1 second duration ending at the end of
the last selected packet are used for 1 second, except that Bluetooth low energy packets from nonconfigured devices can be excluded as noted above.
Figure 4.18 Timeline Header Showing Selected Packets
4.4.5.8 Viewport radio button
The viewport is the purple rectangle in the Throughput
Graph and indicates a specific starting time, ending time,
and resulting duration. Packets that occur within that
range of time are used for average throughput, and packets in the 1 second duration ending at the end
of the last packet in the viewport time range are used for 1 second throughput, except that Bluetooth
low energy packets from non-configured devices can be excluded as noted above.
- 167 -
ComProbe BPA 600 User Manual
Chapter 4 Capturing and Analyzing Data
Figure 4.65 - Throughput Graph viewport.
4.4.5.9 Indicator width
The width of each indicator is the largest 1 second throughput seen up to that point for that technology (Classic
Bluetooth, Bluetooth low energy, or 802.11), where the 1 second throughput is calculated anew each time
another packet is received. The 1 second throughput indicator will never exceed this width, but the average
throughput indicator can. For example, the image below has a large average throughput because the Selected
radio button was selected and a single packet was selected, and the duration in that case is the duration of the
single packet, which makes for a very small denominator in the throughput calculation. When the average
throughput exceeds the indicator width, a plus sign (+) is drawn at the right end of the indicator.
Figure 4.66 - Average throughput indicators show a plus sign (+) when the indicator width is exceeded.
Figure 4.67 - A single selected packet
- 168 -
Chapter 4 Capturing and Analyzing Data
ComProbe BPA 600 User Manual
4.4.5.10 Coexistence View - Throughput Graph
Figure 4.68 - Coexistence View Throughput Graph
The Throughput Graph is a line graph that shows packet and/or payload throughput over time as specified by
the radio buttons in the Throughput group. If the Both radio button is selected, packet and payload throughput
are shown as two separate lines for each technology. The payload throughput line is always below the packet
throughput line (unless both are 0).
The data lines and y-axis labels are color-coded: Blue = Classic Bluetooth® , Green = Bluetooth low energy, Orange
= 802.11. Each data point represents a duration which is initially 0.1 s. Each time the number of data points per
line reaches 300, the number of data points per line is halved to 150 and the duration per data point is doubled. The duration per data point thus progresses from 0.1 s to 0.2 s to 0.4 s to 0.8 s and so on. 4.4.5.11 Throughput Graph Y-axis labels
The y-axis labels show the throughput in bits per second. From left-to-right the labels are for 802.11,
Bluetooth low energy, and Classic Bluetooth. The duration of each data point must be taken into account for
the y-axis label’s value to be meaningful. For example, if a data point has a duration of 0.1 s and a bit count of
100, it will have a throughput of 1,000 bits/s, and the y-axis labels will be consistent with this.
- 169 -
ComProbe BPA 600 User Manual
Chapter 4 Capturing and Analyzing Data
Figure 4.69 - Throughput Graph y-axis labels.
4.4.5.12 Excluded packets
Retransmitted packets and bad packets (packets with CRC or Header errors) are excluded from throughput
calculations.
4.4.5.13 Tooltips
Placing the mouse pointer on a data point shows a tooltip for that data point. The tooltip first line shows the
throughput, the throughput type (packet or payload), and the technology. Subsequent lines show the bit
count, the duration of the data point, the packet range of that duration (only packets of the applicable
technology from that packet range are used for the throughput calculation), and the number of the data point
(which is 0 for the first data point in each line).
Figure 4.70 - Data point tooltip
The Throughput graph tool tips can be shown in the upper-left corner of your computer screen to provide an
unobstructed view. Refer to Relocating Tool Tips.
4.4.5.14 Discontinuities
A discontinuity is when the timestamp going from one packet to the next either goes backward by any amount
or forward by more than 4.01 s. This value is used because the largest possible connection interval in
Bluetooth low energy is 4.0 s. A discontinuity is drawn as a vertical dashed line. A discontinuity for a
- 170 -
Chapter 4 Capturing and Analyzing Data
ComProbe BPA 600 User Manual
timestamp going backward is called a negative discontinuity and is shown in red. A discontinuity for a
timestamp going forward by more than 4.01 s is called a positive discontinuity and is shown in black. A
positive discontinuity is a cosmetic nicety to avoid lots of empty space. A negative discontinuity is an error.
Figure 4.71 - A negative discontinuity.
Figure 4.72 - Three positive discontinuities.
4.4.5.15 Viewport
The viewport is the purple rectangle in the Throughput Graph. It indicates a specific starting time, ending
time, and resulting duration, and is precisely the time range used by the Timeline. The packet range that
occurs within this time range is shown above the sides of the viewport.
- 171 -
ComProbe BPA 600 User Manual
Chapter 4 Capturing and Analyzing Data
Figure 4.73 - Throughput Graph Viewport
The viewport is moved by dragging it or by clicking on the desired location in the Throughput Graph (the
viewport will be centered at the click point).
The viewport is sized by dragging one of its sides or by using one of the other zooming techniques. See the
Zooming subsection in the Timeline section for a complete list.
4.4.5.16 Swap button
The Throughput Graph and Timeline can be made to trade positions by clicking the Swap button. Clicking the Swap
button swaps the positions of the Throughput Graphs and the Timelines.
- 172 -
Chapter 4 Capturing and Analyzing Data
ComProbe BPA 600 User Manual
Figure 4.74 - Small Timeline and large Throughput Graph after pressing the Swap button.
4.4.5.17 Dots button
The dots on the data points can be toggled on and off by clicking the Dots
button. Dots are different
sizes for each technology so that they reveal overlapping data points which otherwise wouldn’t be visible. A
tooltip can be displayed for each dot.
Dots can be removed for greater visibility of the plots when data points are crowded together.
Figure 4.75 - Dots Toggled On and Off
- 173 -
ComProbe BPA 600 User Manual
Chapter 4 Capturing and Analyzing Data
Figure 4.76 - Overlapping Dots Information Display
4.4.5.18 Zoomed Throughput Graph
Clicking the Show Zoom button
displays the Zoomed Throughput Graph above the
Throughput Graph. The Zoomed Throughput Graph shows the details of the throughput in the time
range covered by the viewport in the Throughput Graph. Both the Zoomed Throughput Graph and the
Timelines are synchronized with the Throughput Graph’s viewport. The viewport is sized by dragging one
of its sides or by using one of the other zooming techniques listed in the Zooming subsection in the Timelines
section.
- 174 -
Chapter 4 Capturing and Analyzing Data
ComProbe BPA 600 User Manual
Figure 4.77 - Synchronized Zoomed Throughput Graph and View Port
The largest value in each technology in the Zoomed Throughput Graph is snapped to the top of the graph.
This makes the graph easier to read by using all of the available space, but because the y-axis scales can change
it can make it difficult to compare different time ranges or durations. Clicking the Freeze Y
button
freezes the y-axis scales and makes it possible to compare all time ranges and durations (the name of the
button changes to Unfreeze Y and a Y Scales Frozen indicator appears to the right of the title. Clicking the
Unfreeze Y
button unfreezes the y-axis scales.
Figure 4.78 - Zoomed Throughput Graph- Largest Value Snaps to Top
- 175 -
ComProbe BPA 600 User Manual
Chapter 4 Capturing and Analyzing Data
Figure 4.79 - Zoomed Throughput Graph - Freeze Y keeps the y-axis constant
Interval Menu
The Interval drop-down menu is used to set the duration of each data point
in the Zoomed Throughput graph. The default setting is Auto that sets the
data point interval automatically depending on the zoom level. The other
menu selections provide the ability to select a fixed data point interval.
Selecting from a larger to a smaller interval will display more data points.
Should the number of data points exceed 30,000, no data is displayed and a
warning will appear in the graph area.
4.4.5.19 Zoom Cursor
Selecting the Zoom Cursor
button changes the cursor to the zoom cursor
. The zoom cursor is
controlled by the mouse wheel and zooms the viewport and thus the Timelines and the Zoomed Throughput
Graph. The zoom cursor appears everywhere except the Throughput Graph, which is not zoomable, in
which case the scroll cursor is shown. When the zoom cursor is in the Timelines or Zoomed Throughput
Graph zooming occurs around the point in time where the zoom cursor is positioned. When the zoom cursor
is outside the Timelines and the Zoomed Throughput Graph the left edge of those displays is the zoom
point.
4.4.5.20 Comparison with the Bluetooth Timeline's Throughput Graph
The Throughput Graphs for Classic Bluetooth in the Coexistence View and the BluetoothTimeline can
look quite different even though they are plotting the same data. The reason is that the Coexistence View
uses timestamps while the BluetoothTimeline uses Bluetooth clocks, and they do not always match up
exactly. This mismatch can result in the data for a particular packet being included in different intervals in the
two Throughput Graphs, and can have a significant impact on the shapes of the two respective graphs. This
can also result in the total duration of the two Throughput Graphs being different.
Another factor that can affect total duration is that the BluetoothTimeline's Throughput Graph stops at the
last Classic Bluetooth packet while the Coexistence View’s Throughput Graph stops at the last packet
regardless of technology.
- 176 -
Chapter 4 Capturing and Analyzing Data
ComProbe BPA 600 User Manual
4.4.5.21 Coexistence View - Set Button
The Set button is used to specify the 802.11 source address, where any
packet with that source address is considered a Tx packet and is shown with
a purple border in the timelines. All source MAC addresses that have been seen during this session are listed in the dialog that appears when the
Set button is clicked. Also listed is the last source MAC address that was set in the dialog in the previous session. If that address has not yet been seen in this session, it is shown in parentheses.
Figure 4.80 - 802.11 Source Address Dialog
- 177 -
ComProbe BPA 600 User Manual
Chapter 4 Capturing and Analyzing Data
Figure 4.81 - 802.11 Source Address Drop Down Selector
4.4.5.22 Coexistence View - Throughput Radio Buttons
The radio buttons in the Throughput group specify whether to show packet and/or payload lines
in the Throughput Graph, and also whether to show packet or payload throughput in the
throughput indicators (if the Both radio button is selected, packet throughput is shown in the
throughput indicators).
4.4.5.23 Coexistence View - Timeline Radio Buttons
The radio buttons in the Timeline group specify timeline visibility. The first three buttons specify
whether to show one or both timelines, while the Auto button shows only timelines which have
had packets at some point during this session. If no packets have been received at all and the
Auto button is selected the 2.4 GHz timeline is shown.
4.4.5.24 Coexistence View – low energy Devices Radio Buttons
The radio buttons in the LE Devices group (where “LE” means Bluetooth® low energy)
specify both visibility and inclusion in throughput calculations of Bluetooth low energy packets. The All radio button shows and uses all Bluetooth low energy packets. The Configured radio
button shows and uses only Bluetooth low energy packets which come from a configured
device.
- 178 -
Chapter 4 Capturing and Analyzing Data
ComProbe BPA 600 User Manual
4.4.5.25 Coexistence View – Legend
Figure 4.82 - Coexistence View Legend
The legend describes the color-coding used by packets in the timelines. Selecting a packet in a timeline highlights
the applicable entries in the legend. An entry is bold if any such packets currently exist. Clicking on a bold entry
enables the black legend navigation arrows in the toolbar for that entry.
4.4.5.26 Coexistence View – Timelines
Figure 4.83 - Coexistence View Timelines
The Timelines show Classic Bluetooth® , Bluetooth low energy, and 802.11 packets by channel and time. 4.4.5.27 Packet information
Packet information is provided in various ways as described below.
- 179 -
ComProbe BPA 600 User Manual
Chapter 4 Capturing and Analyzing Data
Packets are color-coded to indicate attribute (Retransmit, Bad Packet, Can’t Decrypt, or Invalid IFS), master/Tx,
technology (Classic Bluetooth® , Bluetooth low energy, or 802.11), and category/type.
Figure 4.84 - Each packet is color-coded
The innermost box (which indicates packet category/type) is the packet proper in that its vertical position
indicates the channel, its length indicates the packet’s duration in the air, its left edge indicates the start time,
and its right edge indicates the end time.
The height of Classic Bluetooth and Bluetooth low energy packets indicates their frequency range (1 MHz and 2
MHz respectively). Since 802.11 channels are so wide (22 MHz), 802.11 packets are drawn with an arbitrary 1
MHz height and centered within a separate frequency range box which indicates the actual frequency range.
Selecting a packet by clicking on it draws a selection box around it (as shown above) and highlights the
applicable entries in the legend.
Figure 4.85 - Highlighted entries in the legend for a selected packet.
Summary information for a selected packet is displayed in the timeline header.
Figure 4.86 - Timeline header for a single selected packet.
- 180 -
Chapter 4 Capturing and Analyzing Data
ComProbe BPA 600 User Manual
When multiple packets are selected (by dragging the mouse with the left button held down, clicking one
packet and shift-clicking another, or clicking one packet and pressing shift-arrow), the header shows Gap
(duration between the first and last selected packets), Timestamp Delta (difference between the
timestamps, which are at the beginning of each packet), and Span (duration from the beginning of the first
selected packet to the end of the last selected packet).
Figure 4.87 - Timeline header for multiple selected packets
Text can be displayed at each packet by selecting Show Packet
Number, Show Packet Type, and Show Packet Subtype
from the Format menu.
Figure 4.88 - Descriptive text on timeline packets.
Placing the mouse pointer on a packet displays a tooltip (color-coded by technology) that gives detailed
information.
- 181 -
ComProbe BPA 600 User Manual
Chapter 4 Capturing and Analyzing Data
Figure 4.89 - A tool tip for a Classic Bluetooth packet.
4.4.5.28 Relocating the tool tip
You can relocate the tool tip for convenience or to see the timeline or throughput graph unobstructed
while displaying packet information. In the Format menu select Show Tooltips in Upper-Left Corner
of Screen, and any time you mouse-over a packet the tool tip will appear anchored in the upper-left
corner of the computer screen. To return to viewing the tool tip adjacent to the packets deselect the tool
tip format option in the menu.
- 182 -
Chapter 4 Capturing and Analyzing Data
ComProbe BPA 600 User Manual
Figure 4.90 - Coexistence View Format Menu - Show Tooltips on Computer Screen
- 183 -
ComProbe BPA 600 User Manual
Chapter 4 Capturing and Analyzing Data
Figure 4.91 - Coexistence View Timeline Tool Tip Shown Anchored to Computer Screen
4.4.5.29 The two Timelines
There are two Timelines available for viewing, one for the 5 GHz range and one for the 2.4 GHz range. Classic Bluetooth and Bluetooth low energy occur only in the 2.4 GHz range. 802.11 can occur in both. - 184 -
Chapter 4 Capturing and Analyzing Data
ComProbe BPA 600 User Manual
Figure 4.92 - 5 GHz and 2.4 GHz 802.11 packets
The y-axis labels show the channels for each technology and are color-coded: Blue = Classic Bluetooth, Green
= Bluetooth low energy, Orange = 802.11. The 5 GHz timeline has only 802.11 channel labels, and the rows alternate orange and white, one row per
channel. The 2.4 GHz timeline has labels for all three technologies. The rows alternate blue and white, one row per
Classic Bluetooth channel. The labels going left-to-right are 802.11 channels, Bluetooth low energy advertising
channels, Bluetooth low energy regular channels, and Classic Bluetooth channels.
The Viewport Packet Range above the timelines shows the packet range and packet count of packets that
would be visible if both timelines were shown (i.e. hiding one of the timelines doesn’t change the packet
range or count). This packet range matches the packet range shown above the viewport in the Throughput
Graph, as it must since the viewport defines the time range used by the timelines. When no packets are in the
time range, each of the two packet numbers is drawn with an arrow to indicate the next packet in each
direction and can be clicked on to navigate to that packet (the packet number changes color when the mouse
pointer is placed on it in this case).
An arrow points to the next packet when no packets are in the time range.
An arrowed packet number changes color when the mouse pointer is on it. Clicking navigates to
that packet.
The header shows information for packets that are selected.
The footer shows the beginning/ending timestamps and visible duration of the timelines.
The ‘i’ buttons bring up channel information windows, which describe channel details for each technology. They make for interesting reading.
- 185 -
ComProbe BPA 600 User Manual
Chapter 4 Capturing and Analyzing Data
Figure 4.93 - 5 GHz information window
Figure 4.94 - 2.4 GHz information windows
4.4.5.30 Bluetooth slot markers
When zoomed in far enough Bluetooth slot markers appear in the 2.4 GHz timeline. A Bluetooth slot is 625 µs
wide.
Figure 4.95 - Vertical blue lines are Bluetooth slot markers
4.4.5.31 Zooming
There are various ways to zoom:
- 186 -
Chapter 4 Capturing and Analyzing Data
ComProbe BPA 600 User Manual
1. Drag one of the sides of the Throughput Graph viewport.
2. Select a zoom preset from the Zoom or right-click menus.
3. Select the Zoom In or Zoom Out button or menu item.
4. Turn the mouse wheel in the Timelines or the Zoomed Throughput Graph while the zoom cursor
is selected. The action is the same as selecting the Zoom In and Zoom Out buttons and menu items
except that the time point at the mouse pointer is kept in place if possible.
5. Select the Zoom to Data Point Packet Range menu item, which zooms to the packet range shown
in the most recently displayed tool tip.
6. Select the Zoom to Selected Packet Range menu item, which zooms to the selected packet range
as indicated in the Selected Packets text in the timeline header.
7. Select the Custom Zoom menu item. This is the zoom level from the most recent drag of a viewport
side, selection of Zoom to Data Point Packet Range, or selection of Zoom to Selected Packet.
The zoom buttons and tools step through the zoom presets and custom zoom, where the custom zoom is
logically inserted in value order into the zoom preset list for this purpose.
4.4.5.32 Discontinuities
A discontinuity is when the timestamp going from one packet to the next either goes backward by any amount
or forward by more than 4.01 s (this value is used because the largest possible connection interval in
Bluetooth low energy is 4.0 s). A discontinuity is drawn as a vertical cross-hatched area one Bluetooth slot (625
µs) in width. A discontinuity for a timestamp going backward is called a negative discontinuity and is shown in
red. A discontinuity for a timestamp going forward by more than 4.01 s is called a positive discontinuity and is
shown in black. A positive discontinuity is a cosmetic nicety to avoid lots of empty space. A negative
discontinuity is an error.
Figure 4.96 - A negative discontinuity
- 187 -
ComProbe BPA 600 User Manual
Chapter 4 Capturing and Analyzing Data
Figure 4.97 - A positive discontinuity
When there are one or more discontinuities the actual time encompassed by the visible timeline differs from
the zoom level duration that would apply in the absence of any discontinuities. The actual time, referred to as
absolute time, is shown followed by “(abs)”. The zoom level duration, referred to as relative time, is shown
followed by “(rel)”. When there are no discontinuities, relative and absolute time are the same and a single
value is shown.
Figure 4.98 - Timeline header with discontinuity
Figure 4.99 - Timeline duration footer with discontinuity
For example, the timeline above has a zoom level duration of 15.625 ms (the relative time shown in the
footer). But the discontinuity graphic consumes the width of a Bluetooth slot (625 µs), and that area is 7.19984
s of absolute time as shown by the Gap value in the header. So the absolute time is 7.21484 s:
Zoom level duration – Bluetooth slot duration + Gap duration =
15.625 ms - 625 µs + 7.19984 s =
0.015625 s – 0.000625 s + 7.199840 s =
0.015000 s + 7.199840 s =
7.214840 s =
7.21484 s
4.4.5.33 High-Speed Bluetooth
High-speed Bluetooth packets, where Bluetooth content hitches a ride on 802.11 packets, have a blue
frequency range box instead of orange as with regular 802.11 packets (both are shown below), and the tool
tip has two colors, orange for 802.11 layers and blue for Bluetooth layers.
- 188 -
Chapter 4 Capturing and Analyzing Data
ComProbe BPA 600 User Manual
Figure 4.100 - High-speed Bluetooth packets have a blue frequency box and a two-tone tool tip
4.4.5.34 Coexistence View - No Packets Displayed with Missing Channel Numbers
Note: This topic applies only to Classic Bluetooth.
Captured packets that don’t contain a channel number, such as HCI and BTSnoop, will not be displayed. When no
packets have a channel number the Coexistence View Throughput Graph and Timelines will display a
message: "Packets without a channel number (such as HCI) won't be shown."
Figure 4.101 - Missing Channel Numbers Message in Timelines
- 189 -
ComProbe BPA 600 User Manual
Chapter 4 Capturing and Analyzing Data
4.4.5.35 High Speed Live View
When using the ComProbe 802.11 in conjunction with other ComProbe devices, or in a stand-alone configuration,
a smaller version of the standard Coexistence View is available. This High Speed Live View is essentially the
Viewport from the standard Coexistence View.
When viewing High Speed Live, only 802.11 traffic is visible. Because Bluetooth® packets are slow they are not
visible in High Speed mode.
1. Click on the Control window File menu and select Close.
2. The Control window will open again. Click on the Control Window File menu and select Go Live (HighSpeed Mode)
3. Click on the Control window Start Capture button
Coexistence View button
to begin capturing data. Click on the
and the High-Speed View will appear.
- 190 -
Chapter 4 Capturing and Analyzing Data
ComProbe BPA 600 User Manual
The Coexistence View (High Speed Live Mode) window will appear.
Figure 4.19 High-Speed Live Window
4.4.6 About The Message Sequence Chart (MSC)
The Message Sequence Chart (MSC) displays information about the messages passed between protocol layers.
MSC displays a concise overview of a Blutetooth connection, highlighting the essential elements fo the connection.
At a glance, you can see the flow of the data including role switches, connection requests, and errors. You can
look at all the packets int he capture, or filter by protocol or profile. the MSC is color coded for a clear and easy
view of your data.
- 191 -
ComProbe BPA 600 User Manual
Chapter 4 Capturing and Analyzing Data
Figure 4.102 - Message Sequence Chart Window
How do I access the chart?
You access the Message Sequence Chart by selecting the icon
or MSC Chart from the View menu from
the Control window or Frame Display.
What do I see on the dialog?
At the top of the dialog you see four icons that you use to zoom in and out of the
display vertically and horizontally. The same controls are available under the View
menu.
There are three navigation icons also on the toolbar.
This takes you to the first Information Frame.
This takes you to first Protocol State Message.
This takes you to the first Error Frame. Click here to learn more about this option.
If there is both Classic and low energy packets, there will be a Classic and LE tab at the top of the dialog.
- 192 -
Chapter 4 Capturing and Analyzing Data
ComProbe BPA 600 User Manual
Figure 4.103 - Classic and LE tabs
If the Classic tab is selected, you will see Classic protocols. If you select the LE tab, you will see LE Protocols. If
there is only Classic or only LE, the Classic and LE tabs will not appear.
Also along the top of the dialog are a series of
protocol tabs. The tabs will vary depending on the
protocols.
Clicking on a tab displays the messaging
between the master and slave for that
protocol. For example, if you select
RFCOMM, you will see the messaging
between the RFCOMM{M} Master, and
the RFCOMM{S} Slave.
The Non-Message Summary tab displays all
the non-message items in the data.
The Ctrl Summary tab displays the
signaling packets for all layers in one
window in the order in which they are received.
The information in the colored boxes displays general information about the messaging. The same is true for each
one of the protocols.
If you want to see the all the messaging in one dialog, you select the All Layers tab.
When you move the mouse over
the message description you see an
expanded tool tip.
If you position the cursor outside of
the message box, the tool tip will
only display for a few seconds.
If, however, you position the cursor
within the tool tip box, the message
will remain until you move the
cursor out of the box.
Additionally, If you right click on a message description, you will see the select Show all Layers button.
- 193 -
ComProbe BPA 600 User Manual
Chapter 4 Capturing and Analyzing Data
When you select Show all Layers, the chart will display all the messaging layers.
The Frame# and Time of the packets are displayed on the left side of the chart.
Figure 4.104 - Frame# and Time Display, inside red box.
If you click on the description of the message interaction, the corresponding information is highlighted in Frame
Display.
Figure 4.105 - MSC Synchronization with Frame Display
How do I navigate in the dialog?
You can use the navigation arrows at the bottom and the right side of the dialog to move vertically and
horizontally. You can also click and hold while moving the pointer within dialog that brings up a directional arrow
that you can use to move left/right and up/down.
Ctrl Summary tab
When you select the Ctrl Summary tab you will see a summary of the control and signaling frames in the order
that they are received/transmitted from and to devices.
- 194 -
Chapter 4 Capturing and Analyzing Data
ComProbe BPA 600 User Manual
Figure 4.106 - Control and Signaling Frames Summay
The frame numbered is shown, whether the message comes from the Master or Slave, the message Address, the
message itself, and the timestamp.
Additionally, the control/signaling packets for each layer are shown in a different background color.
Figure 4.107 - Packet Layers Shown in Different Colors
If you right click within the Ctrl Summary, you can select Show in MSC.
Figure 4.108 - Right-Click in Ctrl Summary to Display Show in MSC
The window then displays the same information, but in the normal MSC view.
- 195 -
ComProbe BPA 600 User Manual
Chapter 4 Capturing and Analyzing Data
Figure 4.109 - MSC View of Selected Packet from Ctrl Summary
You can return to the text version by using a right click and selecting Show in Text.
Figure 4.110 - Return to Text View Using Right-Click Menu
You can also choose to show:
l
Frame # only
l
Time only
l
Show both Frame# and Time
l
Hide both Frame# and Time
4.4.6.1 Message Sequence Chart - Search
The Message Sequence Chart has a Search function that makes it easy to find a specific type message within the
layers.
When you select the 1) Search icon
or 2) use
F3 key, the Select layer and message dialog
appears.
From this dialog you can search for specific protocol
messages or search for the first error frame.
- 196 -
Chapter 4 Capturing and Analyzing Data
ComProbe BPA 600 User Manual
1. On the MSC dialog select one of the protocol tabs at the top.
Note: If you select All Layers in Step 1, the Protocol Layers drop-down list is active. If you
select any of the other single protocols, the Protocol Layers drop-down is grayed out.
2. Or Open the Search dialog using the Search icon or the F3 key.
3. Select a specific Protocol Message from the
drop-down list.
4. Once you select the Protocol Message, click
OK
The Search dialog disappears and the first search
result is highlight in the Message Sequence Chart.
Figure 4.111 - Highlighted First Search Result
If there is no instance of the search value, you see this following dialog.
Once you have set the search value, you can 1) use the Search Previous
and Search Next
buttons or 2) F2 and F4 to move to the next or
previous frame in the chart.
4.4.6.2 Message Sequence Chart - Go To Frame
The Message Sequence Chart has a Go To Frame function that makes it easy to find a specific frame within
the layers.
In addition to Search, you can also locate specific frames by clicking on the Go To Frame
1. Click Go To Frame
in the toolbar.
2. Enter a frame number in the Enter frame No.: text box.
3. Click OK.
- 197 -
toolbar icon.
ComProbe BPA 600 User Manual
Chapter 4 Capturing and Analyzing Data
The Go To Frame dialog disappears and the selected frame is highlighted in the chart.
Once you have identified the frame in Go To, you can 1) use the Search Previous
and Search Next
buttons or 2) F2 and F4 keys to move to the next or previous frame in the chart.
4.4.6.3 Message Sequence Chart - First Error Frame
When you select Go to first error frame from the toolbar
, the Select layer dialog appears.
You have to select a layer from the drop down list to choose what layer you want to search for the error.
Once you select a layer, then OK, the first error for that layer will be displayed.
If no error is found, a dialog will announce that event.
4.4.6.4 Message Sequence Chart - Printing
There are three standard MSC print buttons. Print Preview, Print, and Cancel Printing.
- 198 -
Chapter 4 Capturing and Analyzing Data
ComProbe BPA 600 User Manual
Print Preview
1. When you select Print Preview
, the Print Setup dialog appears.
2. You next need to select your printer from the drop-down list, set printer properties, and format the print
output..
3. Then you select OK.
After you select OK, the Message Sequence Chart Print Preview dialog appears.
Figure 4.112 - Message Sequence Chart Print Preview
The information in the dialog will vary depending on the layer that is selected in the Message Sequence Chart, the
properties of the printer you select, and the amount of data in the layer (which will correspond to the number of
pages displayed).
You control what you see and when to print using the toolbar at the top of the dialog.
Figure 4.113 - Print Preview Toolbar
Table 4.20 - Print Preview Icons
Name
Icon
Description
Prints all the pages to the printer you
select in Print Setup dialog.
Print
When you select Print, you will output
the data that is currently being
displayed.
Cancel Printing
Cancels the current printing.
- 199 -
ComProbe BPA 600 User Manual
Icon
Chapter 4 Capturing and Analyzing Data
Table 4.20 - Print Preview Icons (Continued)
Name
Description
Zoom In Horizontially
Expands the data horizontally so it can
be easier to read.
Zoom Out Horizontally
Squeezes the data together so that more
fits on one page.
Zoom In Vertically
Expands the data vertically so it can be
easier to read.
Zoom Out Vertically
Squeezes the data so that more fits on
one page.
Current Page
The current page text box displays the
page number this is currently shown in
the dialog.
You can enter a number in the text box,
then press Enter, and the dialog will
display the data for that page.
If the data requires multiple pages, the
navigation buttons will take you to:
Page navigation
l
The first page
l
The previous page
l
The next page
l
The last page
Close Print Preview
Closes the dialog and returns to the
Message Sequence Chart
Select Font Size
Allows selection of the print font size
from the drop-down control.
4.5 Packet Error Rate Statistics
The Packet Error Rate (PER) Stats view provides a dynamic graphical representation of the Packet Error Rate for
each channel. The dialog displays a graph for each Classic Bluetooth® channel numbered 0 through 78 and for
each Bluetooth low energy channel numbered 0 through 39.
Packet Error Rate Stats assist in detecting bad communication connections. When a high percentage of retransmits, and/or header/payload errors occur, careful analysis of the statistics indicate whether the two devices
under test are experiencing trouble communicating, or the packet sniffer is having difficulty listening.
Generally, if the statistics display either a large number of re-transmits with few errors or an equal number of
errors and re-transmits, then the two devices are not communicating clearly. However, if the statistics display a
large number of errors and a small number of re-transmits, then the packet sniffer is not receiving the
transmissions clearly.
- 200 -
Chapter 4 Capturing and Analyzing Data
ComProbe BPA 600 User Manual
You can access this window in Classic Bluetooth® by selecting the Classic Bluetooth Packet Error Rates
Statistics icon
from the Control window or Frame Display. You can access this window in Bluetooth
low energy by selecting the Bluetooth low energy Packet Error Rates Statistics icon
from the
Control window or Frame Display. You can also open the window from the View menu on the same windows.
Classic Bluetooth Packet Error Rate
Figure 4.114 - Classic Bluetooth PER Stats Window
- 201 -
ComProbe BPA 600 User Manual
Chapter 4 Capturing and Analyzing Data
Bluetooth low energy Packet Error Rate
Figure 4.115 - Bluetooth low energy PER Stats Window
4.5.1 Packet Error Rate - Channels (Classic and low energy)
The main portion of the PER Stats dialog displays the 79 individual channels, 0-78, for Classic Bluetooth® and 40
individual channels, 0-39, for Bluetooth low energy.
- 202 -
Chapter 4 Capturing and Analyzing Data
ComProbe BPA 600 User Manual
Figure 4.116 - Classic Bluetooth Packet Error Rate Channels
Figure 4.117 - Bluetooth low energy Packet Error Rate Channels
- 203 -
ComProbe BPA 600 User Manual
l
l
l
l
l
l
For Classic Bluetooth: Each channel contains a bar that displays the number of packets with no errors in
green, packets with Header Errors in red, packets with Payload or CRC errors in dark red, and Retransmitted
packets in yellow.
The red number at the top of the channel shows the percentage of Header Error and Payload/CRC Errors in
relationship to the total number of packets in the channel.
The light blue number at the top of each channel shows the megahertz (MHz) for the channel if the option is
chosen in the Additional Statistics section.
When you select a channel, detailed information for that channel is displayed in the expanded chart on the
upper right.
The channels change dynamically as the Viewport is moved or new data appears within the Viewport.
The Channel Not Available symbol is displayed if the channel is not available in the most
recent channel map that is in or before the last selected packet, even if that channel map
comes before the first selected packet. Bluetooth Adaptive Frequency Hopping processes will
block channels determined to be unreliable. These channels are not available because the
Bluetooth devices have decided not to use them.
l
"s" changes the size of the entire dialog.
l
"c" changes the contrast of the dialog
l
Chapter 4 Capturing and Analyzing Data
The Reset button is only available in live mode. The button will appear in the
lower right-hand corner of the Channels section. Clicking on the Reset button will
clear all prior data from PER Stats.
4.5.2 Packet Error Rate - Pie Chart and Expanded Chart
The Expanded PER Stats Chart (in the upper right ) displays detailed information about the channel selected
from the main channel dialog.
Expanded Chart
Pie Chart
- 204 -
Chapter 4 Capturing and Analyzing Data
l
l
l
l
l
ComProbe BPA 600 User Manual
When PER Stats is first opened, Channel 0 is displayed in the expanded chart.
The top orange number on the Y-Axis displays the maximum number of packets in Snap Mode. If Snap Mode
is turned off, the number will display in light blue.
The number of the selected channel is displayed in the upper-left corner of the expanded chart.
The combined value of Header and Payload/CRC errors for the channel is displayed in red as a percentage to
the right of the channel number.
The megahertz (MHz) value is displayed in light blue text if the MHz option is selected in the Additional
Statistics section.
l
The number of packets with no errors is displayed in light green in the bar chart.
l
For Classic Bluetooth® : The number of packets that have header errors is displayed in red in the bar chart.
l
For Classic Bluetooth: The number of payload errors is displayed in dark red in the bar chart.
l
For Classic Bluetooth: The number of re-transmits is displayed in yellow in the bar chart.
l
All the values, except MHz, change dynamically when multiple time periods are selected in the Scroll Bar.
l
When you select the
in the upper-right corner, the bar chart is replaced by a
pie chart. The pie chart applies to all channels, not a selected channel. To return
to the bar chart, click on the channel again or click on the
in the upper right
hand corner.
4.5.3 Packet Error Rate - Legend
The Legend displays color coded information about the channel selected.
Bluetooth low energy
Classic Bluetooth®
For Classic Bluetooth
l
l
The number of Packets with No Errors and percentage of packets with No Errors in relationship to total
packets for the channel is displayed in green.
The number of Packets with Header Errors and percentage of packets with Header Errors in relationship
to total packets for the channel is displayed in red.
- 205 -
ComProbe BPA 600 User Manual
l
l
l
Chapter 4 Capturing and Analyzing Data
The number of Packets with Payload/CRC Errors and percentage of packets with Payload/CRC Errors
in relationship to total packets for the channel is displayed in dark red.
The number of Retransmitted Packets and percentage of Retransmitted packets in relationship to total
packets for the channel is displayed in yellow.
Total packets and Total percentage is displayed in light blue.
For Bluetooth low energy:
l
l
l
The number of Packets with No Errors and percentage of packets with No Errors in relationship to total
packets for the channel is displayed in green.
The number of Packets with CRC Errors and percentage of packets with CRC Errors in relationship to
total packets for the channel is displayed in dark red.
Total packets and Total percentage is displayed in light blue.
For a description of the Channel Not Available symbol, see PER Stats Channel.
4.5.4 Packet Error Rate - Additional Statistics
This Additional Statistics section of PER Stats displays
information about selected packets, duration, and Y-Axis max,
and it also has two controls.
l
Selecting MHz On
displays the megahertz value for
each channel in the main channels chart and also in the
expanded chart.
l
l
l
Selecting MHz Off
removes the megahertz value.
Selected Packets displays the packet range selected in the
Scroll Bar. This includes inapplicable Inapplicable packets include Wi-Fi packets, Sniffer Debug packets, any
packets that are not relevant to PER Stats. Inapplicable packets do not appear as part of the Additional
Statistics. packets.
Selected Duration identifies the total amount of time in the selected packet range displayed in the Scroll
Bar.
l
Duration Per Bar in Scrollbar: identifies the amount of time represented by each bar in the Scroll Bar.
l
The Channel Graph Y-Axis Max can display two different values. When the Snap Arrow is orange
the values for channels in the main chart are shown in relative terms in Snap Mode. This means that one
channel (or channels) with the greatest value is "snapped" to the top of the chart. In the graphic below left,
Channel 33 is snapped to the top of the chart.
- 206 -
,
Chapter 4 Capturing and Analyzing Data
ComProbe BPA 600 User Manual
The channel(s) with the greatest value become a full-scale reference
display for the other channels that have been relatively scaled. Channel
comparisons become easier. With Snap On you can select multiple time
values in the Scroll Bar. When the Snap Arrow is white
(Snap Mode
turned off), the values for channels in the main chart are shown in
absolute values where the max value of each channel graph is the same
regardless of the position of the Viewport. Channel 33, which is snapped to the top of the chart in Snap Mode
(shown above left), appears like the right image when Snap Mode is turned off.
l
Scrollbar Y-Axis Max displays the maximum Y-Axis value in the Scroll Bar.
4.5.5 Packet Error Rate - Sync Selected Packets With Other Windows
By default, and unlike other windows, PER Stats is not synchronized with
other windows such as Frame Display in that selecting a frame range in one
does not highlight the same frame range in the other. This ensures that
Frame Display isn’t constantly re-synchronizing during live capture while the
view-port is maximized in PER Stats. If PER Stats synchronization is desired, it can be enabled by checking the
Sync Selected Packets with Other Windows check box. 4.5.6 Packet Error Rate - Export
The Export section of PER Stats allows you to export data to a .csv or .txt file.
1. To use the Export, select a range of data using the Viewport.
2. Select .csv or .txt from Export Selected Data, depending on what
type of data file you want. The Save As dialog appears.
- 207 -
ComProbe BPA 600 User Manual
Chapter 4 Capturing and Analyzing Data
Figure 4.118 - Save As dialog in PER Stats Export
3. Select a location where you want to save the file in "Save in:".
4. Enter a file name in "File name:".
5. Select "Save".
The file will be saved to that location.
4.5.7 Packet Error Rate - Scroll Bar
The PER Stats Scroll Bar displays stats for all packets, divided into equal time intervals.
Figure 4.119 - PER Stats Scroll Bar
l
l
Captured data begins to appear on the left and fills the width of the bar, left to right.
The vertical bars in the Scroll Bar each indicate a fixed duration. When data first appears in the Scroll Bar
as it is being captured, each bar equals one second. When the data fills the bar, reaching the right side limit,
- 208 -
Chapter 4 Capturing and Analyzing Data
ComProbe BPA 600 User Manual
the last bar moves back to the center of the Scroll Bar. The bars stay the same size, but doubles in duration
(for example, the first time the Scroll Bar fills, the bars return to the middle, but now each bar represent
two seconds of time instead of one). Each time the bars cycle to the middle, the time they represent doubles.
When the bars move and the Viewport (see below) is not maximized, the Viewport moves with the bars so
that the same packet range is indicated. When the Viewport is maximized it stays maximized regardless of
what the bars do. This ensures that the display can be made to reflect all packets at all times by maximizing the
.
l
l
l
l
l
l
The Viewport is used to select single
or multiple vertical bars
.
You can drag the sides of the Viewport or the slider buttons to select multiple bars, representing a greater
time range.
You can click and drag the Viewport within the Scroll Bar.
When you select a packet range in Frame Display that includes only some of the frames in PER Stats, the
Viewport snaps up against the side of the bar with the unselected frames .
When you select a packet range in Frame Display that includes all of the frames in PER Stats, the Viewport
displays a space between the Viewport sides and the bar .
Double clicking anywhere inside the Scroll Bar selects the entire Scroll Bar. Double clicking again toggles
back to the previous size of the Viewport.
l
Selecting Ctrl+A is the same as double-clicking.
l
Clicking on a vertical bar left justifies the Viewport to that bar.
l
Shift-clicking on a bar extends the nearest Viewport side to include that bar.
l
The Home key moves the Viewport to the left edge.
l
The End key moves the Viewport to the right edge.
l
Pressing the left arrow button
, the left arrow key, or the up arrow key moves the Viewport to the left,
one vertical bar at a time.
l
Pressing the right arrow button
. the right arrow key, or the down arrow key moves the Viewport to the
right, one vertical bar at a time.
l
Pressing the double left arrow button
or the PgUp key moves the Viewport to the left by the current
width of the Viewport. Holding down the Shift key will prevent the Viewport from moving if there is not
enough room to move by its full width.
l
Pressing the double right arrow button
or the PgDn key moves the Viewport to the right by the current
width of the Viewport. Holding down the Shift key will prevent the Viewport from moving if there is not
enough room to move by its full width.
- 209 -
ComProbe BPA 600 User Manual
Chapter 4 Capturing and Analyzing Data
l
Holding the Shift key down and the right or left arrows moves the right side of the Viewport. l
Holding the Ctrl key down and the right or left arrows moves the left side of the Viewport.
l
l
l
The Scroll bar includes inapplicable packets (sniffer debug, WiFi, etc) so that the packet range selected in
Frame Display can be shown. Inapplicable packets are not, however, included in the statistics reports.
If the Viewport is adjusted within PER Stats, as opposed to selecting a packet range in Frame Display, it uses
only whole bars on both sides.
Statistics are retained for all packets regardless of whether any of those packets have wrapped out. You can
select the Reset button
, which is located above the right portion of the Scroll Bar, to discard all
stats for packets received up to that point.
l
The Reset button is only available when you are capturing data.
4.5.8 Packet Error Rate - Excluded Packets
ID packets and packets that are missing channel numbers (such as HCI and BTSnoop) will not display data. ID
packets are excluded because they can not have errors or indicate retransmission and therefore dilute the
percentages for other packet types. Packets without channel numbers are excluded because the graphs are
channel-specific. Before packets are captured, the Scroll Bar in Classic Bluetooth PER Stats contains the message
"ID packets and packets without a channel number (such as HCI) are excluded", and the Scroll Bar in Bluetooth low
energy PER Stats contains the message "Packets without a channel number (such as HCI) are excluded".
- 210 -
Chapter 4 Capturing and Analyzing Data
ComProbe BPA 600 User Manual
Figure 4.120 - Example: Excluded Packets Message in Scroll Bar (Classic Bluetooth)
4.6 Bluetooth Audio Expert System
The Bluetooth Audio Expert System monitors and analyzes Bluetooth audio
streams with the purpose of detecting and reporting audio impairments. The
primary goal of the Audio Expert System is to expedite the detection and
resolution of Bluetooth protocol related audio impairments. To achieve this,
the system automatically identifies audio impairments and reports them to a
user as “events”. It also correlates the audio events with any detected codec
or Bluetooth protocol anomalies (events). The system allows a user to view the audio waveform, audio events,
codec events, and Bluetooth protocol events on a time-aligned display.
An Audio Expert System event identifies to the user information, warnings, and errors. Event categories are
shown in the following table.
Table 4.21 - Audio Expert System General
Events
Event Category General Events Reported
Bluetooth Protocol Protocol violations
Best practice violations
Codec
Configuration changes
errors
Audio
impairments (errors)
information data
When the ComProbe software captures data, if there is audio content that must be debugged this data must be
systematically examined when looking for the problem source. The effort to identify and correlate the audio
related data can be daunting because the problem source may be caused by protocol, codec, or the audio itself.
Using the Audio Expert System identifies events that are likely candidates for audio root cause analysis. The expert
system examines all captured frames—in live capture or in capture file viewer—and selects audio-related
protocol, codec, and audio events. The events are time correlated to the audio stream and identified with specific
frames. In general, a cluster of events suggests an area for investigation, and in the presence of multiple event
clusters the cluster with the most events suggests the best starting point.
The expert system works in conjunction with ComProbe Protocol Analysis System that is operating in live capture
mode or in capture file viewer mode. Selecting an event in the Audio Expert System will simultaneously highlight
related packets in the ComProbe software Frame Display, Coexistence View, Message Sequence Chart,
Bluetooth Timeline, and Packet Error Rate Statistics (PER Stats) windows.
Audio Expert System further provides methods for isolating testing to specific audio events by using two operating
modes: non-referenced and referenced.
- 211 -
ComProbe BPA 600 User Manual
Mode
Chapter 4 Capturing and Analyzing Data
Table 4.22 - Audio Expert System Operating Modes
Description
Non-referenced
Processing audio of completely unknown program content (e.g.
arbitrary music or speech content). Since the system does not
have any prior knowledge of the audio being analyzed, the types
of audio analysis that can be performed is limited.
Referenced
A “pseudo closed loop” test scenario where the user plays specific
Reference Audio files (pre-recorded audio test files provided by
Frontline) on the Source DUT (Device Under test). The analysis of
the received audio results in a series of “Audio Events” being
reported by comparing changes in the received audio to expected
changes of the Reference Audio, and reporting deviation events
when they occur.
Reference mode detects a larger number of events because the reference audio has specific frequency,
amplitude, and duration occurring at known points in time allowing for precise comparison.
4.6.1 Supported Codec Parameters
Supported Parameters for SBC Codec
l
Sampling Frequencies: 16 KHz*, 32 KHz*, 44.1 KHz, 48 KHz
l
Channel Modes: Mono, Dual Channel, Stereo, Joint Stereo
l
Block Length: 4, 8, 12, 16
l
Number of subbands: 4, 8
l
Allocation Method: SNR, Loudness
l
Minimum Bitpool Value: 2
l
Maximum Bitpool Value: 53
Supported Parameters for MPEG-2, 4 AAC
l
l
Object Types; MPEG-4 AAC LC
Sampling Frequencies: 44.1 KHz, 48 KHz, 8 KHz*, 11.025 KHz*, 12 KHz*, 16 KHz*, 22.050 KHz*, 24 KHz*, 32
KHz*, 64 KHz*, 88.2 KHz*, 96 KHz*
l
Channels: 1 and 2
l
Variable Bit Rate and Specified Bit rate
* Audio Analysis not supported . Although, user will be able to play back the audio live.
Supported Parameters for aptX
l
Object Types; aptX-classic, aptX-LL (both content protected and non-content protected)
l
Audio Format: 16-bit, 44.1kHz
l
Data Rates: 352 kbps
- 212 -
Chapter 4 Capturing and Analyzing Data
ComProbe BPA 600 User Manual
Supported Parameters for CVSD
l
Channel Mode: Mono
l
Sampling Rate: 64 kHz
Supported Parameters for mSBC codec
l
Channel Mode: Mono
l
Sampling Rate: 16 kHz
l
Allocation method: Loudness
l
Subbands: 8
l
Block Length: 15
l
Bitpool: 26
4.6.2 Starting the AudioExpert System (BPA 600 only)
To use the Audio Expert System, the user must have
l
l
Current Premium Maintenance purchased from Frontline
ComProbe hardware, with Audio Expert System license installed, connected to the PC. This is a requirement
for both live capture and when viewing a saved capture file.
For live capture, set up the ComProbe BPA 600 datasource and begin capturing data.
Note: Proper positioning of the ComProbe hardware relative to the devices under test (DUT1source, DUT2-sink) will contribute to effective data capture. Air Sniffing: Positioning Devices on
page 63.
For viewing a capture file, load the saved file from the ComProbe Control window File menu.
When an audio stream is available the open the Audio Expert System Window by clicking on the Control
window Audio Expert System button
. If the ComProbe analyzer is not licensed for Audio Expert System, the
button will not be present.
4.6.3 Operating Modes
The Bluetooth audio analysis can be accomplished in two modes: 1) unreferenced mode, and 2) referenced
mode.
4.6.3.1 Non-Referenced Mode
In Non-Referenced Mode, the system is typically processing audio of completely unknown program content (e.g.
arbitrary music or speech content). Since the system does not have any prior knowledge of the audio being
analyzed, the types of audio analysis that can be performed is limited.
The following events are reported whenever the system is operating in Non-Reference mode. These are the
meaningful audio analysis that the system can perform without reporting too many false positive results.
- 213 -
ComProbe BPA 600 User Manual
l
l
l
l
Chapter 4 Capturing and Analyzing Data
Volume Level (Low Volume or High Volume): Reported if the average volume level is not in a range conducive
to performing meaningful audio analysis.
Clipping: Amplitude distortion due to a signal amplitude exceeding the maximum value that can be
represented by the digital system
Dropout: Abrupt and very short duration intervals of silence
Glitch: Extremely large sample-to-sample audio amplitude transitions that have little probability of occurring
within natural speech or music
4.6.3.2 Referenced Mode
In Referenced Mode, the system operates in a “pseudo closed loop” test scenario where the user plays a specific
Reference Audio file on the Source DUT. The Source DUT negotiates with the Sink DUT to determine the
appropriate codec and audio parameters to use and will then process the Reference Audio file accordingly before
transmitting the resulting audio via Bluetooth. The Reference Audio is a pre-recorded audio test file provided by
Frontline in the ComProbe Protocol Analysis System installer.
The Sink DUT receives the encoded audio, decodes it, and processes it for playback. In parallel, the ComProbe BPA
600 analyzer snoops the over-the-air signal between the Source DUT and Sink DUT and emulates the RF reception
and decoding done inside the Sink DUT. The Audio Expert System automatically detects that a Reference Audio
file is being received and then analyzes the resulting audio for deviations from expected parameters.
Referenced Audio files are protocol specific.
The following events are reported whenever the system is operating in the Referenced mode.
l
Test ID Found
l
Test Script Not Found
l
Invalid Test Script
l
Synchronization Lost
l
Unexpected Frequency
l
Unexpected Level
l
Unexpected Duration
l
Amplitude Fluctuation
l
Unexpected Phase Change
l
Clipping
l
Excess Noise
l
CVSD HF Level Too High
l
End of Test
- 214 -
Chapter 4 Capturing and Analyzing Data
ComProbe BPA 600 User Manual
Reference Audio Test Files
The Reference Audio files are specific audio files that exercise the system so that audio impairments can more
efficiently and accurately be identified and reported. The Reference Audio files are composed of a series of backto-back and relatively short duration tones of changing amplitude, frequency, and duration.
The test files are stored on the users computer In the directory "\Frontline ComProbe Protocol Analysis
System\Development Tools\Audio Expert Test Files\". For example,
Test_1.03_48kHz_16Bit_3Loops_2Ch.wav
Note: Reference test files are periodically updated. Shown here is an example. Files delivered
with your latest Frontline ComProbe software version may have changed. Contact Frontline
Technical Support for information on the latest reference file versions.
The test files have a set of tones forming a unique Test ID that lets the ComProbe analyzer know that it is capturing
a test file instead of an arbitrary audio stream. There is no need for special configuration of the ComProbe
analyzer. The Test ID will have the identifier notation N.vv, where N = the file number and vv = a two digit version,
for example 1.02.
Using the Test Files
The analysis of the received audio results in a series of Audio Events being reported by comparing changes in the
received audio to expected changes of the Reference Audio, and reporting deviation events when they occur.
The system starts up in Non-Referenced mode, and is continuously looking for a valid Reference Audio file by
measuring frequency and amplitude of the received over-the-air audio. Transitioning to Referenced mode
requires the successful detection of a Test ID tone sequence of proper frequency, duration, and value.
Once the Referenced Mode state is achieved, the expectation is that all tones encountered will conform to the
script identified by the Collected Digits (the “Test ID”). The system remains in the Referenced Mode state until
either the end of test is reached, or a loss of synchronization occurs.
The synchronization of the received audio (from the Reference Audio files) versus the internal Test Script is
achieved based on changes in frequency of the tones in the Reference Audio file. Frequency changes are used
because this parameter is relatively immune to the configuration of the network.
For a comparison of reference mode detectable problems to unreferenced detectable problems see the table in
the audio event type table.
- 215 -
ComProbe BPA 600 User Manual
Chapter 4 Capturing and Analyzing Data
The Test Script
The Reference Audio used for Referenced Mode testing is generated
from scripts that define a series of audio segments. Each segment
provides an audio tone parameters including frequency, amplitude,
duration, fade in and fade out durations, and start time. The script is
an XML file delivered with the ComProbe Protocol Analysis System
software. This file is used during Referenced mode testing for
comparison to the "sniffed" Reference Audio parameters of
frequency, amplitude, duration, etc.
Below is a sample script table and the resulting sample Reference
Audio .wav file. The generated .wav file begins with a Test ID that is
used to identify the "sniffed" audio as a Reference Audio file, and the
Audio Expert System automatically switches from Non-Referenced
mode to Referenced mode.
Table 4.23 - Sample Test Script Table
Segment OpCode Frequency Level Cycles Duration Fade in Fade Out Start Time
1
F
200
0
5
0.025
0
0
0.000
2
F
1000
0
25
0.025
0
0
0.025
3
F
300
-12
15
0.050
0
0
0.050
4
F
600
0
30
0.050
0
0
0.100
5
F+
880
-6
44
0.050
0
0
0.150
6
F+
240
-6
12
0.050
0
0
0.150
7
F
600
-95
30
0.050
0
0
0.200
8
F
600
0
30
0.050
0
10
0.200
4.6.3.3 Referenced Mode Testing Processes
In the Referenced mode, the devices under test use a specific audio file (called reference file or test file)
provided by Frontline whose contents are already known to the ComProbe software. The software compares the
parameters of the received audio data against its parameters and presents analysis for the user. Commonly, in
Bluetooth technology the music sent via A2DP and speech sent via HFP. There are a few ways users can conduct
referenced mode testing depending upon what profile they are using. The figure 17 shows the source of the
audio and the medium through which it can be accessed by Source device to send to sink device via Bluetooth.
- 216 -
Chapter 4 Capturing and Analyzing Data
ComProbe BPA 600 User Manual
Table 4.24 - Referenced Mode Testing Process Between Two DUTs
Audio Source Process to Send Using A2DP Process to Send Using HFP
A file stored
on the
device’s local
memory
Play the locally stored file on the
audio source device
Play using the third party App
that transmits music data on
HFP.
Streaming
audio over a
cellular
network
Play the test in a browser on the
audio source device
Make a call to 434-964-1407 or
434-964-1304 through a cellular
network. The phone number
receiving the call playbacks
recorded test signal.
https://youtu.be/rmirDbikrtM
Play the test in a browser on the
Streaming
audio source device
audio over a
Wi-Fi network
https://youtu.be/rmirDbikrtM
Make a call to 434-964-1407 or
434-964-1304 through a VoIP
provider such as Skype. The
phone number receiving the call
playbacks recorded test signal.
Potential problem: The VoIP
provider might use custom
codecs and cause undesirable
behavior.
A2DP
Playing the test file locally
The simplest way to perform music data testing is to directly play the reference file from DUT1 to DUT2. To do
that, save the reference file provided with the ComProbe software on the Source device. Then connect the
Bluetooth enabled devices and play the music file from one device to the other. The software will automatically
detect the mode and present analysis for the user.
Playing the test file via Internet
If the user is testing a scenario where they need to analyze audio played through the internet (either using Wi-Fi
or cellular data plan), they may access the reference file on YouTube provided by Frontline https://youtu.be/rmirDbikrtM. Note that the software is only analyzing the Bluetooth link between the two DUTs.
Any abnormalities at the Wi-Fi and cellular network level will affect the audio quality that may not be Bluetooth
protocol related and the software will not be able to detect that.
HFP
Playing the test file by calling a phone number
Frontline provides the following phone numbers - 434-964-1407 and 434-964-1304 that users can call, to conduct
speech audio data analysis over Bluetooth. The calls can be made using the cellular network (most common
method) or VoIP. Again, the VoIP provider might use custom codecs and cause undesirable behavior which
cannot be detected by Audio Expert System software.
Playing the test file using Third party Apps
Bluetooth Audio Expert System Reference mode testing can be accomplished using third party apps on Android,
iOS, and Windows phones. The following apps are available from their respective App stores:
- 217 -
ComProbe BPA 600 User Manual
l
BTmono, Android
l
Blue2Car, IOS
l
Windows Headset player lite
Chapter 4 Capturing and Analyzing Data
Note: When selecting and using these apps, thoroughly review all the vendor documentation.
While Frontline has conducted testing of these apps, Frontline has not completed full
interoperability testing with our library of Bluetooth devices and does not warrant the use of these
apps with every device when using the following procedures. Frontline does not provide support or
maintenance for third party apps. Any issues or questions should be directed to the app developer.
1. In the following steps Device Under Test 1 (DUT1) is the device sending the reference test file to DUT2.
2. Download the third party app to DUT1 and follow the app vendor's instructions for installation and use.
3. Load the Audio Expert System reference test file
"Test_1.02_64.1kHz_16Bit.wav"
on DUT1.The test file is stored on the users computer In the directory "\Frontline ComProbe Protocol
Analysis System\Development Tools\Audio Expert Test Files\".
Note: Reference test files are periodically updated. Shown here is an example. Files
delivered with your latest Frontline ComProbe software version may have changed.
Contact Frontline Technical Support for information on the latest reference file versions.
4. With the BPA 600 connected to the computer, configure the datasource, and follow procedures to
capture data.
5. Launch Audio Expert System by clicking on the Control window
.
6. Turn on Bluetooth on your DUTs, DUT1 and DUT2. Turn on the third party Bluetooth app for routing the
reference file over A2DP or HFP by following the vendor's directions.
7. Send the reference test file from DUT1 to DUT2 via the third party app.
8. Observe the events in the Audio Expert System Events Table. Look for an event Description:
“TestIDFound : REF: Test ID 1.02, Channel Gain = -11.8 dB TermFreq=400.0”.
Note: This is an example. The display may vary with the reference file version.
The ComProbe analyzer has successfully detected the reference test signal and the system is locked into
reference mode.
- 218 -
Chapter 4 Capturing and Analyzing Data
ComProbe BPA 600 User Manual
Figure 4.121 - Test Cases for Referenced Mode Testing
4.6.3.3.1 System Calibration for Referenced Mode
The objective is to achieve settings at the Bluetooth source device (DUT1) that bring the PCM sample levels of
tones in the Reference Audio files sent over-the-air as close as possible to the levels at which they were created,
without exceeding them. Test ID tones, and the tones in test file sequences for Referenced Mode are generally
recorded with a maximum tone segment level of -3 dBFS, although there are a few exceptions where signal levels
may be as high as -1 dBFS.
Figure 4.122 - Test_1.02_44.1kHz_16Bit.wav Waveform
Show in the image above, is a graphic of the overall envelope of the Reference Audio test file “Test_1.02_
44.1kHz_16Bit.wav. Test 1.02 is a test file that enables a wide range of tests that includes a number amplitude
changes, frequency changes, intentional silence, and multi-frequency tone segments. Its goal is to flush out the
audio chain’s general ability to convey amplitude, frequency, silence, and duration.
The ideal calibration for this file is one where the waveform visualization on Frontline’s Expert System User
Interface (UI) looks identical to the one shown below with respect to maximum levels. In particular, there are
three segments in this test whose peaks are at exactly -6 dBFS. That is, there is zero loss or gain through the chain.
- 219 -
ComProbe BPA 600 User Manual
Chapter 4 Capturing and Analyzing Data
Table 4.25 - Test 1.02 -6 dBFS Segments
These -6 dBFS segments are described in the
SegmentID Frequency, Hz Start Time, sec. Duration, sec. Test 1.02 -6dBFS Segments table . These
segments serve as a convenient and quick
32
800
2.800
0.100
visual indicator that levels are appropriate,
especially the longer 3rd case which is
35
1120
3.100
0.100
evident at the 4.999 second reference time of
40
400
4.300
0.900
the above image(a little over 2/3 of the way
through the test).
The first 0.500 seconds of Test 1.02, which contains the Test ID value “1.02” is shown below. The three digits ‘1’,
‘0’, and ‘2’ are represented by the low frequencies 210Hz, 200Hz, and 220Hz, respectively, which are 100
milliseconds in duration, and are separated by 1 kHz digit delimiters of 50 milliseconds duration. The final tone is a
100 millisecond segment at 400 Hz, defined as a “Test ID Terminator”. Note that since the levels of all of these
tones are at exactly -3 dBFS, the peak levels should be exactly halfway between any available -6 dBFS (50%)
gridline.
Figure 4.123 - Test 1.02 Test ID Segment
The three digits ‘1’, ‘0’, and ‘2’ are represented by the low frequencies 210 Hz, 200 Hz, and 220 Hz, respectively,
which are 100 ms in duration, and are separated by 1 kHz digit delimiters of 50 ms duration. The final tone is a 100
ms segment at 400 Hz, defined as a “Test ID Terminator”. Note that since the levels of all of these tones are at
exactly -3 dBFS, the peak levels -3 dBFS.
The value in the Info1 parameter of the “Test ID Found” event is optimally the value 23196 and may be converted
to dBFS by the relationship
(
dBFS = 20log 10
info1
32767.0
).
Optionally the value can be interpreted as “Channel Gain” via the relationship
(
dB = 20log 10
info1
23196.0
Table 4.26 - "Test ID Found" Event "info1"
Maximum and Minimum Values
Format
Integer
Level
Application Maximum Minimum
Speech
23196
5826
Music
23196
3297
Speech
-3 dBFS
-15 dBFS
- 220 -
).
Chapter 4 Capturing and Analyzing Data
ComProbe BPA 600 User Manual
Table 4.26 - "Test ID Found" Event "info1" Maximum and Minimum Values (continued)
Format
Application Maximum Minimum
Music
Chanel Gain Speech
Music
-3 dBFS
-20 dBFS
0 dB
-12 dB
0 dB
-17 dB
This table indicates the maximum and minimum
acceptable levels for the “Test ID Found” Info1
parameter in integer form, decibel level in dBFS, and
Channel Gain in dB.
Example 1: For the case where the Info1 parameter is
converted to “Channel Gain”, if the audio is speech (i.e.
transported via a SCO channel), then a value of -11.9 dB
is acceptable, and a value of -12.1 dB is not.
Example 2: For the case where the Info1 parameter is
converted to “Channel Gain”, if the audio is music (i.e. transported via an A2DP connection), then a value of -16.9
dB is acceptable, and a value of -17.1 dB is not.
For both cases, at the high volume end, a value of -0.1 dB is acceptable, a value of 0.1 dB is not.
The dynamic range of the audio path is important to understand because it has a direct impact on measurement
accuracy. Only levels at or above the minimum and at or below the maximum are examined for expected level
and frequency.
4.6.3.3.2 Adjusting for Optimal Volume Levels
The exact steps that need to be taken depend on the exact devices being used, and their device specific setup
requirements, and the speech or audio configuration under test. For the simplest case where, for example, a
“music” audio file is to be played by a smartphone to a set of Bluetooth speakers, the typical steps would include
the following.
1. Choose an audio reference file to be played at DUT1 appropriate for the configuration to be tested.
The test files are stored on the users computer In the directory "\Frontline ComProbe Protocol Analysis
System\Development Tools\Audio Expert Test Files\". For example,
Test_1.03_48kHz_16Bit_3Loops_2Ch.wav
Note: Reference test files are periodically updated. Shown here is an example. Files
delivered with your latest Frontline ComProbe software version may have changed.
Contact Frontline Technical Support for information on the latest reference file versions.
2. Before establishing the Bluetooth connection, play the file while listening to it on the DUT1 device itself,
and become familiar with the overall sound quality, generally ignoring exact volume.
3. Set the playback volume at DUT1 to maximum.
4. Set the playback volume at DUT2 to minimum.
5. Establish the Bluetooth connection and begin playback of the file on DUT1, if possible in “Loop” or
“Repeat” mode to avoid having to continuously restart.
6. Slowly increase the volume on DUT2 until it is at a comfortable level.
7. If the audio sounds distorted, reduce the playback volume at DUT1, and repeat Step 6.
8. When the clarity of the audio is comparable to that heard when listening to the DUT1 device, proceed with
using Frontline’s ComProbe Analyzer with Audio Expert System enabled to capture and analyze the
Bluetooth data.
- 221 -
ComProbe BPA 600 User Manual
Chapter 4 Capturing and Analyzing Data
9. Visually observe the waveform in the Audio Expert System Wave Panel comparing it to the image above,
Figure 1.1. If the level of the -6 dB, 0.9 sec duration, 400 Hz tone (a little over 2/3 of the way through the
test) is grossly above or below the –6 dB (50% volume) grid line, adjust the DUT1 volume accordingly and
repeat this step. Optimally it would be on or just below the -6 dB gridline, but not above. The peak should
never hit the maximum positive or negative limits of the display.
10. Find the “Test ID Found” event in the Event Table to verify that the system has transitioned to
Referenced Mode, and verify that the value for “Channel Gain” (or “Level” as implemented in the UI) is
within the range of values specified in Table 1-2.
If the observed (captured) waveforms do not reasonably conform to the above graphic for Test_1.02, or the “Test
ID Found” event is not reported, there is a problem along the audio chain. This could be as simple as a
configuration setting, or more subtle such as an encoder/decoder incompatibility.
4.6.4 Audio Expert System Event Type
The following tables list the Audio Expert System Bluetooth, Codec, and audio events with description. Included in
the tables is the event severity that can have three values: Information, Warning, and Error. The event severity
will appear as icons and text in the Audio Event System once an audio streams has been captured. Refer to 4.6.5.3
Event Table, Event Table Columns on page 242 for an explanation of the severity types.
4.6.4.1 Event Type: Bluetooth Protocol
Table 4.27 - Event Type: Bluetooth Protocol
Protocol Severity
Description
A2DP
Warning AVDTP signal response received for unknown command.
A2DP
Warning Unrecognized capability type
A2DP
Error
eSCO parameters requested.
A2DP
Error
Profile TX PDUs larger than available bandwidth for active A2DP Streaming interval.
A2DP
Error
Bitpool value does not match configured bitpool range.
A2DP
Error
Attempt to suspend inactive stream.
A2DP
Error
Configuration attempt using unsupported CODEC.
A2DP
Error
Incorrect AVTDP command length.
A2DP
Error
Unknown command Stream End Point Identifier (SEID).
A2DP
Error
A2DP stream configuration attempt using invalid CODEC parameters.
A2DP
Error
A2DP stream configuration request sent during active stream.
A2DP
Error
Audio data length does not match length header.
A2DP
Error
Incorrect A2DP SBC frame fragmentation.
A2DP
Error
A2DP SBC frame header contents does not match stream configuration.
A2DP
Error
Attempt to configure A2DP stream with unsupported configuration.
A2DP
Error
Reported A2DP stream capabilities do not contain mandatory features.
A2DP
Error
A2DP streaming L2CAP channel not disconnected after ABORT operation.
- 222 -
Chapter 4 Capturing and Analyzing Data
ComProbe BPA 600 User Manual
Table 4.27 - Event Type: Bluetooth Protocol(continued)
Protocol Severity
Description
A2DP
Error
Fragmented AVDTP packet not terminated before sending next packet.
A2DP
Error
Invalid AVDTP transaction ID.
A2DP
Error
Missing AVDTP command response.
A2DP
Error
Unrecognized A2DP content protection type.
A2DP
Error
Attempt to configure delay reporting during incorrect stream state.
A2DP
Error
Attempt to open A2DP stream that has not been configured.
A2DP
Error
Attempt to close A2DP stream that is not active.
A2DP
Error
A2DP streaming channel created before configuration completed.
A2DP
Error
Configuration command contains invalid length parameter.
A2DP
Error
Configuration command contains invalid media transport format.
A2DP
Error
SBC CRC Error.
A2DP
Error
SBC invalid channel mode.
A2DP
Error
SBC invalid header.
A2DP
Error
Invalid AVDTP configuration parameter.
A2DP
Error
Invalid AVDTP stream state
4.6.4.2 Event Type: Codec
Table 4.28 - Event Type: Codec
Codec
Severity
Event
Description
SBC
Information Codec Initialization
Codec session started
SBC
Information Codec tear-down
Codec session ended
SBC
Information Stream Re-configuration
Stream Re-configuration
SBC
Error
Incorrect Configuration
Detected
SBC Codec detected a change in audio
parameters
SBC
Error
Lost Sync
SBC Codec expected to find synch word:
0x9C instead found: 0x: typically due to
corrupted data
SBC
Error
Bad Header
SBC Codec detected corrupted header:
typically due to corrupted data
SBC
Error
CRC Failure
SBC Codec detected bad CRC: typically
due to corrupted data
SBC
Error
No output
SBC Codec generated no output due to
corrupted data
mSBC
Information Codec tear-down
Codec Session Ended
- 223 -
ComProbe BPA 600 User Manual
Chapter 4 Capturing and Analyzing Data
Table 4.28 - Event Type: Codec(continued)
Codec
Severity
Event
Description
mSBC
Information Stream Re-configuration
mSBC
Warning
Packet Loss Concealment mSBC Codec detected a bad frame and
generated substitute data to compensate
for it
mSBC
Error
Incorrect Configuration
Detected
mSBC Codec detected a change in audio
parameters
mSBC
Error
Lost Sync
mSBC Codec expected to find synch
word: 0xAD instead found: 0x: typically
due to corrupted data
mSBC
Error
Bad Header
mSBC Codec detected corrupted header:
typically due to corrupted data
mSBC
Error
CRC Failure
mSBC Codec detected bad CRC:
typically due to corrupted data
mSBC
Error
No output
mSBC Codec generated no output due to
corrupted data when PLC not configured
AAC
Information Codec initialization
Codec session started
AAC
Information Codec tear-down
Codec session ended
AAC
Information Bitstream type set
The bitstream type has been set. For
Blueooth, it should be LATM.
AAC
Warning
Single frame error,
concealment triggered.
During decoding, a single frame error was
detected which triggered built in
concealment processing.
AAC
Error
Codec setting change
The codec has been re-initialized due to a
setting change.
AAC
Error
Unframed stream error
A frame error was detected for an
unframed stream. The codec is being
reset in order to continue processing.
AAC
Error
Transport not initialized
The codec cannot be initialized for the
given transport.
AAC
Error
Transport not supported
The selected transport is not supported.
This could occur when an out of band
LATM is selected opposed to in band.
AAC
Error
Transport failure
General failure in the transport.
AAC
Error
Transport error
This typically occurs when there isn’t any
configuration information available.
AptX
Information Codec initialization
Codec session started
AptX
Information Codec tear-down
Codec session ended
AptX
Error
Non-stereo data has been detected for
incoming data stream.
Bad Data
- 224 -
Stream Re-configuration
Chapter 4 Capturing and Analyzing Data
ComProbe BPA 600 User Manual
4.6.4.3 Event Type: Audio
Table 4.29 - Event Type: Audio
Test Mode
Severity
Event
Description
NonReferenced
Warning
Low Volume Alarm
Warn the user that the volume level of the detected
audio is below the best range for performing
meaningful audio analysis. Alarm is initialized when
volume level above the “Measurement Threshold1”
level is detected. Alarm is activated when the
detected volume drops below the “Measurement
Threshold” level for 10 consecutive 0.5 sec
measurement intervals.
NonReferenced
Warning
Clipping
Reports the detection of suspected distortion that
occurs when the amplitude of a signal exceeds a
digital systems ability to represent it accurately.
Clipping is a type of amplitude distortion. The system
reports a Clipping event when consecutive samples
at the maximum value that can be represented by the
digital system have been detected. Note that the
maximum value that can be represented is different
depending on the number of bits per sample (i.e. bits
of resolution) of the audio stream. The system limits
the number of reported Clipping events to typically 10
to 20 per sec.
NonReferenced
Warning
High Volume Alarm Warn the user that the volume level of the detected
audio is above the best range for performing
meaningful audio analysis (i.e. above a level where
the audio will likely become distorted). Alarm is
activated when the detected audio volume is
continuously above the high volume threshold2
(see Figure 2) for 10 consecutive 0.5 sec
measurement intervals (i.e. 5 sec total). The event
will not be repeated again until the detected volume
level drops below the high volume threshold for 10
more consecutive 0.5 sec measurement connections.
NonReferenced
Warning
Dropout
Reports the detection of an unusual brief silence
period where the brief silence is preceded and
followed by “normal” audio levels. A typical definition
of Dropout is the short dramatic loss of volume
typically caused by lost digital information. Root
causes include transmission system errors resulting
in lost data packets, transmission channel
reconfigurations, bad sections of memory, processor
overloads that temporarily interrupt the flow of
information, and so on.
1The volume threshold above which useful audio analysis is possible.
2High Volume Threshold for speech: - 6dBFS High Volume Threshold for music: -12 dBFS
- 225 -
ComProbe BPA 600 User Manual
Chapter 4 Capturing and Analyzing Data
Table 4.29 - Event Type: Audio(continued)
Test Mode
NonReferenced
Severity
Warning
Event
Description
Glitch
Extremely large sample-to-sample audio
amplitude transitions1 that have little probability of
occurring within natural speech or music. Such
dramatic changes would typically happen only in
situations of dropped samples.
Referenced
Info
TestID Found
Occurs when a valid Test ID2 has been recognized. A
valid Test ID must meet the level, frequency,
duration, and delimiter requirements. If any of these
parameters do not match, the process is terminated
and is reset to the initial conditions. Until a Test ID is
successfully recognized, the system will continue to
operate in Non Referenced Mode; therefore, no
events related to false starts are reported. This is
because for arbitrary audio there is no expectation of
any Test ID.
Referenced
Warning
Test Script Not
Found
Occurs if a valid Test ID was found , but the script for
that Test ID was not found. The system reverts to
Non-Referenced Mode if this happens. This event
should not occur if using a valid Reference Audio file
provided by Frontline.
Referenced
Error
Invalid Test Script
This event is generated when an error occurs while
accessing information in a script. This event should
not occur if using a valid reference audio file provided
by Frontline.
1Glitch sample-to-sample audio amplitude transitons: Speech: greater than 40 dB change Music: greater than 90 dB change
2A “Test ID” is three digits minimum in length, representing a dot notation “N.vv” Test Identifier. The Value ‘N’ may be any
length >= 1 indicating a specific test number, and “vv” represents a two digit version. Each digit is represented by a tone
between 200 and 290 Hz, and is followed either by a 1 kHz delimiter tone or a 400 Hz Test ID terminator. The digit ‘0’ is
represented by 200 Hz, the digit ‘1’ by 210 Hz, and so on, up to the digit ‘9’ represented by 290 Hz.
- 226 -
Chapter 4 Capturing and Analyzing Data
ComProbe BPA 600 User Manual
Table 4.29 - Event Type: Audio(continued)
Test Mode
Severity
Event
Description
Referenced
Error
Synchronization
Lost
Generated when after a successful TestID
recognition the system encounters unexpected
frequencies or durations of audio segments while
analyzing a received Reference Audio file. If this
situation occurs, the internal segment tracking logic
attempts to look forward and/or backward in the test
script to determine if the currently measured
characteristics are consistent with the previous or
next segment of the script. If there is a match, the
internal segment pointer is advanced or retarded
appropriately, the Synchronization Lost event is not
generated, and the audio analysis continues.
However, if a match cannot be found, the system
declares itself out of sync and generates the
Synchronization Lost Event, terminates any active
test script, and reverts to Non-Referenced Mode.
Referenced
Error
Unexpected
Frequency
Reported when a measured frequency deviates from
an expected frequency by a specific percentage
(determined by the negotiated parameters of the overthe-air audio stream). The system knows the
Reference Audio file that is being played on the
Source DUT; therefore, the system knows which
frequencies (tones) to expect at a given time.
Referenced
Error
Unexpected Level
Reported when the measured level at the start of a
tone segment is not within tolerance. The tolerance is
dependent on sample rate and bits per sample, but it
generally is +/- 3 dB for speech and +/11 dB for
music. The system knows the Reference Audio file
that is being played on the Source DUT; therefore, the
system knows which amplitude level to expect at a
given time.
- 227 -
ComProbe BPA 600 User Manual
Chapter 4 Capturing and Analyzing Data
Table 4.29 - Event Type: Audio(continued)
Test Mode
Severity
Event
Description
Referenced
Error
Unexpected
Duration
Reported when a tone segment of the Reference
Audio file is shorter or longer than expected1. The
system knows the Reference Audio file that is being
played on the Source DUT and therefore knows how
long a specific tone segment should last. If either a
change of amplitude or frequency arrives either before
or after that programmed duration, then the change is
by definition unexpected. This type of audio
impairment can be caused by lost or corrupted data,
repeated data, faulty packet loss concealment
algorithms, etc.
Referenced
Error
Amplitude
Fluctuations
Reported if the system detects unexpected amplitude
changes over a given interval. The test tones in
Frontline’s Reference Audio files have a fixed
amplitude level over their duration. Therefore, if the
corresponding audio levels received over the air by
the system fluctuates2 more than a specified level
(this level is based on the received audio stream
parameters), then the system generates an Amplitude
Fluctuations event.
Referenced
Error
Unexpected Phase Provides a fine-grained indication of lost or repeated
energy. The system knows when a specific tone
Change
should be expected. During this interval, the system
checks that the measured average frequency is the
same as the expected frequency. If this is correct, the
system will continue to monitor the instantaneous
frequency. If the instantaneous frequency deviates
sufficiently from the current average frequency, the
frequency measurement state machine will reset and
begin re-measuring. Typically, the outcome is the
discovery of the next scripted (expected) frequency.
However, another outcome can be that the same
frequency as the previous average frequency is
rediscovered, and this is reported as an Unexpected
Phase Change event. Such phase changes are an
indicator of losses of signal that do not result in
amplitude dropouts, or signal substitution (repetition)
of previous audio energy due to things such as
“packet loss concealment” tactics.
1The amount that a measured duration must deviate from the programmed duration of a tone segment before the system
declares this event varies, depending on the negotiated over-the-air audio stream specific parameters, but it is generally in
the range of 5% to 10%. Note that this event will result in an attempt to resynchronize if the measured duration is greater
than expected.
2The system calculates amplitude fluctuations as: (Max Level – Min Level) / (Max Level + Min Level) * 100
- 228 -
Chapter 4 Capturing and Analyzing Data
ComProbe BPA 600 User Manual
Table 4.29 - Event Type: Audio(continued)
Test Mode
Severity
Event
Description
Referenced
Error
Excess Noise
The Excess Noise event is reported when energy
sufficiently above the “Silence Threshold” is detected
during programmed segments of silence. Excess
noise can indicate a poor analog audio chain with an
inherently poor noise floor, glitches occurring during
silence intervals, or codecs that do not transition to
silence instantaneously.
Referenced
Error
Clipping
Reports the detection of suspected distortion that
occurs when the amplitude of a signal exceeds a
digital systems ability to represent it accurately.
Clipping is a type of amplitude distortion. The system
reports a Clipping event when consecutive samples
at the maximum value that can be represented by the
digital system have been detected. Note that the
maximum value that can be represented is different
depending on the number of bits per sample (i.e. bits
of resolution) of the audio stream. The system limits
the number of reported Clipping events to typically 10
to 20 per sec.
Referenced
Error
CVSD HF Level
Too High
Reported when a CVSD encoded audio stream is
detected and there is high frequency energy above 4
kHz that is greater than -20 dBFS.
Info
End of Test Event
Reported to indicate that the system has completed
processing a test script for a Reference Audio file,
and that the system has exited Reference Mode. This
event is generated when the elapsed time from the
start of test is equal to or greater than the scripted
duration of a test. It is reached when the number of
samples processed equals the number of samples
associated with the test duration.
Referenced
Clipping
The number of consecutive samples needed to qualify as a clipping event depends on both sample rate and
number of bits per sample. Table 1 specifies the number of consecutive samples at the maximum value level that
will generate a Clipping event.
Table 4.30 - Clipping Event Thresholds
Consecutive Samples Sample Rate, Samples/sec Resolution, bits
3
8000
16
5
16000
16
11
41000
16
2
64000
16
- 229 -
ComProbe BPA 600 User Manual
Chapter 4 Capturing and Analyzing Data
Table 4.30 - Clipping Event Thresholds (continued)
Consecutive Samples Sample Rate, Samples/sec Resolution, bits
12
48000
16
24
96000
16
Table 4.31 - Clipping Event Thresholds
Consecutive Samples Sample Rate, Samples/sec Resolution, bits
3
8000
16
5
16000
16
11
41000
16
2
64000
16
12
48000
16
24
96000
16
Dropout
Dropout events are reported when the average audio level (RMS) is initially above the Measurement Threshold,
then falls below the Silence Threshold, and then quickly rises above the Measurement Threshold again ). This
approach largely disqualifies the natural inter-syllable silence and pauses that occur in natural speech, but will
detect gaps caused by dropped data. Note that the system does not report dropouts that begin at very low energy
levels.
Figure 4.124 - Dropout: Measurement and Silence Threshold
Glitch
The Glitch event is reported whenever an extremely large sample to sample amplitude transition occurs that has
little or no probability of occurring within natural speech or music. As illustration, back to back +N, -N, …, +N, -N
values (where N is any non-zero number), represents energy at the Nyquist frequency, or ½ the sample rate.
Neither speech nor music contain average energy levels at this frequency more the 20 dB below nominal.
However, moderately large sample to sample changes in amplitude do occur, and these naturally limit how
sensitive this measure can be configured.
The system uses back to back transition levels of 90 dB for music and 40 dB for speech as the threshold for
reporting the Glitch event.
Such dramatic changes would typically happen only in the face of dropped samples, and serve as an additional
means of detecting gross abnormalities
- 230 -
Chapter 4 Capturing and Analyzing Data
ComProbe BPA 600 User Manual
4.6.5 Audio Expert System Window
This window is the working space for the Audio Expert System. Upon opening Audio Expert System the window
shown below will open with four main areas displayed :
l
l
l
l
Global Toolbar - Provides play cursor controls, waveform viewing controls, and volume controls that affect all
Wave Panels.
Wave Panel - Displays the waveforms for each captured audio stream. There is a separate Wave Panel for
each stream. Each panel contains local information, controls, and an event timeline specific to the displayed
audio stream being shown. Other Wave Panels that may be off scream may be viewed using the vertical scroll
control or by collapsing other Wave Panels.
Event Timeline - The Event Timeline shows Bluetooth events, Codec events, and Audio events synchronized to
the displayed waveform. There is an Event Timeline in each Wave Panel.
Event Table – A tabular listing of Bluetooth, codec, and audio events with information on event severity,
related Bluetooth frame, timestamp, and event information.
Figure 4.125 - Audio Expert System Window
Color Codes and Icons
The Audio Expert System uses standard color codes and icons to assist the user in focusing on specific issues.
- 231 -
ComProbe BPA 600 User Manual
Chapter 4 Capturing and Analyzing Data
Table 4.32 - Audio Expert System Color Codes and
Icons
Category
Sub-Category Color Code Icon
Bluetooth
Technology
blue
Codec
orange
Audio
green
Information
purple
Event Severity Warning
Error
yellow
red
Note: If an Event Severity icon is surrounded by a dark line, the event is a global event and not
applying to a particular captured waveform. The event is assigned to "Stream 0" in the Event
Table.
The following topics describe the Global Toolbar, Wave Panel, Event Timeline and Event Table in more detail.
4.6.5.1 Global Toolbar
The global toolbar provides audio play controls, audio play cursor positioning controls, waveform viewing controls,
and volume controls. Global toolbar controls apply simultaneously to all waveform panels.
Table 4.33 - Global Toolbar Controls
Icon
Description
Home: Moves play cursor to beginning of the waveform
Play : Start playing the audio from the current play cursor
position. Toggles to Pause when clicked.
/
Pause: Stops audio play back at its current position, toggles
to Play when clicked.
End: Moves the play cursor to the end of the waveform
- 232 -
Chapter 4 Capturing and Analyzing Data
ComProbe BPA 600 User Manual
Table 4.33 - Global Toolbar Controls (continued)
Icon
Description
Loop: Loops waveform playback continuously. If the Play
button is visible it will toggle to the Pause. Clicking the
Pause button will stop Loop playback. Clicking on the Loop
button will stop the loop and the playback.If there is a
selection on the waveform, only the selection will loop.
Horizontal Zoom Out: Increases the amount of data that is
visible on the screen; however, less detail is discernable.
Horizontal Zoom In: Decreases the amount of data that is
visible on the screen; however, more detail is discernable
Lock/Unlock (Operational in live mode only): Selecting Lock
will freeze the waveform display; however, the Audio Expert
System will still continue to analysis new audio data..
/
Selecting Unlock will jump to the waveform end and then
resume following the waveform.
Mute: Mute will mute / unmute audio playback for all Wave
Panels. Individual Wave Panel Mute control will override the
Global Toolbar Mute for that panel only.
Volume Down: Decreases the audio playback volume of all
Wave Panels based on the current volume level setting for
each individual Wave Panel.
Volume Down: Decreases the audio playback volume of all
Wave Panels based on the current volume level setting for
each individual Wave Panel.
Average Bit Rate Overlay: Displays an overlay graph of the
average bit rate for the audio stream in each Wave Panel.
The average is based on a 0.10 second moving window.
Actual Bit Rate Overlay: Displays an overlay graph of the
instantaneous bit rate for the audio stream in each Wave
Panel.
Export Data: Exports audio data in .raw and/or .wav format
for selected Wave Panels or all the Wave Panels. This
button also lets user export Event Table data in .csv format.
Refer to Waveform Export Audio Data for more details .
Help - Opens ComProbe software help.
- 233 -
ComProbe BPA 600 User Manual
Chapter 4 Capturing and Analyzing Data
Table 4.33 - Global Toolbar Controls (continued)
Icon
/
Description
Collapse/Expand: Toggles between collapsing and
expanding all Wave Panels. Note that the Wave Panel Local
Controls Collapse/Expand control will locally override the
Global Toolbar Collapse/Expand control.
4.6.5.2 Wave Panel
The Stream Panel is where the details of the captured audio stream are presented. The Stream Panel displays the
captured audio waveform along with an event timeline that displays discrete Bluetooth, Codec, and Audio events
synchronized to the captured waveform. .
Figure 4.126 - Wave Panel
The Wave Panel contains four sections.
1. Audio Stream Info that provides users with information, such as sample rate, bit/sample, codec and DUT
(Device Under Test) addresses.
2. Local Controls include audio volume controls and Indicators, “Mute”, “Vertical Zoom” and
“Collapse/Expand”
3. An Audio Waveform which is plotted as amplitude (linear or dB) versus time and an interactive play cursor.
The play cursor appears as a white vertical line across the waveform.
4. Event Timeline that shows color coded Bluetooth
, Codec
events are listed in the Audio Expert System Event Table.
- 234 -
, and Audio
events. Details of these
Chapter 4 Capturing and Analyzing Data
ComProbe BPA 600 User Manual
4.6.5.2.1 Audio Stream Info
The Audio Stream Info displays Audio, Bluetooth, and Codec information (left to right in the image below) about
the audio waveform displayed in the panel. This information is discovered during AVDTP signaling when the
devices under test (DUT) negotiate audio streaming parameters.
Figure 4.127 - Audio Stream Info in the Wave Panel
Table 4.34 - Audio Stream Info Tags
Category
Audio
Name
Steam
A system assigned index number that represents an audio
waveform between a pair of Bluetooth devices. This number
appears in the Event Table for easy cross-referencing.
Sample Rate
Displays the sampling frequency used to digitize the original
audio.
Mono/Stereo
Indicates if the audio data is monaural or stereophonic.
Bits/Sample
Displays the number of bits per sample of the audio data.
Bluetooth DUT1
Codec
Description
Bluetooth address of one device in the connection. Can be
either sending or receiving the audio data.
DUT2
Bluetooth address of the other device in the connection. Can
be either sending or receiving the audio data.
Codec
Displays the Codec type used by the captured audio stream.
The supported codecs include SBC, AAC, aptX, mSBC, and
CVSD.
SBC Codec Information Pop-up
When you hover over the Codec tag and the Codec = SBC a pop up will appear that shows additional information
about which SBC parameters can be used. The pop-up is visible as long as the cursor hovers over the Codec tag.
Figure 4.128 - SBC Codec Information Pop-Up on Cursor Hover Over
- 235 -
ComProbe BPA 600 User Manual
Chapter 4 Capturing and Analyzing Data
4.6.5.2.2 Local Controls
The Local Controls in each Wave Panel provide the user with indicators and controls for waveform display and
audio play back.
Figure 4.129 - Wave Panel Local Controls
Waveform Play Back Volume
The volume slider controls the playback volume for the audio in each Wave
Panel.
Audio Volume Indicator
The volume indicator shows the relative audio volume at the waveform display
play cursor. When the green bars completely fill the indicator the audio volume
is at its highest level. As the volume decreases, the bars will move to the right linearly, with no visible green bar
indicating no audio. The volume indicator will continue to operate if the audio stream has been muted.
Mute
Checking the Mute check box will silence the Wave Panel's audio output. The volume indicator will
respond to the audio volume but nothing will be heard. All panels can be simultaneously muted
using the Audio Expert System Global Toolbar. The Wave Panel mute is a local control only. However, the Global
Toolbar mute control will set the Stream Panel's Local Controls mute.
Vertical Zoom
Each Wave Panel contains local Vertical Zoom controls that expands or reduces the waveform
display vertically. The waveform amplitude is always visible, and the Vertical Zoom controls
increases or decreases the entire vertical size of the display. The vertical zoom buttons will turn
gray and become inactive when the maximum and minimum values are reached.
Collapse/Expand Control
Collapse/Expand button toggles between two views. The top image indicates that the Wave Panel is
expanded. When the bottom image is visible it indicates that the Wave Panel is collapsed.
When the top image is visible, clicking on it will collapse the Wave Panel to the minimum size that shows
only the Stream Info and the Local Controls. When the bottom image is visible, clicking on it expands the
Wave Panel to full size.
- 236 -
Chapter 4 Capturing and Analyzing Data
ComProbe BPA 600 User Manual
Figure 4.130 - Collapsed Wave Panel
4.6.5.2.3 Audio Waveform Panel
The Audio Waveform Panel displays the captured audio waveform. If the waveform is stereo, both channels are
visible in the Wave Panel. The user can view the entire waveform or can zoom to view a portion of the waveform
in more detail.
Figure 4.131 - Audio Waveform Panel in the Wave Panel
Table 4.35 - Global Toolbar Waveform Horizontal Zoom Controls
Description
Control
Horizontal Zoom: Increases the amount of data that is visible on the screen; however, less detail
is discernible.
Horizontal Zoom: Decreases the amount of data that is visible on the screen; however, more
detail is discernible.
Waveform
The audio waveform is plotted as amplitude versus time on the Wave Panel. The amplitude scale is
located on the left edge of the Wave Panel. The waveform’s amplitude can be linear or in
decibels. The linear range is -1.0 to +1.0. The range for the dB scale is 0 dB for the maximum
positive and maximum negative values, and silence is negative infinity. A toggle switch at the
bottom of the amplitude scale will switch between Linear scale and dB scale. Moving the switch
to the left will display the Linear scale and moving it to the right will display the dB scale.
- 237 -
ComProbe BPA 600 User Manual
Chapter 4 Capturing and Analyzing Data
Play Cursor
The Play Cursor is identified by a white vertical line on the Wave Panel. The Play Cursor appears when user clicks
on any point in the waveform, or, if the cursor is already present it can be dragged to another position. To drag the
Play Cursor, hover the mouse cursor over the Play Cursor until the mouse cursor changes to a pointing hand; click
and drag the cursor to a new position.
Waveform Segment Selection
Figure 4.132 - Selection in the Audio Waveform
A waveform segment selection is identified by a blue border surrounding the selection. Procedures for selecting a
segment depend on the desired actions.
Desired Action
Loop play back
Table 4.36 - Segment Selection Procedures
Procedure
1. Zoom in to the waveform segment of interest.
2. Click in the approximate center of the proposed selection.
This will place the Play Cursor in the area to be selected.
3. Move the mouse cursor to the right or left of the Play
Cursor, click and hold, then drag over the waveform segment
of interest. Release the mouse key. The selection is
surrounded by a blue border.
View waveform
details
1. Zoom in to the segment of interest.
2. Move the mouse cursor to the right or left limit of the
waveform segment of interest; click and hold, then drag over
the waveform segment of interest. Release the mouse key.
The selection is surrounded by a blue border.
For either of the procuedures described in the table above, once the selection is made details of the segment
appear below and to the left of the waveform. These details include selection start and stop range ("T0" and "T1"),
the time difference ("dT"), samples selected, frequency, and "Bluetooth Frames" selected.
Right-clicking in the Waveform panel will open a pop up menu (see Wave Panel & Event Table Pop-up Menu on
page 243. Selecting Zoom to Selection will expand the selection to the full width of the Wave Panel. Other
selection option in the pop up are Select Area, Clear Selection, and Copy Selection.
- 238 -
Chapter 4 Capturing and Analyzing Data
ComProbe BPA 600 User Manual
Bitrate Overlay Display
Figure 4.133 - Actual Bitrate Overlay
The Average and Actual audio stream bitrate graphs can be displayed over the audio waveform using the Global
Toolbar Average Bitrate Overlay
and Actual Bitrate Overlay
buttons respectively. These are presented as
overlays onto the main Wave Panel so the user can correlate audio issues with bitrate changes and the like. The
scale is in kbps (kilo bits per second). Hovering over the bitrate scale will display a pop-up showing the bitrate at
the play cursor position.
Actual Bitrate is based on the throughput at the Codec level.
The Average Bitrate is the moving average over 0.1 sliding-second window.
Figure 4.134 - Average Bitrate Overlay
All of the information for calculating the Acutal and Average Bitrate is in the codec data frame header.
4.6.5.2.4 Event Timeline
The Event Timeline in the Wave Panel shows the Bluetooth
, Codec
, and Audio
events related to
the waveform being viewed. The events are synchronized in time to the waveform displayed in the Wave Panel.
The event severity is displayed as Information
, Warning
, and Error
.
Figure 4.135 - Event Timeline Shown with Wave Panel
- 239 -
ComProbe BPA 600 User Manual
Chapter 4 Capturing and Analyzing Data
Clicking on an event in the Event Timeline shows a relevant selection in the Audio Waveform Panel. The size of
the selection depends on the number of frames associated with the selected event. This selection will appear in
all Wave Panels; however, the event severity icon will only appear in the Wave Panel associated with the event.
To assist the user with viewing events in detail, the Event Timeline will zoom in and out in sync with the Wave
Panel.
Event Timeline Example
This example shows that event 159 was selected in the Event Table resulting in the severity icon being enlarged in
the Event Timeline. The system automatically selected the surrounding area—the blue outline.
Figure 4.136 - Example: Event Table Selection Shown in Event Timeline
Event Pop Up
When the cursor hovers over a selected event severity icon in the Event Timeline, a pop-up will display the event
class, severity, and associated Bluetooth frame.
- 240 -
Chapter 4 Capturing and Analyzing Data
ComProbe BPA 600 User Manual
Figure 4.137 - Event Timeline Selected Event Pop Up
4.6.5.3 Event Table
The Event Table lists all audio stream events . Clicking on an event will select that event in the Event Timeline in
the Wave Panel. If the selected event is outside the visible area of the waveform, the waveform will move and
bring the selected event to the center of the display. The event icon in the Event Timeline is also centered and the
selected icon will be larger than the non-selected event icons. Selecting one or more events in the table will
highlight the associated frames in the standard ComProbe software windows, such as Frame Display,
Coexistence View, Bluetooth Timeline, etc. .
Figure 4.138 - Event Table
Several events can be selected by clicking and dragging over the events, or by holding down the Shift key and
clicking on events. To select events that are not adjacent hold down the Ctrl key and click on the events.
When selecting multiple events, the Wave Panels will not scroll to the selected events.
- 241 -
ComProbe BPA 600 User Manual
Chapter 4 Capturing and Analyzing Data
The Event Table contains eight columns.
Table 4.37 - Event Table Columns
Name
Event
Value
integer
Severity
Description
System generated sequential numbering of events.
Information - provides information of interest but does not indicate
a problem event.
Warning -identifies a potential problem where further investigation
may be appropriate
Error - identifies a definite problem.
Stream Id
integer
Event Type
A system generated ID that is assigned in the order that the audio
streams are detected. The ID is not maintained between captures
for the same device with the same audio. It identifies the Wave
Panel where the event can be viewed. The ID appears in the Audio
Stream Info of the Wave Panel.
Bluetooth -Events generated by analyzing Bluetooth protocol
activities.
Codec -Events generated from analyzing the audio
coding/decoding activities.
Audio -Events generated by analyzing the audio data.
Mode
Frame Number
N/A
Mode does not apply to this event.
REF
Referenced Mode. Refer to 4.6.3.2 Referenced Mode on page 214
.
UN-REF
Non-Referenced Mode. Refer to 4.6.3.1 Non-Referenced Mode on
page 213 .
integer
The system generated identification for a specific frame.
Description
Timestamp
Details and explanation about this event.
clock date
and time
A system generated time stamp for each frame.
Sorting
Event table entries are sortable by column. Left-click on the column heading to sort.
Event Table Pop-Up Menu
Right-clicking with the cursor over the Event Table will open a menu of additional options. For more on this option
see Wave Panel & Event Table Pop-up Menu on page 243.
- 242 -
Chapter 4 Capturing and Analyzing Data
ComProbe BPA 600 User Manual
Lock Event Table
The Lock Event Table checkbox is available in live mode
only. Clicking to check the box will prevent the Event Table
from scrolling during live capture. Un-checking the box will
resume scrolling of events as they are detected. When
analyzing a capture file the checkbox has no effect.
4.6.5.4 Wave Panel & Event Table Pop-up Menu
Additional Wave Panel and Event Table options are available by right clicking the mouse with the cursor anywhere
in the Wave Panel or in the Event Table.
Wave Panel Pop-up Menu Actions
Right-clicking anywhere in the Wave Panel will provide you with a
selection of the following actions.
Table 4.38 - Wave Panel Pop-up Menu Selections
Option
Description
Clear Selection
Clears the current selection in the viewer
Copy Selection
Saves a copy of the selection to the computer
clipboard. The clipboard can be pasted into a Word
document, an e-mail, or other Windows clipboardcompatible application.
Export Audio Data
Opens the Export pop-up menu with options to export
the waveform as a .raw, .wav, or Event Data. For
additional details on exporting refer to Waveform
Display Export.
Loop
Loops through the audio selected on the Wave Panel.
Zoom to Selection
Expands or compresses the selection to fill the Wave
Panel view.
- 243 -
ComProbe BPA 600 User Manual
Chapter 4 Capturing and Analyzing Data
Table 4.38 - Wave Panel Pop-up Menu Selections (continued)
Option
Description
Select Area
When the mouse cursor is positioned over data (not
fill, pause, or gaps) in the Wave Panel and selecting
this option will select all the data between and fills,
pauses, or gaps.
Select All
Selects the entire waveform
Event Table Pop-up Menu Actions
Right-clicking in the Event Table will provide you with a
selection of the following actions.
Table 4.39 - Event Table Pop-up Menu Selectioin
Options
Description
Copy
Copies the selected events to Windows clipboard as
text.
Clear Selection
Clears the current event selection in the table
Export Event Table
Copies the current event selection and saves it as a
.csv file. For additional details on exporting refer to
Event Table Export.
Loop
Loops through the audio selected on the Wave Panel.
Zoom to Selection
Expands the Event Table selection to fill the Wave
Panel view.
Select Area
Expands the selection.
Select All
Selects all events.
4.6.5.5 Export Audio Data
There are two ways to export audio data:
1. Clicking the Audio Expert System window Global Toolbar Export button
.
2. Right-click in a Stream Panel Wave Panel and a pop-up menu will appear. Select Export .
- 244 -
Chapter 4 Capturing and Analyzing Data
ComProbe BPA 600 User Manual
Two windows will appear:
1. The standard Windows Save As.
2. The Export Audio Data dialog.
In the Windows Save As window enter a File name and directory location. Click on Save.
Figure 4.139 - Export Audio Data dialog
The Save As window will close, and the file name will appear in the File Name field in the Export Audio Data
window. Should the file name need to be changed, click on the Select button and the Windows Save As dialog
will open. By default the .wav file extension is used in the file name.
In the window below File Name will appear a list of Stream Ids with a description from the Audio Stream Info .
If opening from the Audio Expert System Global Toolbar all Stream IDs are checked by default. If opening
from a Wave Panel, the Stream ID where the export dialog was opened is automatically checked. You can check
each stream that is to be exported. For convenience checking Select all below the stream list window will place
checks in all streams.
Export Options
After selecting the streams to export, select the desired formats to export.
Option
Table 4.40 - Export Audio Data Format Options
Description
Encoded Audio Data
Exports the selected files as .raw format. The audio data is in an
encrypted format and user will need a codec to decode it.
Decoded Audio Data
Exports the selected files as .wav format that can be played on a
wide variety of media players.
Event Table Data
Exports a text .csv file of all the detected events
- 245 -
ComProbe BPA 600 User Manual
Option
Chapter 4 Capturing and Analyzing Data
Table 4.40 - Export Audio Data Format Options (continued)
Description
Only Selected Wave Area
Exports the Encoded, Decoded, or Event Data for the selected
waveform. This option is only active if a selection has been made in
one of the Wave Panels
Click on OK to save the waveform. The dialog
will close and a series of progress bars will
appear. Each progress bar is associated with a
file for each export option. The exported files
will have the following syntax: <filename>_
n.<filetype>, where <filename> = the name
entered into the File Name field, n = the
stream id number (1, 2, 3, ...), and <filetype> =
"raw", "wav", and "csv'. The image shows an
example where the user exported Stream
Id's 1 and 2 in Encoded Audio , Decoded Audio , and Event Table data to filename "audiowebinar".
Click on Cancel to close the window without exporting.
4.6.5.6 Export Event Table
Right-clicking in the Event table will open a pop-up menu with the option to Export Event Table. This option will
export selected events in the in comma separated variable (.csv) format for used in Microsoft Excel or any other
Windows .csv compatible application.
First select the events to export. Multiple events are selectable by selecting an event then holding the Shift key
while clicking on another event. This will select all events between the two selections. If the selections are not
adjacent you can hold the Ctrl (control) key while clicking events.
Next right-click anywhere int he Event Table to open the pop-up menu and click on the Export Event Table
option. A Windows Save As dialog will open. Enter a file name and select a file location and click on Save. A
confirmation dialog will open. Click OK to close the confirmation dialog.
If you have not selected an event in the table before exporting, a warning to "Please select an event row first."
appears.
4.6.6 Frame, Packet, and Protocol Analysis Synchronization
The Audio Expert System module integrates seamlessly with ComProbe software with common timestamping of
Bluetooth protocol data, audio events, audio waveform display, and codec events. The audio expert data and
results are synchronized and coordinated with the existing ComProbe software data views, such as Frame
Display, Bluetooth Timeline, etc. to expedite the root-cause analysis of Bluetooth protocol related audio
issues. When a frame is selected in any ComProbe software data views, the corresponding audio data associated
with those frames is also selected in the Wave Panel, Event Timeline and Event Table and vice-verse.
Protocol analysis tools synchronized to the Audio Expert System include:
l
Frame Display
l
Coexistence View
- 246 -
Chapter 4 Capturing and Analyzing Data
l
Bluetooth Timeline
l
Message Sequence Chart
l
Packet Error Rate Statistics
ComProbe BPA 600 User Manual
When a portion of the waveform is selected in the Wave Panel, all frames within the selection will be highlighted
in the Frame Display, Coexistence View, and Bluetooth Timeline.
Note: If the Frame Display is filtered to show non-audio events then the frames associated with
selected audio events may not show.
4.7 Data/Audio Extraction
You use Data/Audio Extraction to pull out data from various decoded Bluetooth® protocols. Once you have
extracted the data, you can save them into different file types, such as text files, graphic files, email files, .mp3
files, and more. Then you can examine the specific files information individually.
1. You access this dialog by selecting Extract Data/Audio from the View menu or by clicking on the icon from
the toolbar
.
Figure 4.41 Data/Audio Extraction Settings dialog
2. Choose a checkbox(es) on the left side of the dialog to identify from which profile(s) you want to extract
data.
It's important to note that if there is no data for the profile(s) you select, no extracted file is created.
3. If you want the file(s) to open automatically after they are extracted, select the Open File(s) After
Extraction checkbox.
Note: This does not work for SCO/eSCO. 4. Click on a radio button to write the streams as Two Mono Files or as One Stereo File.
- 247 -
ComProbe BPA 600 User Manual
Chapter 4 Capturing and Analyzing Data
Note: This option is for SCO/eSCO only.
5. Select the checkbox if you want to convert A-Law and µ-law to Linear PCM.
CVSD are always converted to Linear PCM. It's probably a good idea to convert to Linear PCM since more
media players accept this format.
Note: This option is for SCO/eSCO only.
6. Select the Add Silence packets to insert the silence packets (dummy packets) for the reserved empty
slots into the extracted file. If this option is not selected, the audio packets are extracted without inserting
the silence packets for the reserved empty slots.
Note: This option is for SCO/eSCO only.
7. Select Extract.
A Save As dialog appears.
The application will assign a file name and file type
for each profile you select in Step 1 above. The file
type varies depending on the original profile. A
separate file for each profile will be created, but
only for those profiles with available data.
8. Select a location for the file.
9. Click Save.
The Data Extraction Status and Audio
Extraction Status dialogs appear. When the
process is complete the dialogs display what files
have been created and where they are located.
- 248 -
Chapter 4 Capturing and Analyzing Data
ComProbe BPA 600 User Manual
Figure 4.42 Data and Audio Extraction Status
If you selected Open Files(s) After Extraction, the files open automatically.
10. If you did not select this option, you can open a file by simply double-clicking on the name.
Also, if a file type is unknown, you can select the file and it appears in the Rename to: text box.
Figure 4.43 Rename To in the bottom section of Data Extraction Status
Then you can rename the file, adding a file type to attempt to open the file.
When you are finished, select Close to close the dialogs.
- 249 -
ComProbe BPA 600 User Manual
Chapter 4 Capturing and Analyzing Data
- 250 -
Chapter 5 Navigating and Searching the Data
The following sections describe how to navigate through the data and how to find specific data or packet
conditions of interest to the user.
5.1 Find
Capturing and decoding data within the ComProbe analyzer produces a wealth of information for analysis. This
mass of information by itself, however, is just that, a mass of information. There has to be ways to manage the
information. ComProbe software provides a number of different methods for making the data more accessible.
One of these methods is Find.
Figure 5.1 - Find Dialog
- 251 -
ComProbe BPA 600 User Manual
Chapter 5 Navigating and Searching the Data
Find, as the name suggests, is a comprehensive search function that allows users to search for strings or patterns
in the data or in the frame decode. You can search for errors, control signal changes, bookmarks, special events,
time, and more. Once the information is located, you can easily move to every instance of the Find results.
5.1.1 Searching within Decodes
Searching within decodes lets you to do a string search on the data in the Decode Pane of the Frame Display
window.
To access the search within decodes function:
1. Open a capture file to search.
2. Open the Event Display
3. Click on the Find icon
or Frame Display
window.
or choose Find from the Edit menu.
4. Click on the Decode tab of the Find dialog.
Note: The tabs displayed on the Find dialog depend on the product you are running and the content
of the capture file you are viewing.
Figure 5.2 - Find Decode Tab Search for String
- 252 -
Chapter 5 Navigating and Searching the Data
ComProbe BPA 600 User Manual
Figure 5.3 - Find Decode Tab Side Restriction
There are several options for error searching on the Decoder tab.
l
l
Search For String in Decoder allows you to enter a string in the text box. You can use characters, hex or
binary digits, wildcards or a combination of any of the formats when entering your string. Every time you type
in a search string, the analyzer saves the search. The next time you open Find, the drop-down list will contain
your search parameters.
Search for All Errors finds frame errors as well as frames with byte-level errors (such as parity or CRC
errors).
l
Search for Frame Errors Only finds frame specific errors, such as frame check errors.
l
Search for Information Frame only searches information frames.
1. Enter the search string.
2. Check Ignore Case to do a case-insensitive search.
3. When you have specified the time interval you want to use, click on the Find Next or Find Previous
buttons to start the search from the current event.
The result of the search is displayed in the Decode pane in Frame Display.
- 253 -
ComProbe BPA 600 User Manual
Chapter 5 Navigating and Searching the Data
Side Restrictions - Side Restriction means that the analyzer
looks for a pattern coming wholly from the DTE or DCE side. If you
choose to search without regard for data origin, the analyzer looks
for a pattern coming from one or both sides. For example, if you
choose to search for the pattern ABC and you choose to search
without regard for data origin, the analyzer finds all three instances
of ABC shown here.
The first pattern, with the A and the C coming from the DTE device
and the B coming from the DCE is a good example of how using a
side restriction differs from searching without regard to data origin.
While searching without regard for data origin finds all three
patterns, searching using a side restriction never finds the first
pattern, because it does not come wholly from one side or the
other.
If you choose to search for the pattern ABC, and you restrict the
search to just the DTE side, the analyzer finds the following pattern:
In this example, the analyzer finds only the second pattern
(highlighted above) because we restricted the search to just the
DTE side. The first pattern doesn't qualify because it is split between
the DTE and DCE sides, and the third pattern, though whole, comes
from just the DCE side.
If we choose both the DTE and the DCE sides in the above example,
then the analyzer finds the second pattern followed by the third
pattern, but not the first pattern. This is because each side has one
instance in which the whole pattern can be found. The analyzer
completely searches the DTE side first, followed by the DCE side.
Note: Side Restriction is available for pattern and error searching.
1. Select one of the two options.
2. Select DTE, DCE, or both.
3. When you made your selections, click on the Find Next or Find Previous buttons to start the search
from the current event.
The result of the search is displayed in the Decode pane in Frame Display.
5.1.2 Searching by Pattern
Search by Pattern lets you perform a traditional string search. You can combine any of the formats when
entering your string, and your search can include wildcards.
To access the search by pattern function:
1. Open a capture file to search.
2. Open the Event Display
or Frame Display
- 254 -
window.
Chapter 5 Navigating and Searching the Data
3. Click on the Find icon
ComProbe BPA 600 User Manual
or choose Find from the Edit menu.
4. Click on the Pattern tab of the Find dialog.
Note: The tabs displayed on the Find dialog depend on the product you are running and the content
of the capture file you are viewing.
Figure 5.4 - Find Pattern Tab
Figure 5.5 - Find Pattern Tab Side Restrictions
Pattern allows you to enter a string in the text box. You can use characters, hex or binary digits, control
characters, wildcards or a combination of any of the formats when entering your string. Every time you type in a
search string, the ComProbe analyzer saves the search. The next time you open Find, the drop-down list will
contain your search parameters.
1. Enter the search pattern.
2. Check Ignore Case to do a case-insensitive search.
- 255 -
ComProbe BPA 600 User Manual
Chapter 5 Navigating and Searching the Data
3. When you have specified the pattern you want to use, click on the Find Next or Find Previous buttons
to start the search from the current event.
The result of the search is displayed in the in Frame Display and Event Display.
Refer to Searching by Decode on page 252 for information on Side Restrictions
5.1.3 Searching by Time
Searching with Time allows you search on timestamps on the data in Frame Display and Event Display
window.
To access the search by time function:
1. Open a capture file to search.
2. Open the Event Display
3. Click on the Find icon
or Frame Display
window.
or choose Find from the Edit menu.
4. Click on the Time tab of the Find dialog.
Note: The tabs displayed on the Find dialog depend on the product you are running and the content
of the capture file you are viewing.
Figure 5.6 - Find by Time tab
The analyzer can search by time in several different ways.
Search for Absolute/Relative timestamp.
- 256 -
Chapter 5 Navigating and Searching the Data
l
l
ComProbe BPA 600 User Manual
Absolute - An absolute timestamp search means that the analyzer searches for an event at the exact date and
time specified. If no event is found at that time, the analyzer goes to the nearest event either before or after
the selected time, based on the "Go to the timestamp" selection.
Relative - A relative search means that the analyzer begins searching from whatever event you are currently
on, and search for the next event a specific amount of time away.
1. Select Absolute or Relative
2. Select the date and time using the drop-down lists for Month, Year, Day, Hour, Minute, Second,
1/10000000.
Note: Month and Year are not available if you select Relative.
3. When you have specified the time interval you want to use, click on the Go To, Move Forward or Move
Backward buttons to start the search from the current event.
Note: When you select Absolute as Search for, Go To is available. When you select
Relative as Search for, Move Forward or Move Backwardis available.
Go to the timestamp: On or before/ On or after
The analyzer searches for an event that matches the time specified. If no event is found at the time specified, the
analyzer goes to the nearest event either before or after the specified time. Choose whether to have the analyzer
go to the nearest event before the specified time or after the specified time by clicking the appropriate radio
button in the Go to the timestamp box.
If you are searching forward in the buffer, you usually want to choose the On or After option. If you choose the
On or Before option, it may be that the analyzer finishes the search and not move from the current byte, if that
byte happens to be the closest match.
When you select Absolute as Search for, the radio buttons are On or before the specified time or On or
after the specified time. When you select Relative as Search for, the radio buttons are On or before the
specified time relative to the first selected item or On or after the specified time relative to the last
selected item.
1. Select On or before the specified time or On or after the specified time.
2. When you have specified the time interval you want to use, click on the Go To, Move Forward or Move
Backward buttons to start the search from the current event.
When you select Absolute as Search for, Go To is available. When you select Relative as Search for,
Move Forward or Move Backwardis available.
There are a couple of other concepts to understand in respect to searching with timestamps.
l
The analyzer skips some special events that do not have timestamps, such as frame markers. Data events that
do not have timestamps because timestamping was turned off either before or during capture are also
skipped.
- 257 -
ComProbe BPA 600 User Manual
l
l
Chapter 5 Navigating and Searching the Data
Timestamping can be turned on and off while data is being captured. As a result, the capture buffer may have
some data with a timestamp, and some data without. When doing a search by timestamp, the analyzer ignores
all data without a timestamp.
The raw timestamp value is the number of 100-nanosecond intervals since the beginning of January 1, 1601.
This is standard Windows time.
5.1.4 Using Go To
Searching with Go To allows you to go to a particular frame or event, or to move through the data X number of
events or frames at a time. You can move either forward or backwards through the data.
To access the Go To function:
1. Open a capture file to search.
2. Open the Event Display
3. Click on the Find icon
or Frame Display
window.
or choose Find from the Edit menu.
4. Click on the Go To tab of the Find dialog. 5. The system displays the Find dialog with the Go To tab selected.
Note: The tabs displayed on the Find dialog depend on the product you are running and the
content of the capture file you are viewing.
Figure 5.7 - Find Go To tab
To go to a particular frame :
1. Select the Frame Number radio button
2. Type the frame number in the box.
3. Click the Go To button.
- 258 -
Chapter 5 Navigating and Searching the Data
ComProbe BPA 600 User Manual
4. To move forward or backward a set number of frames, type in the number of frames you want to move
5. Then click the Move Forward or Move Back button.
To go to a particular event :
1. Select the Data Event Number or All Events Number radio button.
2. Type the number of the event in the box.
3. Click the Go To button.
4. To move forward or backwards through the data, type in the number of events that you want to move
each time.
5. Then click on the Move Forward or Move Backward button.
6. For example, to move forward 10 events, type the number 10 in the box, and then click on Move
Forward. Each time you click on Move Forward, Frontline moves forward 10 events.
See Event Numbering for why the Data Event Number and All Events Number may be different. As a
general rule, if you have the Show All Events icon
depressed on the Event Display window or Frame
Display Event pane, choose All Events Number. If the Show All Events button is up, choose Data Event
Number.
5.1.5 Searching for Special Events
Frontline inserts or marks events other than data bytes in the data stream. For example, the analyzer inserts startof-frame and end-of-frame markers into framed data, marking where each frame begins and ends. If a hardware
error occurs, the analyzer shows this using a special event marker. You can use Find to locate single or multiple
special events.
To access the search for special events function:
1. Open a capture file to search.
2. Open the Event Display
3. Click on the Find icon
or Frame Display
window.
or choose Find from the Edit menu.
4. Click on the Special Events tab of the Find dialog.
Note: The tabs displayed on the Find dialog depend on the product you are running and the
content of the capture file you are viewing.
- 259 -
ComProbe BPA 600 User Manual
Chapter 5 Navigating and Searching the Data
Figure 5.8 - Find Special Events tab
5. Check the event or events you want to look for in the list of special events. Use Check All or Uncheck
All buttons to make your selections more efficient.
6. Click Find Next and Find Previous to move to the next instance of the event.
Not all special events are relevant to all types of data. For example, control signal changes are relevant only to
serial data and not to Ethernet data.
For a list of all special events and their meanings, see List of all Event Symbols on page 85.
5.1.6 Searching by Signal
Searching with Signal allows you to search for changes in control signal states for one or more control signals. You
can also search for a specific state involving one or more control signals, with the option to ignore those control
signals whose states you don’t care about.
The analyzer takes the current selected byte as its initial condition when running searches that rely on finding
events where control signals changed.
To access the search by time function:
1. Open a capture file to search.
2. Open the Event Display
3. Click on the Find icon
or Frame Display
window.
or choose Find from the Edit menu.
4. Click on the Signal tab of the Find dialog. - 260 -
Chapter 5 Navigating and Searching the Data
ComProbe BPA 600 User Manual
Note: The tabs displayed on the Find dialog depend on the product you are running and the content
of the capture file you are viewing.
Figure 5.9 - Find Signal tab.
You will choose one qualifier—Searching for event where, then choose one or more control signals
Control Signals
The section with the check boxes allows you to specify which control signals the analyzer should pay attention to
when doing the search. The analyzer pays attention to any control signal with a check mark.
l
Click on a box to place a check mark next to a control signal
l
Click again to uncheck the box
l
By default, the analyzer searches all control signals, which means all boxes start out checked.
For example, if you are only interested in finding changes in RTS and CTS, you would check those two boxes
and uncheck all the other boxes. This tells the analyzer to look only at the RTS and CTS lines when running the
search. The other signals are ignored.
The control signals types include:
l
USB - Pin 1
l
USB - Pin 2
l
USB - Pin 3
l
USB - Pin 4
Click here to learn more about the Breakout Box and Pins 1 - 4.
- 261 -
ComProbe BPA 600 User Manual
Chapter 5 Navigating and Searching the Data
Searching for event where:
l
l
The first three options are all fairly similar, and are described together. These options are searching for an
event where:
One or more control signals changed
o
One or more control signals changed from off to on
o
One or more control signals changed from on to off
Searching for an event where one or more signals changed means that the analyzer looks at every control
signal that you checked, and see if any one of those signals changed state at any time.
o
l
o
If you want to look at just one control signal:
n
Check the box for the signal.
n
Uncheck all the other boxes.
n
Choose to search for an event where one or more signals changed.
n
The analyzer notes the state of the selected signal at the point in the buffer where the cursor is,
search the buffer, and stop when it finds an event where RTS changed state.
n
If the end of the buffer is reached before an event is found, the analyzer tells you that no matches
were found.
Searching for events where control signals changed state from off to on, or vice versa, is most useful if the
signals are usually in one state, and you want to search for occasions where they changed state.
For example:
l
o
If DTR is supposed to be on all the time but you suspect that DTR is being dropped
o
Tell the analyzer to look only at DTR by checking the DTR box and unchecking the others
o
Do a search for where one or more control signals changed from on to off.
o
The analyzer would search the DTR signal and stop at the first event where DTR dropped from on to off.
Searching for an Exact State
To search for an exact state means that the analyzer finds events that match exactly the state of the control
signals that you specify.
o
First, choose to search for an event where your choices exactly describe the state.
o
This changes the normal check boxes to a series of radio buttons labeled On, Off and Don’t Care for
each control signal.
o
Choose which state you want each control signal to be in.
o
Choose Don’t Care to have the analyzer ignore the state of a control signal.
o
When you click Find Next, the analyzer searches for an event that exactly matches the conditions
selected, beginning from the currently selected event.
- 262 -
Chapter 5 Navigating and Searching the Data
ComProbe BPA 600 User Manual
o
If the end of the buffer is reached before a match is found, the analyzer asks you if you want to
continue searching from the beginning.
o
If you want to be sure to search the entire buffer, place your cursor on the first event in the buffer.
o
Select one of the four radio buttons to choose the condition that must be met in the search
o
Select one or more of the checkboxes for Pin 1, 2, 3, or 4.
o
Click Find Next to locate the next occurrence of the search criteria or Find Previous to locate an
earlier occurrence of the search criteria.
5.1.7 Searching for Data Errors
The analyzer can search for several types of data errors. Searching for data error sallows you to choose which
errors you want to search for and whether to search the DTE or DCE data or both. Bytes with errors are shown in
red in the Event Display window, making it easy to find errors visually when looking through the data.
To access the search by time function:
1. Open a capture file to search.
2. Open the Event Display
3. Click on the Find icon
or Frame Display
window.
or choose Find from the Edit menu.
4. Click on the Errors tab of the Find dialog.
Note: The tabs displayed on the Find dialog depend on the product you are running and the content
of the capture file you are viewing.
Figure 5.10 - Find Error tab.
Searching for event where
- 263 -
ComProbe BPA 600 User Manual
Chapter 5 Navigating and Searching the Data
The first three options are all fairly similar, and are described together. These options are searching for an event
where:
l
one or more error conditions changed
l
one or more error conditions occurred
l
one or more error conditions were off (i.e. no errors occurred)
Selecting Which Errors to Search
The section with the check boxes allows you to choose which errors the analyzer should look for. Click on a box
to check or un-check it.
If you want to search only for overrun errors
l
check the box if shown
l
un-check the other boxes.
To search for all types of errors
l
check all boxes
The most common search is looking for a few scattered errors in otherwise clean data.
To do this type of search:
l
choose to Search for an event where one or more error conditions occurred
l
choose which errors to look for
l
By default, the analyzer looks for all types of errors.
In contrast, searching for an event where one or more error conditions were off means that the analyzer looks for
an event where the errors were not present.
For example, if you have data that is full of framing errors, and you know that somewhere in your 20 megabyte
capture file the framing got straightened out, you could choose to search for an event where one or more error
conditions were off, and choose to search only for framing. The analyzer searches the file, and finds the point at
which framing errors stopped occurring.
Searching for an event where the error conditions changed means that the analyzer searches the data and stop at
every point where the error condition changed from on to off, or off to on.
For example, if you have data where sometimes the framing is wrong and sometimes right, you would choose to
search framing errors where the error condition changed. This first takes you to the point where the framing
errors stopped occurring. When you click Find Next, the analyzer stops at the point when the errors began
occurring again. Clicking Find Previous will search backwards from the current postion.
The analyzer takes the current selected byte as its initial condition when running searches that rely on finding
events where error conditions changed. The analyzer searches until it finds an event where error conditions
changed or it reaches the end of the buffer, at which point the analyzer tells you that there are no more events
found in the buffer. If you are searching for an exact match, the analyzer asks you if you want to continue
searching from the beginning of the buffer.
Searching for Exact Error Conditions
- 264 -
Chapter 5 Navigating and Searching the Data
ComProbe BPA 600 User Manual
To search for an exact state means that the
analyzer finds events that exactly match the
error conditions that you specify.
l
l
l
Select the This exactly describes the
state radio button.
This changes the normal check boxes to a
series of radio buttons labeled On, Off
and Don’t Care for each error.
o
On means that the error occurred
o
Off means that the error did not
occur
o
Don’t Care means that the analyzer
ignores that error condition.
Select the appropriate state for each type of error.
Example:
If you need to find an event where just an overrun error occurred, but not any other type of error, you would
choose overrun error to be On, and set all other errors to Off. This causes the analyzer to look for an event where
only an overrun error occurred.
If you want to look for events where overrun errors occurred, and other errors may have also occurred but it
really doesn’t matter if they did or not, choose overrun to be On, and set the others to Don’t Care. The analyzer
ignores any other type of error, and find events where overrun errors occurred.
To find the next error, click the Find Next button. To find an error that occurred earlier in the buffer to where you
are, click the Find Previous button.
5.1.8 Find - Bookmarks
Searching with Bookmarks allows you search on specific bookmarks on the data in Frame Display and Event
Display window. Bookmarks are notes/reminders of interest that you attach to the data so they can be accessed
later.
To access the search for bookmarks
1. Open a capture file to search.
2. Open the Event Display
3. Click on the Find icon
or Frame Display
window.
or choose Find from the Edit menu.
4. Click on the Bookmarks tab of the Find dialog.
Note: The tabs displayed on the Find dialog depend on the product you are running and the content of the
capture file you are viewing.
- 265 -
ComProbe BPA 600 User Manual
Chapter 5 Navigating and Searching the Data
Figure 5.11 - Find Bookmark tab.
There are several ways to locate bookmarks.
l
Select the bookmark you want to move to and click the Go To button.
l
Simply double-click on the bookmark.
l
Click the Move Forward and Move Back buttons to move through the frames to the bookmarks shown in
the window. When the bookmark is found it is highlighted in the window.
There are three ways to modify bookmarks:
1. Click on Delete to remove the selected bookmark.
2. Click on Modify... to change the selected Bookmark name.
3. Remove All will delete all bookmarks in the window.
The Find window Bookmark tab will also appear when using functions other than Find such as when clicking on
the Display All Bookmarks
icon.
5.1.9 Changing Where the Search Lands
When doing a search in the analyzer, the byte or bytes matching the search criteria are highlighted in the Event
Display. The first selected byte appears on the third line of the display.
To change the line on which the first selected byte appears:
1.
Open fts.ini (located in the C:\User\Public\Public Documents\Frontline Test
Equipment\)
2. Go to the [CVEventDisplay] section
3. Change the value for SelectionOffset.
4. If you want the selection to land on the top line of the display, change the SelectionOffset to 0 (zero).
- 266 -
Chapter 5 Navigating and Searching the Data
ComProbe BPA 600 User Manual
5.1.10 Subtleties of Timestamp Searching
Timestamping can be turned on and off while data is being captured. As a result, the capture buffer may have
some data with a timestamp, and some data without. When doing a search by timestamp, the analyzer ignores all
data without a timestamp.
Note: The raw timestamp value is the number of 100-nanosecond intervals since the beginning of
January 1, 1601. This is standard Windows time.
5.2 Bookmarks
Bookmarks are electronic sticky notes that you attach to frames of interest so they can be easily found later. In
Frame Display bookmarked frames appear with a magenta triangle icon next to them.
Figure 5.12 - Bookmarked Frame (3) in the Frame Display
In the Event Display bookmarks appear as a dashed line around the start of frame
marker.
Bookmarks are easy to create and maintain, and are a very valuable tool for data analysis.
When you create or modify a bookmark, you have up to 84 characters to explain a
problem, leave yourself a reminder, leave someone else a reminder, etc. Once you create a bookmark it will be
saved with the rest of the data in the .cfa file. When you open a .cfa file, the bookmarks are available to you.
Once you have created a bookmark, you can use the Find function or other navigation methods to locate and
move among them.
5.2.1 Adding, Modifying or Deleting a Bookmark
You can add, modify, or delete a bookmarks from Frame Display and Event Display
Add:
1. Select the frame or event you want to bookmark.
2. There are three ways to access the Add Bookmark dialog.
a. Select Add or Modify Bookmark from the Bookmarks menu on the Frame Display and
Event Display,
b. Select the Add or Modify Bookmark
icon on one of the toolbars, or
c. Right-click on the frame/event and choosing Add Bookmark….
3. In the dialog box, add a comment (up to 84 characters) in the text box to identify the bookmark.
4. Click OK.
Once you create a bookmark it will be saved with the rest of the data in the .cfa file. When you open a .cfa file, the
bookmarks are available to you. - 267 -
ComProbe BPA 600 User Manual
Chapter 5 Navigating and Searching the Data
Modify
1. Select the frame or event with the bookmark to be edited.
2. There are three ways to access the Add/Modfy Bookmark dialog.
a. Select Add or Modify Bookmark from the Bookmarks menu on the Frame Display and
Event Display'
b. Select the Add or Modify Bookmark
icon on one of the toolbars, or
c. Right-click on the frame/event and choosing Modify Bookmark… on the selection.
3. Change the comment in the dialog box
4. Click OK. The edited bookmark will be saved as a part of the .cfa file.
5. You can also select Display All Bookmarks
from the Frame Display and Event Display toolbar
or the Bookmarks menu. the Find window will open on the Bookmark tab. Select the bookmark you
want to modify and click the Modify… button. Change the comment in the dialog box, and click OK.
Delete
1. Select the frame or event with the bookmark to be deleted.
2. There are three ways to access the Add/Modfy Bookmark dialog.
a. Select Add or Modify Bookmark from the Bookmarks menu on the Frame Display and
Event Display,
b. Select the Add or Modify Bookmark
icon on one of the toolbars, or
c. Right-click on the frame/event and choosing Modify Bookmark… on the selection.
3. Click on the Delete button. The bookmark will be deleted.
4. You can also select Display All Bookmarks
from the Frame Display and Event Display toolbar
or the Bookmarks menu. the Find window will open on the Bookmark tab. Select the bookmark you
want to delete and click the Delete button.
5.2.2 Displaying All and Moving Between Bookmarks
There are three ways to move between bookmarks.
1. Press the F2 key to move to the next frame or event with a bookmark.
2. Select Go to Next Bookmark from the Bookmarks menu.
3. Click the Display All Bookmarks icon
. Select the bookmark you want to move to and click the Go To
button, or simply double-click on the bookmark. Click the Move Forward and Move Back buttons to cycle
through the bookmarks.
- 268 -
Chapter 5 Navigating and Searching the Data
ComProbe BPA 600 User Manual
Figure 5.13 - Find Window Bookmark tab Used to Move Around With Bookmarks
To delete a bookmark, select it and click the Delete button.
To modify a bookmark, select it and click the Modify button.
Click Remove All to delete all the bookmarks.
- 269 -
ComProbe BPA 600 User Manual
Chapter 5 Navigating and Searching the Data
- 270 -
Chapter 6 Saving and Importing Data
6.1 Saving Your Data
You can save all or part of the data that you have captured. You can also load a previously saved capture file, and
save a portion of that file to another file. This feature is useful if someone else needs to see only a portion of the
data in your capture file.
On the Control window toolbar you can set up to capture a single file. Click here to see those settings.
There are two ways to save portions or all of the data collected during a data capture. Click here to see how to
capture data to disk.
6.1.1 Saving the Entire Capture File
This option is only available when you select Single File from the Capture Mode on System Settings. Click
here to learn more about selecting Save options from System Settings.
1. If you are capturing data, click on the Stop Capture
file while it is being captured.
2. Open the Event Display
3. Click the Save
or Frame Display
icon to stop data capture. You cannot save data to
window.
icon, or select Save from the File menu.
- 271 -
ComProbe BPA 600 User Manual
Chapter 6 Saving and Importing Data
Figure 6.1 - Windows Save dialog
4. Type a file name in the File name box at the bottom of the screen.
5. Browse to select a specific directory. Otherwise your file is saved in the default capture file directory.
6. When you are finished, click OK.
6.1.2 Saving the Entire Capture File with Save Selection
1. If you are capturing data, click on the Stop icon
to stop data capture. You cannot save data to file while
it is being captured.
2. Open the Event Display
or Frame Display
window.
3. Right click in the data
4. Select Save Selection or Save As from the right click
menu.
5. Click on the radio button labeled Entire File.
6. Choose to save Events or Frames . Choosing to save
Events saves the entire contents of the capture file.
Choosing to save Frames does not save all events in the
capture file.
7. Type a file name in the As box at the bottom of the screen.
Click the Browse icon to browse to a specific directory.
Otherwise your file is saved in the default capture file
directory.
8. When you are finished, click OK.
- 272 -
Chapter 6 Saving and Importing Data
ComProbe BPA 600 User Manual
6.1.3 Saving a Portion of a Capture File
1. If you are capturing data, click on the Stop icon
to pause data capture. You cannot save data to a file
while it is being captured.
2. Open the Event Display
or Frame Display
window, depending on whether you want to
specify a range in bytes or in frames.
3. Select the portion of the data that you want to save. Click and drag to select data, or click on the first item,
move to the last item and Shift+Click to select the entire range, or use the Shift key with the keyboard
arrows or the navigation icons in the Frame Display toolbar. If the range you want to save is too large to
select, note the numbers of the first and last item in the range.
4. Right click in the data
5. Select Save Selection or Save As from the right click
menu
6. Click on the radio button labeled Selection. If you selected
a range, make sure the starting and ending numbers are
correct. To specify a range, type the numbers of the first
and last items in the range in the boxes.
7. Select either Events or Frames to indicate whether the
numbers are event or frame numbers.
8. Type a file name in the As box at the bottom of the screen.
Click the Browse icon to browse to a specific directory.
Otherwise your file is saved in the default capture file
directory.
9. Click OK when you are finished. 6.2 Adding Comments to a Capture File
The Notes feature allows you to add comments to a CFA file. These comments can be used for many purposes.
For example, you can list the setup used to create the capture file, record why the file is useful to keep, or include
notes to another person detailing which frames to look at and why. (Bookmarks are another useful way to record
information about individual frames.)
To open the Notes window :
1. Click the Show Notes icon
as the Event Display
. This icon is present on the toolbars of the Frame Display
, as well
. Notes can be selected from the Edit menu on one of these windows.
- 273 -
ComProbe BPA 600 User Manual
Chapter 6 Saving and Importing Data
2. Type your comments in the large edit box on the Notes window. The Cut, Copy, Paste features are
supported from Edit menu and the toolbar
when text is selected. Undo and Redo features
are all supported from Edit menu and the toolbar
3. Click the thumbtack icon
at the current cursor location.
to keep the Notes window on top of any other windows.
4. When you're done adding comments, close the window.
5. When you close the capture file, you are asked to confirm the changes to the capture file. See Confirming
Capture File (CFA) Changes for more information.
6.3 Confirm Capture File (CFA) Changes
This dialog appears when you close a capture file after changing the Notes, the protocol stack, or bookmarks. The
dialog lists information that was added or changed and allows you to select which information to save, and
whether to save it to the current file or to a new one.
Changes made to the file appear in a list in the left pane. You can click on each item to see details in the right pane
about what was changed for each item. You simply check the boxes next to the changes you want to keep. Once
you decide what changes to keep, select one of the following:
l
Save To This File – Saves the changes you have made to the current capture file.
l
Save As – Saves the changes to a new file.
l
Cancel the Close Operation – Closes the file and returns you back to the display. No changes are saved.
l
Discard Changes – Closes the file without saving any of the changes made to the notes, bookmarks, or
protocol stack.
6.4 Loading and Importing a Capture File
6.4.1 Loading a Capture File
From the Control Window:
1. Go to the File menu.
2. Choose a file from the recently used file list.
3. If the file is not in the File menu list, select Open Capture File from the File menu or simply click on the
Open icon
on the toolbar.
4. Capture files have a .cfa extension. Browse if necessary to find your capture file.
5. Click on your file, and then click Open.
- 274 -
Chapter 6 Saving and Importing Data
ComProbe BPA 600 User Manual
6.4.2 Importing Capture Files
1. From the Control window
, go to the File menu and select Open Capture File or click on the Open
icon on the toolbar.
2. Left of the File name text box, select from the drop-down list Supported File Types box to All
Importable File Types or All Supported File Types (*.cfa, *.log, *.txt, *.csv, *.cap). Select the file and
click Open.
The analyzer automatically converts the file to the analyzer's format while keeping the original file in its original
format. You can save the file in the analyzer's format, close the file without saving it in the analyzer's format, or
have the analyzer automatically save the file in the analyzer's format (see the System Settings to set this option).
All of these options keep your original file untouched.
When you first open the file, the analyzer brings up the Protocol Stack window and ask you what protocol
decodes, if any, you want to use. You must choose a protocol decode at this point for the analyzer to decode the
data in the file. If you open a file without using any decodes, and decide later that you want to apply a decode,
choose Reframe from the File menu on the Control window.
At present, the analyzer supports the following file types:
l
l
Frontline Serialtest* Async and Serialtest ComProbe® for DOS – requires the .byt for data and the .tim for
timestamps (see note on importing DOS timestamps).
Greenleaf ViewComm* 3.0 for DOS - requires the .byt for data and the .tim for timestamps (see note on
importing DOS timestamps).
l
Frontline Ethertest* for DOS – requires 3 files: filename.cap, filename.ca0 and filename.ca1.
l
Sniffer Type 1 – supports files with the .enc extension. Does not support Sniffer files with a .cap extension.
l
l
l
l
Snoop or Sun Snoop – files with a .cap extension based on RFC 1761. For file format, see
http://www.faqs.org/rfcs/rfc1761.html.
Shomiti Surveyor files in Snoop format – files with a .cap extension. For file format, contact Technical Support.
CATC Merlin - files with a .csv extension. Files must be exported with a specific format. See File Format for
Merlin Files for information.
CATC Chief - files with a .txt extension.
6.5 Printing
6.5.1 Printing from the Frame Display/HTML Export
The Frame Display Print dialog and the Frame Display HTML Export are very similar. This topic discusses
both dialogs.
Frame Display Print
The Frame Display Print feature provides the user with the option to print the capture buffer or the current
selection. The maximum file size, however, that can be exported is 1000 frames.
When Print Preview is selected, the output displays in a browser print preview window, where the user can
select from the standard print options. The output file format is in html, and uses the Microsoft Web Browser
Control print options for background colors and images.
- 275 -
ComProbe BPA 600 User Manual
Chapter 6 Saving and Importing Data
Print Background Colors Using Internet Explorer
1. Open the Tools menu on the browser menu bar
2. Select “Internet Options…” menu entry.
3. Click Advanced tab.
4. Check “Print background colors and images” under the Printing section
5. Click the Apply button, then click OK
Configure the Print File Range in the Frame Display Print Dialog
Selecting more than one frame in the Frame Display window defaults the radio button in the Frame Display Print
dialog to Selection and allows the user to choose the All radio button. When only one frame is selected, the All
radio button in the Frame Display Print dialog is selected.
How to Print Frame Display Data
1. Select Print or Print Preview from the File menu on the Frame Display window to display the Frame
Display Print dialog. Select Print if you just want to print your data to your default printer. Select Print
Preview if you want access to printer options.
2. Choose to include the Summary pane (check the box) in the print output. The Summary pane appears at
the beginning of the printed output in tabular format. If you select All layers in the Detail Section, the
Data Bytes option becomes available.
3. In the Detail Section, choose to exclude—No decode section—the decode from the Detail pane in
the Frame Display, or include All Layers or Selected Layers Only. If you choose to include selected
layers, then select (click on and highlight) the layers from the list box.
4. Click on selected layers in the list to de-select, or click the Reset Selected Layers button to de-select all
selected layers.
Figure 6.2 - Frame Display Print Dialog
- 276 -
Chapter 6 Saving and Importing Data
ComProbe BPA 600 User Manual
5. Select the range of frames to include All or Selection in the Frame Range section of the Frame
Display Print dialog.
Choosing All prints up to 1000 frames from the buffer.
Choosing Selection prints only the frames you select in the Frame Display window.
6. Selecting the Delete File deletes the temporary html file that was used during printing
7. Click the OK button.
Frame Display Print Preview
The Frame Display Print Preview feature provides the user with the option to export the capture buffer to an
.html file. The maximum file size, however, that can be exported is 1000 frames.
If you chose Print Preview, the system displays your data in a browser print preview display with options for
printing such as page orientation and paper size. You can also use your Printer Preferences dialog to make some
of these selections. When printing your data, the analyzer creates an html file and prints the path to the file at the
bottom of the page. This file can be opened in your browser, however, it may appear different than the printed
version.
1. Select Print Preview from the File menu on the Frame Display window to display the Frame Display
Print Preview.
Figure 6.3 - Frame Display Print Preview Dialog
2. From this point the procedure is the same as steps 2 through 5 in "How to Print Frame Display Data" above.
3. Click the OK button, and after a brief wait a browser window will appear.
- 277 -
ComProbe BPA 600 User Manual
Chapter 6 Saving and Importing Data
6.5.2 Printing from the Event Display
The Event Display Print feature provides the user with the option to print either the entire capture buffer or the
current selection. When Print Preview is selected, the output displays in a browser print preview window where
the user can select from the standard print options. The output file format is in html, and uses the Microsoft Web
Browser Control print options for background colors and images (see below).
Print Background Colors Using Internet Explorer
1. Open the Tools menu on the browser menu bar
2. Select “Internet Options…” menu entry.
3. Click Advanced tab.
4. Check “Print background colors and images” under the Printing section
5. Click the Apply button, then click OK
The Event Display Print feature uses the current format of the Event Display as specified by the user.
See About Event Display for an explanation on formatting the Event Display prior to initiating the print feature.
Configure the Print File Range in the Event Display Print dialog
Selecting more than one event in the Event Display window defaults the radio button in the Event Display
Print dialog to Selection and allows the user to choose the All radio button. When only one event is selected ,
the All radio button in the Event Display Print dialog is selected.
How to Print Event Display Data to a Browser
1. Select Print or Print Preview from the File menu on the Event Display window to display the Event
Display Print dialog. Select Print if you just want to print your data to your default printer. Select Print
Preview if you want preview the print in your browser.
2. Select the range of events to include from either All or Selection in the Event Range section . Choosing
All prints all of the events in the capture file or buffer. Choosing Selection prints only the selected events
in the Event Display window.
Note: In order to prevent a Print crash, you cannot select All if there are more than
100,000 events in the capture buffer.
Note: See "Configure the Print File Range in the Event Display Print Dialog" above for an
explanation of these selections
- 278 -
Chapter 6 Saving and Importing Data
ComProbe BPA 600 User Manual
Figure 6.4 - Event Display Print Dialog
3. Click the OK button.
If you chose Print Preview, the system displays your data in a browser print preview display with options for
printing such as page orientation and paper size. You can also use your Printer Preferences dialog to make some
of these selections. When printing your data, the analyzer creates an html file and prints the path to the file at the
bottom of the page. This file can be opened in your browser, however, it may appear different than the printed
version.
6.6 Exporting
6.6.1 Frame Display Export
You can dump the contents of the Summary pane on the Frame Display into a Comma Separated File (.csv).
To access this feature:
1. Right click on the Summary pane or open the Frame Display File menu.
2. Select the Export… menu item.
3. Select a storage location and enter a File name.
4. Select Save.
6.6.2 Exporting a File with Event Display Export
With the Event Display Export dialog you can export the contents of the Event Display dialog as a test (.txt),
CSV (.csv.), HTML (.htm), or Binary File (.bin). You also have the option of exporting the entire capture buffer or
just the current selection of the Event Display dialog.
- 279 -
ComProbe BPA 600 User Manual
Chapter 6 Saving and Importing Data
Figure 6.5 - Event Display Export Example: .csv file.
How to Export Event Display Data to a File
1. Select Export Events from the File menu on the Event Display window to display the Event Display
Export dialog.
2. Enter a file path and name, or click the browser button to display the Windows Save As dialog and
navigate to the desired storage location.
3. Select a file type from the Save as type: drop-down List Menu on the Event Display Export dialog.
Select from among the following file formats:
Text File (*.txt)
CSV File (*.csv)
HTML File (*.html)
Binary File (*.bin)
4. Select the range of events to include in the file from either All or Selection in the Event Range section
of the Event Display Export dialog.
l
l
Selecting more than one event in the Event Display window defaults the radio button in the Event
Display Export dialog to Selection and allows the user to choose the All radio button.
When only one event is selected (something must be selected), the All radio button in the Event
Display Export dialog is selected by default.
5. Next you need to select the Side variable for serial communications.
l
is used to determine whether you want to export data from , or both.
l
Choose or Both to determine how you want to export the data.
5. Choose or Both to determine how you want to export the data.
6. Choose whether you want to display multiple events or single events per row.
- 280 -
Chapter 6 Saving and Importing Data
ComProbe BPA 600 User Manual
Events Per Row: You can choose to display Multiple Events Per Row, but this method contains no
timestamps. If you select One Event Per Row, you can display timestamps. multiple events or single
events per row.
Note: The raw timestamp value is the number of 100-nanosecond intervals since the
beginning of January 1, 1601. This is standard Windows time.
.
The timestamp data types displayed in columns for One Event Per Row.
Timestamp
Delta
Event Number
Byte Number
Frame Number
Type
Hex
Dec
Oct
Bin
Side
ASCII | 7-bit ASCII | EBCDIC | Baudot
RTS
CTS
DSR
DTR
CD
RI
UART Overrun
Parity Error
Framing Error
7. If you select .csv as the file type, choose whether you want to hide/display Preambles or Column
Headings in the exported file
8. Click Save. The Event Display Export file is saved to the locations you specified in File name.
- 281 -
ComProbe BPA 600 User Manual
Chapter 6 Saving and Importing Data
Figure 6.6 - Example: .csv Event Display Export, Excel spreadsheet
6.6.2.1 Export Filter Out
You can filter out data you don't want or need in your text file.
(This option is available only for serial data.) In the Filter Out box, choose which side to filter out: the DTE data,
the DCE data or neither side (don't filter any data.) For example, if you choose the radio button for DTE data, the
DTE data would be filtered out of your export file and the file would contain only the DCE data.
You can also filter out Special Events (which is everything that is not a data byte, such as control signal changes and
Set I/O events), Non-printable characters or both. If you choose to filter out Special Events, your export file would
contain only the data bytes. Filtering out the non-printable characters means that your export file would contain
only special events and data bytes classified as printable. In ASCII, printable characters are those with hex values
between $20 and $7e.
6.6.2.2 Exporting Baudot
When exporting Baudot, you need to be able to determine the state of the shift character. In a text export, the
state of the shift bit can be determined by the data in the Character field. When letters is active, the character
field shows letters and vice versa.
- 282 -
Chapter 7 General Information
7.1 System Settings and Progam Options
7.1.1 System Settings
Open the System Settings window by choosing System Settings from the Options menu on the Control
window. To enable a setting, click in the box next to the setting to place a checkmark in the box. To disable a
setting, click in the box to remove the checkmark. When viewing a capture file, settings related to data capture
are grayed out.
- 283 -
ComProbe BPA 600 User Manual
Chapter 7 General Information
Single File
Figure 7.1 - System Settings Single File Mode
This option allows the analyzer to capture data to a file. Each time you capture the file you must provide a file
name. The size of each file cannot larger than the number given in File Size (in K). The name of each file is the
name you give it in the Name box followed by the date and time. The date and time are when the series was
opened.
l
Restart Capturing After Saving or Clearing Capture File
If the Automatically Restart feature is enabled, the analyzer restarts capture to the file immediately after the
file is closed.
l
Wrap File
When enabled, the analyzer wraps the file when it becomes full. The oldest events are moved out of the file
to make room for new events. Any events moved out of the file are lost. When disabled, the analyzer stops
capture when the file becomes full. Either reset the file or close your capture file to continue.
l
File Size: The size of the file will depend of the available hard disk space.
1. Click the Min button to see/set the minimum acceptable value for the file size.
2. Click the Max button to see/set the maximum acceptable value for the file size.
- 284 -
Chapter 7 General Information
ComProbe BPA 600 User Manual
You can accept these values, or you can enter a unique file size.
But if you try to close the dialog after entering a value greater
than the maximum or less than the minimum, you will see the
following dialog. l
Start up
Opens the Program Start up Options window. Start up options let you choose whether to start data capture
immediately on opening the analyzer.
l
Advanced
Opens the Advanced System Options window. The Advanced Settings should only be changed on advice of
technical support.
7.1.1.1 System Settings - Disabled/Enabled Options
Some of the System Settings options are disabled depending upon the status of the data capture session.
l
l
l
As the default, all the options on the System Settings dialog are enabled.
Once the user begins to capture data by selecting the Start Capture button, some of the options on the System
Settings dialog are disabled until the user stops data capture and either saves or erases the captured data.
The user can go into the Startup options and Advanced system options on the System Settings dialog and
make changes to the settings at any time.
7.1.1.2 Advanced System Options
These parameters affect fundamental aspects of the software, and it is unlikely that you ever have to change
them. If you do change them and need to return them to their original values, the default value is listed in
parentheses to the right of the value box.
Most technical support problems are not related to these parameters, and as changing them could have serious
consequences for the performance of the analyzer, we strongly recommend contacting technical support before
changing any of these parameters.
To access the Advanced System Options:
1. Go to the Control
window.
2. Choose System Settings from the Options menu.
3. On the System Settings window, click the Advanced button.
- 285 -
ComProbe BPA 600 User Manual
Chapter 7 General Information
Figure 7.2 - Advanced System Options dialog l
l
l
Driver Receive Buffer Size in Kbytes - This is the size of the buffer used by the driver to store incoming
data. This value is expressed in Kbytes.
Driver Action Queue Size In Operating System Pages - This is the size of the buffer used by the driver
to store data to be transmitted. This value is expressed in operating system pages.
Frame Completion Timeout in Seconds - This is the number of seconds that the analyzer waits to receive
data on a side while in the midst of receiving a frame on that side.
If no data comes in on that side for longer than the specified number of seconds, an "aborted frame" event is
added to the Event Display and the analyzer resumes decoding incoming data. This can occur when capturing
interwoven data (DTE and DCE) and one side stops transmitting in the middle of a frame.
The range for this value is from 0 to 999,999 seconds. Setting it to zero disables the timeout feature.
Note: This option is currently disabled.
7.1.1.3 Selecting Start Up Options
To open this window:
1. Choose System Settings from the Options menu on the Control
window.
2. On the System Settings window, click the Start Up button.
3. Choose one of the options to determine if the analyzer starts data capture immediately on starting up or
not.
- 286 -
Chapter 7 General Information
ComProbe BPA 600 User Manual
Figure 7.3 - Start Up Options dialog
l
Don't start capturing immediately - This is the default setting. The analyzer begins monitoring data but
does not begin capturing data until clicking the Start Capture
icon on the Control, Event Display or
Frame Display windows.
l
Start capturing to a file immediately - When the analyzer starts up, it immediately opens a capture file
and begins data capture to it. This is the equivalent of clicking theStart Capture
icon. The file is given a
name based on the settings for capturing to a file or series of files in the System Settings window.
l
Start capturing immediately to the following file: - Enter a file name in the box below this option. When
the analyzer starts up, it immediately begins data capture to that file. If the file already exists, the data in it is
overwritten.
7.1.2 Changing Default File Locations
The analyzer saves user files in specific locations by default. Capture files are placed in the My Capture Files
directory and configurations are put in My Configurations. These locations are set at installation.
Follow the steps below to change the default locations.
1. Choose Directories from the Options menu on the Control window to open the File Locations
window.
- 287 -
ComProbe BPA 600 User Manual
Chapter 7 General Information
Figure 7.4 - File Locations dialog
2. Select the default location you wish to change.
3. Click Modify.
4. Browse to a new location.
Figure 7.5 - File Locations Browse dialog
5. Click OK.
6. Click OK when finished.
- 288 -
Chapter 7 General Information
ComProbe BPA 600 User Manual
If a user sets the My Decoders directory such that it is up-directory from an installation path, multiple instances of
a personality entry may be detected, which causes a failure when trying to launch Frontline. For example, if an
Frontline product is installed at C:\Users\Public\Public Documents\Frontline Test Equipment\My Decoders\ then
"My Decoders" cannot be set to any of the following:
l
C:\ My Decoders\
l
C:\Users\ My Decoders\
l
C:\Users\\Public\My Decoders\
l
C:\Users\Public\Public Documents\My Decoders\
l
or to any directory that already exists in the path C:\Users\Public\Public Documents\Frontline Test
Equipment\My Decoders\
Default Capture File Folder Checkbox
If the Use Last Opened Folder for Capture Files checkbox is checked, then the system automatically
changes the default location for saving capture files each time you open a file from or save a file to a new location.
For example, let's say the default location for saving capture files is Drive A > Folder A. Now you select the Use
Last Opened Folder for Capture Files checkbox. The next time, however, you open a capture file from a
different location, Folder B > Removable Flash Drive for example. Now when you save the capture file, it will be
saved to Folder B > Removable Flash Drive. Also, all subsequent files will be saved to that location. This remains
true until you open a file from or save a file to a different location.
There is one caveat to this scenario, however. Let's say you have selected Use Last Opened Folder for
Capture Files and opened a file from a location other than the default directory. All subsequent capture files
will be saved to that location. Suppose, however, the next time you want to save a capture file, the new file
location is not available because the directory structure has changed: a folder has been moved, a drive has been
reassigned, a flash drive has been disconnected, etc. In the case of a "lost" directory structure, subsequent
capture files will be saved to the default location. ComProbe software will always try to save a file to the folder
where the last file was opened from or saved to, if Use Last Opened Folder for Capture Files is checked. If,
however, the location is not accessible, files are saved to the default directory that is set at installation.
If the checkbox is unchecked, then the system always defaults to the directory listed in the File Locations dialog.
7.1.3 Side Names
The Side Names dialog is used to change the names of objects and events that appear in various displays. The
Side Names dialog will change depending on the sniffing technology in use at the time the software was loaded.
Changes to the Names are used throughout the program.
- 289 -
ComProbe BPA 600 User Manual
Chapter 7 General Information
Figure 7.6 - Example: Side Names Where "Slave" and "Master" are current
1. To open the Side Names dialog, choose Side Names… from the Options menu on the Control
window.
2. To change a name, click on the name given in the Current Names column, and then click again to modify
the name (a slow double-click).
3. Select OK to initiate the changes. The changes that have been made will not fully take effect for any views
already open. Closing and reopening the views will cause the name change to take effect.
4. To restore the default values, click the Set Defaults button.
7.1.4 Timestamping
Timestamping is the process of precise recording in time of packet arrival. Timestamps is an optional parameter in
the Frame Display and Event Display that can assist in troubleshooting a network link.
7.1.4.1 Timestamping Options
The Timestamping Options window allows you to enable or disable timestamping, and change the resolution of
the timestamps for both capture and display purposes.
To open this window:
Choose Set Timestamp Format… from the Options menu on the Frame Display and Event Display window or
click on the Timestamping Option
icon in the Event Display toolbar. The Timestamping Options window
will open.
- 290 -
Chapter 7 General Information
ComProbe BPA 600 User Manual
Figure 7.1 Timestamping Options dialog
7.1.4.2 Enabling/Disabling Timestamp
To enable timestamping click to make a check appear in the check box Store Timestamps (This time takes
effect immediately). Removing the check will disable timestamping.
7.1.4.3 Changing the Timestamp Resolution
This option affects the resolution of the timestamp stored in the capture file. The default timestamp is 10
milliseconds. This value is determined by the operating system and is the smallest "normal" resolutions possible.
Note: The raw timestamp value is the number of 100-nanosecond intervals since the beginning of
January 1, 1601. This is standard Windows time.
It is also possible to use "high resolution"
timestamping. High resolution timestamp
values are marked by an asterisk as high
resolution in the drop down list. To change
timestamping resolutions:
1. Go to the Capture Options section
of the window.
2. Change the resolution listed in the
Storage Resolution box.
- 291 -
ComProbe BPA 600 User Manual
Chapter 7 General Information
Note: If you change the resolution, you need to exit the analyzer and restart in order for the
change to take effect.
7.1.4.3.1 Performance Issues with High Resolution Timestamp
There are two things to be aware of when using high resolution timestamps. The first is that high resolution
timestamps take up more space in the capture file because more bits are required to store the timestamp. Also,
more timestamps need to be stored than at normal resolutions. The second issue is that using high resolution
timestamping may affect performance on slower machines
For example, if 10 bytes of data are captured in 10 milliseconds at a rate of 1 byte per millisecond, and the
timestamp resolution is 10 milliseconds, then only one timestamp needs to be stored for the 10 bytes of data. If
the resolution is 1 millisecond, then 10 timestamps need to be stored, one for each byte of data. If you have two
capture files, both of the same size, but one was captured using normal resolution timestamping and the other
using high resolution, the normal resolution file has more data events in it, because less room is used to store
timestamps.
You can increase the size of your capture file in the System Settings.
7.1.4.4 Switching Between Relative and Absolute Time
With Timestamping you can choose to employ Relative Time or Absolute time.
1. Choose System Settings from the Options menu on the Control window, and click the
Timestamping Options button, or click the click the Timestamping Options icon
from the
Event Display
window.
2. Go to the Display Options section at the bottom of the window and find the Display Relative
Timestamps checkbox.
3. Check the box to switch the display to relative timestamps. Remove the check to return to absolute
timestamps.
Note: The options in this section affect only how the timestamps are displayed on the screen, not
how the timestamps are recorded in the capture file.
l
l
l
l
Display Raw Timestamp Value shows the timestamp as the total time in hundred nanoseconds from a
specific point in time.
Display Relative Timestamps shows the timestamp as the amount of time that has passed since the first
byte was captured. It works just like a stop watch in that the timestamp for the first byte is 0:00:00.0000 and
all subsequent timestamps increment from there. The timestamp is recorded as the actual time, so you can
flip back and forth between relative and actual time as needed.
Selecting both values displays the total time in nanoseconds from the start of the capture as opposed to a
specific point in time.
Selecting neither value displays the actual chronological time.
When you select Display Relative Timestamp you can set the number of digits to display using the up or down
arrows on the numeric list.
- 292 -
Chapter 7 General Information
ComProbe BPA 600 User Manual
7.1.4.5 Displaying Fractions of a Second
1. Choose System Settings from the Options menu on the Control
window, and click the
Timestamping Options button, or click the click the Timestamping Options icon
Event Display
from the
window.
2. Go to the Display Options section at the bottom of the window, and find the Number of Digits to
Display box.
3. Click on the arrows to change the number. You can display between 0 and 6 digits to the right of the
decimal point.
7.2 Technical Information
7.2.1 Performance Notes
As a software-based product, the speed of your computer’s processor affects the analyzer’s performance. Buffer
overflow errors are an indicator that the analyzer is unable to keep up with the data. The information below
describes what happens to the data as it arrives, what the error means, and how various aspects of the analyzer
affect performance. Also included are suggestions on how to improve performance.
The analyzer's driver takes data from the driver and counts each byte as they are put into the driver’s buffer. The
analyzer's driver tells the user interface that data is ready to be processed. The analyzer takes the data from the
driver’s buffer and puts the data into the capture buffer.
Driver Buffer Overflows occur when the user interface does not retrieve frames from the driver quickly
enough. Buffer overflows are indicated in the Event Display window by a plus sign within a circle. Clicking on
the buffer overflow symbol displays how many frames have been lost.
There are several things that you can do to try and solve this problem.
l
l
l
l
l
Use capture filters to filter out data you don't need to see. Capture filters reduce the amount of data
processed by the analyzer. (Ethernet Only)
Close all other programs that are doing work while the analyzer is running. Refrain from doing searches in the
Event Display window or other processor intensive activities while the analyzer is capturing data.
Timestamping takes up processor time, primarily not in timestamping the data, but in writing the timestamp to
the file. Try turning off timestamping from the Timestamping Options window.
For Driver Buffer Overflows, change the size of the driver buffer. This value is changed from the
Advanced System Settings. Go to the Control window and choose System Settings from the Options
menu. Click on the Advanced button. Find the value Driver Receive Buffer Size in Operating System
Pages. Take the number listed there and double it.
The analyzer’s number one priority is capturing data; updating windows is secondary. However, updating
windows still takes a certain amount of processor time, and may cause the analyzer to lose data while the
window is being updated. Some windows require more processing time than others because the information
being displayed in them is constantly changing. Refrain from displaying data live in the Event Display and
Frame Display windows. The analyzer can capture data with no windows other than the Control window
open.
- 293 -
ComProbe BPA 600 User Manual
l
Chapter 7 General Information
If you are still experiencing buffer overflows after trying all of the above options, then you need to use a faster
PC.
7.2.2 BTSnoop File Format
Overview
The BTSnoop file format is suitable for storing Bluetooth® HCI traffic. It closely resembles the snoop format, as
documented in RFC 1761.
File Format
The snoop packet capture file is an array of octets structured as follows:
The File Header is a fixed-length field containing general information about the packet file and the format of the
packet records it contains. One or more variable-length Packet Record fields follow the File Header field. Each
Packet Record field holds the data of one captured packet.
File Header
The structure of the File Header is as follows:
Identification Pattern:
A 64-bit (8 octet) pattern used to identify the file as a snoop packet capture file. The Identification Pattern consists
of the 8 hexadecimal octets:
62 74 73 6E 6F 6F 70 00
This is the ASCII string "btsnoop" followed by one null octets.
Version Number:
A 32-bit (4 octet) unsigned integer value representing the version of the packet capture file being used. This
document describes version number 1.
- 294 -
Chapter 7 General Information
ComProbe BPA 600 User Manual
Datalink Type:
A 32-bit (4 octet) field identifying the type of datalink header used in the packet records that follow. The datalink
type codes are listed in the table below. Values 0 - 1000 are reserved, to maximize compatibility with the
RFC1761 snoop version 2 format.
Table 7.2 - Datalink Codes
Datalink Type
Code
Reserved
0 - 1000
Un-encapsulated HCI (H1) 1001
HCI UART (H4)
1002
HCI BSCP
1003
HCI Serial (H5)
1004
Unassigned
1005 - 4294967295
Packet Record Format
Each packet record holds a partial or complete copy of one packet as well as some descriptive information about
that packet. The packet may be truncated in order to limit the amount of data to be stored in the packet file.
Each packet record holds 24 octets of descriptive information about the packet, followed by the packet data,
which is variable-length, and an optional pad field. The descriptive information is structured as six 32-bit (4-octet)
integer values.
The structure of the packet record is as follows:
Original Length
A 32-bit unsigned integer representing the length in octets of the captured packet as received via a network.
Included Length
A 32-bit unsigned integer representing the length of the Packet Data field. This is the number of octets of the
captured packet that are included in this packet record. If the received packet was truncated, the Included Length
field is less than the Original Length field.
Packet Flags
- 295 -
ComProbe BPA 600 User Manual
Chapter 7 General Information
Flags specific to this packet. Currently the following flags are defined:
Bit No.
Table 7.3 - Packet Flag Description
Definition
0
Direction flag 0 = Sent, 1 = Received
1
Command flag 0 = Data, 1 = Command/Event
2 - 31
Reserved
Bit 0 is the least significant bit of the 32-bit word.
Direction is relative to host / DTE. i.e. for Bluetooth controllers, Send is Host->Controller, Receive is Controller>Host.
Note: Some Datalink Types already encode some or all of this information within the Packet Data. With these
Datalink Types, these flags should be treated as informational only, and the value in the Packet Data should take
precedence.
Cumulative Drops
A 32-bit unsigned integer representing the number of packets that were lost by the system that created the
packet file between the first packet record in the file and this one. Packets may be lost because of insufficient
resources in the capturing system, or for other reasons.
Note: some implementations lack the ability to count dropped packets. Those implementations may set the
cumulative drops value to zero.
Timestamp Microseconds
A 64-bit signed integer representing the time of packet arrival, in microseconds since midnight, January 1st, 0 AD
nominal Gregorian.
In order to avoid leap-day ambiguity in calculations, note that an equivalent epoch may be used of midnight,
January 1st 2000 AD, which is represented in this field as 0x00E03AB44A676000.
Packet Data
Variable-length field holding the packet that was captured, beginning with its datalink header. The Datalink Type
field of the file header can be used to determine how to decode the datalink header. The length of the Packet
Data field is given in the Included Length field.
Note that the length of this field in not necessarily rounded to any particular multi-octet boundary, as might
otherwise be suggested by the diagram.
Data Format
All integer values are stored in "big-endian" order, with the high-order bits first.
7.2.3 Ring Indicator
The following information applies when operating the analyzer in Spy mode or Source DTE, No FTS Cables
mode. When using the cables supplied with the analyzer to capture or source data, Ring Indicator (RI) is routed to
a different pin which generates interrupts normally.
There is a special case involving Ring Indicator and computers with 8250 UARTs or UARTs from that family where
the state of RI may not be captured accurately. Normally when a control signal changes state from high to low or
low to high, an interrupt is generated by the UART, and the analyzer goes to see what has changed and record it.
- 296 -
Chapter 7 General Information
ComProbe BPA 600 User Manual
Ring Indicator works a little differently. An interrupt is generated when RI changes from high to low, but not when
RI changes from low to high. If Ring Indicator changes from low to high, the analyzer does not know that RI has
changed state until another event occurs that generates an interrupt. This is simply the way the UART works, and
is not a deficiency in the analyzer software.
To minimize the chance of missing a Ring Indicator change, the analyzer polls the UART every millisecond to see if
RI has changed. It is still possible for the analyzer to miss a Ring Indicator change if RI and only RI changes state
more than once per millisecond.
UARTs in the 8250 family include 8250s, 16450s, 16550s and 16550 variants. If you have any questions about the
behavior of your UART and Ring Indicator, please contact technical support.
7.2.4 Progress Bars
The analyzer uses progress bars to indicate the progress of a number of different processes. Some progress bars
(such as the filtering progress bar) remain visible, while others are hidden.
The title on the progress bar indicates the process underway.
7.2.5 Event Numbering
This section provides information about how events are numbered when they are first captured and how this
affects the display windows in the analyzer. The information in this section applies to frame numbering as well.
When the analyzer captures an event, it gives the event a number. If the event is a data byte event, it receives a
byte number in addition to an event number. There are usually more events than bytes, with the result is that a
byte might be listed as Event 10 of 16 when viewing all events, and Byte 8 of 11 when viewing only the data bytes.
The numbers assigned to events that are wrapped out of the buffer are not reassigned. In other words, when
event number 1 is wrapped out of the buffer, event number 2 is not renumbered to event 1. This means that the
first event in the buffer may be listed as event 11520 of 16334, because events 1-11519 have been wrapped out
of the buffer. Since row numbers refer to the event numbers, they work the same way. In the above example,
the first row would be listed as 2d00 (which is hex for 11520.)
The advantage of not renumbering events is that you can save a portion of a capture file, send it to a colleague,
and tell your colleague to look at a particular event. Since the events are not renumbered, your colleague’s file
use the same event numbers that your file does.
7.2.6 Useful Character Tables
7.2.6.1 ASCII Codes
- 297 -
ComProbe BPA 600 User Manual
Chapter 7 General Information
7.2.6.2 Baudot Codes
7.2.6.3 EBCDIC Codes
7.2.6.4 Communication Control Characters
Listed below in alphabetical order are the expanded text meanings for common ANSI communication control
characters, and two-character system abbreviation for each one. Some abbreviations have forward slash
- 298 -
Chapter 7 General Information
ComProbe BPA 600 User Manual
characters between the two letters. This is to differentiate the abbreviations for a control character from a hex
number. For example, the abbreviation for Form Feed is listed as F/F, to differentiate it from the hex number FF.
Table 7.4 - Communications Control Characters
Abbreviation
Control Character
Text
AK
ACK
Acknowledge
BL
BEL
Bell
BS
BS
Backspace
CN
CAN
Cancel
CR
CR
Carriage Return
D/1-4
DC1-4
Device Control 1-4
D/E
DEL
Delete
DL
DLE
Data Link Escape
EM
EM
End of Medium
EQ
ENQ
Enquiry
ET
EOT
End of Transmission
E/C
ESC
Escape
E/B
ETB
End of Transmission Block
EX
ETX
End of Text
F/F
FF
Form Feed
FS
FS
File Separator
GS
GS
Group Separator
HT
HT
Horizontal Tabulation
LF
LF
Line Feed
NK
NAK
Negative Acknowledge
NU
NUL
Null
RS
RS
Record Separator
SI
SI
Shift In
SO
SO
Shift Out
SH
SOH
Start of Heading
SX
STX
Start of Text
SB
SUB
Substitute
SY
SYN
Synchronous Idle
- 299 -
ComProbe BPA 600 User Manual
Chapter 7 General Information
Table 7.4 - Communications Control Characters(continued)
Abbreviation
Control Character
Text
US
US
Unit Separator
VT
VT
Vertical Tabulation
7.2.7 The Frontline Serial Driver
ComProbe software uses custom versions of the standard Windows serial drivers in order to capture data. These
drivers are usually installed during the routine product installation. However, if you need to install the serial driver
after ComProbe software has already been installed, please refer to the instructions available in the Setup folder
installed under Start | Programs | [Product Name and version #] | Setup | How to Install the FTS Serial Driver.
7.2.8 DecoderScript Overview
The DecoderScript™ Reference Manual and User Guide is delivered with each Frontline ComProbe® Protocol
Analysis System installation package under Developer Tools. The manual is also available on-line at FTE.com.
The main purpose of this manual is to describe DecoderScript™, the language used in writing decoders.
DecoderScript allows you to create new decoders or modify existing decoders to expand the functionality of your
ComProbe protocol analyzer. DecoderScript displays protocol data, checks the values of fields, validates
checksums, converts and combines field values for convenient presentation. Decoders can also be augmented
with custom C++-coded functions, called "methods", to extend data formatting, validation, transformations, and so
on.
A decoder defines field-by-field how a protocol message can be taken apart and displayed. The core of each
"decoder" is a program that defines how the protocol data is broken up into fields and displayed in the Frame
Display window of the analyzer software.
This manual provides instruction on how to create and use custom decoders. When reading the manual for the
first time, we encourage you to read the chapters in sequence. The chapters are organized in such a way to
introduce you to DecoderScript writing step- by- step.
Screenshots of the ComProbe protocol analyzer have been included in the manual to illustrate what you see on
your own screen as you develop decoders. But you should be aware for various reasons, the examples may be
slightly different from the ones that you create. The differences could be the result of configuration differences or
because you are running a newer version of the program. Do not worry if an icon seems to be missing, a font is
different, or even if the entire color scheme appears to have changed. The examples are still valid.
Examples of decoders, methods, and frame recognizers are included in this manual. You can cut and paste from
these examples to create your own decoders.
A quick note here: Usually the pasted code appears the same as the original in your editor. Some editors,
however, change the appearance of the text when it is pasted (something to do with whether it is ASCII or
Unicode text). If you find that the pasted text does not appear the same as the original, you can transfer the code
into a simple text editor like Notepad, save it as an ANSI (ASCII) file, then use it in your decoder.
These files are installed in the FTE directory of the system Common Files directory. The readme file in the root
directory of the protocol analyzer installation contains a complete list of included files. Most files are located in My
Decoders and My Methods.
We will be updating our web site with new and updated utilities, etc, on a regular basis and we urge decoder
writers to check there occasionally.
- 300 -
Chapter 7 General Information
ComProbe BPA 600 User Manual
7.2.9 Bluetooth low energy ATT Decoder Handle Mapping
Low energy device attributes contain a 16-bit address called the attribute handle. Each handle is associated with
an attribute Universally Unique Identifier (UUID) that is 128-bits long. In the attribute database, the handle is
unique while the UUID is not unique.
The ComProbe software detects and stores the relationships (mappings) between handle and UUID during the
GATT discovery process. But sometimes, there is no GATT discovery process because
l
l
l
The discovery has previously taken place and both devices stored the mappings and the discovery will not
repeat at every subsequent connection.
The developer owns both devices in the conversation and chose to ignore discovery because the mappings
are known.
The devices are in development and the code to perform the mappings has not been written yet.
The solution to this problem is to
1. define the mappings in a file and
2. then pre-loading the mapping using the ComProbe software.
Creating handle-UUID mapping file
Create a file named "ATT_Handle_UUID_Preload.ini' in the root directory of "C:\Users\Public\Public
Documents\Frontline Test Equipment\My Decoders\", but the file can be located anywhere.
Assume that you want to create a GATT service starting at handle 1.
Create a section in the ini file called
[Service Base Handles]
A=1
"A" will be your first service. Make the base handle equal to the handle of your service. You can use all upper and
lower case letters so you can have up to 52 service handles.
Next add the following section.
[Advertiser Handles]
; Generic Access Profile (GAP)
A0 = 1800
A1 = 2803
A2 = 2a00
A3 = 2803
A4 = 2a01
A5 = 2803
A6 = 2a04
A few tings of note:
l
In the code above, lines begging with a semi-colon are comments.
l
If you want to change the base handle of the GAP service, change the "1" to some other number.
l
If you want to comment out the entire service, comment out the base handle. If no "A" is defined, the
software will ignore "A1", "A2" and so on.
- 301 -
ComProbe BPA 600 User Manual
Chapter 7 General Information
7.3 Contacting Technical Support
Technical support is available in several ways. The online help system provides answers to many user related
questions. Frontline's website has documentation on common problems, as well as software upgrades and utilities
to use with our products.
On the Web: http://fte.com/support/supportrequest.aspx
Email:
[email protected]
If you need to talk to a technical support representative about your ComProbe BPA 600 product, support is
available between 9 am and 5 pm, U.S. Eastern Time zone, Monday through Friday. Technical support is not
available on U.S. national holidays.
Phone: +1 (434) 984-4500
Fax:
+1 (434) 984-4505
Instructional Videos
Frontline provides a series of videos to assist the user and may answer your questions. These videos can be
accessed at fte.com/support/videos.aspx. On this web page use the Video Filters sidebar to select instructional
videos for your product.
- 302 -
Appendicies
Appendix A: Application Notes
305
- 303 -
ComProbe BPA 600 User Manual
Appendicies
- 304 -
Appendix A: Application Notes
A.1 Audio Expert System: aptX 'hiccup' Detected
306
A.2 Getting the Android Link Key for Classic Decryption
313
A.3 Bluetooth Conductive Testing—Isolating the Environment
319
A.4 Decrypting Encrypted Bluetooth®data with ComProbe BPA 600
324
A.5 Decrypting Encrypted Bluetooth® low energy
332
A.6 Bluetooth® low energy Security
342
A.7 Bluetooth Virtual Sniffing
349
- 305 -
ComProbe BPA 600 User Manual
Appendicies
A.1 Audio Expert System: aptX 'hiccup' Detected
This paper presents a case study in Bluetooth® audio debugging that highlights the importance of Frontline's Audio
Expert System (AES) in the process. The actual case involves transmission of a high quality, stereo audio using the
aptX codec from a smartphone to a Bluetooth headset. The transmission contained SBC encoded packets despite a
successful negotiation of aptX encoding and decoding mechanism between the source and the sink devices.
Frontline's AES software discovered this transmission error which most likely would not have been easily
discovered by using traditional Bluetooth protocol and event analysis. Without the Audio Expert System a product
may have been shipped that was not performing as expected by the manufacturer.
A.1.1 Background
In Bluetooth technology, Audio/Video Distribution Transport Protocol (AVDTP) uses Advanced Audio Distribution
Profile (A2DP) for streaming audio in stereo. The A2DP encompasses compression techniques to reduce the
amount of radio frequency bandwidth required to transmit audio. In addition to A2DP, Audio/Video Remote
Control Profile (AVRCP) controls certain functions of the sending device such as pause, play, next track, etc.
All Bluetooth products using A2DP are required to implement audio encoding and decoding using low complexity
Sub Band Coding (SBC) that supports up to 345 kb per second bit rate for stereo audio. The SBC codec has some
issues though. SBC coding and decoding produces some undesirable artifacts in the audio signal. In addition, the
SBC encoding and decoding cycle introduces a time lag in the audio. To improve on SBC's artifacts and time lag
issues, a CSR proprietary codec that is called aptX® is implemented on some Bluetooth products.
During the negotiation phase, both Bluetooth devices handshake and they automatically discover the best codec
and the highest bit rate to use for audio. If both devices support aptX, it is used rather than the default SBC.
The AES software helps identify audio issues in Bluetooth protocol by highlighting information, warnings, and
errors related to audio data, codec used, and Bluetooth protocol implementation. They are collectively called
“events” in AES.The AES window shows audio data plotted as PCM samples versus time in the Wave Panel. The
audio data, codec, and protocol events are also graphically displayed in the Wave Panel, and with a single click on
an event, engineers and testers are brought directly to the exact packets or frames related to the event in the
Bluetooth protocol trace in the Frame Display. This helps users find issues quickly and easily. The events are shown
time aligned with both the actual audio waveform and bit rate variances graph in the Wave Panel. The bit rate
variance graph shows the average or actual amount of Bluetooth audio data sent over a period of time.
AES can operate in two modes: 1) referenced mode, and 2) non-referenced mode. In referenced mode a
Frontline provided audio test file is streamed between the Devices Under Test (DUTs). The test file content and
parameters are known to the AES software that performs a comparison for deviations. This process helps the
software accurately detect anomalies created by the streaming process. In non-referenced mode DUTs stream
audio of unknown content, limiting the types of detectable events. The software automatically determines the
operation mode with no user input required.
A.1.2 Test Setup
The following DUTs below were used in our test setup:
l
DUT1 = smartphone with Bluetooth and aptX capability. The smartphone operating system was Android.
l
DUT2 = Earphones with Bluetooth and aptX capability.
The protocol analyzer: ComProbe BPA 600 Dual Mode Bluetooth Protocol Analyzer with Bluetooth Audio Expert
System activated. The BPA 600 is connected to a personal computer (PC) that is running ComProbe Protocol
Analysis System software.
DUT1 was used as a source device. DUT1 was streaming an AES Reference file.
- 306 -
Appendicies
ComProbe BPA 600 User Manual
DUT2 was used as a sink device. After establishing a valid Bluetooth link, DUT2 played the AES Reference file.
The audio test file was played from the Bluetooth smart phone to the Bluetooth headphone. The data captured by
the ComProbe BPA 600 hardware was sent to the analysis computer running ComProbe software with AES. As the
data was captured, it was analyzed by the AES module and displayed live in the AES window. The AES software
automatically detected the test ID tones in the captured audio and operated in the referenced mode. The figure 1
below shows the test setup.
Figure 1 - The Test Setup.
A.1.3 Discussion
The test began without any issue. DUT1 and DUT2 negotiated a Bluetooth connection suitable for transmitting the
audio. When the Reference Audio was played there were no obvious audio distortions or anomalies heard by the
tester.
The tester used a ComProbe BPA 600 configured for capturing Classic Bluetooth over a single connection.
In Frame Display AVDTP Signaling tab we see the start of the negotiation between DUT1 and DUT2 to establish an
audio connection, see Figure 2. At frames 2089 and 2092 the initiating or local device sends an AVDTP_
DDISCOVER command. The remote device responds by identifying the ACP Stream Endpoint IDs. In this case the
remote device identifies three audio media-type devices that are SNK (sink) devices currently not in use: SEPID
(Stream Endpoint Identification) 5, 2, and 1.
- 307 -
ComProbe BPA 600 User Manual
Appendicies
Figure 2 - Frame Display for AVDTP Signaling Frame 2089 & 2092
Note: "ACP" is AVDTP terminology for the remote device.
The next step in the negotiation is to get the audio capabilities of each SEPID. For each SEPID there is an exchange
of GET_CAPABILITIES AVDTP signals.
Examination of the Frame Display AVDTP Signaling protocol tab shows at frame 2116 the slave device request SEP
(Stream End Point) characteristics. for SEPID (SEP Identifier) 5. Details of the GET_CAPABILITIES command are
shown in the Figure 3.
Figure 3 - Frame Display for AVDTP Signaling Frame 2116
At frame 2119 the remote device responds to the GET_CAPABILITIES for SEPID 5 reporting that this SEP codec is
aptX with a Channel Mode Stereo.
- 308 -
Appendicies
ComProbe BPA 600 User Manual
Figure 4 - Frame Display for AVDTP Signaling Frame 2119
In Figure 4, frames 2138 through 2158 perform the GET_CAPABILITIES negotiation between the local and remote
device for SEPIDs 2 and 1. SEPID 2 is an MPEG SEP, and SEPID 1 is the SBC SEP.
Frames 2169 and 2175 sets the specific details of the
connection with the SET_CONFIGURATION signal. The local
device sets the remote endpoint to the aptX device (ACP
Stream Endpoint ID: 5), and sets the local endpoint to SEPID 1
(INT Stream Endpoint ID: 2). The Codec, Sampling Frequency,
and Channel Mode are also configured. See Figure 5.
At frame 2175 the remote device sends the message
"Response Accept" completing the audio stream setup.
Frames 2185 and 2190 are the local request and the remote
response to OPEN the audio stream.
Frames 2823 and 2833 START the audio stream with the local
request and the remote response respectively.
- 309 -
ComProbe BPA 600 User Manual
Appendicies
Figure 5 - Frame Display for AVDTP Signaling Frame 2169, SET_CONFIGURATION
So far the process of setting up an aptX audio connection between DUT1 and DUT2 appears normal, correct and
error free. We now move from he AVDTP protocol to the A2DP protocol to observe the audio.
Problem Discovery
Figure 6 - Frame Display for A2DP Streaming at Frame 2839 with Audio Expanded
In the ComProbe software, the audio data is shown in the A2DP tab in the Frame Display, see Figure 6. The frame
2839, which is the first audio frame, is identified as being aptX encoded because of the successful codec
negotiation. At this frame, the conventional audio data analysis methods do not show any issues. Assuming the
data is aptX encoded, the AES software passes it to the AES aptX decoder. However, the data was not
decoded.correctly and is marked as a bad aptX frame.On further analysis, the AES software discovers that the
frame is not aptX encoded but is actually SBC encoded. Frame 2839 begins with “0x9C”, and all SBC audio frames
begin with sync word “0x9c” as shown in Figure 6. The AES cannot solely rely on the sync word to determine if it
is a SBC frame. To confirm the suspicion, the AES passed the data through its SBC decoder, and the data came out
cleanly decoded.
The AES software not only showed that there is a problem in the audio data but also made it clear where the
problem is.
- 310 -
Appendicies
ComProbe BPA 600 User Manual
The Error that is identified by Event 4, the Severity red circle
, is a codec
event at Frame 2839 states
"Unable to process AptX data as extracted. It appears that SBC encoded data is being sent over this stream."
Figure 7 - Audio Expert System Error on Frame 2839: Data not aptX.
A.1.4 Conclusions
This case shows the value of Frontline's Audio Expert System. An error in the transmission of an audio stream
compressed using aptX was not easily detected in the protocol analysis using frames. While, in this situation with
audio streaming between a smartphone and a Bluetooth headset, there was not a significant disruption of the
audio, but in playback using other devices there may have been a more significant interruption of the audio
streaming.
The smartphone manufacturer may wish to find out why aptX compressed audio contained SBC compressed data
in the stream. We can speculate that there may be an underlying problem with clearing stacks or memory
between streaming events. This investigation is beyond the scope of this paper.
If there is interest in the Audio Expert System as an expansion of your ComProbe Bluetooth analyzer contact the
Frontline sales at [email protected] or visit our web site at fte.com.
Author: John Trinkle & Priyanka Gupta
Publish Date:27 February 2015
- 311 -
ComProbe BPA 600 User Manual
Appendicies
- 312 -
A.2 Getting the Android Link Key for Classic Decryption
Bluetooth devices on an encrypted link share a common “link key” used to exchange encrypted data. For a
Bluetooth sniffer, such as the ComProbe BPA 600, to be able to decrypt the encrypted data, it must also have this
shared link key. For obvious security reasons, the link key is never sent over the air, so either the user must get
the key out of one of the devices being sniffed and supply the key to the sniffer or the sniffer must create the key
itself.
Bluetooth devices using the Android operating system have a "developer" option that will provide the link key for
Classic Bluetooth decryption. This procedure will use the developer options to obtain the Android HCI (Host
Controller Interface) log that contains the link keys for all active links..
A.2.1 What You Need to Get the Android Link Key
The process applies to the Android 4.4 or later operating system.
l
Android device with Bluetooth enabled and paired with another Bluetooth device.
l
ComProbe Protocol Analysis System installed on your computer
l
Android Debug Bridge (optional)
Note: Each Android device model can vary in screen organization, layout and format. The
directions in this paper are based on known typical Android device. Refer to the manufacturer's
manual,on-line help, or technical support for detailed information about your particular device.
A.2.2 Activating Developer options
The Android HCI log will contain the link key for an active Bluetooth link.
1. On the Android device go to Settings,
2. Select About.
3. In the About screen tap on Build number eight times. At some point you will see a notice similar to "You
are now a developer!".
Note: On some devices the build information may be under one or more sub-screens below
the About screen. Also the number of taps may vary; in most cases the screen will provide
- 313 -
ComProbe BPA 600 User Manual
Appendicies
status of your tap count.
4. Return to the Settings screen and you will see Developer options
A.2.3 Retrieving the HCI Log
Now that Developer options have been activated on the Android device, you can retrieve the HCI log.
1. On the Android device go to Settings.
2. Select Developer options.
3. Click to enable Bluetooth HCI snoop logging.
4. Return to the Settings screen and select Developer options.
5. In the Developer options screen select Enable Bluetooth HCI snoop log. The log file is now
enabled.
Figure 8 - Typical Android Developer options screen
6. On the Android device turn off Bluetooth.
7. Turn on Bluetooth.
8. Reboot the Android device.
- 314 -
Appendicies
ComProbe BPA 600 User Manual
The HCI log file is now being generated and is saved to /sdcard/btsnoop_hci.log.
Note: Samsung devices have a slightly different location for the btsnoop file.
There are two options for retrieving the HCI log from the Android device.
a. Attach the Android device to your computer. The file /sdcard/btsnoop_hci.log is in the root of one of the
mountable drives. Copy the file to directory C:/Users/Public/Public Documents/Frontline Test
Equipement/My Capture File/.
b. The second option is to use the Android Debug Bridge (ADB)using the following steps. The debug bridge is
included with Android Software Developer Kit.
(1). On the Androd device Development screen, select Android debugging or USB debugging.
(2). Connect your computer and Android device with a USB cable.
(3). Open a terminal on your computer and run the following command.
adb devices.
(4). Your Android device should show up in this list confirming that ADB is working.
List of devices attached
XXXXXXXXXXX device
(5). In the terminal enter the following command to copy the HCI Log to your computer.
adb pull /sdcard/btsnoop_hci.log
A.2.4 Using the ComProbe Software to Get the Link Key
You will load the HCI Log file btsnoop_HCI.log into the ComProbe Protocol Analysis System on your computer as a
capture file. Then you can use the Frame Display to locate the link key.
1. Activate the ComProbe Protocol Analysis System. (Refer to the ComProbe BPA 600 User Manual on
fte.com).
2. From the Control window menu select File, Open Capture File....
3. When the Open window appears, set the file type to BTSnoop Files (*.log). If not already selected
navigate to the My Capture Files directory and select btsnoop_hci.log.
- 315 -
ComProbe BPA 600 User Manual
Appendicies
Figure 9 - Select Capture File
4. Open the Frame Display
5. In the Frame Display protocol tabs select HCI. (See image below)
6. Select Find
, click on the Decode tab, and enter "link key" in the Search for String in Decode. Check
the Ignore Case option. Click on Find Next until the Event column shows Link Key Notification.
Figure 10 - Find Dialog
In the Frame Display Detail pane, expand HCI and HCI Event where the Link Key is shown. Copy and
paste the Link Key into the appropriate BPA 600 datasource dialog. (See the example below)
- 316 -
Appendicies
ComProbe BPA 600 User Manual
Figure 11 - Frame Display Showing Link Key Notification Event with the Link Key
Author: John Trinkle with Joe Skupniewitz
Publish Date: 30 September 2014
- 317 -
ComProbe BPA 600 User Manual
Appendicies
- 318 -
A.3 Bluetooth Conductive Testing—Isolating the Environment
Conductive testing could be used for many reasons, but the most common use is to isolate the Bluetooth® test
setup from the surrounding environment. Interference from radio frequency (RF) sources is the most common
reason for isolating the test from the environment. This is especially important when the environment contains RF
sources using the industrial, scientific, and medical (ISM) radio bands from 2.4 to 2.485 GHz that are the bands
used for Bluetooth.
“Conductive” in this context means that you are not “air sniffing”, that is, capturing Bluetooth transmissions on the
ComProbe analyzer antenna. The conductive test setup uses coaxial cable to directly connect the Device Under
Test (DUT) to the analyzer antenna connectors. The coaxial cable provides the isolation from the environment
through shielding.
A.3.1 Bluetooth Transmitter Classes
Bluetooth transmitters are categorized by power classes, that is, by the amount of RF power output. A Bluetooth
Class maximum operating range is directly related to the power output. The class is important in conductive
testing because the DUTs and the ComProbe Sodera are connected directly to each other, usually over small
distances. The absence of power loss , which occurs during over-the-air transmission, means that larger than
normal power levels may be present at the receiving port. Attenuation may be necessary to protect both the DUT
and the ComProbe Sodera from excessive power input and to ensure reliable operation.
The table lists the maximum power and operating range for each Bluetooth Class.
Table A.1 - Bluetooth Power Classes
Class Maximum Power Operating Range
1
100 mW (20 dBm)
100 meters
2
2.5 mW (4 dBm)
10 meters
3
1 mW (0 dBm)
1 meter
A.3.2 Test Equipment
While exact conductive test setups are dependent on the specific circumstances surrounding the DUT RF
interface, the following equipment is required for all test setups.
- 319 -
ComProbe BPA 600 User Manual
Appendicies
1. Coaxial cable with adapter for connecting to DUT 1.
2. Coaxial cable with adapter for connecting to DUT 2.
3. Coaxial T-connectors: 1 for ComProbe Sodera, 2 for ComProbe BPA 600.
4. SMA adapters for connecting coaxial cable or attenuators to the ComProbe antenna connectors: 1 for
ComProbe Sodera, 2 for ComProbe BPA 600.
5. Attenuators depending on the Bluetooth Class being tested.
6. Frontline ComProbe analyzer that can be either of the following
a. ComProbe Sodera Wideband Bluetooth Protocol Analyzer or
b. ComProbe BPA 600 Dual Mode Bluetooth Protocol Analyzer
7. Personal computer for running ComProbe software.
A.3.3 Test Setup - Bluetooth
The following figure show the conductive test setup. For information on setting up and operating the ComProbe
Sodera and ComProbe BPA 600, refer to the ComProbe User Manuals at fte.com.
Figure 12 - Sodera Conductive Test Setup
- 320 -
Appendicies
ComProbe BPA 600 User Manual
Figure 13 - BPA 600 Conductive Test Setup
Both ComProbe BPA 600 antennas must be connected as shown.
The AT1 through AT4 attenuator values will depend on the DUT1 and DUT2 transmitter Class. At higher power
levels all four attenuators may be needed. In all cases, use good engineering practices to protect the devices
under test and the ComProbe hardware from damage, and to ensure reliable operation.
Assuming that there is no attenuation in the test setup:
l
l
For Sodera
o
At the T-connector the power will split in half. For example, if DUT1 is a Class 1 device transmitting +20
dBm (100 mW), at the T-connector it will split with +17 dBm (50 mW) going to DUT2 and +17 dBm (50
mW) going to the ComProbe Sodera.
o
If DUT1 or DUT2 is a Class 2 device, +10 dBm (12.5 mW) will reach the ComProbe analyzer antenna
connector. If they are Class 3 devices, -3 dBm (0.5 mW) will reach the antenna connector.
For BPA 600
o
At each T-connector the power will split in half. Therefore the power reaching the ComProbe protocol
analyzer will be one-fourth the transmitted power. For example if DUT1 is a Class 1 device transmitting
+20 dBm (100 mW), at the first T-connector it will split with +17 dBm (50 mW) going to DUT2 and +17dBm
(50 mW) going to the ComProbe analyzer.
o
The +17dBm (50 mW) going to the ComProbe analyzer splits again. Each coaxial cable going to a ComProbe
analyzer antenna connector carries +14 dBm (25 mW).
o
If DUT1 or DUT2 is a Class 2 device, +8 dBm (6.25 mW) will reach each ComProbe analyzer antenna
connector. If they are Class 3 devices, -6 dBm (0.25 mW) will reach each antenna connector.
Attenuation should be selected to limit the received power levels to prevent equipment damage, and to provide
sufficient power to reliably operate the equipment. If using attenuation follow these recommendations:
l
If the devices are of the same class, the attenuators AT1 and AT2 should be of equal value.
l
For ComProbe BPA 600 attenuators AT3 and AT4 should be of equal value.
- 321 -
ComProbe BPA 600 User Manual
l
Appendicies
Determine the maximum power received at the ComProbe antenna jacks. Then select an appropriate
attenuator value to limit the input power to -20 dBm (10 μW) maximum.
A.3.4 Test Process
After connecting DUT1, DUT2, and the ComProbe Sodera or ComProbe BPA 600, follow these steps to capture
Bluetooth data.
1. Pair DUT 1 and DUT 2.
2. Establish data transmission between DUT 1 and DUT 2.
3. Begin capture of the data with the ComProbe Sodera or ComProbe BPA 600. (Refer to the ComProbe User
Manuals at fte.com.)
4. Conduct protocol analysis with the ComProbe software on the personal computer or save the capture file
for future analysis.
For any questions concerning conductive testing, contact Frontline technical support at 434-984-4500 or email
[email protected].
Author: John Trinkle with Sean Clinchy
Publish Date:22 June 2015
- 322 -
Appendicies
ComProbe BPA 600 User Manual
- 323 -
A.4 Decrypting Encrypted Bluetooth®data with ComProbe BPA 600
A.4.1 How Encryption Works in Bluetooth
Bluetooth devices on an encrypted link share a common “link key” used to exchange encrypted data. How that
link key is created depends on the paring method. Paring methods have evolved and changed throughout
Bluetooth history. The earlier legacy method was used up through Bluetooth 2.0. Improved and simpler pairing
methods began with Bluetooth 2.1 and remain in the current version Bluetooth 4.0.
For a Bluetooth sniffer to be able to decrypt the encrypted data, it must also have this shared link key. For obvious
security reasons, the link key is never sent over the air, so either the user must get the key out of one of the
devices being sniffed and supply the key to the sniffer or the sniffer must create the key itself.
A.4.2 Legacy Pairing (Bluetooth 2.0 and earlier)
In legacy pairing, this link key is derived from a shared PIN code, the master’s Bluetooth clock, the master’s BD_
ADDR and a random number that is passed between the two devices. If the sniffer has all of this same data, it can
create the link key in the same way that the devices do. The sequence of events used to create this key, or pairing
process, is shown in the ComProbe software Frame Display below.
- 324 -
ComProbe BPA 600 User Manual
Appendicies
Figure 14 - Frame Display
Frame 247 is the LMP_in_rand which is where a random number generated by the master is passed to the slave.
The slave acknowledges that it has accepted the number in frame 249. The initialization key has been passed to
the slave and is now shared by both devices. Both devices now independently generate combination keys.
In frames 250 and 251, the combination keys are passed between master and slave. In frame 252, the master
sends its LMP_au_rand. This is the random number that has been encrypted using the link key that master has
calculated. The slave then responds with frame 253, an LMP_sres confirming that it was able to compute the
same number. That process is repeated in the other direction (slave to master) in frames 254 and 255. This
completes the authentication between devices, and the setup_complete message is sent and the slave requests
encryption mode in frame 257, and the master accepts in frame 258. The actual encryption starts after the start
encryption request in frame 261.
In order for the ComProbe software to decrypt an encrypted Bluetooth conversation, the ComProbe software
must compute the same link key being used by the devices being sniffed. Since this link key is never sent over the
air, the ComProbe software must have all of the same information the devices being sniffed have so that it can
calculate the same link key that each of the two devices does. To decrypt successfully, the ComProbe software
must know the PIN code and capture:
l
The LMP_in_rand
l
Both LMP_comb_keys
l
Both LMP_au_rand/LMP_sres pairs.
If any of these are missed, the ComProbe software will not be able to decrypt. If you capture encrypted data and
find that everything captured after the LMP_start_encryption_request is in error, look back at the LMP frames
previous to that and you’ll probably find one or more of these missing. The Start Encryption Request with also be
marked by the ComProbe software with an error that indicates that the link key calculated by the ComProbe
software is different from the one used by your devices.
- 325 -
Appendicies
ComProbe BPA 600 User Manual
A.4.3 Secure Simple Pairing (SSP) (Bluetooth 2.1 and later)
To capture and decrypt data between two
Bluetooth devices using Secure Simple Pairing
we have two choices. If one of your devices
can be put into Secure Simple Pairing Debug
Mode, all that needs to be done in I/O
Settings is to choose your devices. It doesn’t
matter what’s been selected in the Pairing
Method drop down, the ComProbe software
will see the debug messages being sent and
calculate the correct key. Only one of the
devices needs to be in debug mode and it
doesn’t matter which one.
If neither of your devices can be put into
debug mode, you’ll need to know the link key
being used by one of your devices, generally
by accessing the HCI on one of the devices. If
that is the case, enter the link key into the
box provided.
Note that the link key is sometimes stored in
your device in reverse order. The ComProbe
software will automatically reverse the link
key, if needed.
Once the link key has been entered, decryption operates the same way it does in legacy pairing.
A.4.4 How to Capture and Decrypt Data (Legacy Pairing)
Run the ComProbe software and select Bluetooth Classic/low energy (BPA 600). This will open the Control
window and the BPA 600 Datasource where ComProbe device parameters are set for sniffing including the
devices to be sniffed and how the link key is to be encrypted.
Select the Devices Under Test tab. Make both your Bluetooth devices discoverable.
- 326 -
ComProbe BPA 600 User Manual
Appendicies
Click the Discover Devices
on the
datasource toolbar. The ComProbe
software will find any discoverable
Bluetooth devices within its range. You will
then be able to select your devices from
the drop down lists. If one or both of your
devices cannot be made discoverable, you
may type in the BD_ADDR(s) directly.
With legacy pairing, select PIN Code
(ASCII) from the Classic Encryption
drop down and fill in the PIN. As
mentioned above, the ComProbe software
needs the PIN code in order to calculate
the link key the two Bluetooth devices are
using. Alternately, you may enter the Link
Key manually if it is known. The ComProbe
software also keeps a database of the link
keys it previously calculated, which may
be accessed on theDevice Database tab.
The Start Sniffing button
should
now be available. If Start Sniffing is grayed
out, there is something set up incorrectly
in the datasource Device Under Test
tab. For example, if you selected PIN code in the encryption drop down but you neglected to fill in the PIN code,
then Start Sniffing will be grayed out.
Click on the toolbar Start Sniffing button. The Control window will display a capture status message. When you
start sniffing, the colored arrow be red indicating that the Bluetooth devices are initializing. . After a few seconds
the arrow will turn green
and the status will change to “Waiting for the master to connect to the slave”. At
this point the BPA 600 is synchronized and waiting for a baseband connection.
When your connection is established, the arrow will turn blue
, signifying that a baseband link has been
established and data should start to appear in the Frame Display. The direction of the arrow indicates which
device is master and which is slave. The arrow points from master to slave.
If ComProbe software successfully calculates the correct link key, the Link Key icon
on the datasource is
updated with a check mark to indicate that the link key has been verified. Should the link key be incorrect the link
key icon will show
.
An incorrect link key will show up in the Frame Display. Open the Frame Display LMP tab and search for
frames with errors appearing in red. In the Decode pane a link key error will appear in red under Errors.
- 327 -
Appendicies
ComProbe BPA 600 User Manual
A.4.5 How to tell if a device is in Secure Simple Pairing Debug Mode
When a device is configured in SSP debug mode, the ComProbe software will decode and display the debug key
in the Encapsulated Payload message of the Frame Display Summary pane. There will be an Encapsulated
Payload message sent from both the master and the slave. The message from the device that is in debug mode
will show the debug key, the other will show the public key. Refer to the Frame Display Decode pane in the
screenshots below where the master is in SSP debug mode. Remember, only one of the Bluetooth devices needs
to be in SSP debug mode.
Figure 15 - Encapsulated Payload Message from a Bluetooth Device in SSP Debug Mode
- 328 -
ComProbe BPA 600 User Manual
Appendicies
Figure 16 - Encapsulated Payload Message from a Bluetooth Device NOT in SSP Debug Mode
- 329 -
Appendicies
ComProbe BPA 600 User Manual
Author: Sean Clinchy
Publish Date: February 2014
- 330 -
ComProbe BPA 600 User Manual
Appendicies
- 331 -
A.5 Decrypting Encrypted Bluetooth® low energy
A.5.1 How Encryption Works in Bluetooth low energy
Data encryption is used to prevent passive and active—man-in-the-middle (MITM) — eavesdropping attacks on a
Bluetooth low energy link. Encryption is the means to make the data unintelligible to all but the Bluetooth master
and slave devices forming a link. Eavesdropping attacks are directed on the over-the-air transmissions between
the Bluetooth low energy devices, so data encryption is accomplished prior to transmission using a shared, secret
key.
A.5.2 Pairing
A Bluetooth low energy device that wants to share secure data with another device must first pair with that
device. The Security Manager Protocol (SMP) carries out the pairing in three phases.
1. The two connected Bluetooth low energy devices announce their input and output capabilities and from
that information determine a suitable method for phase 2.
2. The purpose of this phase is to generate the Short Term Key (STK) used in the third phase to secure key
distribution. The devices agree on a Temporary Key (TK) that along with some random numbers creates
the STK.
3. In this phase each device may distribute to the other device up to three keys:
a. the Long Term Key (LTK) used for Link Layer encryption and authentication,
b. the Connection Signature Resolving Key (CSRK) used for data signing at the ATT layer, and
c. the Identity Resolving Key (IRK) used to generate a private address.
Of primary interest in this paper is the LTK. CSRK and IRK are covered briefly at the end.
Bluetooth low energy uses the same pairing process as Classic Bluetooth: Secure Simple Pairing (SSP). During SSP
initially each device determines its capability for input and output (IO). The input can be None, Yes/No, or
Keyboard with Keyboard having the ability to input a number. The output can be either None or Display with
Display having the ability to display a 6-digit number. For each device in a paring link the IO capability determines
their ability to create encryption shared secret keys.
- 332 -
ComProbe BPA 600 User Manual
Appendicies
The Pairing Request message is transmitted from the initiator containing the IO capabilities, authentication data
availability, authentication requirements, key size requirements, and other data. A Pairing Response message is
transmitted from the responder and contains much of the same information as the initiators Pairing Request
message thus confirming that a pairing is successfully negotiated.
In the sample SMP decode, in the figure at the right, note
the “keys” identified. Creating a shared, secret key is an
evolutionary process that involves several intermediary
keys. The resulting keys include,
1. IRK: 128-bit key used to generate and resolve
random address.
2. CSRK: 128-bit key used to sign data and verify
signatures on the receiving device.
3. LTK: 128-bit key used to generate the session key for
an encrypted connection.
4. Encrypted Diversifier (EDIV): 16-bit stored value
used to identify the LTK. A new EDIV is generated
each time a new LTK is distributed.
Figure 17 - Sample Initiator Pairing Request
Decode (ComProbe Frame Display, BPA 600
low energy capture)
5. Random Number (RAND): 64-bit stored value used
to identify the LTK. A new RAND is generated each
time a unique LTK is distributed.
Of particular importance to decrypting the encrypted data on a Bluetooth low energy link is LTK, EDIV, and RAND.
A.5.3 Pairing Methods
The two devices in the link use the IO capabilities from Pairing Request and Pairing Response packet data to
determine which of two pairing methods to use for generation of the Temporary Key (TK). The two methods are
Just Works and Passkey Entry1. An example of when Just Works method is appropriate is when the IO capability
input = None and output = None. An example of when Passkey Entry would be appropriate would be if input=
Keyboard and output = Display. There are 25 combinations that result in 13 Just Works methods and 12 Passkey
Entry methods.
In Just Works the TK = 0. In the Passkey Entry method,
6 numeric digits, Input = Keyboard
TK =
6 random digits, Input = Display
Figure 18 - Initiator Pairing Confirm Example (ComProbe Frame Display, BPA 600 low energy capture)
1A third method, Out Of Band (OOB), performs the same as Pass Key, but through another external link such as
NFC.
- 333 -
Appendicies
ComProbe BPA 600 User Manual
.
Figure 19 - Responder Pairing Confirm Example (ComProbe Frame Display, BPA 600 low energy capture)
The initiating device will generate a 128-bit random number that is
combined with TK, the Pairing Request command, the Pairing
Response command, the initiating device address and address type,
and the responding device address and address type. The resulting
value is a random number Mconfirm that is sent to the responding
device by the Pairing Confirm command. The responding device will
validate the responding device data in the Pairing Confirm command
and if it is correct will generate a Sconfirm value using the same
methods as used to generate Mconfirm only with different 128-bit
random number and TK. The responding device will send a Pairing
Confirm command to the initiator and if accepted the authentication
process is complete. The random number in the Mconfirm and
Sconfirm data is Mrand and Srand respectively. Mrand and Srand
have a key role in setting encrypting the link.
Figure 20 - Message Sequence Chart:
SMP Pairing
Finally the master and slave devices exchange Mrand and Srand so
that the slave can calculate and verify Mconfirm and the master can
likewise calculate and verify Sconfirm.
A.5.4 Encrypting the Link
The Short Term Key (STK) is used for encrypting the link the first time the two devices pair. STK remains in each
device on the link and is not transmitted between devices. STK is formed by combining Mrand and Srand which
were formed using device information and TKs exchanged with Pairing Confirmation (Pairing Confirm).
A.5.5 Encryption Key Generation and Distribution
To distribute the LTK, EDIV, and Rand values an
encrypted session needs to be set up. The
initiator will use STK to enable encryption on the
link. Once an encrypted link is set up, the LTK is
distributed. LTK is a 128-bit random number that
the slave device will generate along with EDIV
and Rand. Both the master and slave devices can
distribute these numbers, but Bluetooth low
energy is designed to conserve energy, so the
Figure 21 - Encryption Request from Master, Example
slave device is often resource constrained and
(ComProbe Frame Display, BPA 600 low energy capture
does not have the database storage resources for
holding LTKs. Therefore the slave will distribute
LTK, EDIV, and Rand to the master device for storage. When a slave begins a new encrypted session with a
previously linked master device, it will request distribution of EDIV and Rand and will regenerate LTK.
- 334 -
ComProbe BPA 600 User Manual
Appendicies
Figure 22 - Encryption Response from Slave, Example
(ComProbe Frame Display, BPA 600 low energy capture)
A.5.6 Encrypting The Data Transmission
Data encryption begins with encrypting the link. The Session Key (SK) is created using a session key diversifier
(SKD). The first step in creating a SK is for the master device to send Link Layer encryption request message (LL_
ENC_REQ) that contains the SKDmaster. The SKDmaster is generated using the LTK. The slave receives SKDmaster,
generates SKDslave, and generates SK by concatenating parts of SKDmaster and SKDslave. The slave device responds
with an encryption response message (LL_ENC_RSP) that contains SKDslave; the master will create the same SK.
Now that a SK has been calculated, the master and slave devices will now begin a handshake process. The slave
will transmit unencrypted LL_START_ENC_REQ, but sets the slave to receive encrypted data using the recently
calculated SK. The master responds with encrypted LL_START_ENC_RSP that uses the same SK just calculated and
setting the master to receive encrypted data. Once the slave receives the master’s encrypted LL_START_ENC_RSP
message and responds with an encrypted LL_START_ENC_RSP message the Bluetooth low energy devices can
now begin transmitting and receiving encrypted data.
A.5.7 Decrypting Encrypted Data Using ComProbe BPA 600 low energy Capture
Note: The following discussion uses the ComProbe BPA 600 in low energy capture mode to
illustrate how to identify the encryption process and to view decrypted data. However any of the
ComProbe devices (BPA 500, BPA low energy) that are low energy capable will accomplish the
same objectives, although the datasource setup will be slightly different for each device.
- 335 -
Appendicies
ComProbe BPA 600 User Manual
A.5.7.1 Setting up the BPA 600
1. Run the ComProbe Protocol Analysis Software
and select Bluetooth Classic/low energy
(BPA 600). This will bring up the BPA 600
datasource window. This is where the
parameters are set for sniffing, including the
devices to be sniffed and how the link is to be
decrypted.
2. Select Devices Under Test tab on the
Datasource window.
3. Click/select LE Only.
4. To decrypt encrypted data transmissions
between the Bluetooth low energy devices
the ComProbe analyzer needs to know the LTK
because this is the shared secret used to
encrypt the session. There are two ways to
provide this information and which to select
will depend on the pairing method: Just
Works or Passkey Entry.
Figure 23 - ComProbe BPA 600 low energy only datasource
settings
a. Passkey Entry is easiest if you have the code that was
displayed or entered during device pairing. The code is what
is used to generate the LTK. Under LE Encryption enter
the code in the Enter New PIN/OOB data text box.
b. Just Works is more of a challenge because you must know
the LTK that is created at the time of pairing and
identification of an encrypted link.
l
l
l
If your device was previously used in an encrypted
capture session, the device information including LTK
can be found in the Device Database tab.
Figure 24 - BPA 600 datasource
Encryption Key Entry
In a design and development environment the LTK is
often known beforehand.
Capture of Host Controller Interface (HCI) events using ComProbe HSU can reveal the LTK,
which is contained in the HCI_Link_Key_Request_Reply command. HCI capture is through
direct connection to the device host controller. The information obtained in a direct connection
can later be used in a wireless encrypted capture session that requires prior knowledge of
encryption keys.
5. To start capture click on the Start Sniffing button
- 336 -
on the BPA 600 datasource toolbar.
ComProbe BPA 600 User Manual
Appendicies
A.5.7.2 Use Frame Display to View Encryption/Decryption Process
A.5.7.2.1 Security Manager Protocol
The Security Manager Protocol (SMP) controls the process for pairing and key distribution. The results of a pairing
and key distribution can be observed in the ComProbe software Frame Display. Activate the Frame Display by
clicking on the icon on the Control window toolbar. On the Frame Display low energy protocols are shown in light
green tabs. Click on the SMP protocol tab that will show only the SMP commands from the full data set.
Figure 25 - SMP Pairing Request (Frame# 35,539) from Initiator (Side 1)
On the left side of the figure above is the Frame Display Decoder pane that shows the decoded information
supplied in the selected frame in the Summary pane, Frame# 35,539. Shown is the SMP data associated with and
encrypted link (MITM Protection = Yes). The requested keys are also shown. Selecting Frame# 35,545 would
provide the response from the responder (Side 2) and would contain similar information.
Selecting Frame# 39,591 will display the Pairing Confirm from the initiator (Side 1) in the Decoder pane. The
Confirm Value shown is the Mconfirm 128-bit random number that contains TK, Pairing Request command,
Pairing Response command, initiating device address, and the responding device address. Selecting Frame#
39,600 would provide the Sconfirm random number from the responder (Side 2) with similar information from
that device but the random number would be different than Mconfirm.
Once pairing is complete and an encrypted session established, the keys are distributed by the master and slave
now identified by Side = M and Side = S respectively in the Summary pane. In Frame# 39,661 the slave has
distributed LTK to the master to allow exchange of encrypted data. Frame# 39,661 through 39,714 in the
Summary pane SMP tab are the key distribution frames.
Figure 26 - SMP Pairing Confirm (Frame# 39,591) from Initiator (Side 1)
- 337 -
Appendicies
ComProbe BPA 600 User Manual
Figure 27 - SMP Key Distribution Frames
A.5.7.2.2 Link Layer
The Link Layer (LL) protocol manages the Bluetooth low energy radio transmissions and is involved in starting link
encryption. To observe the decoded LL commands, click on the Frame Display LE LL tab, search for and select
ControlPkt “LL_ENC_REQ”. This command should originate with Side 1, the initiator of the encryption link. In
Figure 11 Frame# 39,617 is selected in the Summary pane and we see the decoded LE LL frame is display in the
Decoder pane. Shown in this frame packet is the SKDm that is the Master Session Key Diversifier (SKDmaster). In
Frame# 39,623 you will find SKDslave that is combined with SKDmaster to create the Session Key (SK). Both SDKs
were created using the LTK. Frame# 39,635 through 39,649 in the LE LL tab completes starting of the encryption
process. After the slave sends LL_START_ENC_RSP (Frame# 36,649) the Bluetooth devices can exchange
encrypted data, and the ComProbe sniffing device can also receive and decrypt the encrypted data because the
appropriate “key” is provided in the BPA 600 Datasource window.
Figure 28 - LE LL Tab Encryption Request (Frame# 39,617) from Initiator (Side 1)
A.5.7.3 Viewing Encryption in the Message Sequence Chart
The ComProbe software Message
Sequence Chart (MSC) links directly to
frames being viewed in the Frame Display.
Similarly MSC will display the same
information as the Frame Display
Decoder pane. Frames are synchronized
between the Frame Display Summary
pane and the MSC, so clicking on a frame
in either window will select that same
frame in the other window. Also the
protocol tabs are the same in each
window. To see the pairing process, click
on the SMP tab.
In the image above we see Frame# 35,539
initiating the pairing from the master
device. The response, SMP_Pairing
Response, is sent from the slave in Frame#
Figure 29 - MSC SMP Paring (BPA 600 low energy capture)
35,545. SMP_Pairing Confirm occurs
- 338 -
ComProbe BPA 600 User Manual
Appendicies
between the master and the slave devices at Frame# 39,591 and 39,600 respectively.
Clicking on the MSC LE LL tab will show the process of encrypting a session link. Clicking on Frame# 39,617
displays the LL_ENC_REQ command from the master to the slave. In the MSC below this command you will see
the data transferred that includes SKDmaster used to generate the LTK. At Frame# 39,623 the slave responds with
LL_ENC_RSP sending SKDslave to generate LTK at the master. Up to this point all transmissions are unencrypted. For
this example the slave sends the request to start encryption, LL_START_ENC_REQ, at Frame#39,635. The master
responds with LL_START_ENC_RSP at Frame# 39,639, and finally the slave responds with LL_START_ENC_RSP at
Frame# 36,649. At this point the session link is encrypted.
Figure 30 - MSC link Layer Encryption (BPA 600 low energy capture)
A.5.7.4 Viewing Decrypted Data
In the ComProbe software Frame Display click on the LE BB tab. Search in the Summary pane for Decryption
Initiated = Yes frames. In the example depicted in the following figure, Frame# 39723 is selected. In the Decoder
pane LE BB shows that the decryption was initiated and decryption was successful. In LE Data we see the
Encrypted MIC value. The MIC value is used to authenticate the sender of the data packet to ensure that the data
was sent by a peer device in the link and not by a third party attacker. The actual decrypted data appears between
the Payload Length and the MIC in the packet. This is shown in the Binary pane below the Summary pane.
- 339 -
Appendicies
ComProbe BPA 600 User Manual
Figure 31 - Decrypted Data Example (Frame# 39,723)
Author: John Trinkle
Publish Date: 9 April 2014
Revised: 23 May 2014
- 340 -
ComProbe BPA 600 User Manual
Appendicies
- 341 -
A.6 Bluetooth® low energy Security
"Paris is quiet and the good citizens are content." Upon seizing power
in 1799 Napoleon sent this message on Claude Chappe’s optical
telegraph. Chappe had invented a means of sending messages line-ofsight . The stations were placed approximately six miles apart and each
station had a signaling device made of paddles on the ends of a
rotating “regulator” arm whose positions represented code numbers.
Each station was also outfitted with two telescopes for viewing the
other stations in the link, and clocks were used to synchronize the
stations. By 1803 a communications network extended from Paris
across the countryside and into Belgium and Italy.
Chappe developed several coding schemes through the next few
years. The station operators only knew the codes, not what characters
they represented. Not only was Chappe’s telegraph system the first
working network with protocols, synchronization of serial
transmissions but it also used data encryption. Although cryptography
has been around for millenniums—dating back to 2000 B.C. — Chappe,
was the first to use it in a wide area network in the modern sense.
- 342 -
Figure 32 - Chappe's Optical
Telegraph
ComProbe BPA 600 User Manual
Appendicies
Of course anyone positioned between the telegraph stations that had
Chappe's telegraph code in hand could decode the transmission. So
securing the code was of paramount importance in Chappe's protocol.
Modern wireless networks such as Bluetooth low energy
employ security measures to prevent similar potentially man-in-themiddle attacks that may have malicious intent.
Bluetooth low energy devices connected in a link can pass sensitive data
by setting up a secure encrypted link. The process is similar to but not
identical to Bluetooth BR/EDR Secure Simple Pairing. One difference is
that in Bluetooth low energy the confidential payload includes a Message
Identification Code (MIC) that is encrypted with the data. In Bluetooth
BR/EDR only the data is encrypted. Also in Bluetooth low energy the
secure link is more vulnerable to passive eavesdropping, however
because of the short transmission periods this vulnerability is considered
a low risk. The similarity to BR/EDR occurs with "shared secret key", a
fundamental building block of modern wireless network security.
This paper describes the process of establishing a Bluetooth low energy
secure link.
Figure 33 - Chappe's Telegraph Code
A.6.1 How Encryption Works in Bluetooth low energy
Data encryption is used to prevent passive and active—man-in-the-middle (MITM) — eavesdropping attacks on a
Bluetooth low energy link. Encryption is the means to make the data unintelligible to all but the Bluetooth master
and slave devices forming a link. Eavesdropping attacks are directed on the over-the-air transmissions between
the Bluetooth low energy devices, so data encryption is accomplished prior to transmission using a shared, secret
key.
A.6.2 Pairing
A Bluetooth low energy device that wants to share secure data with another device must first pair with that
device. The Security Manager Protocol (SMP) carries out the pairing in three phases.
1. The two connected Bluetooth low energy devices announce their input and output capabilities and from
that information determine a suitable method for phase 2.
2. The purpose of this phase is to generate the Short Term Key (STK) used in the third phase to secure key
distribution. The devices agree on a Temporary Key (TK) that along with some random numbers creates
the STK.
3. In this phase each device may distribute to the other device up to three keys:
a. the Long Term Key (LTK) used for Link Layer encryption and authentication,
b. the Connection Signature Resolving Key (CSRK) used for data signing at the ATT layer, and
- 343 -
Appendicies
ComProbe BPA 600 User Manual
c. the Identity Resolving Key (IRK) used to generate a private address.
Of primary interest in this paper is the LTK. CSRK and IRK are covered briefly at the end.
Bluetooth low energy uses the same pairing process as Classic Bluetooth: Secure Simple Pairing (SSP). During SSP
initially each device determines its capability for input and output (IO). The input can be None, Yes/No, or
Keyboard with Keyboard having the ability to input a number. The output can be either None or Display with
Display having the ability to display a 6-digit number. For each device in a paring link the IO capability determines
their ability to create encryption shared secret keys.
The Pairing Request message is transmitted from the initiator containing the IO capabilities, authentication data
availability, authentication requirements, key size requirements, and other data. A Pairing Response message is
transmitted from the responder and contains much of the same information as the initiators Pairing Request
message thus confirming that a pairing is successfully negotiated.
In the sample SMP decode, in the figure at the right, note
the “keys” identified. Creating a shared, secret key is an
evolutionary process that involves several intermediary
keys. The resulting keys include,
1. IRK: 128-bit key used to generate and resolve
random address.
2. CSRK: 128-bit key used to sign data and verify
signatures on the receiving device.
3. LTK: 128-bit key used to generate the session key for
an encrypted connection.
4. Encrypted Diversifier (EDIV): 16-bit stored value
used to identify the LTK. A new EDIV is generated
each time a new LTK is distributed.
Figure 34 - Sample Initiator Pairing Request
Decode (ComProbe Frame Display, BPA 600
low energy capture)
5. Random Number (RAND): 64-bit stored value used
to identify the LTK. A new RAND is generated each
time a unique LTK is distributed.
Of particular importance to decrypting the encrypted data on a Bluetooth low energy link is LTK, EDIV, and RAND.
A.6.3 Pairing Methods
The two devices in the link use the IO capabilities from Pairing Request and Pairing Response packet data to
determine which of two pairing methods to use for generation of the Temporary Key (TK). The two methods are
Just Works and Passkey Entry1. An example of when Just Works method is appropriate is when the IO capability
input = None and output = None. An example of when Passkey Entry would be appropriate would be if input=
Keyboard and output = Display. There are 25 combinations that result in 13 Just Works methods and 12 Passkey
Entry methods.
In Just Works the TK = 0. In the Passkey Entry method,
6 numeric digits, Input = Keyboard
TK =
6 random digits, Input = Display
1A third method, Out Of Band (OOB), performs the same as Pass Key, but through another external link such as
NFC.
- 344 -
ComProbe BPA 600 User Manual
Appendicies
Figure 35 - Initiator Pairing Confirm Example (ComProbe Frame Display, BPA 600 low energy capture)
.
Figure 36 - Responder Pairing Confirm Example (ComProbe Frame Display, BPA 600 low energy capture)
The initiating device will generate a 128-bit random number that is
combined with TK, the Pairing Request command, the Pairing
Response command, the initiating device address and address type,
and the responding device address and address type. The resulting
value is a random number Mconfirm that is sent to the responding
device by the Pairing Confirm command. The responding device will
validate the responding device data in the Pairing Confirm command
and if it is correct will generate a Sconfirm value using the same
methods as used to generate Mconfirm only with different 128-bit
random number and TK. The responding device will send a Pairing
Confirm command to the initiator and if accepted the authentication
process is complete. The random number in the Mconfirm and
Sconfirm data is Mrand and Srand respectively. Mrand and Srand
have a key role in setting encrypting the link.
Figure 37 - Message Sequence Chart:
SMP Pairing
Finally the master and slave devices exchange Mrand and Srand so
that the slave can calculate and verify Mconfirm and the master can
likewise calculate and verify Sconfirm.
A.6.4 Encrypting the Link
The Short Term Key (STK) is used for encrypting the link the first time the two devices pair. STK remains in each
device on the link and is not transmitted between devices. STK is formed by combining Mrand and Srand which
were formed using device information and TKs exchanged with Pairing Confirmation (Pairing Confirm).
A.6.5 Encryption Key Generation and Distribution
Figure 38 - Encryption Request from Master, Example
(ComProbe Frame Display, BPA 600 low energy capture
- 345 -
To distribute the LTK, EDIV, and Rand values an
encrypted session needs to be set up. The
initiator will use STK to enable encryption on the
link. Once an encrypted link is set up, the LTK is
distributed. LTK is a 128-bit random number that
the slave device will generate along with EDIV
and Rand. Both the master and slave devices can
distribute these numbers, but Bluetooth low
energy is designed to conserve energy, so the
slave device is often resource constrained and
Appendicies
ComProbe BPA 600 User Manual
does not have the database storage resources for holding LTKs. Therefore the slave will distribute LTK, EDIV, and
Rand to the master device for storage. When a slave begins a new encrypted session with a previously linked
master device, it will request distribution of EDIV and Rand and will regenerate LTK.
Figure 39 - Encryption Response from Slave, Example
(ComProbe Frame Display, BPA 600 low energy capture)
A.6.6 Encrypting The Data Transmission
Data encryption begins with encrypting the link. The Session Key (SK) is created using a session key diversifier
(SKD). The first step in creating a SK is for the master device to send Link Layer encryption request message (LL_
ENC_REQ) that contains the SKDmaster. The SKDmaster is generated using the LTK. The slave receives SKDmaster,
generates SKDslave, and generates SK by concatenating parts of SKDmaster and SKDslave. The slave device responds
with an encryption response message (LL_ENC_RSP) that contains SKDslave; the master will create the same SK.
Now that a SK has been calculated, the master and slave devices will now begin a handshake process. The slave
will transmit unencrypted LL_START_ENC_REQ, but sets the slave to receive encrypted data using the recently
calculated SK. The master responds with encrypted LL_START_ENC_RSP that uses the same SK just calculated and
setting the master to receive encrypted data. Once the slave receives the master’s encrypted LL_START_ENC_RSP
message and responds with an encrypted LL_START_ENC_RSP message the Bluetooth low energy devices can
now begin transmitting and receiving encrypted data.
A.6.7 IRK and CSRK Revisited
Earlier in this paper it was stated that LTK would be the focus, however the IRK and CSRK were mentioned. We
revisit these keys because they are used in situations that require a lesser level of security. First let us note that
IRK and CSRK are passed in an encrypted link along with LTK and EDIV.
Use of the IRK and CSRK attempt to place an identity on devices operating in a piconet. The probability that two
devices will have the same IRK and generate the same random number is low, but not absolute.
IRK and Bluetooth low energy Privacy Feature
Bluetooth low energy has a feature that reduces the ability of an attacker to track a device over a long period buy
frequently and randomly changing an advertising device's address. This is the privacy feature. This feature is not
used in the discovery mode and procedures but is used in the connection mode and procedures.
If the advertising device was previously discovered and has returned to an advertising state, the device must be
identifiable by trusted devices in future connections without going through discovery procedure again. The IRK
stored in the trusted device will overcome the problem of maintaining privacy while saving discovery
computational load and connection time. The advertising devices IRK was passed to the master device during
initial bonding. The a master device will use the IRK to identify the advertiser as a trusted device.
CSRK and Signing for Authentication
Bluetooth low energy supports the ability to authenticate data sent over an unencrypted ATT bearer between two
devices in a trust relationship. If authenticated pairing has occurred and encryption is not required (security mode
2) data signing is used if CSRK has been exchanged. The sending device attaches a digital signature after the data in
- 346 -
ComProbe BPA 600 User Manual
Appendicies
the packet that includes a counter and a message authentication code (MAC). The key used to generate MAC is
CSRK. Each peer device in a piconet will have a unique CSRK.
The receiving device will authenticate the message from the trusted sending device using the CSRK exchanged
from the sending device. The counter is initialized to zero when the CSRK is generated and is incremented with
each message signed with a given CSRK. The combination of the CSRK and counter mitigates replay attacks.
A.6.8 Table of Acronyms
CSRK
Connection Signature Resolving Key
EDIV
Encrypted Diversifier
IO
Input and output
IRK
Identity Resolving Key
LTK
Long Term Key
Mconfirm
128-bit confirm value from initiator
MIC
Message Integrity Check
MITM
Man-in-the-middle
Mrand
128-bit random number used to generate Mconfirm
OOB
Out of Band
RAND
Random Number
Sconfirm
128-bit confirmation value from the responder
SK
Session key
SMP
Security Manager Protocol
Srand
128-bit random number used to generate Sconfirm
SSP
Secure Simple Pairing
STK
Short Term Key
TK
Temporary Key
Author: John Trinkle
Publish Date:21 May 2014
- 347 -
Appendicies
ComProbe BPA 600 User Manual
- 348 -
A.7 Bluetooth Virtual Sniffing
A.7.1 Introduction
The ComProbe software Virtual sniffing function simplifiesBluetooth® development and is easy to use. Frontline’s
Virtual sniffing with Live Import provides the developer with an open interface from any application to ComProbe
software so that data can be analyzed and processed independent of sniffing hardware. Virtual sniffing can also
add value to other Bluetooth development tools such as Bluetooth stack SDKs (Software Development Kits) and
Bluetooth chip development kits.
This white paper discusses:
l
l
Why HCI sniffing and Virtual sniffing are useful.
Bluetooth sniffing history.
l
What is Virtual sniffing?
l
Why Virtual sniffing is convenient and reliable.
l
How Virtual sniffing works.
l
Virtual sniffing and Bluetooth stack vendors.
l
Case studies: Virtual sniffing and Bluetooth mobile phone makers.
l
Virtual sniffing and you. • Where to go for more information.
A.7.2 Why HCI Sniffing and Virtual Sniffing are Useful
Because the Bluetooth protocol stack is very complex, a Bluetooth protocol analyzer is an important part of all
Bluetooth development environments. The typical Bluetooth protocol analyzer “taps” a Bluetooth link by capturing
data over the air. For many Bluetooth developers sniffing the link between a Bluetooth Host CPU and a Bluetooth
Host Controller—also known as HCI-sniffing—is much more useful than air sniffing.
HCI-sniffing provides direct visibility into the commands being sent to a Bluetooth chip and the responses to those
commands. With air sniffing a software engineer working on the host side of a Bluetooth chip has to infer and
often guess at what their software is doing. With HCI-sniffing, the software engineer can see exactly what is going
on. HCI-sniffing often results in faster and easier debugging than air sniffing.
- 349 -
ComProbe BPA 600 User Manual
Appendicies
ComProbe software’s Virtual sniffing feature is a simple and easy way to perform HCI-sniffing. Virtual sniffing is not
limited to just HCI-sniffing, but it is the most common use and this white paper will focus on the HCI-sniffing
application of Virtual sniffing.
It is also important to understand that ComProbe software is a multi-mode product. ComProbe software does
support traditional air sniffing. It also supports serial HCI sniffing (for the H4 (HCI UART), H5 (3-wire UART) , and
BCSP (BlueCore Serial Protocol) protocols), USB HCI (H2) sniffing, SDIO sniffing, and Virtual sniffing. So with
ComProbe software nothing is sacrificed—the product is simply more functional than other Bluetooth protocol
analyzers.
A.7.3 Bluetooth Sniffing History
Frontline has a strong appreciation for the importance of HCI sniffing because of the way we got involved with
Bluetooth. Because of our company history, we are uniquely qualified to offer a multi-mode analyzer that provides
many ways to sniff and supports a wide variety of protocols. This brief Bluetooth sniffing history should help you
understand our approach to Bluetooth protocol analysis.
In the early days of Bluetooth, there were no commercially available Bluetooth protocol analyzers, so developers
built their own debug tools and/or used protocol analyzers that weren’t built for Bluetooth. Many developers built
homegrown HCI analyzers—basically hex dumps and crude traces—because they recognized the need for
visibility into the HCI interface and because it was too difficult to build air sniffers. Several companies developed
air sniffers because they saw a market need and because they realized that they could charge a high price (USD
$25,000 and higher).
Two Bluetooth chip companies, Silicon Wave and Broadcom were using Frontline’s Serialtest® serial analyzer to
capture serial HCI traffic and then they would manually decode the HCI byte stream. This manual decoding was far
too much work and so, independently, Silicon Wave and Broadcom each requested that Frontline produce a serial
HCI Bluetooth analyzer that would have all the features of Serialtest. In response to these requests Frontline
developed SerialBlue®—the world’s first commercially available serial HCI analyzer.
The response to SerialBlue was very positive. When we asked our Bluetooth customers what they wanted next we
quickly learned that there was a need for an affordable air sniffer that provided the same quality as SerialBlue. We
also learned that the ultimate Bluetooth analyzer would be one that sniff air and sniff HCI simultaneously.
As work was progressing on our combination air sniffer and HCI sniffer the functional requirements for Bluetooth
analyzers were changing. It was no longer good enough just to decode the core Bluetooth protocols (LMP, HCI,
L2CAP, RFCOMM, and OBEX). Applications were beginning to be built on top of Bluetooth and therefore
application level protocol decoding was becoming a requirement. For example, people were starting to browse
the Internet using Bluetooth-enabled phones and PDAs therefore a good Bluetooth analyzer would need to
support TCP/IP, HTTP, hands-free, A2DP, etc.
For Frontline to support for these higher levels protocols was no problem since they were already in use in other
Frontline analyzer products. People have been using Frontline Serialtest serial analyzers and Ethertest™ Ethernet
analyzer to troubleshoot TCP/IP and Internet problems for many years.
As we continued to work closely with the Bluetooth community we also came across one other requirement:
sniffing itself had to be made easier. We took a two-pronged approach to this problem. We simplified air sniffing
(and we continue to work on simplifying the process of air sniffing) and we invented Virtual sniffing.
A.7.4 Virtual Sniffing—What is it?
Historically, protocol analyzers have physically tapped the circuit being sniffed. For example, an Ethernet circuit is
tapped by plugging into the network. A serial connection is sniffed by passively bridging the serial link. A Bluetooth
air sniffer taps the piconet by synchronizing its clock to the clock of the piconet Master.
- 350 -
Appendicies
ComProbe BPA 600 User Manual
Not only is there a physical tap in traditional sniffing, but the sniffer must have some knowledge of the physical
characteristics of the link being sniffed. For example, a Bluetooth air sniffer must know the BD_ADDR of at least
one piconet member to allow it perform clock synchronization. A serial sniffer must know the bit rate of the
tapped circuit or be physically connected to the clock line of the circuit.
With Virtual sniffing the protocol analyzer itself does not actually tap the link and the protocol analyzer does not
require any knowledge of the physical characteristics of the link.
In computer jargon, “virtual” means “not real”. Virtual memory is memory that doesn’t actually exist. Virtual
reality is something that looks and feels real, but isn’t real. So we use the term Virtual sniffing, because there is
sniffing taking place, but not in the traditional physical sense.
A.7.5 The Convenience and Reliability of Virtual Sniffing
Virtual sniffing is the most convenient and reliable form of sniffing and should be used in preference to all other
forms of sniffing whenever practical. Virtual sniffing is convenient because it requires no setup to use except for a
very small amount of software engineering (typically between one and four hours) that is done once and then
never again. Once support for Virtual sniffing has been built into application or into a development environment
none of the traditional sniffing setup work need be done.
This means:
l
NO piconet synchronization.
l
NO serial connection to tap.
l
NO USB connection to tap.
Virtual sniffing is reliable because there is nothing that can fail. With Virtual sniffing all data is always captured.
A.7.6 How Virtual Sniffing Works
ComProbe software Virtual sniffing works using a feature called Live Import. Any application can feed data into
ComProbe software using Live Import. A simple API provides four basic functions and a few other more advanced
functions. The four basic Live Import functions are:
l
Open a connection to ComProbe software.
l
Close a connection to ComProbe software.
l
Send an entire packet to ComProbe software.
l
Send a single byte to ComProbe software.
All applications that send data to ComProbe software via Live Import use the first two functions. Usually only one
of the two Send functions is used by a particular application. When ComProbe software receives data from the
application via Live Import, the data is treated just as if it had been captured on a Frontline ComProbe sniffer. The
entire protocol stack is fully decoded.
With Virtual sniffing the data can literally be coming from anywhere. ComProbe software does not care if the data
being analyzed is being captured on the machine where ComProbe software is running or if the data is being
captured remotely and passed into ComProbe software over an Internet connection.
A.7.7 Virtual Sniffing and Bluetooth Stack Vendors
As the complexity of the Bluetooth protocol stack increases Bluetooth stack vendors are realizing that their
customers require the use of a powerful Bluetooth protocol analyzer. Even if the stack vendor’s stack is bug free,
- 351 -
ComProbe BPA 600 User Manual
Appendicies
there are interoperability issues that must be dealt with.
The homegrown hex dumps and trace tools from the early days of Bluetooth just are not good enough anymore.
And building a good protocol analyzer is not easy. So stack vendors are partnering with Frontline. This permits the
stack vendors to concentrate of improving their stack.
The typical Bluetooth stack vendor provides a Windows-based SDK. The stack vendor interfaces their SDK to
ComProbe software by adding a very small amount of code to the SDK, somewhere in the transport area, right
about in the same place that HCI data is sent to the Host Controller.
If ComProbe software is installed on the PC and the Virtual sniffer is running then the data will be captured and
decoded by ComProbe software, in real-time. If ComProbe software is not installed or the Virtual sniffer is not
running then no harm is done. Virtual sniffing is totally passive and has no impact on the behavior of the SDK.
One Frontline stack vendor partner feels so strongly about ComProbe software that not only have they built
Virtual sniffing support in their SDK, but they have made ComProbe software an integral part of their product
offering. They are actively encouraging all customers on a worldwide basis to adopt ComProbe software as their
protocol analysis solution.
A.7.8 Case Studies: Virtual Sniffing and Bluetooth Mobile Phone Makers
Case Study # 1
A Bluetooth mobile phone maker had been using a homemade HCI trace tool to debug the link between the Host
CPU in the phone the Bluetooth chip. They also were using an air sniffer. They replaced their entire sniffing setup
by moving to ComProbe software.
In the original test setup the Host CPU in the phone would send debug messages and HCI data over a serial link. A
program running on a PC logged the output from the Host CPU. To implement the new system using Virtual
sniffing, a small change was made to the PC logging program and it now sends the data to ComProbe software
using the Live Import API. The HCI traffic is fully decoded and the debug messages are decoded as well.
The decoder for the debug messages was written using ComProbe software’s DecoderScript feature.
DecoderScript allows ComProbe software user to write custom decodes and to modify decodes supplied with
ComProbe software. DecoderScript is supplied as a standard part of ComProbe software. In this case, the
customer also created a custom decoder for HCI Vendor Extensions.
The air sniffer that was formerly used has been replaced by the standard ComProbe software air sniffer.
Case Study # 2
A second Bluetooth mobile phone maker plans to use Virtual sniffing in conjunction with a Linux-based custom
test platform they have developed. Currently they capture serial HCI traffic on their Linux system and use a set of
homegrown utilities to decode the captured data.
They plan to send the captured serial HCI traffic out of the Linux system using TCP/IP over Ethernet. Over on the
PC running ComProbe software they will use a simple TCP/IP listening program to bring the data into the PC and
this program will hand the data off to ComProbe software using the Live Import API.
A.7.9 Virtual Sniffing and You
If you are a Bluetooth stack vendor, a Bluetooth chip maker, or a maker of any other products where integrating
your product with ComProbe software’s Virtual sniffing is of interest please contact Frontline to discuss your
requirements. There are numerous approaches that we can use to structure a partnership program with you. We
believe that a partnership with Frontline is an easy and cost-effective way for you to add value to your product
offering.
- 352 -
Appendicies
ComProbe BPA 600 User Manual
If you are end customer and you want to take advantage of Virtual sniffing, all you need to do is buy any Frontline
Bluetooth product. Virtually sniffing comes standard with product.
- 353 -
ComProbe BPA 600 User Manual
Appendicies
Author: Eric Kaplan
Publish Date: May 2003
Revised: December 2013
- 354 -
Appendicies
ComProbe BPA 600 User Manual
Index
operating mode
referenced 214, 219
A
test file 215
A2DP Decoder Parameters 49
Wave Panel 234
Aborted Frame 286
viewer 237
About Display Filters 108
Auto-Sizing Column Widths 102
About L2CAP Decoder Parameters 54
Automatically Request Missing Decoding
Information 77
Absolute Time 292
Adaptive Frequency Hopping
Automatically Restart 283
PER Stats 204
Add a New or Save an Existing Template 48
Automatically Restart Capturing After 'Clear
Capture Buffer' 283
Adding a New Predefined Stack 75
Automatically Save Imported Capture Files 283
Adding Comments To A Capture File 273
Autotraversal 75, 77
Advanced System Options 285
AVDTP 49, 51-52
Apply Capture Filters 110
AVDTP Override Decode Information 52
Apply Display Filters 108-110, 112-113
Average Throughput Indicators
Average Throughput - Selected 134
ASCII 84
Average_Throughput_Indicators 133
character set 297
B
viewing data in 84
ASCII Codes 297
Baudot 84, 282
ASCII Pane 105
Baudot Codes 297
Audio Expert System 211
Begin Sync Character Strip 86
bitrate 233, 239
Binary 83, 255
calibratioin 219
Binary Pane 105
event type
BL 299
Bluetooth Timeline 123
Audio 225
Audio Expert System 247
Clipping 229
Dropout 230
Bookmarks 267-268
Glitch 230
Boolean 110, 115
Bluetooth 222
BPA 600 9-10, 21, 24-25, 28, 30, 34, 37-38
Codec 223
Broken Frame 85
BS 299
frame synchronization 246
- 355 -
ComProbe BPA 600 User Manual
Appendicies
BT Snoop File Format 294
Character 255, 298
BT Timeline Legend 138
Character Pane 105
Btsnoop 294
Character Set 84, 297-298
Buffer 272, 283
Choosing a Data Capture Method 8
Buffer Overflow 283
Clear Capture Buffer 283
Buffer/File Options 283
CN 299
Byte 81, 83, 106, 297
Coexistence View 157
Searching 258
Audio Expert System 246
byte export 98
le Devices Radio Buttons 178
C
Legend 179
Calculating Data Rates and Delta Times 81
Set Button 177
Capture Buffer 272, 283, 285
Throughput Graph 169
Capture Buffer Size 283
Discontinuities 170
Capture File 66, 272-275, 283, 285
Dots 173
auto-save imported files 283
Swap Button 172
capture to a series of files 283
Viewport 171
capture to one file 283
Zoom Cursor 176
changing default location of 287
Zoomed 174
changing max size of 283, 285
Freeze Y 175
framing captured data 76
Unfreeze Y 175
importing 275
Y Scales Frozen 175
loading 274
Throughput Indicators 166
reframing 76
Throughput Radio Buttons 178
removing framing markers 76
Timeline Radio Buttons 178
saving 272-273
Timelines 179
starting capture to file 66
discontinuities 187
Capturing 66
high-speed 188
Data to Disk 66
packet 179
CFA file 273-274
two timelines 184
Changing Default File Locations 287
Toolbar 164
- 356 -
Appendicies
ComProbe BPA 600 User Manual
Tooltip 170
Data Rates 81
relocate 170, 182
Debug Mode 30, 37
Color of Data Bytes 106
Decimal 83
Colors 107
Decode Pane 104
Comma Separated File 279
decoder 300
Compound Display Filters 110
Decoder Parameters 46
Confirm CFA Changes 274
DecoderScript 300
Context For Decoding 77
Decodes 45, 74, 78, 87, 94, 104, 252
Control Characters 298
Default File Locations 287
Control Signals 85, 289
Delete a Template 48
Control Window 19, 283
Deleting Display Filters 113
Configuration Information 13
Delta Times 81
Conversation Filters 112
Device Database 38
CPAS Control Window Toolbar 12
Directed Classic Connection 43
CR 299
Direction 112
CRC 81
Directories 287
CSV Files 279
Disabling 283
Custom Protocol Stack 74-75
Discontinuities 137
Custom Stack 74-75
Display Filters 108, 113-114, 116
Customizing Fields in the Summary Pane 102
Display Options 293
D
DL 299
D/1 299
Dots 103
D/2 298
Driver 300
D/3 298
Duplicate View 79, 81, 97
D/4 298
DUT 28, 30, 34, 37
D/E 299
E
Data 81, 271-272
E/B 299
Capturing 66
E/C 299
Data Byte Color Denotation 106
Easy Protocol Filtering 122
Data Errors 263
EBCDIC 84
Data Extraction 247
EBCDIC Codes 298
- 357 -
ComProbe BPA 600 User Manual
Appendicies
EIR 73
File Types Supported 274
EM 298
Filtering 121
EQ 299
Filters 108-110, 112-116, 122
Errors 263, 289
Find 252, 255-256, 258-259, 263
ET 298
Find - Bookmarks 265
Event Display 78, 97, 279
Find Introduction 251
Event Display Export 279
Font Size 86
Event Display Toolbar 79
Frame Display 87, 90, 93-94, 96-97, 102-107
Event Numbering 297
Audio Expert System 246
Event Pane 106
Frame Display - Change Text Highlight
Color 106
Event Symbols 85
Frame Display - Find 94
EX 298
Frame Display Status Bar 93
Exclude 110
Frame Display Toolbar 90
Exclude Radio Buttons 110
Frame Display Window 88
Expand All/Collapse All 104
Frame Recognizer Change 85
Expand Decode Pane 97
Frame Symbols 103
Expert System 211
Frame Information on the Control Window 14
event 241
Freeze 82
Export
FS 299
Export Baudot 282
FTS Serial Driver 300
Export Events 280
G
Export Filter Out 282
Go To 258
Export Payload Throughput Over Time 136
Green Dots in Summary Pane 103
Extended Inquiry Response 73
GS 298
F
H
F/F 298
Hex 83
FCSs 81
Hexadecimal 105
Field Width 102
Hiding Display Filters 113
File 271-274, 283
Hiding Protocol Layers 94
File Locations 287
High Resolution Timestamping 292
File Series 283
HT 299
- 358 -
Appendicies
ComProbe BPA 600 User Manual
I
Smart Mesh 59
I/O Settings Change 85
Message Sequence Chart 191
Icons in Data on Event Display 85
Message Sequence Chart - Find and Go To 196
Importable File Types 275
Message Sequence Chart - Go To 197
Importing Capture Files 274
Minimizing 19
INCLUDE 110
Missing Bluetooth Clock 138
Include/Exclude 110
Missing Decode Information 51, 57
Information Screen 41
Mixed Channel/Sides 84
L
Mixed Sides Mode 84
L2CAP 54
Modem Lead Names 289
L2CAP Override Decode Information 55
Modify Display Filters 114-115
Layer Colors 107
Multiple Event Displays 81
LF 299
Multiple Frame Displays 97
Link Key 30
N
LSB 30, 36, 69
NK 299
Live Update 82
Node Filters 112
Logical Byte Display 94
Nonprintables 282
Logical Bytes 94
Notes 273
Long Break 86
NU 298
Low Energy Timeline
Number Set 83
Button Bar/Legend 140
Numbers 297
Discontinuities 152
O
Legend 145
Object Throughput Stats File 136
Navigating and Selecting Data 153
Octal 83
Zooming 154
One_Second_Throughput_Indicators 134
low energy Timeline Introduction 139-140
Open 81
Low Power 86
Open Capture File 274
M
Options 283, 285-286, 290
Main Window 11
Other Term
Mesh 59
Subterm 18
CSRmesh 59
Override Decode Information 52, 55, 58
- 359 -
ComProbe BPA 600 User Manual
Appendicies
Overriding Frame Information 77
Remove
Overrun Errors 264
Bookmarks 267-268
P
Columns 103
Packet Error Rate (PER Stats) 200
Custom Stack 74
Packet Error Rate 200
Filters 113
PER Stats Scroll Bar 208
Framing Markers 76
Packet Timeline 128, 137
Reset Panes 97
Packet Timeline Menu Bar 129
Resolution 291
Packet_Depiction 123
Resumed 85
Packet_Navigation_and_Selection 127
Revealing Protocol Layers 94
Packet_Timeline_Introduction 123
RFCOMM 56-58
Packet_Timeline_Visual_Elements 131
RFCOMM Missing Decode Information 57
Panes 97
RFCOMM Override Decode Information 58
Pattern 254
roleless 22, 68
Pause 66
RS 298
Performance Notes 293
RSSI 123
Printing 278
S
Printing from the Frame Display 275
Save 109, 271-273
ProbeSync 7, 10, 69
Save As 271
Progress Bars 297
Saving 272-273
Protocol
Display Filter 109
Protocol Layer Colors 107
Imported Capture Files 283
Protocol Layer Filtering 121
Saving the Capture File using File > Save or the
Save icon 271
Protocol Stack 74-75, 77
Search 252, 254, 256, 258-259, 263, 266-268
Q
binary value 254
Quick Filtering 121
bookmarks 268
R
character string 254
Radix 83, 105
errors 263
Reframe 76
event number 259
Reframing 76
frame number 258
Relative Time 256, 292
hex pattern 254
- 360 -
Appendicies
ComProbe BPA 600 User Manual
pattern 254
Timestamping 267, 290, 292
special event 259
Timestamping Disabled 86
timestamp 256
Timestamping Enabled 86
wildcards 254
Timestamping Options 283, 290
Secure Simple Pairing 30, 36-37
Timestamping Resolution 291
Seed Value 81
Timestamps 290, 292
Serial Driver 300
Transferring Packets 66
Short Break 86
Truncated Frame 86
Side Names 289
U
Sides 289
Underrun Error 86
Signal Strength 123
Unframe 76
Sorting Frames 94
Unframe Function 76
Special Events 259
Unframing 76
Start 85
Unknown Event 86
Start Up Options 286
V
Summary 100
vendor specific decoder 300
Summary Pane 100, 102-103
Viewing Data Events 82
Sync Dropped 86
W
Sync Found 86
Wrap Buffer/File 283
Sync Hunt Entered 86
Z
Sync Lost 86
Zooming 186
Synchronization 96
Zooming 133
System Settings 283, 285
zooming cursor 176
T
Technical Support 302
Test Device Began Responding 86
Test Device Stopped Responding 86
Throughput Displays
Throughput_Displays 133
Throughput Graph 135
Timestamp 267, 291-292
- 361 -