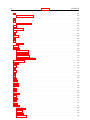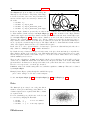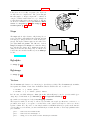
1
gnuplot 4.7
An Interactive Plotting Program
Thomas Williams & Colin Kelley
Version 4.7 organized by: Hans-Bernhard Bröker, Ethan A Merritt, and others
Major contributors (alphabetic order):
Hans-Bernhard Bröker, John Campbell,
Robert Cunningham, David Denholm,
Gershon Elber, Roger Fearick,
Carsten Grammes, Lucas Hart,
Lars Hecking, Péter Juhász,
Thomas Koenig, David Kotz,
Ed Kubaitis, Russell Lang,
Timothée Lecomte, Alexander Lehmann,
Alexander Mai, Bastian Märkisch,
Ethan A Merritt, Petr Mikulı́k,
Carsten Steger, Shigeharu Takeno,
Tom Tkacik, Jos Van der Woude,
James R. Van Zandt, Alex Woo, Johannes Zellner
c 1986 - 1993, 1998, 2004 Thomas Williams, Colin Kelley
Copyright c 2004 - 2011 various authors
Copyright Mailing list for comments: [email protected]
Mailing list for bug reports: [email protected]
Web access (preferred): http://sourceforge.net/projects/gnuplot
This manual was originally prepared by Dick Crawford.
2012 Version 4.7 (cvs)
2
gnuplot 4.7
CONTENTS
Contents
I
Gnuplot
16
Copyright
16
Introduction
16
Seeking-assistance
17
New features
18
New syntax . . . . . . . . . . . . . . . . . . . . . . . . . . . . . . . . . . . . . . . . . . . . . . . . .
18
Local customization of linetypes . . . . . . . . . . . . . . . . . . . . . . . . . . . . . . . . . . . . .
19
New plot styles . . . . . . . . . . . . . . . . . . . . . . . . . . . . . . . . . . . . . . . . . . . . . . .
19
Revised polar axes . . . . . . . . . . . . . . . . . . . . . . . . . . . . . . . . . . . . . . . . . . . . .
19
New smoothing algorithms
. . . . . . . . . . . . . . . . . . . . . . . . . . . . . . . . . . . . . . . .
19
New time/date handling . . . . . . . . . . . . . . . . . . . . . . . . . . . . . . . . . . . . . . . . . .
19
Statistical summary of data . . . . . . . . . . . . . . . . . . . . . . . . . . . . . . . . . . . . . . . .
19
New or revised terminal drivers . . . . . . . . . . . . . . . . . . . . . . . . . . . . . . . . . . . . . .
19
Backwards compatibility
New smoothing algorithms
20
. . . . . . . . . . . . . . . . . . . . . . . . . . . . . . . . . . . . . . . .
20
New time/date handling . . . . . . . . . . . . . . . . . . . . . . . . . . . . . . . . . . . . . . . . . .
20
Statistical summary of data . . . . . . . . . . . . . . . . . . . . . . . . . . . . . . . . . . . . . . . .
20
Batch/Interactive Operation
21
Canvas size
21
Command-line-editing
22
Comments
22
Coordinates
22
Datastrings
23
Enhanced text mode
24
Environment
25
Expressions
25
Functions . . . . . . . . . . . . . . . . . . . . . . . . . . . . . . . . . . . . . . . . . . . . . . . . . .
26
Elliptic integrals . . . . . . . . . . . . . . . . . . . . . . . . . . . . . . . . . . . . . . . . . . .
28
Random number generator . . . . . . . . . . . . . . . . . . . . . . . . . . . . . . . . . . . . .
28
Value . . . . . . . . . . . . . . . . . . . . . . . . . . . . . . . . . . . . . . . . . . . . . . . . .
28
Operators . . . . . . . . . . . . . . . . . . . . . . . . . . . . . . . . . . . . . . . . . . . . . . . . . .
28
CONTENTS
gnuplot 4.7
3
Unary . . . . . . . . . . . . . . . . . . . . . . . . . . . . . . . . . . . . . . . . . . . . . . . . .
28
Binary . . . . . . . . . . . . . . . . . . . . . . . . . . . . . . . . . . . . . . . . . . . . . . . . .
29
Ternary . . . . . . . . . . . . . . . . . . . . . . . . . . . . . . . . . . . . . . . . . . . . . . . .
29
Summation . . . . . . . . . . . . . . . . . . . . . . . . . . . . . . . . . . . . . . . . . . . . . . . . .
30
Gnuplot-defined variables . . . . . . . . . . . . . . . . . . . . . . . . . . . . . . . . . . . . . . . . .
30
User-defined variables and functions . . . . . . . . . . . . . . . . . . . . . . . . . . . . . . . . . . .
31
Fonts
32
Cairo (pdfcairo, pngcairo, epscairo, wxt terminals) . . . . . . . . . . . . . . . . . . . . . . . . . . .
32
Gd (png, gif, jpeg terminals) . . . . . . . . . . . . . . . . . . . . . . . . . . . . . . . . . . . . . . .
32
Postscript (also encapsulated postscript *.eps)
32
. . . . . . . . . . . . . . . . . . . . . . . . . . . . .
Glossary
33
Linetypes, colors, and styles
33
Colorspec . . . . . . . . . . . . . . . . . . . . . . . . . . . . . . . . . . . . . . . . . . . . . . . . . .
34
Background color . . . . . . . . . . . . . . . . . . . . . . . . . . . . . . . . . . . . . . . . . . .
35
Linecolor variable . . . . . . . . . . . . . . . . . . . . . . . . . . . . . . . . . . . . . . . . . .
35
Rgbcolor variable
. . . . . . . . . . . . . . . . . . . . . . . . . . . . . . . . . . . . . . . . . .
35
Linestyles vs linetypes . . . . . . . . . . . . . . . . . . . . . . . . . . . . . . . . . . . . . . . . . . .
36
Mouse input
36
Bind . . . . . . . . . . . . . . . . . . . . . . . . . . . . . . . . . . . . . . . . . . . . . . . . . . . . .
36
Bind space . . . . . . . . . . . . . . . . . . . . . . . . . . . . . . . . . . . . . . . . . . . . . .
37
Mouse variables . . . . . . . . . . . . . . . . . . . . . . . . . . . . . . . . . . . . . . . . . . . . . . .
38
Plotting
38
Start-up (initialization)
39
String constants and string variables
39
Substitution and Command line macros
39
Substitution of system commands in backquotes . . . . . . . . . . . . . . . . . . . . . . . . . . . .
40
Substitution of string variables as macros . . . . . . . . . . . . . . . . . . . . . . . . . . . . . . . .
40
String variables, macros, and command line substitution . . . . . . . . . . . . . . . . . . . . . . . .
41
Syntax
Quote Marks . . . . . . . . . . . . . . . . . . . . . . . . . . . . . . . . . . . . . . . . . . . . . . . .
41
42
Time/Date data
42
II
43
Plotting styles
Boxerrorbars
43
4
gnuplot 4.7
CONTENTS
Boxes
44
Boxplot
45
Boxxyerrorbars
45
Candlesticks
46
Circles
47
Ellipses
47
Dots
48
Filledcurves
48
Financebars
49
Fsteps
50
Fillsteps
50
Histeps
50
Histograms
51
Newhistogram . . . . . . . . . . . . . . . . . . . . . . . . . . . . . . . . . . . . . . . . . . . . . . . .
53
Automated iteration over multiple columns . . . . . . . . . . . . . . . . . . . . . . . . . . . . . . .
53
Image
54
Transparency . . . . . . . . . . . . . . . . . . . . . . . . . . . . . . . . . . . . . . . . . . . . . . . .
54
Image failsafe . . . . . . . . . . . . . . . . . . . . . . . . . . . . . . . . . . . . . . . . . . . . . . . .
55
Impulses
55
Labels
55
Lines
55
Linespoints
56
Points
56
Polar
56
Steps
57
Rgbalpha
57
Rgbimage
57
Vectors
57
CONTENTS
gnuplot 4.7
5
Xerrorbars
58
Xyerrorbars
58
Yerrorbars
58
Xerrorlines
59
Xyerrorlines
59
Yerrorlines
60
3D (surface) plots
60
2D projection (set view map) . . . . . . . . . . . . . . . . . . . . . . . . . . . . . . . . . . . . . . .
III
Commands
60
61
Cd
61
Call
61
Clear
62
Do
62
Evaluate
63
Exit
63
Fit
63
Adjustable parameters . . . . . . . . . . . . . . . . . . . . . . . . . . . . . . . . . . . . . . . . . . .
65
Short introduction . . . . . . . . . . . . . . . . . . . . . . . . . . . . . . . . . . . . . . . . . . . . .
65
Error estimates . . . . . . . . . . . . . . . . . . . . . . . . . . . . . . . . . . . . . . . . . . . . . . .
66
Statistical overview . . . . . . . . . . . . . . . . . . . . . . . . . . . . . . . . . . . . . . . . .
66
Practical guidelines . . . . . . . . . . . . . . . . . . . . . . . . . . . . . . . . . . . . . . . . .
67
Control . . . . . . . . . . . . . . . . . . . . . . . . . . . . . . . . . . . . . . . . . . . . . . . . . . .
67
Control variables . . . . . . . . . . . . . . . . . . . . . . . . . . . . . . . . . . . . . . . . . . .
68
Environment variables . . . . . . . . . . . . . . . . . . . . . . . . . . . . . . . . . . . . . . . .
68
Multi-branch . . . . . . . . . . . . . . . . . . . . . . . . . . . . . . . . . . . . . . . . . . . . . . . .
68
Starting values . . . . . . . . . . . . . . . . . . . . . . . . . . . . . . . . . . . . . . . . . . . . . . .
69
Tips . . . . . . . . . . . . . . . . . . . . . . . . . . . . . . . . . . . . . . . . . . . . . . . . . . . . .
69
Help
70
History
70
If
70
If-old . . . . . . . . . . . . . . . . . . . . . . . . . . . . . . . . . . . . . . . . . . . . . . . . . . . . .
71
6
gnuplot 4.7
CONTENTS
Iteration
71
Load
71
Lower
72
Pause
72
Plot
73
Axes . . . . . . . . . . . . . . . . . . . . . . . . . . . . . . . . . . . . . . . . . . . . . . . . . . . . .
73
Binary . . . . . . . . . . . . . . . . . . . . . . . . . . . . . . . . . . . . . . . . . . . . . . . . . . . .
74
General . . . . . . . . . . . . . . . . . . . . . . . . . . . . . . . . . . . . . . . . . . . . . . . .
74
Array . . . . . . . . . . . . . . . . . . . . . . . . . . . . . . . . . . . . . . . . . . . . . . . . .
75
Record . . . . . . . . . . . . . . . . . . . . . . . . . . . . . . . . . . . . . . . . . . . . . . . .
75
Skip . . . . . . . . . . . . . . . . . . . . . . . . . . . . . . . . . . . . . . . . . . . . . . . . . .
75
Format . . . . . . . . . . . . . . . . . . . . . . . . . . . . . . . . . . . . . . . . . . . . . . . .
75
Endian . . . . . . . . . . . . . . . . . . . . . . . . . . . . . . . . . . . . . . . . . . . . . . . .
76
Filetype . . . . . . . . . . . . . . . . . . . . . . . . . . . . . . . . . . . . . . . . . . . . . . . .
76
Avs . . . . . . . . . . . . . . . . . . . . . . . . . . . . . . . . . . . . . . . . . . . . .
76
Edf
. . . . . . . . . . . . . . . . . . . . . . . . . . . . . . . . . . . . . . . . . . . . .
76
Png . . . . . . . . . . . . . . . . . . . . . . . . . . . . . . . . . . . . . . . . . . . . .
76
Keywords . . . . . . . . . . . . . . . . . . . . . . . . . . . . . . . . . . . . . . . . . . . . . . .
76
Scan . . . . . . . . . . . . . . . . . . . . . . . . . . . . . . . . . . . . . . . . . . . . .
77
Transpose . . . . . . . . . . . . . . . . . . . . . . . . . . . . . . . . . . . . . . . . . .
77
Dx, dy, dz . . . . . . . . . . . . . . . . . . . . . . . . . . . . . . . . . . . . . . . . . .
77
Flipx, flipy, flipz . . . . . . . . . . . . . . . . . . . . . . . . . . . . . . . . . . . . . .
77
Origin
. . . . . . . . . . . . . . . . . . . . . . . . . . . . . . . . . . . . . . . . . . .
77
Center . . . . . . . . . . . . . . . . . . . . . . . . . . . . . . . . . . . . . . . . . . . .
77
Rotate . . . . . . . . . . . . . . . . . . . . . . . . . . . . . . . . . . . . . . . . . . . .
77
Perpendicular . . . . . . . . . . . . . . . . . . . . . . . . . . . . . . . . . . . . . . . .
77
Data . . . . . . . . . . . . . . . . . . . . . . . . . . . . . . . . . . . . . . . . . . . . . . . . . . . . .
78
Every . . . . . . . . . . . . . . . . . . . . . . . . . . . . . . . . . . . . . . . . . . . . . . . . .
79
Example datafile . . . . . . . . . . . . . . . . . . . . . . . . . . . . . . . . . . . . . . . . . . .
80
Index . . . . . . . . . . . . . . . . . . . . . . . . . . . . . . . . . . . . . . . . . . . . . . . . .
80
Smooth . . . . . . . . . . . . . . . . . . . . . . . . . . . . . . . . . . . . . . . . . . . . . . . .
81
Acsplines . . . . . . . . . . . . . . . . . . . . . . . . . . . . . . . . . . . . . . . . . .
81
Bezier . . . . . . . . . . . . . . . . . . . . . . . . . . . . . . . . . . . . . . . . . . . .
82
Csplines . . . . . . . . . . . . . . . . . . . . . . . . . . . . . . . . . . . . . . . . . . .
82
Sbezier . . . . . . . . . . . . . . . . . . . . . . . . . . . . . . . . . . . . . . . . . . .
82
Unique
. . . . . . . . . . . . . . . . . . . . . . . . . . . . . . . . . . . . . . . . . . .
82
Frequency . . . . . . . . . . . . . . . . . . . . . . . . . . . . . . . . . . . . . . . . . .
82
Cumulative . . . . . . . . . . . . . . . . . . . . . . . . . . . . . . . . . . . . . . . . .
82
Cnormal . . . . . . . . . . . . . . . . . . . . . . . . . . . . . . . . . . . . . . . . . . .
82
Kdensity . . . . . . . . . . . . . . . . . . . . . . . . . . . . . . . . . . . . . . . . . .
82
CONTENTS
gnuplot 4.7
7
Special-filenames . . . . . . . . . . . . . . . . . . . . . . . . . . . . . . . . . . . . . . . . . . .
82
Thru
. . . . . . . . . . . . . . . . . . . . . . . . . . . . . . . . . . . . . . . . . . . . . . . . .
84
Using . . . . . . . . . . . . . . . . . . . . . . . . . . . . . . . . . . . . . . . . . . . . . . . . .
84
Using examples . . . . . . . . . . . . . . . . . . . . . . . . . . . . . . . . . . . . . . .
85
Pseudocolumns . . . . . . . . . . . . . . . . . . . . . . . . . . . . . . . . . . . . . . .
86
Xticlabels . . . . . . . . . . . . . . . . . . . . . . . . . . . . . . . . . . . . . . . . . .
86
X2ticlabels . . . . . . . . . . . . . . . . . . . . . . . . . . . . . . . . . . . . . . . . .
86
Yticlabels . . . . . . . . . . . . . . . . . . . . . . . . . . . . . . . . . . . . . . . . . .
86
Y2ticlabels . . . . . . . . . . . . . . . . . . . . . . . . . . . . . . . . . . . . . . . . .
86
Zticlabels . . . . . . . . . . . . . . . . . . . . . . . . . . . . . . . . . . . . . . . . . .
87
Volatile . . . . . . . . . . . . . . . . . . . . . . . . . . . . . . . . . . . . . . . . . . . . . . . .
87
Errorbars . . . . . . . . . . . . . . . . . . . . . . . . . . . . . . . . . . . . . . . . . . . . . . . . . .
87
Errorlines . . . . . . . . . . . . . . . . . . . . . . . . . . . . . . . . . . . . . . . . . . . . . . . . . .
87
Functions . . . . . . . . . . . . . . . . . . . . . . . . . . . . . . . . . . . . . . . . . . . . . . . . . .
88
Parametric . . . . . . . . . . . . . . . . . . . . . . . . . . . . . . . . . . . . . . . . . . . . . . . . .
88
Ranges . . . . . . . . . . . . . . . . . . . . . . . . . . . . . . . . . . . . . . . . . . . . . . . . . . . .
88
Iteration . . . . . . . . . . . . . . . . . . . . . . . . . . . . . . . . . . . . . . . . . . . . . . . . . . .
89
Title . . . . . . . . . . . . . . . . . . . . . . . . . . . . . . . . . . . . . . . . . . . . . . . . . . . . .
90
With . . . . . . . . . . . . . . . . . . . . . . . . . . . . . . . . . . . . . . . . . . . . . . . . . . . . .
91
Print
93
Pwd
93
Quit
93
Raise
94
Refresh
94
Replot
94
Reread
95
Reset
95
Save
96
Set-show
96
Angles . . . . . . . . . . . . . . . . . . . . . . . . . . . . . . . . . . . . . . . . . . . . . . . . . . . .
96
Arrow . . . . . . . . . . . . . . . . . . . . . . . . . . . . . . . . . . . . . . . . . . . . . . . . . . . .
97
Autoscale . . . . . . . . . . . . . . . . . . . . . . . . . . . . . . . . . . . . . . . . . . . . . . . . . .
98
Parametric mode . . . . . . . . . . . . . . . . . . . . . . . . . . . . . . . . . . . . . . . . . . .
99
Polar mode . . . . . . . . . . . . . . . . . . . . . . . . . . . . . . . . . . . . . . . . . . . . . . 100
Bars . . . . . . . . . . . . . . . . . . . . . . . . . . . . . . . . . . . . . . . . . . . . . . . . . . . . . 100
Bind . . . . . . . . . . . . . . . . . . . . . . . . . . . . . . . . . . . . . . . . . . . . . . . . . . . . . 100
8
gnuplot 4.7
CONTENTS
Bmargin . . . . . . . . . . . . . . . . . . . . . . . . . . . . . . . . . . . . . . . . . . . . . . . . . . . 100
Border . . . . . . . . . . . . . . . . . . . . . . . . . . . . . . . . . . . . . . . . . . . . . . . . . . . . 100
Boxwidth . . . . . . . . . . . . . . . . . . . . . . . . . . . . . . . . . . . . . . . . . . . . . . . . . . 102
Clabel . . . . . . . . . . . . . . . . . . . . . . . . . . . . . . . . . . . . . . . . . . . . . . . . . . . . 102
Clip . . . . . . . . . . . . . . . . . . . . . . . . . . . . . . . . . . . . . . . . . . . . . . . . . . . . . 103
Cntrparam . . . . . . . . . . . . . . . . . . . . . . . . . . . . . . . . . . . . . . . . . . . . . . . . . 103
Color box . . . . . . . . . . . . . . . . . . . . . . . . . . . . . . . . . . . . . . . . . . . . . . . . . . 105
Colornames . . . . . . . . . . . . . . . . . . . . . . . . . . . . . . . . . . . . . . . . . . . . . . . . . 105
Contour . . . . . . . . . . . . . . . . . . . . . . . . . . . . . . . . . . . . . . . . . . . . . . . . . . . 105
Data style . . . . . . . . . . . . . . . . . . . . . . . . . . . . . . . . . . . . . . . . . . . . . . . . . . 106
Datafile . . . . . . . . . . . . . . . . . . . . . . . . . . . . . . . . . . . . . . . . . . . . . . . . . . . 106
Set datafile fortran . . . . . . . . . . . . . . . . . . . . . . . . . . . . . . . . . . . . . . . . . . 106
Set datafile nofpe trap . . . . . . . . . . . . . . . . . . . . . . . . . . . . . . . . . . . . . . . . 106
Set datafile missing . . . . . . . . . . . . . . . . . . . . . . . . . . . . . . . . . . . . . . . . . 107
Set datafile separator . . . . . . . . . . . . . . . . . . . . . . . . . . . . . . . . . . . . . . . . 108
Set datafile commentschars . . . . . . . . . . . . . . . . . . . . . . . . . . . . . . . . . . . . . 108
Set datafile binary . . . . . . . . . . . . . . . . . . . . . . . . . . . . . . . . . . . . . . . . . . 108
Decimalsign . . . . . . . . . . . . . . . . . . . . . . . . . . . . . . . . . . . . . . . . . . . . . . . . . 109
Dgrid3d . . . . . . . . . . . . . . . . . . . . . . . . . . . . . . . . . . . . . . . . . . . . . . . . . . . 109
Dummy . . . . . . . . . . . . . . . . . . . . . . . . . . . . . . . . . . . . . . . . . . . . . . . . . . . 111
Encoding . . . . . . . . . . . . . . . . . . . . . . . . . . . . . . . . . . . . . . . . . . . . . . . . . . 111
Fit . . . . . . . . . . . . . . . . . . . . . . . . . . . . . . . . . . . . . . . . . . . . . . . . . . . . . . 112
Fontpath . . . . . . . . . . . . . . . . . . . . . . . . . . . . . . . . . . . . . . . . . . . . . . . . . . 112
Format
. . . . . . . . . . . . . . . . . . . . . . . . . . . . . . . . . . . . . . . . . . . . . . . . . . . 113
Gprintf . . . . . . . . . . . . . . . . . . . . . . . . . . . . . . . . . . . . . . . . . . . . . . . . 113
Format specifiers . . . . . . . . . . . . . . . . . . . . . . . . . . . . . . . . . . . . . . . . . . . 113
Time/date specifiers . . . . . . . . . . . . . . . . . . . . . . . . . . . . . . . . . . . . . . . . . 114
Function style . . . . . . . . . . . . . . . . . . . . . . . . . . . . . . . . . . . . . . . . . . . . . . . . 115
Functions . . . . . . . . . . . . . . . . . . . . . . . . . . . . . . . . . . . . . . . . . . . . . . . . . . 115
Grid . . . . . . . . . . . . . . . . . . . . . . . . . . . . . . . . . . . . . . . . . . . . . . . . . . . . . 116
Hidden3d . . . . . . . . . . . . . . . . . . . . . . . . . . . . . . . . . . . . . . . . . . . . . . . . . . 116
Historysize . . . . . . . . . . . . . . . . . . . . . . . . . . . . . . . . . . . . . . . . . . . . . . . . . 118
Isosamples . . . . . . . . . . . . . . . . . . . . . . . . . . . . . . . . . . . . . . . . . . . . . . . . . . 118
Key . . . . . . . . . . . . . . . . . . . . . . . . . . . . . . . . . . . . . . . . . . . . . . . . . . . . . 119
Key placement . . . . . . . . . . . . . . . . . . . . . . . . . . . . . . . . . . . . . . . . . . . . 120
Key samples . . . . . . . . . . . . . . . . . . . . . . . . . . . . . . . . . . . . . . . . . . . . . 121
Label . . . . . . . . . . . . . . . . . . . . . . . . . . . . . . . . . . . . . . . . . . . . . . . . . . . . 122
Linetype . . . . . . . . . . . . . . . . . . . . . . . . . . . . . . . . . . . . . . . . . . . . . . . . . . . 124
Lmargin . . . . . . . . . . . . . . . . . . . . . . . . . . . . . . . . . . . . . . . . . . . . . . . . . . . 124
Loadpath . . . . . . . . . . . . . . . . . . . . . . . . . . . . . . . . . . . . . . . . . . . . . . . . . . 124
Locale . . . . . . . . . . . . . . . . . . . . . . . . . . . . . . . . . . . . . . . . . . . . . . . . . . . . 125
Logscale . . . . . . . . . . . . . . . . . . . . . . . . . . . . . . . . . . . . . . . . . . . . . . . . . . . 125
CONTENTS
gnuplot 4.7
9
Macros . . . . . . . . . . . . . . . . . . . . . . . . . . . . . . . . . . . . . . . . . . . . . . . . . . . . 125
Mapping . . . . . . . . . . . . . . . . . . . . . . . . . . . . . . . . . . . . . . . . . . . . . . . . . . . 126
Margin . . . . . . . . . . . . . . . . . . . . . . . . . . . . . . . . . . . . . . . . . . . . . . . . . . . . 126
Mouse . . . . . . . . . . . . . . . . . . . . . . . . . . . . . . . . . . . . . . . . . . . . . . . . . . . . 127
Doubleclick . . . . . . . . . . . . . . . . . . . . . . . . . . . . . . . . . . . . . . . . . . . . . . 127
Mouseformat . . . . . . . . . . . . . . . . . . . . . . . . . . . . . . . . . . . . . . . . . . . . . 128
Scrolling
. . . . . . . . . . . . . . . . . . . . . . . . . . . . . . . . . . . . . . . . . . . . . . . 128
X11 mouse . . . . . . . . . . . . . . . . . . . . . . . . . . . . . . . . . . . . . . . . . . . . . . 128
Zoom . . . . . . . . . . . . . . . . . . . . . . . . . . . . . . . . . . . . . . . . . . . . . . . . . 128
Multiplot . . . . . . . . . . . . . . . . . . . . . . . . . . . . . . . . . . . . . . . . . . . . . . . . . . 128
Mx2tics . . . . . . . . . . . . . . . . . . . . . . . . . . . . . . . . . . . . . . . . . . . . . . . . . . . 130
Mxtics . . . . . . . . . . . . . . . . . . . . . . . . . . . . . . . . . . . . . . . . . . . . . . . . . . . . 130
My2tics . . . . . . . . . . . . . . . . . . . . . . . . . . . . . . . . . . . . . . . . . . . . . . . . . . . 130
Mytics . . . . . . . . . . . . . . . . . . . . . . . . . . . . . . . . . . . . . . . . . . . . . . . . . . . . 131
Mztics . . . . . . . . . . . . . . . . . . . . . . . . . . . . . . . . . . . . . . . . . . . . . . . . . . . . 131
Object . . . . . . . . . . . . . . . . . . . . . . . . . . . . . . . . . . . . . . . . . . . . . . . . . . . . 131
Rectangle . . . . . . . . . . . . . . . . . . . . . . . . . . . . . . . . . . . . . . . . . . . . . . . 131
Ellipse . . . . . . . . . . . . . . . . . . . . . . . . . . . . . . . . . . . . . . . . . . . . . . . . . 132
Circle . . . . . . . . . . . . . . . . . . . . . . . . . . . . . . . . . . . . . . . . . . . . . . . . . 132
Polygon . . . . . . . . . . . . . . . . . . . . . . . . . . . . . . . . . . . . . . . . . . . . . . . . 132
Offsets . . . . . . . . . . . . . . . . . . . . . . . . . . . . . . . . . . . . . . . . . . . . . . . . . . . . 133
Origin . . . . . . . . . . . . . . . . . . . . . . . . . . . . . . . . . . . . . . . . . . . . . . . . . . . . 133
Output . . . . . . . . . . . . . . . . . . . . . . . . . . . . . . . . . . . . . . . . . . . . . . . . . . . 133
Parametric . . . . . . . . . . . . . . . . . . . . . . . . . . . . . . . . . . . . . . . . . . . . . . . . . 134
Plot . . . . . . . . . . . . . . . . . . . . . . . . . . . . . . . . . . . . . . . . . . . . . . . . . . . . . 134
Pm3d . . . . . . . . . . . . . . . . . . . . . . . . . . . . . . . . . . . . . . . . . . . . . . . . . . . . 135
Algorithm . . . . . . . . . . . . . . . . . . . . . . . . . . . . . . . . . . . . . . . . . . . . . . . 135
Position . . . . . . . . . . . . . . . . . . . . . . . . . . . . . . . . . . . . . . . . . . . . . . . . 136
Scanorder . . . . . . . . . . . . . . . . . . . . . . . . . . . . . . . . . . . . . . . . . . . . . . . 136
Clipping . . . . . . . . . . . . . . . . . . . . . . . . . . . . . . . . . . . . . . . . . . . . . . . . 137
Color assignment . . . . . . . . . . . . . . . . . . . . . . . . . . . . . . . . . . . . . . . . . . . 137
Hidden3d . . . . . . . . . . . . . . . . . . . . . . . . . . . . . . . . . . . . . . . . . . . . . . . 137
Interpolate . . . . . . . . . . . . . . . . . . . . . . . . . . . . . . . . . . . . . . . . . . . . . . 138
Deprecated options
. . . . . . . . . . . . . . . . . . . . . . . . . . . . . . . . . . . . . . . . . 138
Palette . . . . . . . . . . . . . . . . . . . . . . . . . . . . . . . . . . . . . . . . . . . . . . . . . . . . 138
Rgbformulae . . . . . . . . . . . . . . . . . . . . . . . . . . . . . . . . . . . . . . . . . . . . . 140
Defined . . . . . . . . . . . . . . . . . . . . . . . . . . . . . . . . . . . . . . . . . . . . . . . . 140
Functions . . . . . . . . . . . . . . . . . . . . . . . . . . . . . . . . . . . . . . . . . . . . . . . 141
Cubehelix . . . . . . . . . . . . . . . . . . . . . . . . . . . . . . . . . . . . . . . . . . . . . . . 141
File . . . . . . . . . . . . . . . . . . . . . . . . . . . . . . . . . . . . . . . . . . . . . . . . . . 142
Gamma correction . . . . . . . . . . . . . . . . . . . . . . . . . . . . . . . . . . . . . . . . . . 142
Postscript . . . . . . . . . . . . . . . . . . . . . . . . . . . . . . . . . . . . . . . . . . . . . . . 142
10
gnuplot 4.7
CONTENTS
Pointintervalbox . . . . . . . . . . . . . . . . . . . . . . . . . . . . . . . . . . . . . . . . . . . . . . 143
Pointsize . . . . . . . . . . . . . . . . . . . . . . . . . . . . . . . . . . . . . . . . . . . . . . . . . . . 143
Polar . . . . . . . . . . . . . . . . . . . . . . . . . . . . . . . . . . . . . . . . . . . . . . . . . . . . . 143
Print . . . . . . . . . . . . . . . . . . . . . . . . . . . . . . . . . . . . . . . . . . . . . . . . . . . . . 144
Psdir . . . . . . . . . . . . . . . . . . . . . . . . . . . . . . . . . . . . . . . . . . . . . . . . . . . . . 144
Raxis . . . . . . . . . . . . . . . . . . . . . . . . . . . . . . . . . . . . . . . . . . . . . . . . . . . . 144
Rmargin . . . . . . . . . . . . . . . . . . . . . . . . . . . . . . . . . . . . . . . . . . . . . . . . . . . 144
Rrange . . . . . . . . . . . . . . . . . . . . . . . . . . . . . . . . . . . . . . . . . . . . . . . . . . . . 145
Rtics . . . . . . . . . . . . . . . . . . . . . . . . . . . . . . . . . . . . . . . . . . . . . . . . . . . . . 145
Samples . . . . . . . . . . . . . . . . . . . . . . . . . . . . . . . . . . . . . . . . . . . . . . . . . . . 145
Size . . . . . . . . . . . . . . . . . . . . . . . . . . . . . . . . . . . . . . . . . . . . . . . . . . . . . 145
Style . . . . . . . . . . . . . . . . . . . . . . . . . . . . . . . . . . . . . . . . . . . . . . . . . . . . . 146
Set style arrow . . . . . . . . . . . . . . . . . . . . . . . . . . . . . . . . . . . . . . . . . . . . 146
Boxplot . . . . . . . . . . . . . . . . . . . . . . . . . . . . . . . . . . . . . . . . . . . . . . . . 147
Set style data . . . . . . . . . . . . . . . . . . . . . . . . . . . . . . . . . . . . . . . . . . . . . 148
Set style fill . . . . . . . . . . . . . . . . . . . . . . . . . . . . . . . . . . . . . . . . . . . . . . 148
Set style fill transparent . . . . . . . . . . . . . . . . . . . . . . . . . . . . . . . . . . 149
Set style function . . . . . . . . . . . . . . . . . . . . . . . . . . . . . . . . . . . . . . . . . . . 149
Set style increment . . . . . . . . . . . . . . . . . . . . . . . . . . . . . . . . . . . . . . . . . . 149
Set style line . . . . . . . . . . . . . . . . . . . . . . . . . . . . . . . . . . . . . . . . . . . . . 150
Set style circle . . . . . . . . . . . . . . . . . . . . . . . . . . . . . . . . . . . . . . . . . . . . 151
Set style rectangle . . . . . . . . . . . . . . . . . . . . . . . . . . . . . . . . . . . . . . . . . . 151
Set style ellipse . . . . . . . . . . . . . . . . . . . . . . . . . . . . . . . . . . . . . . . . . . . . 152
Surface . . . . . . . . . . . . . . . . . . . . . . . . . . . . . . . . . . . . . . . . . . . . . . . . . . . 152
Table
. . . . . . . . . . . . . . . . . . . . . . . . . . . . . . . . . . . . . . . . . . . . . . . . . . . . 152
Terminal . . . . . . . . . . . . . . . . . . . . . . . . . . . . . . . . . . . . . . . . . . . . . . . . . . . 153
Termoption . . . . . . . . . . . . . . . . . . . . . . . . . . . . . . . . . . . . . . . . . . . . . . . . . 153
Tics . . . . . . . . . . . . . . . . . . . . . . . . . . . . . . . . . . . . . . . . . . . . . . . . . . . . . 153
Ticslevel . . . . . . . . . . . . . . . . . . . . . . . . . . . . . . . . . . . . . . . . . . . . . . . . . . . 154
Ticscale . . . . . . . . . . . . . . . . . . . . . . . . . . . . . . . . . . . . . . . . . . . . . . . . . . . 154
Timestamp . . . . . . . . . . . . . . . . . . . . . . . . . . . . . . . . . . . . . . . . . . . . . . . . . 154
Timefmt . . . . . . . . . . . . . . . . . . . . . . . . . . . . . . . . . . . . . . . . . . . . . . . . . . . 155
Title . . . . . . . . . . . . . . . . . . . . . . . . . . . . . . . . . . . . . . . . . . . . . . . . . . . . . 156
Tmargin . . . . . . . . . . . . . . . . . . . . . . . . . . . . . . . . . . . . . . . . . . . . . . . . . . . 156
Trange . . . . . . . . . . . . . . . . . . . . . . . . . . . . . . . . . . . . . . . . . . . . . . . . . . . . 156
Urange . . . . . . . . . . . . . . . . . . . . . . . . . . . . . . . . . . . . . . . . . . . . . . . . . . . . 156
Variables . . . . . . . . . . . . . . . . . . . . . . . . . . . . . . . . . . . . . . . . . . . . . . . . . . 156
Version . . . . . . . . . . . . . . . . . . . . . . . . . . . . . . . . . . . . . . . . . . . . . . . . . . . 157
View . . . . . . . . . . . . . . . . . . . . . . . . . . . . . . . . . . . . . . . . . . . . . . . . . . . . . 157
Equal axes . . . . . . . . . . . . . . . . . . . . . . . . . . . . . . . . . . . . . . . . . . . . . . 157
Vrange . . . . . . . . . . . . . . . . . . . . . . . . . . . . . . . . . . . . . . . . . . . . . . . . . . . . 157
X2data
. . . . . . . . . . . . . . . . . . . . . . . . . . . . . . . . . . . . . . . . . . . . . . . . . . . 158
CONTENTS
gnuplot 4.7
11
X2dtics . . . . . . . . . . . . . . . . . . . . . . . . . . . . . . . . . . . . . . . . . . . . . . . . . . . 158
X2label . . . . . . . . . . . . . . . . . . . . . . . . . . . . . . . . . . . . . . . . . . . . . . . . . . . 158
X2mtics . . . . . . . . . . . . . . . . . . . . . . . . . . . . . . . . . . . . . . . . . . . . . . . . . . . 158
X2range . . . . . . . . . . . . . . . . . . . . . . . . . . . . . . . . . . . . . . . . . . . . . . . . . . . 158
X2tics . . . . . . . . . . . . . . . . . . . . . . . . . . . . . . . . . . . . . . . . . . . . . . . . . . . . 158
X2zeroaxis
. . . . . . . . . . . . . . . . . . . . . . . . . . . . . . . . . . . . . . . . . . . . . . . . . 158
Xdata . . . . . . . . . . . . . . . . . . . . . . . . . . . . . . . . . . . . . . . . . . . . . . . . . . . . 158
Time . . . . . . . . . . . . . . . . . . . . . . . . . . . . . . . . . . . . . . . . . . . . . . . . . 159
Geographic . . . . . . . . . . . . . . . . . . . . . . . . . . . . . . . . . . . . . . . . . . . . . . 159
Xdtics . . . . . . . . . . . . . . . . . . . . . . . . . . . . . . . . . . . . . . . . . . . . . . . . . . . . 159
Xlabel . . . . . . . . . . . . . . . . . . . . . . . . . . . . . . . . . . . . . . . . . . . . . . . . . . . . 159
Xmtics . . . . . . . . . . . . . . . . . . . . . . . . . . . . . . . . . . . . . . . . . . . . . . . . . . . . 160
Xrange . . . . . . . . . . . . . . . . . . . . . . . . . . . . . . . . . . . . . . . . . . . . . . . . . . . . 160
Xtics . . . . . . . . . . . . . . . . . . . . . . . . . . . . . . . . . . . . . . . . . . . . . . . . . . . . . 162
Xtics time data . . . . . . . . . . . . . . . . . . . . . . . . . . . . . . . . . . . . . . . . . . . . 164
Xtics rangelimited . . . . . . . . . . . . . . . . . . . . . . . . . . . . . . . . . . . . . . . . . . 164
Xyplane . . . . . . . . . . . . . . . . . . . . . . . . . . . . . . . . . . . . . . . . . . . . . . . . . . . 165
Xzeroaxis . . . . . . . . . . . . . . . . . . . . . . . . . . . . . . . . . . . . . . . . . . . . . . . . . . 165
Y2data
. . . . . . . . . . . . . . . . . . . . . . . . . . . . . . . . . . . . . . . . . . . . . . . . . . . 165
Y2dtics . . . . . . . . . . . . . . . . . . . . . . . . . . . . . . . . . . . . . . . . . . . . . . . . . . . 165
Y2label . . . . . . . . . . . . . . . . . . . . . . . . . . . . . . . . . . . . . . . . . . . . . . . . . . . 165
Y2mtics . . . . . . . . . . . . . . . . . . . . . . . . . . . . . . . . . . . . . . . . . . . . . . . . . . . 165
Y2range . . . . . . . . . . . . . . . . . . . . . . . . . . . . . . . . . . . . . . . . . . . . . . . . . . . 166
Y2tics . . . . . . . . . . . . . . . . . . . . . . . . . . . . . . . . . . . . . . . . . . . . . . . . . . . . 166
Y2zeroaxis
. . . . . . . . . . . . . . . . . . . . . . . . . . . . . . . . . . . . . . . . . . . . . . . . . 166
Ydata . . . . . . . . . . . . . . . . . . . . . . . . . . . . . . . . . . . . . . . . . . . . . . . . . . . . 166
Ydtics . . . . . . . . . . . . . . . . . . . . . . . . . . . . . . . . . . . . . . . . . . . . . . . . . . . . 166
Ylabel . . . . . . . . . . . . . . . . . . . . . . . . . . . . . . . . . . . . . . . . . . . . . . . . . . . . 166
Ymtics . . . . . . . . . . . . . . . . . . . . . . . . . . . . . . . . . . . . . . . . . . . . . . . . . . . . 166
Yrange . . . . . . . . . . . . . . . . . . . . . . . . . . . . . . . . . . . . . . . . . . . . . . . . . . . . 166
Ytics . . . . . . . . . . . . . . . . . . . . . . . . . . . . . . . . . . . . . . . . . . . . . . . . . . . . . 166
Yzeroaxis . . . . . . . . . . . . . . . . . . . . . . . . . . . . . . . . . . . . . . . . . . . . . . . . . . 166
Zdata . . . . . . . . . . . . . . . . . . . . . . . . . . . . . . . . . . . . . . . . . . . . . . . . . . . . 166
Zdtics . . . . . . . . . . . . . . . . . . . . . . . . . . . . . . . . . . . . . . . . . . . . . . . . . . . . 167
Zzeroaxis . . . . . . . . . . . . . . . . . . . . . . . . . . . . . . . . . . . . . . . . . . . . . . . . . . 167
Cbdata . . . . . . . . . . . . . . . . . . . . . . . . . . . . . . . . . . . . . . . . . . . . . . . . . . . 167
Cbdtics . . . . . . . . . . . . . . . . . . . . . . . . . . . . . . . . . . . . . . . . . . . . . . . . . . . 167
Zero . . . . . . . . . . . . . . . . . . . . . . . . . . . . . . . . . . . . . . . . . . . . . . . . . . . . . 167
Zeroaxis . . . . . . . . . . . . . . . . . . . . . . . . . . . . . . . . . . . . . . . . . . . . . . . . . . . 167
Zlabel . . . . . . . . . . . . . . . . . . . . . . . . . . . . . . . . . . . . . . . . . . . . . . . . . . . . 168
Zmtics . . . . . . . . . . . . . . . . . . . . . . . . . . . . . . . . . . . . . . . . . . . . . . . . . . . . 168
Zrange . . . . . . . . . . . . . . . . . . . . . . . . . . . . . . . . . . . . . . . . . . . . . . . . . . . . 168
12
gnuplot 4.7
CONTENTS
Ztics . . . . . . . . . . . . . . . . . . . . . . . . . . . . . . . . . . . . . . . . . . . . . . . . . . . . . 168
Cblabel . . . . . . . . . . . . . . . . . . . . . . . . . . . . . . . . . . . . . . . . . . . . . . . . . . . 168
Cbmtics . . . . . . . . . . . . . . . . . . . . . . . . . . . . . . . . . . . . . . . . . . . . . . . . . . . 168
Cbrange . . . . . . . . . . . . . . . . . . . . . . . . . . . . . . . . . . . . . . . . . . . . . . . . . . . 168
Cbtics . . . . . . . . . . . . . . . . . . . . . . . . . . . . . . . . . . . . . . . . . . . . . . . . . . . . 168
Shell
168
Splot
169
Data-file . . . . . . . . . . . . . . . . . . . . . . . . . . . . . . . . . . . . . . . . . . . . . . . . . . . 169
Matrix
. . . . . . . . . . . . . . . . . . . . . . . . . . . . . . . . . . . . . . . . . . . . . . . . 170
Example datafile . . . . . . . . . . . . . . . . . . . . . . . . . . . . . . . . . . . . . . . . . . . 171
Grid data . . . . . . . . . . . . . . . . . . . . . . . . . . . . . . . . . . . . . . . . . . . . . . . . . . 172
Splot surfaces . . . . . . . . . . . . . . . . . . . . . . . . . . . . . . . . . . . . . . . . . . . . . . . . 172
Stats (Statistical Summary)
173
System
174
Test
174
Undefine
174
Unset
174
Update
175
While
175
IV
175
Terminal types
Complete list of terminals
175
Aed767 . . . . . . . . . . . . . . . . . . . . . . . . . . . . . . . . . . . . . . . . . . . . . . . . . . . 175
Aifm . . . . . . . . . . . . . . . . . . . . . . . . . . . . . . . . . . . . . . . . . . . . . . . . . . . . . 176
Aqua . . . . . . . . . . . . . . . . . . . . . . . . . . . . . . . . . . . . . . . . . . . . . . . . . . . . . 176
Be . . . . . . . . . . . . . . . . . . . . . . . . . . . . . . . . . . . . . . . . . . . . . . . . . . . . . . 176
Command-line options . . . . . . . . . . . . . . . . . . . . . . . . . . . . . . . . . . . . . . . . 177
Monochrome options . . . . . . . . . . . . . . . . . . . . . . . . . . . . . . . . . . . . . . . . . 177
Color resources . . . . . . . . . . . . . . . . . . . . . . . . . . . . . . . . . . . . . . . . . . . . 177
Grayscale resources . . . . . . . . . . . . . . . . . . . . . . . . . . . . . . . . . . . . . . . . . 178
Line resources . . . . . . . . . . . . . . . . . . . . . . . . . . . . . . . . . . . . . . . . . . . . 178
Cairolatex . . . . . . . . . . . . . . . . . . . . . . . . . . . . . . . . . . . . . . . . . . . . . . . . . . 179
Canvas . . . . . . . . . . . . . . . . . . . . . . . . . . . . . . . . . . . . . . . . . . . . . . . . . . . . 181
Cgi . . . . . . . . . . . . . . . . . . . . . . . . . . . . . . . . . . . . . . . . . . . . . . . . . . . . . . 182
Cgm . . . . . . . . . . . . . . . . . . . . . . . . . . . . . . . . . . . . . . . . . . . . . . . . . . . . . 182
CONTENTS
gnuplot 4.7
13
Cgm font . . . . . . . . . . . . . . . . . . . . . . . . . . . . . . . . . . . . . . . . . . . . . . . 182
Cgm fontsize . . . . . . . . . . . . . . . . . . . . . . . . . . . . . . . . . . . . . . . . . . . . . 183
Cgm linewidth . . . . . . . . . . . . . . . . . . . . . . . . . . . . . . . . . . . . . . . . . . . . 183
Cgm rotate . . . . . . . . . . . . . . . . . . . . . . . . . . . . . . . . . . . . . . . . . . . . . . 184
Cgm solid . . . . . . . . . . . . . . . . . . . . . . . . . . . . . . . . . . . . . . . . . . . . . . . 184
Cgm size . . . . . . . . . . . . . . . . . . . . . . . . . . . . . . . . . . . . . . . . . . . . . . . 184
Cgm width . . . . . . . . . . . . . . . . . . . . . . . . . . . . . . . . . . . . . . . . . . . . . . 184
Cgm nofontlist . . . . . . . . . . . . . . . . . . . . . . . . . . . . . . . . . . . . . . . . . . . . 184
Context . . . . . . . . . . . . . . . . . . . . . . . . . . . . . . . . . . . . . . . . . . . . . . . . . . . 184
Requirements . . . . . . . . . . . . . . . . . . . . . . . . . . . . . . . . . . . . . . . . . . . . . 186
Calling gnuplot from ConTeXt . . . . . . . . . . . . . . . . . . . . . . . . . . . . . . . . . . . 186
Corel . . . . . . . . . . . . . . . . . . . . . . . . . . . . . . . . . . . . . . . . . . . . . . . . . . . . . 186
Debug . . . . . . . . . . . . . . . . . . . . . . . . . . . . . . . . . . . . . . . . . . . . . . . . . . . . 187
Dumb . . . . . . . . . . . . . . . . . . . . . . . . . . . . . . . . . . . . . . . . . . . . . . . . . . . . 187
Dxf . . . . . . . . . . . . . . . . . . . . . . . . . . . . . . . . . . . . . . . . . . . . . . . . . . . . . . 187
Dxy800a . . . . . . . . . . . . . . . . . . . . . . . . . . . . . . . . . . . . . . . . . . . . . . . . . . . 187
Eepic
. . . . . . . . . . . . . . . . . . . . . . . . . . . . . . . . . . . . . . . . . . . . . . . . . . . . 187
Emf . . . . . . . . . . . . . . . . . . . . . . . . . . . . . . . . . . . . . . . . . . . . . . . . . . . . . 188
Emxvga . . . . . . . . . . . . . . . . . . . . . . . . . . . . . . . . . . . . . . . . . . . . . . . . . . . 189
Epscairo . . . . . . . . . . . . . . . . . . . . . . . . . . . . . . . . . . . . . . . . . . . . . . . . . . . 189
Epslatex . . . . . . . . . . . . . . . . . . . . . . . . . . . . . . . . . . . . . . . . . . . . . . . . . . . 189
Epson 180dpi . . . . . . . . . . . . . . . . . . . . . . . . . . . . . . . . . . . . . . . . . . . . . . . . 192
Excl . . . . . . . . . . . . . . . . . . . . . . . . . . . . . . . . . . . . . . . . . . . . . . . . . . . . . 193
Fig . . . . . . . . . . . . . . . . . . . . . . . . . . . . . . . . . . . . . . . . . . . . . . . . . . . . . . 193
Ggi . . . . . . . . . . . . . . . . . . . . . . . . . . . . . . . . . . . . . . . . . . . . . . . . . . . . . . 194
Gif . . . . . . . . . . . . . . . . . . . . . . . . . . . . . . . . . . . . . . . . . . . . . . . . . . . . . . 195
Examples . . . . . . . . . . . . . . . . . . . . . . . . . . . . . . . . . . . . . . . . . . . . . . . 195
Gpic . . . . . . . . . . . . . . . . . . . . . . . . . . . . . . . . . . . . . . . . . . . . . . . . . . . . . 196
Grass . . . . . . . . . . . . . . . . . . . . . . . . . . . . . . . . . . . . . . . . . . . . . . . . . . . . 196
Hp2623a . . . . . . . . . . . . . . . . . . . . . . . . . . . . . . . . . . . . . . . . . . . . . . . . . . . 197
Hp2648 . . . . . . . . . . . . . . . . . . . . . . . . . . . . . . . . . . . . . . . . . . . . . . . . . . . 197
Hp500c . . . . . . . . . . . . . . . . . . . . . . . . . . . . . . . . . . . . . . . . . . . . . . . . . . . 197
Hpgl . . . . . . . . . . . . . . . . . . . . . . . . . . . . . . . . . . . . . . . . . . . . . . . . . . . . . 197
Hpljii . . . . . . . . . . . . . . . . . . . . . . . . . . . . . . . . . . . . . . . . . . . . . . . . . . . . 198
Hppj . . . . . . . . . . . . . . . . . . . . . . . . . . . . . . . . . . . . . . . . . . . . . . . . . . . . . 198
Imagen . . . . . . . . . . . . . . . . . . . . . . . . . . . . . . . . . . . . . . . . . . . . . . . . . . . 198
Jpeg . . . . . . . . . . . . . . . . . . . . . . . . . . . . . . . . . . . . . . . . . . . . . . . . . . . . . 198
Kyo . . . . . . . . . . . . . . . . . . . . . . . . . . . . . . . . . . . . . . . . . . . . . . . . . . . . . 199
Latex . . . . . . . . . . . . . . . . . . . . . . . . . . . . . . . . . . . . . . . . . . . . . . . . . . . . 199
Linux . . . . . . . . . . . . . . . . . . . . . . . . . . . . . . . . . . . . . . . . . . . . . . . . . . . . 200
Lua . . . . . . . . . . . . . . . . . . . . . . . . . . . . . . . . . . . . . . . . . . . . . . . . . . . . . 200
Lua tikz . . . . . . . . . . . . . . . . . . . . . . . . . . . . . . . . . . . . . . . . . . . . . . . . 200
14
gnuplot 4.7
CONTENTS
Mf . . . . . . . . . . . . . . . . . . . . . . . . . . . . . . . . . . . . . . . . . . . . . . . . . . . . . . 202
METAFONT Instructions . . . . . . . . . . . . . . . . . . . . . . . . . . . . . . . . . . . . . . 203
Mif . . . . . . . . . . . . . . . . . . . . . . . . . . . . . . . . . . . . . . . . . . . . . . . . . . . . . . 204
Mp . . . . . . . . . . . . . . . . . . . . . . . . . . . . . . . . . . . . . . . . . . . . . . . . . . . . . . 204
Metapost Instructions . . . . . . . . . . . . . . . . . . . . . . . . . . . . . . . . . . . . . . . . 206
Next . . . . . . . . . . . . . . . . . . . . . . . . . . . . . . . . . . . . . . . . . . . . . . . . . . . . . 206
Openstep (next) . . . . . . . . . . . . . . . . . . . . . . . . . . . . . . . . . . . . . . . . . . . . . . 207
Pbm . . . . . . . . . . . . . . . . . . . . . . . . . . . . . . . . . . . . . . . . . . . . . . . . . . . . . 207
Pdf . . . . . . . . . . . . . . . . . . . . . . . . . . . . . . . . . . . . . . . . . . . . . . . . . . . . . . 208
Pdfcairo . . . . . . . . . . . . . . . . . . . . . . . . . . . . . . . . . . . . . . . . . . . . . . . . . . . 208
Pm . . . . . . . . . . . . . . . . . . . . . . . . . . . . . . . . . . . . . . . . . . . . . . . . . . . . . . 209
Png . . . . . . . . . . . . . . . . . . . . . . . . . . . . . . . . . . . . . . . . . . . . . . . . . . . . . 210
Examples . . . . . . . . . . . . . . . . . . . . . . . . . . . . . . . . . . . . . . . . . . . . . . . 210
Pngcairo . . . . . . . . . . . . . . . . . . . . . . . . . . . . . . . . . . . . . . . . . . . . . . . . . . . 211
Postscript . . . . . . . . . . . . . . . . . . . . . . . . . . . . . . . . . . . . . . . . . . . . . . . . . . 211
Editing postscript . . . . . . . . . . . . . . . . . . . . . . . . . . . . . . . . . . . . . . . . . . 213
Postscript fontfile . . . . . . . . . . . . . . . . . . . . . . . . . . . . . . . . . . . . . . . . . . 214
Postscript prologue
. . . . . . . . . . . . . . . . . . . . . . . . . . . . . . . . . . . . . . . . . 215
Postscript adobeglyphnames . . . . . . . . . . . . . . . . . . . . . . . . . . . . . . . . . . . . 215
Pslatex and pstex . . . . . . . . . . . . . . . . . . . . . . . . . . . . . . . . . . . . . . . . . . . . . . 215
Pstricks . . . . . . . . . . . . . . . . . . . . . . . . . . . . . . . . . . . . . . . . . . . . . . . . . . . 217
Qms . . . . . . . . . . . . . . . . . . . . . . . . . . . . . . . . . . . . . . . . . . . . . . . . . . . . . 217
Qt . . . . . . . . . . . . . . . . . . . . . . . . . . . . . . . . . . . . . . . . . . . . . . . . . . . . . . 217
Regis . . . . . . . . . . . . . . . . . . . . . . . . . . . . . . . . . . . . . . . . . . . . . . . . . . . . . 218
Sun . . . . . . . . . . . . . . . . . . . . . . . . . . . . . . . . . . . . . . . . . . . . . . . . . . . . . 219
Svg . . . . . . . . . . . . . . . . . . . . . . . . . . . . . . . . . . . . . . . . . . . . . . . . . . . . . . 219
Svga . . . . . . . . . . . . . . . . . . . . . . . . . . . . . . . . . . . . . . . . . . . . . . . . . . . . . 219
Tek40 . . . . . . . . . . . . . . . . . . . . . . . . . . . . . . . . . . . . . . . . . . . . . . . . . . . . 219
Tek410x . . . . . . . . . . . . . . . . . . . . . . . . . . . . . . . . . . . . . . . . . . . . . . . . . . . 220
Texdraw . . . . . . . . . . . . . . . . . . . . . . . . . . . . . . . . . . . . . . . . . . . . . . . . . . . 220
Tgif . . . . . . . . . . . . . . . . . . . . . . . . . . . . . . . . . . . . . . . . . . . . . . . . . . . . . 220
Tikz . . . . . . . . . . . . . . . . . . . . . . . . . . . . . . . . . . . . . . . . . . . . . . . . . . . . . 221
Tkcanvas . . . . . . . . . . . . . . . . . . . . . . . . . . . . . . . . . . . . . . . . . . . . . . . . . . 221
Tpic . . . . . . . . . . . . . . . . . . . . . . . . . . . . . . . . . . . . . . . . . . . . . . . . . . . . . 222
Vgagl . . . . . . . . . . . . . . . . . . . . . . . . . . . . . . . . . . . . . . . . . . . . . . . . . . . . 222
VWS . . . . . . . . . . . . . . . . . . . . . . . . . . . . . . . . . . . . . . . . . . . . . . . . . . . . . 223
Vx384 . . . . . . . . . . . . . . . . . . . . . . . . . . . . . . . . . . . . . . . . . . . . . . . . . . . . 223
Windows . . . . . . . . . . . . . . . . . . . . . . . . . . . . . . . . . . . . . . . . . . . . . . . . . . 223
Graph-menu . . . . . . . . . . . . . . . . . . . . . . . . . . . . . . . . . . . . . . . . . . . . . 224
Printing . . . . . . . . . . . . . . . . . . . . . . . . . . . . . . . . . . . . . . . . . . . . . . . . 224
Text-menu . . . . . . . . . . . . . . . . . . . . . . . . . . . . . . . . . . . . . . . . . . . . . . 224
Wgnuplot.mnu . . . . . . . . . . . . . . . . . . . . . . . . . . . . . . . . . . . . . . . . . . . . 225
CONTENTS
gnuplot 4.7
15
Wgnuplot.ini . . . . . . . . . . . . . . . . . . . . . . . . . . . . . . . . . . . . . . . . . . . . . 225
Wxt . . . . . . . . . . . . . . . . . . . . . . . . . . . . . . . . . . . . . . . . . . . . . . . . . . . . . 226
X11 . . . . . . . . . . . . . . . . . . . . . . . . . . . . . . . . . . . . . . . . . . . . . . . . . . . . . 227
X11 fonts . . . . . . . . . . . . . . . . . . . . . . . . . . . . . . . . . . . . . . . . . . . . . . . 229
Command-line options . . . . . . . . . . . . . . . . . . . . . . . . . . . . . . . . . . . . . . . . 229
Monochrome options . . . . . . . . . . . . . . . . . . . . . . . . . . . . . . . . . . . . . . . . . 230
Color resources . . . . . . . . . . . . . . . . . . . . . . . . . . . . . . . . . . . . . . . . . . . . 230
Grayscale resources . . . . . . . . . . . . . . . . . . . . . . . . . . . . . . . . . . . . . . . . . 231
Line resources . . . . . . . . . . . . . . . . . . . . . . . . . . . . . . . . . . . . . . . . . . . . 231
X11 pm3d resources . . . . . . . . . . . . . . . . . . . . . . . . . . . . . . . . . . . . . . . . . 232
X11 other resources . . . . . . . . . . . . . . . . . . . . . . . . . . . . . . . . . . . . . . . . . 232
Xlib . . . . . . . . . . . . . . . . . . . . . . . . . . . . . . . . . . . . . . . . . . . . . . . . . . . . . 233
V
Bugs
233
Known limitations
233
External libraries
233
VI
233
Index
16
gnuplot 4.7
Part I
Gnuplot
Copyright
Copyright (C) 1986 - 1993, 1998, 2004, 2007
Thomas Williams, Colin Kelley
Permission to use, copy, and distribute this software and its documentation for any purpose with or without
fee is hereby granted, provided that the above copyright notice appear in all copies and that both that
copyright notice and this permission notice appear in supporting documentation.
Permission to modify the software is granted, but not the right to distribute the complete modified source
code. Modifications are to be distributed as patches to the released version. Permission to distribute binaries
produced by compiling modified sources is granted, provided you
1. distribute the corresponding source modifications from the
released version in the form of a patch file along with the binaries,
2. add special version identification to distinguish your version
in addition to the base release version number,
3. provide your name and address as the primary contact for the
support of your modified version, and
4. retain our contact information in regard to use of the base
software.
Permission to distribute the released version of the source code along with corresponding source modifications
in the form of a patch file is granted with same provisions 2 through 4 for binary distributions.
This software is provided "as is" without express or implied warranty to the extent permitted by applicable
law.
AUTHORS
Original Software:
Thomas Williams,
Colin Kelley.
Gnuplot 2.0 additions:
Russell Lang, Dave Kotz, John Campbell.
Gnuplot 3.0 additions:
Gershon Elber and many others.
Gnuplot 4.0 additions:
See list of contributors at head of this document.
Introduction
Gnuplot is a portable command-line driven graphing utility for Linux, OS/2, MS Windows, OSX, VMS,
and many other platforms. The source code is copyrighted but freely distributed (i.e., you don’t have to
pay for it). It was originally created to allow scientists and students to visualize mathematical functions and
data interactively, but has grown to support many non-interactive uses such as web scripting. It is also used
as a plotting engine by third-party applications like Octave. Gnuplot has been supported and under active
development since 1986.
Gnuplot supports many types of plots in either 2D and 3D. It can draw using lines, points, boxes, contours,
vector fields, surfaces, and various associated text. It also supports various specialized plot types.
Gnuplot supports many different types of output: interactive screen terminals (with mouse and hotkey
input), direct output to pen plotters or modern printers, and output to many file formats (eps, emf, fig, jpeg,
gnuplot 4.7
17
LaTeX, pdf, png, postscript, ...). Gnuplot is easily extensible to include new output modes. Recent additions
include interactive terminals based on wxWidgets (usable on multiple platforms), and Qt. Mouseable plots
embedded in web pages can be generated using the svg or HTML5 canvas terminal drivers.
The command language of gnuplot is case sensitive, i.e. commands and function names written in lowercase
are not the same as those written in capitals. All command names may be abbreviated as long as the
abbreviation is not ambiguous. Any number of commands may appear on a line, separated by semicolons
(;). Strings may be set off by either single or double quotes, although there are some subtle differences. See
syntax (p. 41) and quotes (p. 42) for more details. Examples:
load "filename"
cd ’dir’
Commands may extend over several input lines by ending each line but the last with a backslash (\). The
backslash must be the last character on each line. The effect is as if the backslash and newline were not there.
That is, no white space is implied, nor is a comment terminated. Therefore, commenting out a continued line
comments out the entire command (see comments (p. 22)). But note that if an error occurs somewhere
on a multi-line command, the parser may not be able to locate precisely where the error is and in that case
will not necessarily point to the correct line.
In this document, curly braces ({}) denote optional arguments and a vertical bar (|) separates mutually
exclusive choices. Gnuplot keywords or help topics are indicated by backquotes or boldface (where
available). Angle brackets (<>) are used to mark replaceable tokens. In many cases, a default value of the
token will be taken for optional arguments if the token is omitted, but these cases are not always denoted
with braces around the angle brackets.
For built-in help on any topic, type help followed by the name of the topic or help ? to get a menu of
available topics.
The new gnuplot user should begin by reading about plotting (if in an interactive session, type help
plotting).
See the simple.dem demo, also available together with other demos on the web page
http://www.gnuplot.info/demo/
Gnuplot can be started from a command line or from an icon according to the desktop environment.
Running it from command line can take the syntax
gnuplot {OPTIONS} file1 file2 ...
where file1, file2, etc. are input file as in the load command. On X11-based systems, you can use
gnuplot {X11OPTIONS} {OPTIONS} file1 file2 ...
see your X11 documentation and x11 (p. 227) in this document.
Options interpreted by gnuplot may come anywhere on the line. Files are executed in the order specified, as
are commands supplied by the -e option, for example
gnuplot
file1.in
-e "reset"
file2.in
The special filename "-" is used to force reading from stdin. Gnuplot exits after the last file is processed. If
no load files are named, Gnuplot takes interactive input from stdin. See help batch/interactive (p. 21)
for more details. The options specific to gnuplot can be listed by typing
gnuplot --help
See command line options (p. 21) for more details.
In sessions with an interactive plot window you can hit ’h’ anywhere on the plot for help about hotkeys and
mousing features. Section seeking-assistance will help you to find further information, help and FAQ.
Seeking-assistance
The canonical gnuplot web page can be found at
18
gnuplot 4.7
http://www.gnuplot.info
Before seeking help, please check file FAQ.pdf or the above website for
FAQ (Frequently Asked Questions) list.
If you need help as a gnuplot user, please use the newsgroup
comp.graphics.apps.gnuplot
We prefer that you read the messages through the newsgroup rather than subscribing to the mailing list
which is also available and carries the same set of messages. Instructions for subscribing to gnuplot mailing
lists may be found via the gnuplot development website on SourceForge
http://sourceforge.net/projects/gnuplot
The address for mailing to list members is:
[email protected]
Bug reports and code contributions should be uploaded to the trackers at
http://sourceforge.net/projects/gnuplot/support
Please check previous bug reports if the bug you want to report has not been already fixed in a newer version
of gnuplot.
A mailing list for those interested in development version of gnuplot is:
[email protected]
When posting a question, please include full details of the gnuplot version, the terminal type, and the
operating system you are using. A small script demonstrating the problem may be useful. Function plots
are preferable to datafile plots.
New features
This section lists major additions since version 4.4. For a more exhaustive list, see the NEWS file.
New syntax
This version of gnuplot introduces command iteration
and block-structured if/else/while/do constructs. See if
(p. 70), while (p. 175), and do (p. 62). Simple iteration is possible inside plot or set commands. See
iteration (p. 71). General iteration spanning multiple
1 term Fourier series
commands is possible using a block construct as shown
below. For a related new feature, see the summation
(p. 30) expression type. Here is an example using several of these new syntax features:
set multiplot layout 2,2
100 term Fourier series
fourier(k, x) = sin(3./2*k)/k * 2./3*cos(k*x)
do for [power = 0:3] {
TERMS = 10**power
set title sprintf("%g term Fourier series",TERMS)
plot 0.5 + sum [k=1:TERMS] fourier(k,x) notitle
}
unset multiplot
10 term Fourier series
1000 term Fourier series
It is now possible to select a column of data from a data file by matching a label in the first row of the file.
See columnhead (p. 27). For example
plot for [crop in "Oats Peas Beans"] ’data’ using "Year":crop
gnuplot 4.7
19
Local customization of linetypes
You can now customize properties (color, linewidth, point type) of the default sequence of linetypes used in
plotting. See set linetype (p. 124). This is normally done in an initialization file, either the system-wide
file gnuplotrc or a private file ˜ /.gnuplot. See initialization (p. 39).
Most terminals now allow you to set an explicit background color for the plot. The special linetype bgnd
can be used to draw in this color. See bgnd (p. 35).
New plot styles
See documentation for plot styles boxplot (p. 45), circles (p. 47), ellipses (p. 47), and fillsteps (p. 50).
Revised polar axes
Polar plot mode has been reworked to support additional plot styles. The polar axes can now be drawn and
labeled independent of the x and y axes. See set polar (p. 143) and set rrange (p. 145).
New smoothing algorithms
New smoothing algorithms have been added for both 2- and 3-dimensional plots. smooth kdensity and
smooth cumulative can be used with plot to draw smooth histograms and cumulative distribution functions. Several new smoothing kernels have been added to dgrid3d for use with splot. See smooth (p. 81)
dgrid3d (p. 109).
New time/date handling
Gnuplot now tracks time to millisecond precision. Time formats have been modified to match this. The new
built-in function time() returns the current time of day according to the system clock. Example: print the
current time to msec precision
print strftime("%H:%M:%.3S %d-%b-%Y",time(0.0))
18:15:04.253 16-Apr-2011
Statistical summary of data
The new stats command reads data from a file using the same syntax as the plot or splot commands.
Rather than drawing a graph, it prints out a statistical summary of the data contained in the column[s]
requested. The resulting statistics min, max, mean, standard deviation, correlation, etc. are also stored in
named variables that can be used to compose or modify subsequent plotting commands. See stats (p. 173).
New or revised terminal drivers
The qt driver implements an interactive terminal on top of the Qt graphics layer. It can function either as a
window in a full-featured desktop enviroment or as a full-screen application on a Qt-based embedded device.
The qt terminal is new and may still have some rough edges.
Two terminal types support web-based interactive display. The HTML5 canvas terminal was introduced
in version 4.4. The svg terminal has been extensively revised to include support for mousing and better
incorporation of svg plots from gnuplot into larger svg/xml documents.
The canvas terminal driver produces javascript output that draws onto the HTML canvas element of a web
page. It can produce either a complete web page containing a single plot, or a script that can be embedded
as part of an externally generated HTML document that perhaps contains multiple plots. The embedded
plots support browser-side mousing, including zoom/unzoom.
20
gnuplot 4.7
The lua terminal driver creates data intended to be further processed by a script in the lua programming
language. At this point only one such lua script, gnuplot-tikz.lua, is available. It produces a TeX document
suitable for use with the latex TikZ package. Other lua scripts could be written to process the gnuplot
output for use with other TeX packages, or with other non-TeX tools.
set term tikz is shorthand for set term lua tikz. As decribed above, it uses the generic lua terminal and
an external lua script to produce a latex document.
The context terminal driver creates output to be further processed by the ConTeXt TeX macro package.
To process its output, you additionally require the gnuplot module for ConTeXt available at
http://ctan.org/pkg/context-gnuplot
The epscairo terminal uses the cairo and pango libraries to create encapsulated postscript (eps) ouput. It
is an alternative to the postscript terminal driver for those who would like to have their eps files look equal
to e.g. screen output by the wxt terminal.
The cairolatex terminal uses the cairo backend of the pdfcairo or epscairo terminal to produce graphs
for inclusion in LaTeX documents. It creates pdf or eps graphics but transfers texts to LaTeX in the same
way as the epslatex terminal.
The windows terminal driver has been revised to suport transparency, antialiasing, buffered output, multiple
graph windows and copying to clipboard and saving of graphs as emf files. It has many new options and
a revised user interface. Additionaly, the code of the text console has been largely rewritten to support
wrapping of long lines. Help is now provided via HTML.
Backwards compatibility
New smoothing algorithms
New smoothing algorithms have been added for both 2- and 3-dimensional plots. smooth kdensity and
smooth cumulative can be used with plot to draw smooth histograms and cumulative distribution functions. Several new smoothing kernels have been added to dgrid3d for use with splot. See smooth (p. 81)
dgrid3d (p. 109).
New time/date handling
Gnuplot now tracks time to millisecond precision. Time formats have been modified to match this. The new
built-in function time() returns the current time of day according to the system clock. Example: print the
current time to msec precision
print strftime("%H:%M:%.3S %d-%b-%Y",time(0.0))
18:15:04.253 16-Apr-2011
Statistical summary of data
The new stats command reads data from a file using the same syntax as the plot or splot commands.
Rather than drawing a graph, it prints out a statistical summary of the data contained in the column[s]
requested. The resulting statistics min, max, mean, standard deviation, correlation, etc. are also stored in
named variables that can be used to compose or modify subsequent plotting commands. See stats (p. 173).
Gnuplot version 4.0 deprecated certain syntax used in earlier versions, but continued to recognize it. This
is now under the control of a configuration option, and can be enabled as follows:
./configure --enable-backwards-compatibility
Notice: Deprecated syntax items may be removed entirely in some future version of gnuplot.
One major difference is the introduction of keywords to disambiguate complex commands, particularly
commands containing string variables. A notable issue was the use of bare numbers to specify offsets, line
and point types. Illustrative examples:
Deprecated:
gnuplot 4.7
set title "Old" 0,-1
set data linespoints
plot 1 2 4
21
# horizontal line at y=1
New:
TITLE = "New"
set title TITLE offset char 0, char -1
set style data linespoints
plot 1 linetype 2 pointtype 4
Batch/Interactive Operation
Gnuplot may be executed in either batch or interactive modes, and the two may even be mixed together
on many systems.
Any command-line arguments are assumed to be either program options (first character is -) or names of
files containing gnuplot commands. The option -e "command" may be used to force execution of a gnuplot
command. Each file or command string will be executed in the order specified. The special filename "-" is
indicates that commands are to be read from stdin. Gnuplot exits after the last file is processed. If no load
files and no command strings are specified, gnuplot accepts interactive input from stdin.
Both the exit and quit commands terminate the current command file and load the next one, until all have
been processed.
Examples:
To launch an interactive session:
gnuplot
To launch a batch session using two command files "input1" and "input2":
gnuplot input1 input2
To launch an interactive session after an initialization file "header" and followed by another command file
"trailer":
gnuplot header - trailer
To give gnuplot commands directly in the command line, using the "-persist" option so that the plot remains
on the screen afterwards:
gnuplot -persist -e "set title ’Sine curve’; plot sin(x)"
To set user-defined variables a and s prior to executing commands from a file:
gnuplot -e "a=2; s=’file.png’" input.gpl
Canvas size
In earlier versions of gnuplot, some terminal types used the values from set size to control also the size of
the output canvas; others did not. The use of ’set size’ for this purpose was deprecated in version 4.2. Since
version 4.4 almost all terminals now behave as follows:
set term <terminal type> size <XX>, <YY> controls the size of the output file, or "canvas". Please
see individual terminal documentation for allowed values of the size parameters. By default, the plot will fill
this canvas.
set size <XX>, <YY> scales the plot itself relative to the size of the canvas. Scale values less than 1 will
cause the plot to not fill the entire canvas. Scale values larger than 1 will cause only a portion of the plot
to fit on the canvas. Please be aware that setting scale values larger than 1 may cause problems on some
terminal types.
22
gnuplot 4.7
The major exception to this convention is the PostScript driver, which by default continues to act as it has
in earlier versions. Be warned that the next version of gnuplot may change the default behaviour of the
PostScript driver as well.
Example:
set size 0.5, 0.5
set term png size 600, 400
set output "figure.png"
plot "data" with lines
These commands will produce an output file "figure.png" that is 600 pixels wide and 400 pixels tall. The
plot will fill the lower left quarter of this canvas. This is consistent with the way multiplot mode has always
worked.
Command-line-editing
Command-line editing and command history are supported using either an external gnu readline library,
an external BSD libedit library, or a built-in equivalent. This choice is a configuration option at the time
gnuplot is built.
The editing commands of the built-in version are given below. Please note that the action of the DEL key
is system-dependent. The gnu readline and BSD libedit libraries have their own documentation.
Character
^B
^F
^A
^E
^H
DEL
^D
^K
^L, ^R
^U
^W
^P
^N
Command-line Editing Commands
Function
Line Editing
move back a single character.
move forward a single character.
move to the beginning of the line.
move to the end of the line.
delete the previous character.
delete the current character.
delete current character. EOF if line is empty.
delete from current position to the end of line.
redraw line in case it gets trashed.
delete the entire line.
delete previous word.
History
move back through history.
move forward through history.
Comments
Comments are supported as follows: a # may appear in most places in a line and gnuplot will ignore the
rest of the line. It will not have this effect inside quotes, inside numbers (including complex numbers), inside
command substitutions, etc. In short, it works anywhere it makes sense to work.
See also set datafile commentschars (p. 108) for specifying comment characters in data files. Note that
if a comment line ends in ’\’ then the subsequent line is also treated as a comment.
Coordinates
The commands set arrow, set key, set label and set object allow you to draw something at an arbitrary
position on the graph. This position is specified by the syntax:
{<system>} <x>, {<system>} <y> {,{<system>} <z>}
gnuplot 4.7
23
Each <system> can either be first, second, graph, screen, or character.
first places the x, y, or z coordinate in the system defined by the left and bottom axes; second places it
in the system defined by the second axes (top and right); graph specifies the area within the axes — 0,0
is bottom left and 1,1 is top right (for splot, 0,0,0 is bottom left of plotting area; use negative z to get to
the base — see set xyplane (p. 165)); screen specifies the screen area (the entire area — not just the
portion selected by set size), with 0,0 at bottom left and 1,1 at top right; and character gives the position
in character widths and heights from the bottom left of the screen area (screen 0,0), character coordinates
depend on the chosen font size.
If the coordinate system for x is not specified, first is used. If the system for y is not specified, the one used
for x is adopted.
In some cases, the given coordinate is not an absolute position but a relative value (e.g., the second position
in set arrow ... rto). In most cases, the given value serves as difference to the first position. If the given
coordinate resides in a logarithmic axis the value is interpreted as factor. For example,
set logscale x
set arrow 100,5 rto 10,2
plots an arrow from position 100,5 to position 1000,7 since the x axis is logarithmic while the y axis is linear.
If one (or more) axis is timeseries, the appropriate coordinate should be given as a quoted time string
according to the timefmt format string. See set xdata (p. 158) and set timefmt (p. 155). Gnuplot
will also accept an integer expression, which will be interpreted as seconds from 1 January 2000.
Datastrings
Data files may contain string data consisting of either an arbitrary string of printable characters containing
no whitespace or an arbitrary string of characters, possibly including whitespace, delimited by double quotes.
The following sample line from a datafile is interpreted to contain four columns, with a text field in column
3:
1.000 2.000 "Third column is all of this text" 4.00
Text fields can be positioned within a 2-D or 3-D plot using the commands:
plot ’datafile’ using 1:2:4 with labels
splot ’datafile using 1:2:3:4 with labels
A column of text data can also be used to label the ticmarks along one or more of the plot axes. The example
below plots a line through a series of points with (X,Y) coordinates taken from columns 3 and 4 of the input
datafile. However, rather than generating regularly spaced tics along the x axis labeled numerically, gnuplot
will position a tic mark along the x axis at the X coordinate of each point and label the tic mark with text
taken from column 1 of the input datafile.
set xtics
plot ’datafile’ using 3:4:xticlabels(1) with linespoints
There is also an option that will interpret the first entry in a column of input data (i.e. the column heading)
as a text field, and use it as the key title for data plotted from that column. The example given below will
use the first entry in column 2 to generate a title in the key box, while processing the remainder of columns
2 and 4 to draw the required line:
plot ’datafile’ using 1:(f($2)/$4) with lines title columnhead(2)
Another example:
plot for [i=2:6] ’datafile’ using i title "Results for ".columnhead(i)
See set style labels (p. 55), using xticlabels (p. 86), plot title (p. 90), using (p. 84).
24
gnuplot 4.7
Enhanced text mode
Many terminal types support an enhanced text mode in which additional formatting information is embedded
in the text string. For example, "x^2" will write x-squared as we are used to seeing it, with a superscript 2.
This mode is normally selected when you set the terminal, e.g. "set term png enhanced", but may also be
toggled afterward using "set termoption enhanced", or by marking individual strings as in "set label ’x 2’
noenhanced".
Control
^
_
@
&
~
Enhanced Text
Example
Result
a^x
ax
a_x
ax
a@^b_{cd}
abcd
d&{space}b d
b
~a{.8-}
ã
Control Codes
Explanation
superscript
subscript
phantom box (occupies no width)
inserts space of specified length
overprints ’-’ on ’a’, raised by .8
times the current fontsize
Braces can be used to place multiple-character text where a single character is expected (e.g., 2^{10}). To
change the font and/or size, use the full form: {/[fontname][=fontsize | *fontscale] text}. Thus {/Symbol=20
G} is a 20 pt GAMMA and {/*0.75 K} is a K at three-quarters of whatever fontsize is currently in effect.
(The ’/’ character MUST be the first character after the ’{’.)
The phantom box is useful for a@^b c to align superscripts and subscripts but does not work well for
overwriting an accent on a letter. For the latter, it is much better to use an encoding (e.g. iso 8859 1 or
utf8) that contains a large variety of letters with accents or other diacritical marks. See set encoding
(p. 111). Since the box is non-spacing, it is sensible to put the shorter of the subscript or superscript in
the box (that is, after the @).
Space equal in length to a string can be inserted using the ’&’ character. Thus
’abc&{def}ghi’
would produce
’abc
ghi’.
The ’˜ ’ character causes the next character or bracketed text to be overprinted by the following character
or bracketed text. The second text will be horizontally centered on the first. Thus ’˜ a/’ will result in an
’a’ with a slash through it. You can also shift the second text vertically by preceding the second text with a
number, which will define the fraction of the current fontsize by which the text will be raised or lowered. In
this case the number and text must be enclosed in brackets because more than one character is necessary. If
the overprinted text begins with a number, put a space between the vertical offset and the text (’˜ {abc}{.5
000}’); otherwise no space is needed (’˜ {abc}{.5 — }’). You can change the font for one or both strings (’˜
a{.5 /*.2 o}’ — an ’a’ with a one-fifth-size ’o’ on top — and the space between the number and the slash is
necessary), but you can’t change it after the beginning of the string. Neither can you use any other special
syntax within either string. You can, of course, use control characters by escaping them (see below), such
as ’˜ a{\^}’
You can access special symbols numerically by specifying \character-code (in octal), e.g., {/Symbol \245}
is the symbol for infinity. This does not work for multibyte encodings like UTF-8, however. In a UTF-8
environment, you should be able to enter multibyte sequences implicitly by typing or otherwise selecting the
character you want.
You can escape control characters using \, e.g., \\, \{, and so on.
But be aware that strings in double-quotes are parsed differently than those enclosed in single-quotes. The
major difference is that backslashes may need to be doubled when in double-quoted strings.
Examples (these are hard to describe in words — try them!):
set xlabel ’Time (10^6 {/Symbol m}s)’
set title ’{/Symbol=18 \\362@_{/=9.6 0}^{/=12 x}} \\
{/Helvetica e^{-{/Symbol m}^2/2} d}{/Symbol m}’
The file "ps guide.ps" in the /docs/psdoc subdirectory of the gnuplot source distribution contains more
examples of the enhanced syntax.
gnuplot 4.7
25
Environment
A number of shell environment variables are understood by gnuplot. None of these are required, but may
be useful.
If GNUTERM is defined, it is used as the name of the terminal type to be used. This overrides any terminal
type sensed by gnuplot on start-up, but is itself overridden by the .gnuplot (or equivalent) start-up file (see
startup (p. 39)) and, of course, by later explicit changes.
GNUHELP may be defined to be the pathname of the HELP file (gnuplot.gih).
On VMS, the logical name GNUPLOT$HELP should be defined as the name of the help library for gnuplot.
The gnuplot help can be put inside any system help library, allowing access to help from both within and
outside gnuplot if desired.
On Unix, HOME is used as the name of a directory to search for a .gnuplot file if none is found in the current
directory. On MS-DOS, Windows and OS/2, GNUPLOT is used. On Windows, the NT-specific variable
USERPROFILE is also tried. VMS, SYS$LOGIN: is used. Type help startup.
On Unix, PAGER is used as an output filter for help messages.
On Unix, SHELL is used for the shell command. On MS-DOS and OS/2, COMSPEC is used for the shell
command.
FIT SCRIPT may be used to specify a gnuplot command to be executed when a fit is interrupted — see
fit (p. 63). FIT LOG specifies the default filename of the logfile maintained by fit.
GNUPLOT LIB may be used to define additional search directories for data and command files. The variable
may contain a single directory name, or a list of directories separated by a platform-specific path separator,
eg. ’:’ on Unix, or ’;’ on DOS/Windows/OS/2 platforms. The contents of GNUPLOT LIB are appended to
the loadpath variable, but not saved with the save and save set commands.
Several gnuplot terminal drivers access TrueType fonts via the gd library. For these drivers the font search
path is controlled by the environmental variable GDFONTPATH. Furthermore, a default font for these
drivers may be set via the environmental variable GNUPLOT DEFAULT GDFONT.
The postscript terminal uses its own font search path. It is controlled by the environmental variable GNUPLOT FONTPATH. The format is the same as for GNUPLOT LIB. The contents of GNUPLOT FONTPATH are appended to the fontpath variable, but not saved with the save and save set
commands.
GNUPLOT PS DIR is used by the postscript driver to search for external prologue files. Depending on the
build process, gnuplot contains either a built-in copy of those files or a default hardcoded path. You can
use this variable have the postscript terminal use custom prologue files rather than the default files. See
postscript prologue (p. 215).
Expressions
In general, any mathematical expression accepted by C, FORTRAN, Pascal, or BASIC is valid. The precedence of these operators is determined by the specifications of the C programming language. White space
(spaces and tabs) is ignored inside expressions.
Complex constants are expressed as {<real>,<imag>}, where <real> and <imag> must be numerical
constants. For example, {3,2} represents 3 + 2i; {0,1} represents ’i’ itself. The curly braces are explicitly
required here.
Note that gnuplot uses both "real" and "integer" arithmetic, like FORTRAN and C. Integers are entered as
"1", "-10", etc; reals as "1.0", "-10.0", "1e1", 3.5e-1, etc. The most important difference between the two
forms is in division: division of integers truncates: 5/2 = 2; division of reals does not: 5.0/2.0 = 2.5. In
mixed expressions, integers are "promoted" to reals before evaluation: 5/2e0 = 2.5. The result of division
of a negative integer by a positive one may vary among compilers. Try a test like "print -5/2" to determine
if your system chooses -2 or -3 as the answer.
The integer expression "1/0" may be used to generate an "undefined" flag, which causes a point to ignored.
26
gnuplot 4.7
Or you can use the pre-defined variable NaN to achieve the same result. See using (p. 84) for an example.
The real and imaginary parts of complex expressions are always real, whatever the form in which they are
entered: in {3,2} the "3" and "2" are reals, not integers.
Gnuplot can also perform simple operations on strings and string variables. For example, the expression
("A" . "B" eq "AB") evaluates as true, illustrating the string concatenation operator and the string equality
operator.
A string which contains a numerical value is promoted to the corresponding integer or real value if used in
a numerical expression. Thus ("3" + "4" == 7) and (6.78 == "6.78") both evaluate to true. An integer,
but not a real or complex value, is promoted to a string if used in string concatenation. A typical case is
the use of integers to construct file names or other strings; e.g. ("file" . 4 eq "file4") is true.
Substrings can be specified using a postfixed range descriptor [beg:end]. For example, "ABCDEF"[3:4] ==
"CD" and "ABCDEF"[4:*] == "DEF" The syntax "string"[beg:end] is exactly equivalent to calling the
built-in string-valued function substr("string",beg,end), except that you cannot omit either beg or end from
the function call.
Functions
The math functions in gnuplot are the same as the corresponding functions in the Unix math library, except
that all functions accept integer, real, and complex arguments unless otherwise noted. Functions that accept
or return angles (e.g. sin(x), cos(x), arg(z)) treat angle values as radians, but this may be changed to degrees
using the command set angles.
Function
abs(x)
abs(x)
acos(x)
acosh(x)
airy(x)
arg(x)
asin(x)
asinh(x)
atan(x)
atan2(y,x)
atanh(x)
EllipticK(k)
EllipticE(k)
EllipticPi(n,k)
besj0(x)
besj1(x)
besy0(x)
besy1(x)
ceil(x)
cos(x)
cosh(x)
erf(x)
erfc(x)
exp(x)
expint(n,x)
floor(x)
gamma(x)
ibeta(p,q,x)
inverf(x)
Math library functions
Arguments
Returns
any
absolute value
p of x, |x|; same type
complex
length of x, real(x)2 + imag(x)2
any
cos−1 x (inverse cosine)
any
cosh−1 x (inverse hyperbolic cosine) in radians
any
Airy function Ai(x)
complex
the phase of x
any
sin−1 x (inverse sin)
any
sinh−1 x (inverse hyperbolic sin) in radians
any
tan−1 x (inverse tangent)
int or real
tan−1 (y/x) (inverse tangent)
any
tanh−1 x (inverse hyperbolic tangent) in radians
real k ∈ (-1:1)
K(k) complete elliptic integral of the first kind
real k ∈ [-1:1]
E(k) complete elliptic integral of the second kind
real n<1, real k ∈ (-1:1) Π(n, k) complete elliptic integral of the third kind
int or real
j0 Bessel function of x, in radians
int or real
j1 Bessel function of x, in radians
int or real
y0 Bessel function of x, in radians
int or real
y1 Bessel function of x, in radians
any
dxe, smallest integer not less than x (real part)
any
cos x, cosine of x
any
cosh x, hyperbolic cosine of x in radians
any
erf(real(x)), error function of real(x)
any
erfc(real(x)), 1.0 - error function of real(x)
any
ex , exponential
function of x
R∞
int n ≥ 0, real x ≥ 0
En (x) = 1 t−n e−xt dt, exponential integral of x
any
bxc, largest integer not greater than x (real part)
any
gamma(real(x)), gamma function of real(x)
any
ibeta(real(p, q, x)), ibeta function of real(p,q,x)
any
inverse error function of real(x)
gnuplot 4.7
Function
igamma(a,x)
imag(x)
invnorm(x)
int(x)
lambertw(x)
lgamma(x)
log(x)
log10(x)
norm(x)
rand(x)
real(x)
sgn(x)
sin(x)
sinh(x)
sqrt(x)
tan(x)
tanh(x)
voigt(x,y)
Arguments
any
complex
any
real
real
any
any
any
any
int
any
any
any
any
any
any
any
real
Function
gprintf(”format”,x,...)
sprintf(”format”,x,...)
strlen(”string”)
strstrt(”string”,”key”)
substr(”string”,beg,end)
strftime(”timeformat”,t)
strptime(”timeformat”,s)
system(”command”)
word(”string”,n)
words(”string”)
Function
column(x)
columnhead(x)
defined(X)
exists(”X”)
stringcolumn(x)
timecolumn(x)
tm hour(x)
tm mday(x)
tm min(x)
tm mon(x)
tm sec(x)
tm wday(x)
tm yday(x)
tm year(x)
time(x)
valid(x)
value(”name”)
Math library functions
Returns
igamma(real(a, x)), igamma function of real(a,x)
imaginary part of x as a real number
inverse normal distribution function of real(x)
integer part of x, truncated toward zero
Lambert W function
lgamma(real(x)), lgamma function of real(x)
loge x, natural logarithm (base e) of x
log10 x, logarithm (base 10) of x
normal distribution (Gaussian) function of real(x)
pseudo random number in the interval [0:1]
real part of x
1 if x > 0, -1 if x < 0, 0 if x = 0. imag(x) ignored
sin x, sine of x
sinh x, hyperbolic sine of x in radians
√
x, square root of x
tan x, tangent of x
tanh x, hyperbolic tangent of x in radians
R exp(t2 )
Voigt/Faddeeva function πy (x−t)
2 +y 2 dt
String functions
Arguments Returns
any
string result from applying gnuplot’s format parser
multiple
string result from C-language sprintf
string
int length of string in bytes
strings
int index of first character of substring ”key”
multiple
string ”string”[beg:end]
any
string result from applying gnuplot’s time parser
string
seconds since year 2000 as given in string s
string
string containing output stream of shell command
string, int returns the nth word in ”string”
string
returns the number of words in ”string”
other gnuplot functions
Arguments
Returns
int or string
column x during datafile manipulation.
int
string containing first entry of column x in datafile.
variable name [DEPRECATED] returns 1 if X is defined, 0 otherwise.
string
returns 1 if a variable named X is defined, 0 otherwise.
int or string
content of column x as a string.
int
timecolumn x during datafile manipulation.
int
the hour
int
the day of the month
int
the minute
int
the month
int
the second
int
the day of the week
int
the day of the year
int
the year
any
the current system time
int
test validity of column(x) during datafile manip.
string
returns the value of the named variable.
27
28
gnuplot 4.7
Elliptic integrals
The EllipticK(k) function returns the complete elliptic integral of the first kind, i.e. the definite integral
between 0 and pi/2 of the function (1-(k*sin(p))**2)**(-0.5). The domain of k is -1 to 1 (exclusive).
The EllipticE(k) function returns the complete elliptic integral of the second kind, i.e. the definite integral
between 0 and pi/2 of the function (1-(k*sin(p))**2)**0.5. The domain of k is -1 to 1 (inclusive).
The EllipticPi(n,k) function returns the complete elliptic integral of the third kind, i.e. the definite integral
between 0 and pi/2 of the function (1-(k*sin(p))**2)**(-0.5)/(1-n*sin(p)**2). The parameter n must
be less than 1, while k must lie between -1 and 1 (exclusive). Note that by definition EllipticPi(0,k) ==
EllipticK(k) for all possible values of k.
Random number generator
The function rand() produces a sequence of pseudo-random numbers between 0 and 1 using an algorithm
from P. L’Ecuyer and S. Cote, "Implementing a random number package with splitting facilities", ACM
Transactions on Mathematical Software, 17:98-111 (1991).
rand(0)
returns a pseudo random number in the interval [0:1]
generated from the current value of two internal
32-bit seeds.
rand(-1)
resets both seeds to a standard value.
rand(x)
for integer 0 < x < 2^31-1 sets both internal seeds
to x.
rand({x,y}) for integer 0 < x,y < 2^31-1 sets seed1 to x and
seed2 to y.
Value
B = value("A") is effectively the same as B = A, where A is the name of a user-defined variable. This is
useful when the name of the variable is itself held in a string variable. See user-defined variables (p. 31).
It also allows you to read the name of a variable from a data file. If the argument is a numerical expression,
value() returns the value of that expression. If the argument is a string that does not correspond to a
currently defined variable, value() returns NaN.
Operators
The operators in gnuplot are the same as the corresponding operators in the C programming language,
except that all operators accept integer, real, and complex arguments, unless otherwise noted. The **
operator (exponentiation) is supported, as in FORTRAN.
Parentheses may be used to change order of evaluation.
Unary
The following is a list of all the unary operators and their usages:
Symbol
+
~
!
!
$
Example
-a
+a
~a
!a
a!
$3
Unary Operators
Explanation
unary minus
unary plus (no-operation)
* one’s complement
* logical negation
* factorial
* call arg/column during ‘using‘ manipulation
gnuplot 4.7
29
(*) Starred explanations indicate that the operator requires an integer argument.
Operator precedence is the same as in Fortran and C. As in those languages, parentheses may be used to
change the order of operation. Thus -2**2 = -4, but (-2)**2 = 4.
The factorial operator returns a real number to allow a greater range.
Binary
The following is a list of all the binary operators and their usages:
Symbol
**
*
/
%
+
==
!=
<
<=
>
>=
&
^
|
&&
||
=
,
.
eq
ne
Binary
Example
a**b
a*b
a/b
a%b
a+b
a-b
a==b
a!=b
a<b
a<=b
a>b
a>=b
a&b
a^b
a|b
a&&b
a||b
a = b
(a,b)
A.B
A eq B
A ne B
Operators
Explanation
exponentiation
multiplication
division
* modulo
addition
subtraction
equality
inequality
less than
less than or equal to
greater than
greater than or equal to
* bitwise AND
* bitwise exclusive OR
* bitwise inclusive OR
* logical AND
* logical OR
assignment
serial evaluation
string concatenation
string equality
string inequality
(*) Starred explanations indicate that the operator requires integer arguments. Capital letters A and B
indicate that the operator requires string arguments.
Logical AND (&&) and OR (||) short-circuit the way they do in C. That is, the second && operand is not
evaluated if the first is false; the second || operand is not evaluated if the first is true.
Serial evaluation occurs only in parentheses and is guaranteed to proceed in left to right order. The value of
the rightmost subexpression is returned.
Ternary
There is a single ternary operator:
Symbol
?:
Ternary Operator
Example Explanation
a?b:c
ternary operation
The ternary operator behaves as it does in C. The first argument (a), which must be an integer, is evaluated.
If it is true (non-zero), the second argument (b) is evaluated and returned; otherwise the third argument (c)
is evaluated and returned.
The ternary operator is very useful both in constructing piecewise functions and in plotting points only when
certain conditions are met.
30
gnuplot 4.7
Examples:
Plot a function that is to equal sin(x) for 0 <= x < 1, 1/x for 1 <= x < 2, and undefined elsewhere:
f(x) = 0<=x && x<1 ? sin(x) : 1<=x && x<2 ? 1/x : 1/0
plot f(x)
Note that gnuplot quietly ignores undefined values, so the final branch of the function (1/0) will produce
no plottable points. Note also that f(x) will be plotted as a continuous function across the discontinuity if
a line style is used. To plot it discontinuously, create separate functions for the two pieces. (Parametric
functions are also useful for this purpose.)
For data in a file, plot the average of the data in columns 2 and 3 against the datum in column 1, but only
if the datum in column 4 is non-negative:
plot ’file’ using 1:( $4<0 ? 1/0 : ($2+$3)/2 )
For an explanation of the using syntax, please see plot datafile using (p. 84).
Summation
A summation expression has the form
sum [<var> = <start> : <end>] <expression>
<var> is treated as an integer variable that takes on successive integral values from <start> to <end>. For
each of these, the current value of <expression> is added to a running total whose final value becomes the
value of the summation expression. Examples:
print sum [i=1:10] i
55.
# Equivalent to plot ’data’ using 1:($2+$3+$4+$5+$6+...)
plot ’data’ using 1 : (sum [col=2:MAXCOL] column(col))
It is not necessary that <expression> contain the variable <var>. Although <start> and <end> can be
specified as variables or expressions, their value cannot be changed dynamically as a side-effect of carrying
out the summation. If <end> is less than <start> then the value of the summation is zero.
Gnuplot-defined variables
Gnuplot maintains a number of read-only variables that reflect the current internal state of the program and
the most recent plot. These variables begin with the prefix "GPVAL ". Examples include GPVAL TERM,
GPVAL X MIN, GPVAL X MAX, GPVAL Y MIN. Type show variables all to display the complete list
and current values. Values related to axes parameters (ranges, log base) are values used during the last plot,
not those currently set.
Example: To calculate the fractional screen coordinates of the point [X,Y]
GRAPH_X = (X - GPVAL_X_MIN) / (GPVAL_X_MAX - GPVAL_X_MIN)
GRAPH_Y = (Y - GPVAL_Y_MIN) / (GPVAL_Y_MAX - GPVAL_Y_MIN)
SCREEN_X = GPVAL_TERM_XMIN + GRAPH_X * (GPVAL_TERM_XMAX - GPVAL_TERM_XMIN)
SCREEN_Y = GPVAL_TERM_YMIN + GRAPH_Y * (GPVAL_TERM_YMAX - GPVAL_TERM_YMIN)
FRAC_X = SCREEN_X / GPVAL_TERM_XSIZE
FRAC_Y = SCREEN_Y / GPVAL_TERM_YSIZE
The read-only variable GPVAL ERRNO is set to a non-zero value if any gnuplot command terminates early
due to an error. The most recent error message is stored in the string variable GPVAL ERRMSG. Both
GPVAL ERRNO and GPVAL ERRMSG can be cleared using the command reset errors.
Interactive terminals with mouse functionality maintain read-only variables with the prefix "MOUSE ".
See mouse variables (p. 38) for details.
The fit mechanism uses several variables with names that begin "FIT ". It is safest to avoid using such
names. "FIT LIMIT", however, is one that you may wish to redefine. Under set fit errorvariables,
gnuplot 4.7
31
the error for each fitted parameter will be stored in a variable named like the parameter, but with " err"
appended. See the documentation on fit (p. 63) for details.
See user-defined variables (p. 31), reset errors (p. 95), mouse variables (p. 38), and fit (p. 63).
User-defined variables and functions
New user-defined variables and functions of one through twelve variables may be declared and used anywhere,
including on the plot command itself.
User-defined function syntax:
<func-name>( <dummy1> {,<dummy2>} ... {,<dummy12>} ) = <expression>
where <expression> is defined in terms of <dummy1> through <dummy12>.
User-defined variable syntax:
<variable-name> = <constant-expression>
Examples:
w = 2
q = floor(tan(pi/2 - 0.1))
f(x) = sin(w*x)
sinc(x) = sin(pi*x)/(pi*x)
delta(t) = (t == 0)
ramp(t) = (t > 0) ? t : 0
min(a,b) = (a < b) ? a : b
comb(n,k) = n!/(k!*(n-k)!)
len3d(x,y,z) = sqrt(x*x+y*y+z*z)
plot f(x) = sin(x*a), a = 0.2, f(x), a = 0.4, f(x)
file = "mydata.inp"
file(n) = sprintf("run_%d.dat",n)
The final two examples illustrate a user-defined string variable and a user-defined string function.
Note that the variables pi (3.14159...) and NaN (IEEE "Not a Number") are already defined. You can
redefine these to something else if you really need to. The original values can be recovered by setting:
NaN = GPVAL_NaN
pi = GPVAL_pi
Other variables may be defined under various gnuplot operations like mousing in interactive terminals or
fitting; see gnuplot-defined variables (p. 30) for details.
You can check for existence of a given variable V by the exists("V") expression. For example
a = 10
if (exists("a")) print "a is defined"
if (!exists("b")) print "b is not defined"
Valid names are the same as in most programming languages: they must begin with a letter, but subsequent
characters may be letters, digits, or " ".
Each function definition is made available as a special string-valued variable with the prefix ’GPFUN ’.
Example:
set label GPFUN_sinc at graph .05,.95
See show functions (p. 115), functions (p. 88), gnuplot-defined variables (p. 30), macros (p. 40),
value (p. 28).
32
gnuplot 4.7
Fonts
Gnuplot does not provide any fonts of its own. It relies on external font handling, the details of which
unfortunately vary from one terminal type to another. Brief documentation of font mechanisms that apply
to more than one terminal type is given here. For information on font use by other individual terminals, see
the documentation for that terminal.
Cairo (pdfcairo, pngcairo, epscairo, wxt terminals)
Sorry, this section is under construction. These terminals find and access fonts using the external fontconfig
tool set. Please see the
fontconfig user manual.
It is usually sufficient in gnuplot to request a font by a generic name and size, letting fontconfig substitute
a similar font if necessary. The following will probably all work:
set term pdfcairo font "sans,12"
set term pdfcairo font "Times,12"
set term pdfcairo font "Times-New-Roman,12"
Gd (png, gif, jpeg terminals)
Font handling for the png, gif, and jpeg terminals is done by the external library libgd. Five basic fonts are
provided directly by libgd. These are tiny (5x8 pixels), small (6x12 pixels), medium, (7x13 Bold), large
(8x16) or giant (9x15 pixels). These fonts cannot be scaled or rotated. Use one of these keywords instead
of the font keyword. E.g.
set term png tiny
On most systems libgd also provides access to Adobe Type 1 fonts (*.pfa) and TrueType fonts (*.ttf). You
must give the name of the font file, not the name of the font inside it, in the form "<face> {,<pointsize>}".
<face> is either the full pathname to the font file, or the first part of a filename in one of the directories
listed in the GDFONTPATH environmental variable. That is, ’set term png font "Face"’ will look for a font
file named either <somedirectory>/Face.ttf or <somedirectory>/Face.pfa. For example, if GDFONTPATH
contains /usr/local/fonts/ttf:/usr/local/fonts/pfa then the following pairs of commands are equivalent
set
set
set
set
term
term
term
term
png
png
png
png
font
font
font
font
"arial"
"/usr/local/fonts/ttf/arial.ttf"
"Helvetica"
"/usr/local/fonts/pfa/Helvetica.pfa"
To request a default font size at the same time:
set term png font "arial,11"
Both TrueType and Adobe Type 1 fonts are fully scalable and rotatable. If no specific font is requested in
the "set term" command, gnuplot checks the environmental variable GNUPLOT DEFAULT GDFONT to
see if there is a preferred default font.
Postscript (also encapsulated postscript *.eps)
PostScript font handling is done by the printer or viewing program. Gnuplot can create valid PostScript or
encapsulated PostScript (*.eps) even if no fonts at all are installed on your computer. Gnuplot simply refers
to the font by name in the output file, and assumes that the printer or viewing program will know how to
find or approximate a font by that name.
All PostScript printers or viewers should know about the standard set of Adobe fonts Times-Roman,
Helvetica, Courier, and Symbol. It is likely that many additional fonts are also available, but the specific
gnuplot 4.7
33
set depends on your system or printer configuration. Gnuplot does not know or care about this; the output
*.ps or *.eps files that it creates will simply refer to whatever font names you request.
Thus
set term postscript eps font "Times-Roman,12"
will produce output that is suitable for all printers and viewers.
On the other hand
set term postscript eps font "Garamond-Premier-Pro-Italic"
will produce an output file that contains valid PostScript, but since it refers to a specialized font, only some
printers or viewers will be able to display the specific font that was requested. Most will substitute a different
font.
However, it is possible to embed a specific font in the output file so that all printers will be able to use it.
This requires that the a suitable font description file is available on your system. Note that some font files
require specific licensing if they are to be embedded in this way. See postscript fontfile (p. 214) for more
detailed description and examples.
Glossary
Throughout this document an attempt has been made to maintain consistency of nomenclature. This cannot
be wholly successful because as gnuplot has evolved over time, certain command and keyword names have
been adopted that preclude such perfection. This section contains explanations of the way some of these
terms are used.
A "page" or "screen" or "canvas" is the entire area addressable by gnuplot. On a desktop it is a full
window; on a plotter, it is a single sheet of paper; in svga mode it is the full monitor screen.
A screen may contain one or more "plots". A plot is defined by an abscissa and an ordinate, although these
need not actually appear on it, as well as the margins and any text written therein.
A plot contains one "graph". A graph is defined by an abscissa and an ordinate, although these need not
actually appear on it.
A graph may contain one or more "lines". A line is a single function or data set. "Line" is also a plotting
style. The word will also be used in sense "a line of text". Presumably the context will remove any ambiguity.
The lines on a graph may have individual names. These may be listed together with a sample of the plotting
style used to represent them in the "key", sometimes also called the "legend".
The word "title" occurs with multiple meanings in gnuplot. In this document, it will always be preceded by
the adjective "plot", "line", or "key" to differentiate among them. A 2D graph may have up to four labeled
axes. The names of the four axes are "x" for the axis along the bottom border of the plot, "y" for the axis
along the left border, "x2" for the top border, and "y2" for the right border. See axes (p. 73).
A 3D graph may have up to three labeled axes – "x", "y" and "z". It is not possible to say where on the
graph any particular axis will fall because you can change the direction from which the graph is seen with
set view.
When discussing data files, the term "record" will be resurrected and used to denote a single line of text
in the file, that is, the characters between newline or end-of-record characters. A "point" is the datum
extracted from a single record. A "datablock" is a set of points from consecutive records, delimited by blank
records. A line, when referred to in the context of a data file, is a subset of a datablock.
Linetypes, colors, and styles
Each gnuplot terminal type provides a set of distinct "linetypes". These may differ in color, in thickness,
in dot/dash pattern, or in some combination of color and dot/dash. The default linetypes for a particular
terminal can be previewed by issuing the test command after setting the terminal type. The pre-defined
colors and dot/dash patterns are not guaranteed to be consistent for all terminal types, but all terminals use
34
gnuplot 4.7
the special linetype -1 to mean a solid line in the primary foreground color (normally black). Most terminals
also recognize the special linetype "bgnd" to mean a solid line in the background color.
You can redefine the default linetype properties either interactively or via an initialization file. This allows
you to customize the colors and other properties of the lines used by all gnuplot plotting commands. See
set linetype (p. 124).
By default, successive functions or datafiles plotted by a single command will be assigned successive linetypes.
You can override this default sequence by specifying a particular linetype for any function, datafile, or plot
element.
Examples:
plot "foo", "bar"
plot sin(x) linetype 4
plot sin(x) lt -1
# plot two files using linetypes 1, 2
# terminal-specific linetype color 4
# black
For many terminal types it is also possible to assign user-defined colors using explicit rgb (red, green, blue)
values, named colors, or color values that refer to the current pm3d palette.
Examples:
plot sin(x) lt rgb "violet"
plot sin(x) lt rgb "#FF00FF"
plot sin(x) lt palette cb -45
plot sin(x) lt palette frac 0.3
#
#
#
#
#
one of gnuplot’s named colors
explicit RGB triple in hexadecimal
whatever color corresponds to -45
in the current cbrange of the palette
fractional value along the palette
See show colornames (p. 105), set palette (p. 138), cbrange (p. 168).
For terminals that support dot/dash patterns, each default linetype has both a dot-dash pattern and a
default color. Gnuplot does not currently provide a mechanism for changing the dot-dash pattern, so if you
want both a particular dash pattern and a particular color you must first choose a linetype that has the
required dash pattern, then override the default color using the keyword linecolor, abbreviated lc. For
example, the postscript terminal provides a dashed blue line as linetype 3. The plot commands below use
this same dash pattern for three plots, one in blue (the default), another in red (the default for linetype 1),
and a third in gold.
Example:
set term postscript dashed color
plot ’foo’ lt 3, ’baz’ lt 3 linecolor 1, ’bar’ lt 3 lc rgb ’gold’
Colorspec
Many commands allow you to specify a linetype with an explicit color. Terminal-independent color choice
is only possible for terminals that support RGB color or pm3d palettes.
Syntax:
... {linecolor | lc} {<colorspec> | <n>}
... {textcolor | tc} {<colorspec> | {linetype | lt} <n>}
where <colorspec> has one of the following forms:
rgbcolor "colorname"
rgbcolor "#RRGGBB"
rgbcolor variable
palette frac <val>
palette cb <value>
palette z
variable
# color is read from input file
# <val> runs from 0 to 1
# <val> lies within cbrange
# color index is read from input file
gnuplot 4.7
35
The "<n>" is the linetype number the color of which is used, see test (p. 174).
"colorname" refers to one of the color names built in to gnuplot. For a list of the available names, see show
colornames (p. 105).
"#RRGGBB" is a hexadecimal constant preceded by the "#" symbol. The RRGGBB represents the red,
green, and blue components of the color, each on a scale from 0 - 255. For example, magenta = full-scale
red + full-scale blue would be represented by #FF00FF, which is the hexadecimal representation of (255
<< 16) + (0 << 8) + (255).
The color palette is a linear gradient of colors that smoothly maps a single numerical value onto a particular
color. Two such mappings are always in effect. palette frac maps a fractional value between 0 and 1 onto
the full range of the color palette. palette cb maps the range of the color axis onto the same palette. See
set cbrange (p. 168). See also set colorbox (p. 105). You can use either of these to select a constant
color from the current palette.
"palette z" maps the z value of each plot segment or plot element into the cbrange mapping of the palette.
This allows smoothly-varying color along a 3d line or surface. It also allows coloring 2D plots by palette
values read from an extra column of data (not all 2D plot styles allow an extra column).
Background color
Most terminals now allow you to set an explicit background color for the plot. The special linetype bgnd
will draw in this color, and bgnd is also recognized as a color. Examples:
# This will erase a section of the canvas by writing over it in the
# background color
set term wxt background rgb "gray75"
set object 1 rectangle from x0,y0 to x1,y1 fillstyle solid fillcolor bgnd
# This will draw an "invisible" line along the x axis
plot 0 lt bgnd
Linecolor variable
lc variable tells the program to use the value read from one column of the input data as a linetype index,
and use the color belonging to that linetype. This requires a corresponding additional column in the using
specifier. Text colors can be set similarly using tc variable.
Examples:
# Use the third column of data to assign colors to individual points
plot ’data’ using 1:2:3 with points lc variable
# A single data file may contain multiple sets of data, separated by two
# blank lines. Each data set is assigned as index value (see ‘index‘)
# that can be retrieved via the ‘using‘ specifier ‘column(-2)‘.
# See ‘pseudocolumns‘. This example uses to value in column -2 to
# draw each data set in a different line color.
plot ’data’ using 1:2:(column(-2)) with lines lc variable
Rgbcolor variable
You can assign a separate color for each data point, line segment, or label in your plot. lc rgbcolor variable
tells the program to read RGB color information for each line in the data file. This requires a corresponding
additional column in the using specifier. The extra column is interpreted as a 24-bit packed RGB triple.
If the value is provided directly in the data file it is easiest to give it as a hexidecimal value (see rgbcolor
(p. 34)). Alternatively, the using specifier can contain an expression that evaluates to a 24-bit RGB color
as in the example below. Text colors are similarly set using tc rgbcolor variable.
Example:
36
gnuplot 4.7
# Place colored points in 3D at the x,y,z coordinates corresponding to
# their red, green, and blue components
rgb(r,g,b) = 65536 * int(r) + 256 * int(g) + int(b)
splot "data" using 1:2:3:(rgb($1,$2,$3)) with points lc rgb variable
Linestyles vs linetypes
Lines can have additional properties such as linewidth. You can associate these various properties, as well
as equivalent properties for point symbols, into user-defined "linestyles" using the command set style line.
Once you have defined a linestyle, you can use it in a plot command to control the appearance of one or
more plot elements.
Whereas linetypes are permanent (they last until you explicitly redefine them), linestyles are temporary.
They only last until the next reset of the graphics state.
Examples:
# define a new line style with terminal-independent color cyan,
# linewidth 3, and associated point type 6 (a circle with a dot in it).
set style line 5 lt rgb "cyan" lw 3 pt 6
plot sin(x) with linespoints ls 5
# user-defined line style 5
Mouse input
Many terminals allow interaction with the current plot using the mouse. Some also support the definition
of hotkeys to activate pre-defined functions by hitting a single key while the mouse focus is in the active
plot window. It is even possible to combine mouse input with batch command scripts, by invoking the
command pause mouse and then using the mouse variables returned by mouse clicking as parameters for
subsequent scripted actions. See bind (p. 36) and mouse variables (p. 38). See also the command set
mouse (p. 127).
Bind
Syntax:
bind {allwindows} [<key-sequence>] ["<gnuplot commands>"]
bind <key-sequence> ""
reset bind
The bind allows defining or redefining a hotkey, i.e. a sequence of gnuplot commands which will be executed
when a certain key or key sequence is pressed while the driver’s window has the input focus. Note that bind
is only available if gnuplot was compiled with mouse support and it is used by all mouse-capable terminals.
A user-specified binding supersedes any builtin bindings, except that <space> and ’q’ cannot normally be
rebound. For an exception, see bind space (p. 37).
Mouse buttons cannot be rebound.
You get the list of all hotkeys by typing show bind or bind or by typing the hotkey ’h’ in the graph window.
Key bindings are restored to their default state by reset bind.
Note that multikey-bindings with modifiers must be given in quotes.
Normally hotkeys are only recognized when the currently active plot window has focus. bind allwindows
<key> ... (short form: bind all <key> ...) causes the binding for <key> to apply to all gnuplot plot
windows, active or not. In this case gnuplot variable MOUSE KEY WINDOW is set to the ID of the
originating window, and may be used by the bound command.
Examples:
- set bindings:
gnuplot 4.7
bind
bind
bind
bind
bind
37
a "replot"
"ctrl-a" "plot x*x"
"ctrl-alt-a" ’print "great"’
Home "set view 60,30; replot"
all Home ’print "This is window ",MOUSE_KEY_WINDOW’
- show bindings:
bind "ctrl-a"
bind
show bind
# shows the binding for ctrl-a
# shows all bindings
# show all bindings
- remove bindings:
bind "ctrl-alt-a" ""
reset bind
bind!
# removes binding for ctrl-alt-a
(note that builtins cannot be removed)
# installs default (builtin) bindings
# deprecated form of "reset bind"
- bind a key to toggle something:
v=0
bind "ctrl-r" "v=v+1;if(v%2)set term x11 noraise; else set term x11 raise"
Modifiers (ctrl / alt) are case insensitive, keys not:
ctrl-alt-a == CtRl-alT-a
ctrl-alt-a != ctrl-alt-A
List of modifiers (alt == meta):
ctrl, alt
List of supported special keys:
"BackSpace", "Tab", "Linefeed", "Clear", "Return", "Pause", "Scroll_Lock",
"Sys_Req", "Escape", "Delete", "Home", "Left", "Up", "Right", "Down",
"PageUp", "PageDown", "End", "Begin",
"KP_Space", "KP_Tab", "KP_Enter", "KP_F1", "KP_F2", "KP_F3", "KP_F4",
"KP_Home", "KP_Left", "KP_Up", "KP_Right", "KP_Down", "KP_PageUp",
"KP_PageDown", "KP_End", "KP_Begin", "KP_Insert", "KP_Delete", "KP_Equal",
"KP_Multiply", "KP_Add", "KP_Separator", "KP_Subtract", "KP_Decimal",
"KP_Divide",
"KP_1" - "KP_9", "F1" - "F12"
The following are window events rather than actual keys
"Close"
See also help for mouse (p. 127).
Bind space
If gnuplot was built with configuration option –enable-raise-console, then typing <space> in the plot window
raises gnuplot’s command window. This hotkey can be changed to ctrl-space by starting gnuplot as ’gnuplot
-ctrlq’, or by setting the XResource ’gnuplot*ctrlq’. See x11 command-line-options (p. 229).
38
gnuplot 4.7
Mouse variables
When mousing is active, clicking in the active window will set several user variables that can be accessed
from the gnuplot command line. The coordinates of the mouse at the time of the click are stored in MOUSE X
MOUSE Y MOUSE X2 and MOUSE Y2. The mouse button clicked, and any meta-keys active at that time,
are stored in MOUSE BUTTON MOUSE SHIFT MOUSE ALT and MOUSE CTRL. These variables are
set to undefined at the start of every plot, and only become defined in the event of a mouse click in the
active plot window. To determine from a script if the mouse has been clicked in the active plot window, it
is sufficient to test for any one of these variables being defined.
plot ’something’
pause mouse
if (defined(MOUSE_BUTTON)) call ’something_else’; \
else print "No mouse click."
It is also possible to track keystrokes in the plot window using the mousing code.
plot ’something’
pause mouse keypress
print "Keystroke ", MOUSE_KEY, " at ", MOUSE_X, " ", MOUSE_Y
When pause mouse keypress is terminated by a keypress, then MOUSE KEY will contain the ascii
character value of the key that was pressed. MOUSE CHAR will contain the character itself as a string
variable. If the pause command is terminated abnormally (e.g. by ctrl-C or by externally closing the plot
window) then MOUSE KEY will equal -1.
Note that after a zoom by mouse, you can read the new ranges as GPVAL X MIN, GPVAL X MAX,
GPVAL Y MIN, and GPVAL Y MAX, see gnuplot-defined variables (p. 30).
Plotting
There are three gnuplot commands which actually create a plot: plot, splot and replot. plot generates
2D plots, splot generates 3D plots (actually 2D projections, of course), and replot appends its arguments
to the previous plot or splot and executes the modified command.
Much of the general information about plotting can be found in the discussion of plot; information specific
to 3D can be found in the splot section.
plot operates in either rectangular or polar coordinates – see set polar (p. 143) for details of the latter.
splot operates only in rectangular coordinates, but the set mapping command allows for a few other
coordinate systems to be treated. In addition, the using option allows both plot and splot to treat almost
any coordinate system you’d care to define.
plot also lets you use each of the four borders – x (bottom), x2 (top), y (left) and y2 (right) – as an
independent axis. The axes option lets you choose which pair of axes a given function or data set is plotted
against. A full complement of set commands exists to give you complete control over the scales and labelling
of each axis. Some commands have the name of an axis built into their names, such as set xlabel. Other
commands have one or more axis names as options, such as set logscale xy. Commands and options
controlling the z axis have no effect on 2D graphs.
splot can plot surfaces and contours in addition to points and/or lines. See set isosamples (p. 118) for
information about defining the grid for a 3D function. See splot datafile (p. 169) for information about
the requisite file structure for 3D data values, set contour (p. 105) and set cntrparam (p. 103) for
information about contours.
In splot, control over the scales and labels of the axes are the same as with plot, except that commands
and options controlling the x2 and y2 axes have no effect whereas of course those controlling the z axis do
take effect.
gnuplot 4.7
39
Start-up (initialization)
When gnuplot is run, it first looks for a system-wide initialization file named gnuplotrc. The location of
this file is determined when the program is built and is reported by show loadpath. The program then
looks in the user’s HOME directory for a file called .gnuplot on Unix-like systems or GNUPLOT.INI
on other systems. (Windows and OS/2 will look for it in the directory named in the environment variable
GNUPLOT; Windows will use USERPROFILE if GNUPLOT is not defined). Note: The program can
be configured to look first in the current directory, but this is not recommended because it is bad security
practice.
String constants and string variables
In addition to string constants, most gnuplot commands also accept a string variable, a string expression,
or a function that returns a string. For example, the following four methods of creating a plot all result in
the same plot title:
four = "4"
graph4 = "Title for plot #4"
graph(n) = sprintf("Title for plot #%d",n)
plot
plot
plot
plot
’data.4’
’data.4’
’data.4’
’data.4’
title
title
title
title
"Title for plot #4"
graph4
"Title for plot #".four
graph(4)
Since integers are promoted to strings when operated on by the string concatenation operator, the following
method also works:
N = 4
plot ’data.’.N title "Title for plot #".N
In general, elements on the command line will only be evaluated as possible string variables if they are not
otherwise recognizable as part of the normal gnuplot syntax. So the following sequence of commands is legal,
although probably should be avoided so as not to cause confusion:
plot = "my_datafile.dat"
title = "My Title"
plot plot title title
There are three binary operators that require string operands: the string concatenation operator ".", the
string equality operator "eq" and the string inequality operator "ne". The following example will print
TRUE.
if ("A"."B" eq "AB") print "TRUE"
See also the two string formatting functions gprintf (p. 113) and sprintf (p. 27).
Substrings can be specified by appending a range specifier to any string, string variable, or string-valued
function. The range specifier has the form [begin:end], where begin is the index of the first character of the
substring and end is the index of the last character of the substring. The first character has index 1. The
begin or end fields may be empty, or contain ’*’, to indicate the true start or end of the original string. E.g.
str[:] and str[*:*] both describe the full string str.
Substitution and Command line macros
When a command line to gnuplot is first read, i.e. before it is interpreted or executed, two forms of lexical
substitution are performed. These are triggered by the presence of text in backquotes (ascii character 96) or
preceded by @ (ascii character 64).
40
gnuplot 4.7
Substitution of system commands in backquotes
Command-line substitution is specified by a system command enclosed in backquotes. This command is
spawned and the output it produces replaces the backquoted text on the command line. Some implementations also support pipes; see plot datafile special-filenames (p. 82).
Command-line substitution can be used anywhere on the gnuplot command line, except inside strings
delimited by single quotes.
Example:
This will run the program leastsq and replace leastsq (including backquotes) on the command line with
its output:
f(x) = ‘leastsq‘
or, in VMS
f(x) = ‘run leastsq‘
These will generate labels with the current time and userid:
set label "generated on ‘date +%Y-%m-%d‘ by ‘whoami‘" at 1,1
set timestamp "generated on %Y-%m-%d by ‘whoami‘"
Substitution of string variables as macros
Substitution of command line macros is disabled by default, but may be enabled using the set macros
command. If macro substitution is enabled, the character @ is used to trigger substitution of the current
value of a string variable into the command line. The text in the string variable may contain any number
of lexical elements. This allows string variables to be used as command line macros. Only string constants
may be expanded using this mechanism, not string-valued expressions. For example:
set macros
style1 = "lines lt 4 lw 2"
style2 = "points lt 3 pt 5 ps 2"
range1 = "using 1:3"
range2 = "using 1:5"
plot "foo" @range1 with @style1, "bar" @range2 with @style2
The line containing @ symbols is expanded on input, so that by the time it is executed the effect is identical
to having typed in full
plot "foo" using 1:3 with lines lt 4 lw 2, \
"bar" using 1:5 with points lt 3 pt 5 ps 2
The function exists() may be useful in connection with macro evaluation. The following example checks that
C can safely be expanded as the name of a user-defined variable:
C = "pi"
if (exists(C)) print C," = ", @C
Macro expansion does not occur inside either single or double quotes. However macro expansion does occur
inside backquotes.
Macro expansion is handled as the very first thing the interpreter does when looking at a new line of
commands and is only done once. Therefore, code like the following will execute correctly:
A = "c=1"
@A
but this line will not, since the macro is defined on the same line and will not be expanded in time
A = "c=1"; @A
# will not expand to c=1
For execution of complete commands the evaluate command may also be handy.
gnuplot 4.7
41
String variables, macros, and command line substitution
The interaction of string variables, backquotes and macro substitution is somewhat complicated. Backquotes
do not block macro substitution, so
filename = "mydata.inp"
lines = ‘ wc --lines @filename | sed "s/ .*//" ‘
results in the number of lines in mydata.inp being stored in the integer variable lines. And double quotes do
not block backquote substitution, so
mycomputer = "‘uname -n‘"
results in the string returned by the system command uname -n being stored in the string variable mycomputer.
However, macro substitution is not performed inside double quotes, so you cannot define a system command
as a macro and then use both macro and backquote substitution at the same time.
machine_id = "uname -n"
mycomputer = "‘@machine_id‘"
# doesn’t work!!
This fails because the double quotes prevent @machine id from being interpreted as a macro. To store a
system command as a macro and execute it later you must instead include the backquotes as part of the
macro itself. This is accomplished by defining the macro as shown below. Notice that the sprintf format
nests all three types of quotes.
machine_id = sprintf(’"‘uname -n‘"’)
mycomputer = @machine_id
Syntax
Options and any accompanying parameters are separated by spaces whereas lists and coordinates are separated by commas. Ranges are separated by colons and enclosed in brackets [], text and file names are
enclosed in quotes, and a few miscellaneous things are enclosed in parentheses.
Commas are used to separate coordinates on the set commands arrow, key, and label; the list of variables
being fitted (the list after the via keyword on the fit command); lists of discrete contours or the loop
parameters which specify them on the set cntrparam command; the arguments of the set commands
dgrid3d, dummy, isosamples, offsets, origin, samples, size, time, and view; lists of tics or the loop
parameters which specify them; the offsets for titles and axis labels; parametric functions to be used to
calculate the x, y, and z coordinates on the plot, replot and splot commands; and the complete sets of
keywords specifying individual plots (data sets or functions) on the plot, replot and splot commands.
Parentheses are used to delimit sets of explicit tics (as opposed to loop parameters) and to indicate computations in the using filter of the fit, plot, replot and splot commands.
(Parentheses and commas are also used as usual in function notation.)
Square brackets are used to delimit ranges given in set, plot or splot commands.
Colons are used to separate extrema in range specifications (whether they are given on set, plot or splot
commands) and to separate entries in the using filter of the plot, replot, splot and fit commands.
Semicolons are used to separate commands given on a single command line.
Curly braces are used in the syntax for enhanced text mode and to delimit blocks in if/then/else statements.
They are also used to denote complex numbers: {3,2} = 3 + 2i.
The EEPIC, Imagen, Uniplex, LaTeX, and TPIC drivers allow a newline to be specified by \\ in a singlequoted string or \\\\ in a double-quoted string.
42
gnuplot 4.7
Quote Marks
Gnuplot uses three forms of quote marks for delimiting text strings, double-quote (ascii 34), single-quote
(ascii 39), and backquote (ascii 96).
Filenames may be entered with either single- or double-quotes. In this manual the command examples
generally single-quote filenames and double-quote other string tokens for clarity.
String constants and text strings used for labels, titles, or other plot elements may be enclosed in either
single quotes or double quotes. Further processing of the quoted text depends on the choice of quote marks.
Backslash processing of special characters like \n (newline) and \345 (octal character code) is performed for
double-quoted strings. In single-quoted strings, backslashes are just ordinary characters. To get a singlequote (ascii 39) in a single-quoted string, it has to be doubled. Thus the strings "d\" s’ b\\" and ’d" s’ ’ b\’
are completely equivalent.
Text justification is the same for each line of a multi-line string. Thus the center-justified string
"This is the first line of text.\nThis is the second line."
will produce
This is the first line of text.
This is the second line.
but
’This is the first line of text.\nThis is the second line.’
will produce
This is the first line of text.\nThis is the second line.
Enhanced text processing is performed for both double-quoted text and single-quoted text, but only by
terminals supporting this mode. See enhanced text (p. 24).
Back-quotes are used to enclose system commands for substitution into the command line. See substitution
(p. 39).
Time/Date data
gnuplot supports the use of time and/or date information as input data. This feature is activated by the
commands set xdata time, set ydata time, etc.
Internally all times and dates are converted to the number of seconds from the year 2000. The command set
timefmt defines the format for all inputs: data files, ranges, tics, label positions — in short, anything that
accepts a data value must receive it in this format. Since only one input format can be in force at a given
time, all time/date quantities being input at the same time must be presented in the same format. Thus if
both x and y data in a file are time/date, they must be in the same format.
The conversion to and from seconds assumes Universal Time (which is the same as Greenwich Standard
Time). There is no provision for changing the time zone or for daylight savings. If all your data refer to the
same time zone (and are all either daylight or standard) you don’t need to worry about these things. But if
the absolute time is crucial for your application, you’ll need to convert to UT yourself.
Commands like show xrange will re-interpret the integer according to timefmt. If you change timefmt,
and then show the quantity again, it will be displayed in the new timefmt. For that matter, if you give
the deactivation command (like set xdata), the quantity will be shown in its numerical form.
The commands set format or set tics format define the format that will be used for tic labels, whether
or not the specified axis is time/date.
If time/date information is to be plotted from a file, the using option must be used on the plot or splot
command. These commands simply use white space to separate columns, but white space may be embedded
within the time/date string. If you use tabs as a separator, some trial-and-error may be necessary to discover
how your system treats them.
gnuplot 4.7
43
The time function can be used to get the current system time. This value can be converted to a date
string with the strftime function, or it can be used in conjunction with timecolumn to generate relative
time/date plots. The type of the argument determines what is returned. If the argument is an integer, time
returns the current time as an integer, in seconds from 1 Jan 2000. If the argument is real (or complex), the
result is real as well. The precision of the fractional (sub-second) part depends on your operating system.
If the argument is a string, it is assumed to be a format string, and it is passed to strftime to provide a
formatted time/date string.
The following example demonstrates time/date plotting.
Suppose the file "data" contains records like
03/21/95 10:00
6.02e23
This file can be plotted by
set xdata time
set timefmt "%m/%d/%y"
set xrange ["03/21/95":"03/22/95"]
set format x "%m/%d"
set timefmt "%m/%d/%y %H:%M"
plot "data" using 1:3
which will produce xtic labels that look like "03/21".
See time specifiers (p. 114).
Part II
Plotting styles
There are many plotting styles available in gnuplot. They are listed alphabetically below. The commands
set style data and set style function change the default plotting style for subsequent plot and splot
commands.
You also have the option to specify the plot style explicitly as part of the plot or splot command. If you
want to mix plot styles within a single plot, you must specify the plot style for each component.
Example:
plot ’data’ with boxes, sin(x) with lines
Each plot style has its own expected set of data entries in a data file. For example by default the lines style
expects either a single column of y values (with implicit x ordering) or a pair of columns with x in the first
and y in the second. For more information on how to fine-tune how columns in a file are interpreted as plot
data, see using (p. 84).
Boxerrorbars
The boxerrorbars style is only relevant to 2D data plotting. It is a combination of the boxes and yerrorbars styles. It uses 3, 4, or 5 columns of data:
3
4
4
5
columns:
columns:
columns:
columns:
x
x
x
x
y
y
y
y
ydelta
ydelta xdelta
ylow yhigh
ylow yhigh xdelta
# boxwidth != -2
# boxwidth == -2
44
gnuplot 4.7
The boxwidth will come from the fourth column if the
y errors are given as "ydelta" and the boxwidth was
not previously set to -2.0 (set boxwidth -2.0) or from
the fifth column if the y errors are in the form of "ylow
yhigh". The special case boxwidth = -2.0 is for fourcolumn data with y errors in the form "ylow yhigh". In
this case the boxwidth will be calculated so that each
box touches the adjacent boxes. The width will also be
calculated in cases where three-column data are used.
with boxerrorbars
An additional (4th, 5th or 6th) input column may be
used to provide variable (per-datapoint) color information (see linecolor (p. 34) and rgbcolor variable
(p. 35)). The error bar will be drawn in the same color as the border of the box.
The box height is determined from the y error in the same way as it is for the yerrorbars style — either
from y-ydelta to y+ydelta or from ylow to yhigh, depending on how many data columns are provided. See
also
errorbar demo.
Boxes
The boxes style is only relevant to 2D plotting. It draws
a box centered about the given x coordinate that extends
from the x axis (not from the graph border) to the given
y coordinate. It uses 2 or 3 columns of basic data. Additional input columns may be used to provide information
such as variable line or fill color (see rgbcolor variable
(p. 35)).
2 columns: x y
3 columns: x y x_width
with boxes
The width of the box is obtained in one of three ways. If the input data has a third column, this will be
used to set the width of the box. If not, if a width has been set using the set boxwidth command, this
will be used. If neither of these is available, the width of each box will be calculated automatically so that
it touches the adjacent boxes.
The interior of the boxes is drawn according to the current fillstyle. See set style fill (p. 148) for details.
Alternatively a new fillstyle may be specified in the plot command.
For fillstyle empty the box is not filled.
For fillstyle solid the box is filled with a solid rectangle of the current drawing color. There is an optional
parameter <density> that controls the fill density; it runs from 0 (background color) to 1 (current drawing
color).
For fillstyle pattern the box is filled in the current drawing color with a pattern, if supported by the terminal
driver.
Examples:
To plot a data file with solid filled boxes with a small vertical space separating them (bargraph):
set boxwidth 0.9 relative
set style fill solid 1.0
plot ’file.dat’ with boxes
To plot a sine and a cosine curve in pattern-filled boxes style:
set style fill pattern
plot sin(x) with boxes, cos(x) with boxes
The sin plot will use pattern 0; the cos plot will use pattern 1. Any additional plots would cycle through
the patterns supported by the terminal driver.
gnuplot 4.7
45
To specify explicit fillstyles for each dataset:
plot ’file1’
’file2’
’file3’
’file4’
’file5’
with
with
with
with
with
boxes
boxes
boxes
boxes
boxes
fs solid 0.25, \
fs solid 0.50, \
fs solid 0.75, \
fill pattern 1, \
fill empty
Boxplot
Boxplots are a common way to represent a statistical distribution of values. Quartile boundaries are determined
such that 1/4 of the points have a value equal or less
than the first quartile boundary, 1/2 of the points have
a value equal or less than the second quartile (median)
value, etc. A box is drawn around the region between
the first and third quartiles, with a horizontal line at
the median value. Whiskers extend from the box to
user-specified limits. Points that lie outside these limits
are drawn individually.
160
140
120
100
80
60
40
20
0
A
B
Examples
# Place a boxplot at x coordinate 1.0 representing the y values in column 5
plot ’data’ using (1.0):5
# Same plot but suppress outliers and force the width of the boxplot to 0.3
set style boxplot nooutliers
plot ’data’ using (1.0):5:(0.3)
By default only one boxplot is produced that represents all y values from the second column of the using
specification. However, an additional (fourth) colunm can be added to the specification. If present, the
values of that column will be interpreted as the discrete levels of a factor variable. As many boxplots will be
drawn as there are levels in the factor variable. The separation between these boxplots is 1.0 by default, but
it can be changed by set style boxplot separation. By default, the value of the factor variable is shown
as a tic label below (or above) each boxplot.
Example
# Suppose that column 2 of ’data’ contains either "control" or "treatment"
# The following example produces two boxplots, one for each level of the
# factor
plot ’data’ using (1.0):5:(0):2
The default width of the box can be set via set boxwidth <width> or may be specified as an optional
3rd column in the using clause of the plot command. The first and third columns (x coordinate and width)
are normally provided as constants rather than as data columns.
By default the whiskers extend from the ends of the box to the most distant point whose y value lies within
1.5 times the interquartile range. By default outliers are drawn as circles (point type 7). The width of the
bars at the end of the whiskers may be controlled using set bars.
These default properties may be changed using the set style boxplot command. See set style boxplot
(p. 147), bars (p. 100), boxwidth (p. 102), fillstyle (p. 148), candlesticks (p. 46).
Boxxyerrorbars
46
gnuplot 4.7
The boxxyerrorbars style is only relevant to 2D data
plotting. It is similar to the xyerrorbars style except that it draws rectangular areas rather than simple
crosses. It uses either 4 or 6 basic columns of input data.
Additional input columns may be used to provide information such as variable line or fill color (see rgbcolor
variable (p. 35)).
4 columns:
6 columns:
x
x
y
y
xdelta ydelta
xlow xhigh ylow
with boxxyerrorbars
yhigh
The box width and height are determined from the x and y errors in the same way as they are for the
xyerrorbars style — either from xlow to xhigh and from ylow to yhigh, or from x-xdelta to x+xdelta and
from y-ydelta to y+ydelta, depending on how many data columns are provided.
An additional (5th or 7th) input column may be used to provide variable (per-datapoint) color information
(see linecolor (p. 34) and rgbcolor variable (p. 35)).
The interior of the boxes is drawn according to the current fillstyle. See set style fill (p. 148) and boxes
(p. 44) for details. Alternatively a new fillstyle may be specified in the plot command.
Candlesticks
The candlesticks style can be used for 2D data plotting
of financial data or for generating box-and-whisker plots
of statistical data. The symbol is a rectangular box,
centered horizontally at the x coordinate and limited
vertically by the opening and closing prices. A vertical
line segment at the x coordinate extends up from the
top of the rectangle to the high price and another down
to the low. The vertical line will be unchanged if the
low and high prices are interchanged.
with candlesticks
Five columns of basic data are required:
financial data:
whisker plot:
date open
x box_min
low high close
whisker_min whisker_high
box_high
The width of the rectangle can be controlled by the set boxwidth command. For backwards compatibility
with earlier gnuplot versions, when the boxwidth parameter has not been set then the width of the candlestick
rectangle is controlled by set bars <width>.
Alternatively, an explicit width for each box-and-whiskers grouping may be specified in an optional 6th
column of data. The width must be given in the same units as the x coordinate.
An additional (6th, or 7th if the 6th column is used for width data) input column may be used to provide
variable (per-datapoint) color information (see linecolor (p. 34) and rgbcolor variable (p. 35)).
By default the vertical line segments have no crossbars at the top and bottom. If you want crossbars, which
are typically used for box-and-whisker plots, then add the keyword whiskerbars to the plot command. By
default these whiskerbars extend the full horizontal width of the candlestick, but you can modify this by
specifying a fraction of the full width.
The usual convention for financial data is that the rectangle is empty if (open < close) and solid fill if (close
< open). This is the behavior you will get if the current fillstyle is set to "empty". See fillstyle (p. 148).
If you set the fillstyle to solid or pattern, then this will be used for all boxes independent of open and close
values. See also set bars (p. 100) and financebars (p. 49). See also the
candlestick
and
finance
demos.
gnuplot 4.7
47
Note: To place additional symbols, such as the median value, on a box-and-whisker plot requires additional
plot commands as in this example:
# Data columns:X Min 1stQuartile Median 3rdQuartile Max
set bars 4.0
set style fill empty
plot ’stat.dat’ using 1:3:2:6:5 with candlesticks title ’Quartiles’, \
’’
using 1:4:4:4:4 with candlesticks lt -1 notitle
# Plot with crossbars on the whiskers, crossbars are 50% of full width
plot ’stat.dat’ using 1:3:2:6:5 with candlesticks whiskerbars 0.5
See set boxwidth (p. 102), set bars (p. 100), set style fill (p. 148), and boxplot (p. 45).
Circles
The circles style plots a circle with an explicit radius
at each data point. If three columns of data are present,
they are interpreted as x, y, radius. The radius is always
interpreted in the units of the plot’s horizontal axis (x
or x2). The scale on y and the aspect ratio of the plot
are both ignored. If only two columns are present, the
radius is taken from set style circle. In this case the
radius may be given in graph or screen coordinates.
2.5
2.0
1.5
1.0
0.5
0.0
-0.5
By default a full circle will be drawn. It is possible to
-1.0
-2.5 -2.0 -1.5 -1.0 -0.5 0.0 0.5 1.0 1.5
plot arc segments instead of full circles by specifying a
start and end angle in the 4th and 5th columns. An optional 4th or 6th column can specify per-circle color.
The start and end angles of the circle segments must be specified in degrees. See set style circle (p. 151)
and set style fill (p. 148).
Examples:
# draws circles whose area is proportional to the value in column 3
set style fill transparent solid 0.2 noborder
plot ’data’ using 1:2:(sqrt($3)) with circles, \
’data’ using 1:2 with linespoints
# draws Pac-men instead of circles
plot ’data’ using 1:2:(10):(40):(320) with circles
# draw a pie chart with inline data
set xrange [-15:15]
set style fill transparent solid 0.9 noborder
plot ’-’ using 1:2:3:4:5:6 with circles lc var
0
0
5
0
30
1
0
0
5
30
70
2
0
0
5
70
120
3
0
0
5 120
230
4
0
0
5 230
360
5
e
The result is similar to using a points plot with variable size points and pointstyle 7, except that the circles
will scale with the x axis range. See also set object circle (p. 132) and fillstyle (p. 148).
Ellipses
48
gnuplot 4.7
The ellipses style plots an ellipse at each data point.
This style is only relevant for 2D plotting. Each ellipse
is described in terms of its center, major and minor diameters, and the angle between its major diameter and
the x axis.
2
3
4
5
columns:
columns:
columns:
columns:
x
x
x
x
with ellipses
y
y major_diam
y major_diam minor_diam
y major_diam minor_diam angle
If only two input columns are present, they are taken as the coordinates of the centers, and the ellipses will
be drawn with the default extent (see set style ellipse (p. 152)). The orientation of the ellipse, which is
defined as the angle between the major diameter and the plot’s x axis, is taken from the default ellipse style
(see set style ellipse (p. 152)). If three input columns are provided, the third column is used for both
diameters. The orientation angle defaults to zero. If four columns are present, they are interpreted as x, y,
major diameter, minor diameter. Note that these are diameters, not radii. An optional 5th column may be
used to specify the orientation angle in degrees. The ellipses will also be drawn with their default extent if
either of the supplied diameters in the 3-4-5 column form is negative.
In all of the above cases, optional variable color data may be given in an additional last (3th, 4th, 5th or
6th) column. See colorspec (p. 34) for further information.
By default, the major diameter is interpreted in the units of the plot’s horizontal axis (x or x2) while the
minor diameter in that of the vertical (y or y2). This implies that if the x and y axis scales are not equal,
then the major/minor diameter ratio will no longer be correct after rotation. This behavior can be changed
with the units keyword, however.
There are three alternatives: if units xy is included in the plot specification, the axes will be scaled as
described above. units xx ensures that both diameters are interpreted in units of the x axis, while units
yy means that both diameters are interpreted in units of the y axis. In the latter two cases the ellipses will
have the correct aspect ratio, even if the plot is resized.
If units is omitted, the default setting will be used, which is equivalent to units xy. This can be redefined
by set style ellipse.
Example (draws ellipses, cycling through the available line types):
plot ’data’ using 1:2:3:4:(0):0 with ellipses
See also set object ellipse (p. 132), set style ellipse (p. 152) and fillstyle (p. 148).
Dots
The dots style plots a tiny dot at each point; this is
useful for scatter plots with many points. Either 1 or 2
columns of input data are required in 2D. Three columns
are required in 3D.
For some terminals (post, pdf) the size of the dot can
be controlled by changing the linewidth.
1 column
2 columns:
3 columns:
y
x
x
Filledcurves
# x is row number
y
y
z
# 3D only (splot)
gnuplot 4.7
The filledcurves style is only relevant to 2D plotting.
Three variants are possible. The first two variants require either a function or two columns of input data, and
may be further modified by the options listed below.
49
with filledcurves
above
below
curve 1
curve 2
Syntax:
plot ... with filledcurves [option]
where the option can be one of the following
[closed | {above | below}
{x1 | x2 | y1 | y2 | r}[=<a>] | xy=<x>,<y>]
The first variant, closed, treats the curve itself as a closed polygon. This is the default if there are two
columns of input data.
The second variant is to fill the area between the curve and a given axis, a horizontal or vertical line, or a
point.
filledcurves closed
... just filled closed curve,
filledcurves x1
... x1 axis,
filledcurves x2
... x2 axis, etc for y1 and y2 axes,
filledcurves y1=0
... line y=0 (at y1 axis) ie parallel to x1 axis,
filledcurves y2=42
... line y=42 (at y2 axis) ie parallel to x2, etc,
filledcurves xy=10,20 ... point 10,20 of x1,y1 axes (arc-like shape).
filledcurves above r=1.5 the area of a polar plot outside radius 1.5
The third variant requires three columns of input data: the x coordinate and two y coordinates corresponding
to two curves sampled at the same set of x coordinates; the area between the two curves is filled. This is the
default if there are three or more columns of input data.
3 columns: x y1 y2
Example of filling the area between two input curves.
fill between curves demo.
plot ’data’ using 1:2:3 with filledcurves
The above and below options apply both to commands of the form
... filledcurves above {x1|x2|y1|y2|r}=<val>
and to commands of the form
... using 1:2:3 with filledcurves below
In either case the option limits the filled area to one side of the bounding line or curve.
Note: Not all terminal types support this plotting mode.
Zooming a filled curve drawn from a datafile may produce empty or incorrect areas because gnuplot is
clipping points and lines, and not areas.
If the values of <a>, <x>, <y> are out of the drawing boundary, then they are moved to the graph
boundary. Then the actually filled area in the case of option xy=<x>,<y> will depend on xrange and
yrange.
Financebars
The financebars style is only relevant for 2D data plotting of financial data. It requires 1 x coordinate
(usually a date) and 4 y values (prices).
5 columns:
date open low high close
An additional (6th) input column may be used to provide variable (per-record) color information (see linecolor (p. 34) and rgbcolor variable (p. 35)).
50
gnuplot 4.7
The symbol is a vertical line segment, located horizontally at the x coordinate and limited vertically by the
high and low prices. A horizontal tic on the left marks
the opening price and one on the right marks the closing
price. The length of these tics may be changed by set
bars. The symbol will be unchanged if the high and
low prices are interchanged. See set bars (p. 100) and
candlesticks (p. 46), and also the
with financebars
finance demo.
Fsteps
The fsteps style is only relevant to 2D plotting. It connects consecutive points with two line segments: the first
from (x1,y1) to (x1,y2) and the second from (x1,y2) to
(x2,y2). The input column requires are the same as for
plot styles lines and points. The difference between
fsteps and steps is that fsteps traces first the change
in y and then the change in x. steps traces first the
change in x and then the change in y.
with fsteps
See also
steps demo.
Fillsteps
The fillsteps style is exactly like steps except that the area between the curve and y=0 is filled in the
current fill style. See steps (p. 57).
Histeps
The histeps style is only relevant to 2D plotting. It
is intended for plotting histograms. Y-values are assumed to be centered at the x-values; the point at x1 is
represented as a horizontal line from ((x0+x1)/2,y1) to
((x1+x2)/2,y1). The lines representing the end points
are extended so that the step is centered on at x. Adjacent points are connected by a vertical line at their average x, that is, from ((x1+x2)/2,y1) to ((x1+x2)/2,y2).
The input column requires are the same as for plot styles
lines and points.
with histeps
If autoscale is in effect, it selects the xrange from the data rather than the steps, so the end points will
appear only half as wide as the others. See also
steps demo.
histeps is only a plotting style; gnuplot does not have the ability to create bins and determine their
population from some data set.
gnuplot 4.7
51
Histograms
The histograms style is only relevant to 2D plotting. It produces a bar chart from a sequence of parallel
data columns. Each element of the plot command must specify a single input data source (e.g. one column of
the input file), possibly with associated tic values or key titles. Four styles of histogram layout are currently
supported.
set
set
set
set
style
style
style
style
histogram
histogram
histogram
histogram
clustered {gap <gapsize>}
errorbars {gap <gapsize>} {<linewidth>}
rowstacked
columnstacked
The default style corresponds to set style histogram clustered gap 2. In this style, each set of parallel
data values is collected into a group of boxes clustered at the x-axis coordinate corresponding to their
sequential position (row #) in the selected datafile columns. Thus if <n> datacolumns are selected, the first
cluster is centered about x=1, and contains <n> boxes whose heights are taken from the first entry in the
corresponding <n> data columns. This is followed by a gap and then a second cluster of boxes centered
about x=2 corresponding to the second entry in the respective data columns, and so on. The default gap
width of 2 indicates that the empty space between clusters is equivalent to the width of 2 boxes. All boxes
derived from any one column are given the same fill color and/or pattern (see set style fill (p. 148)).
Each cluster of boxes is derived from a single row of the input data file. It is common in such input files that
the first element of each row is a label. Labels from this column may be placed along the x-axis underneath
the appropriate cluster of boxes with the xticlabels option to using.
The errorbars style is very similar to the clustered style, except that it requires additional columns of
input for each entry. The first column holds the height (y value) of that box, exactly as for the clustered
style.
2 columns:
3 columns:
y yerr
y ymin yman
bar extends from y-yerr to y+err
bar extends from ymin to ymax
The appearance of the error bars is controlled by the current value of set bars and by the optional
<linewidth> specification.
Two styles of stacked histogram are supported, chosen by the command set style histogram
{rowstacked|columnstacked}. In these styles the data values from the selected columns are collected
into stacks of boxes. Positive values stack upwards from y=0; negative values stack downwards. Mixed
positive and negative values will produce both an upward stack and a downward stack. The default stacking
mode is rowstacked.
The rowstacked style places a box resting on the x-axis for each data value in the first selected column;
the first data value results in a box a x=1, the second at x=2, and so on. Boxes corresponding to the second
and subsequent data columns are layered on top of these, resulting in a stack of boxes at x=1 representing
the first data value from each column, a stack of boxes at x=2 representing the second data value from each
column, and so on. All boxes derived from any one column are given the same fill color and/or pattern (see
set style fill (p. 148)).
The columnstacked style is similar, except that each stack of boxes is built up from a single data column.
Each data value from the first specified column yields a box in the stack at x=1, each data value from the
second specified column yields a box in the stack at x=2, and so on. In this style the color of each box is
taken from the row number, rather than the column number, of the corresponding data field.
Box widths may be modified using the set boxwidth command. Box fill styles may be set using the set
style fill command.
Histograms always use the x1 axis, but may use either y1 or y2. If a plot contains both histograms and other
plot styles, the non-histogram plot elements may use either the x1 or the x2 axis.
Examples:
52
gnuplot 4.7
Suppose that the input file contains data values in
columns 2, 4, 6, ... and error estimates in columns 3,
5, 7, ... This example plots the values in columns 2 and
4 as a histogram of clustered boxes (the default style).
Because we use iteration in the plot command, any number of data columns can be handled in a single command.
See iteration (p. 71).
set boxwidth 0.9 relative
set style data histograms
set style histogram cluster
set style fill solid 1.0 border lt -1
plot for [COL=2:4:2] ’file.dat’ using COL
9
ClassB
8
ClassA
7
6
5
4
3
2
1
0
This will produce a plot with clusters of two boxes (vertical bars) centered at each integral value on the
x axis. If the first column of the input file contains labels, they may be placed along the x-axis using the
variant command
plot for [COL=2:4:2] ’file.dat’ using COL:xticlabels(1)
If the file contains both magnitude and range information for each value, then error bars can be added to the
plot. The following commands will add error bars extending from (y-<error>) to (y+<error>), capped by
horizontal bar ends drawn the same width as the box
itself. The error bars and bar ends are drawn with
linewidth 2, using the border linetype from the current
fill style.
10
Histogram with error bars
B
9
A
8
7
6
5
4
3
2
set bars fullwidth
set style fill solid 1 border lt -1
set style histogram errorbars gap 2 lw 2
plot for [COL=2:4:2] ’file.dat’ using COL:COL+1
1
0
To plot the same data as a rowstacked histogram. Just to be different, this example lists the separate
columns explicitly rather than using iteration.
set style histogram rowstacked
plot ’file.dat’ using 2, ’’ using 4:xtic(1)
This will produce a plot in which each vertical bar corresponds to one row of data. Each vertical bar contains
a stack of two segments, corresponding in height to the
values found in columns 2 and 4 of the datafile.
10
ClassB
ClassA
8
6
Finally, the commands
set style histogram columnstacked
plot ’file.dat’ using 2, ’’ using 4
Rowstacked
4
2
0
gnuplot 4.7
53
will produce two vertical stacks, one for each column of
data. The stack at x=1 will contain a box for each entry
in column 2 of the datafile. The stack at x=2 will contain
a box for each parallel entry in column 4 of the datafile.
Because this interchanges gnuplot’s usual interpretation
of input rows and columns, the specification of key titles
and x-axis tic labels must also be modified accordingly.
See the comments given below.
set style histogram columnstacked
plot ’’ u 5:key(1)
# uses first column to generate key titles
plot ’’ u 5 title columnhead # uses first row to generate xtic labels
Columnstacked
18
16
14
12
10
8
6
4
2
0
ClassA
ClassB
Note that the two examples just given present exactly the same data values, but in different formats.
Newhistogram
Syntax:
newhistogram {"<title>"} {lt <linetype>} {fs <fillstyle>} {at <x-coord>}
More than one set of histograms can appear in a single plot. In this case you can force a gap between them,
and a separate label for each set, by using the newhistogram command. For example
set style histogram cluster
plot newhistogram "Set A", ’a’ using 1, ’’ using 2, ’’ using 3, \
newhistogram "Set B", ’b’ using 1, ’’ using 2, ’’ using 3
The labels "Set A" and "Set B" will appear beneath the respective sets of histograms, under the overall x
axis label.
The newhistogram command can also be used to force histogram coloring to begin with a specific color
(linetype). By default colors will continue to increment successively even across histogram boundaries. Here
is an example using the same coloring for multiple histograms
plot newhistogram "Set A" lt 4, ’a’ using 1, ’’ using 2, ’’ using 3, \
newhistogram "Set B" lt 4, ’b’ using 1, ’’ using 2, ’’ using 3
Similarly you can force the next histogram to begin with a specified fillstyle. If the fillstyle is set to pattern,
then the pattern used for filling will be incremented automatically.
The at <x-coord> option sets the x coordinate position
of the following histogram to <x-coord>. For example
set style histogram cluster
set style data histogram
set style fill solid 1.0 border -1
set xtic 1 offset character 0,0.3
plot newhistogram "Set A", \
’file.dat’ u 1 t 1, ’’ u 2 t 2, \
newhistogram "Set B" at 8, \
’file.dat’ u 2 t 2, ’’ u 2 t 2
9
ClassA
8
ClassB
7
ClassA
6
ClassB
5
4
3
2
1
0
-1
0
1
2
Set A
3
4
5
6
7
8
9
10
11
12
Set B
will position the second histogram to start at x=8.
Automated iteration over multiple columns
If you want to create a histogram from many columns of data in a single file, it is very convenient to use
the plot iteration feature. See iteration (p. 71). For example, to create stacked histograms of the data in
columns 3 through 8
set style histogram columnstacked
plot for [i=3:8] "datafile" using i title columnhead
54
gnuplot 4.7
Image
The image, rgbimage, and rgbalpha plotting styles all project a uniformly sampled grid of data values
onto a plane in either 2D or 3D. The input data may be an actual bitmapped image, perhaps converted from
a standard format such as PNG, or a simple array of numerical values.
This figure illustrates generation of a heat map from an
array of scalar values. The current palette is used to map
each value onto the color assigned to the corresponding
pixel.
plot ’-’ matrix with image
5 4 3 1 0
2 2 0 0 1
0 0 0 1 0
0 1 2 4 3
e
e
Each pixel (data point) of the input 2D image will become a rectangle or parallelipiped in the plot. The coordinates of each data point will determine the center
of the parallelipiped. That is, an M x N set of data
will form an image with M x N pixels. This is different from the pm3d plotting style, where an M x N set
of data will form a surface of (M-1) x (N-1) elements.
The scan directions for a binary image data grid can be
further controlled by additional keywords. See binary
keywords flipx (p. 77), keywords center (p. 77),
and keywords rotate (p. 77).
Image data can be scaled to fill a particular rectangle
within a 2D plot coordinate system by specifying the x
and y extent of each pixel. See binary keywords dx
(p. 77) and dy (p. 77). To generate the figure at the
right, the same input image was placed multiple times,
each with a specified dx, dy, and origin. The input PNG
image of a building is 50x128 pixels. The tall building
was drawn by mapping this using dx=0.5 dy=1.5. The
short building used a mapping dx=0.5 dy=0.35.
2D Heat map from in-line array of values
0
1
2
3
4
3
2
1
0
RGB image mapped onto a plane in 3D
1.0
0.5
0.0
120
-0.5
100
80
-1.0
60
0
20
40
40
60
20
80
100
120
0
Rescaled image used as plot element
200
200
Building Heights
by Neighborhood
150
150
100
100
50
50
0
0
The image style handles input pixels containing a
grayscale or color palette value. Thus 2D plots (plot command) require 3 columns of data (x,y,value),
while 3D plots (splot command) require 4 columns of data (x,y,z,value).
Downtown
S
NE
Suburbs
The rgbimage style handles input pixels that are described by three separate values for the red, green,
and blue components. Thus 5D data (x,y,r,g,b) is needed for plot and 6D data (x,y,z,r,g,b) for splot. The
individual red, green, and blue components are assumed to lie in the range [0:255].
The rgbalpha style handles input pixels that contain alpha channel (transparency) information in addition to
the red, green, and blue components. Thus 6D data (x,y,r,g,b,a) is needed for plot and 7D data (x,y,z,r,g,b,a)
for splot. The r, g, b, and alpha components are assumed to lie in the range [0:255].
Transparency
The rgbalpha plotting style assumes that each pixel of input data contains an alpha value in the range
[0:255]. A pixel with alpha = 0 is purely transparent and does not alter the underlying contents of the plot.
A pixel with alpha = 255 is purely opaque. All terminal types can handle these two extreme cases. A pixel
with 0 < alpha < 255 is partially transparent. Only a few terminal types can handle this correctly; other
terminals will approximate this by treating alpha as being either 0 or 255.
gnuplot 4.7
55
Image failsafe
Some terminal drivers provide code to optimize rendering of image data within a rectangular 2D area.
However this code is known to be imperfect. This optimized code may be disabled by using the keyword
failsafe. E.g.
plot ’data’ with image failsafe
Impulses
The impulses style displays a vertical line from y=0
to the y value of each point (2D) or from z=0 to the z
value of each point (3D). Note that the y or z values may
be negative. Data from additional columns can be used
to control the color of each impulse. To use this style
effectively in 3D plots, it is useful to choose thick lines
(linewidth > 1). This approximates a 3D bar chart.
1 column:
2 columns:
3 columns:
y
x
x
y
y
z
with impulses
# line from [x,0] to [x,y] (2D)
# line from [x,y,0] to [x,y,z] (3D)
Labels
The labels style reads coordinates and text from a data
file and places the text string at the corresponding 2D
or 3D position. 3 or 4 input columns of basic data are
required. Additional input columns may be used to provide information such as variable font size or text color
(see rgbcolor variable (p. 35)).
Ajaccio
Perpignan
Bastia
Foix
Toulon
Carcassonne
Tarbes
PauToulouse
Marseille
Aix-en-Provence
Montpellier
AuchAlbi
Nice
N
î
mes
Mont-de-Marsan
Avignon
Montauban
Digne-les-Bains
Agen
Rodez
Cahors
Mende
PrivasGap
BordeauxLe
Aurillac
Valence
Puy-en-Velay
Périgueux
Grenoble
Tulle
Saint-Étienne
Chambéry
Angoulême
Lyon
Clermont-Ferrand
LimogesVilleurbanne
Annecy
La Rochelle
Guéret
Bourg-en-Bresse
Mâcon
Niort
Moulins
Poitiers
La Roche-sur-Yon
Lons-le-Saunier
Châteauroux
Nevers
Bourges
NantesTours
Besançon
Dijon
Blois
Vesoul
Belfort
VannesAngers
3 columns: x y string
# 2D version
Mulhouse
Auxerre
Orléans
Quimper
Le Mans
Laval
Colmar
Rennes
Chaumont
Épinal
Troyes
Brest
Alençon
Chartres
Saint-Brieuc
Melun
Strasbourg
Évry
Nancy
4 columns: x y z string # 3D version
Bar-le-Duc
Créteil
Versailles
Boulogne-Billancourt
Paris
Nanterre
Bobigny
Châlons-en-Champagne
Évreux
Pontoise
Saint-Lô
Caen
ReimsMetz
Beauvais
Rouen
Le
Havre
Laon
Charleville-Mézières
Amiens
Arras
The font, color, rotation angle and other properties of the printed text may be
Lillespecified as additional
̨
command options (see set label (p. 122)). The example below generates a 2D plot with text labels
constructed from the city whose name is taken from column 1 of the input file, and whose geographic
coordinates are in columns 4 and 5. The font size is calculated from the value in column 3, in this case the
population.
CityName(String,Size) = sprintf("{/=%d %s}", Scale(Size), String)
plot ’cities.dat’ using 5:4:(CityName(stringcolumn(1),$3)) with labels
If we did not want to adjust the font size to a different size for each city name, the command would be much
simpler:
plot ’cities.dat’ using 5:4:1 with labels font "Times,8"
The labels style can also be used in 3D plots. In this case four input column specifiers are required,
corresponding to X Y Z and text.
splot ’datafile’ using 1:2:3:4 with labels
See also datastrings (p. 23), set style data (p. 148).
Lines
56
gnuplot 4.7
The lines style connects adjacent points with straight
line segments. It may be used in either 2D or 3D plots.
The basic form requires 1, 2, or 3 columns of input data.
Additional input columns may be used to provide information such as variable line color (see rgbcolor variable (p. 35)).
with lines
2D form
1 column:
2 columns:
y
x
y
# implicit x from row number
z
x
y
3D form
1 column:
3 columns:
# implicit x from row, y from index
z
See also linetype (p. 124), linewidth (p. 150), and linestyle (p. 150).
Linespoints
The linespoints style connects adjacent points with
straight line segments and then goes back to draw a
small symbol at each point. The command set pointsize may be used to change the default size of the points.
1 or 2 columns of basic input data are required in 2D
plots; 1 or 3 columns are required if 3D plots. See style
lines (p. 55). Additional input columns may be used
to provide information such as variable point size or line
color.
with linespoints
pointinterval -2
The pointinterval (short form pi) property of the linetype can be used to control whether or not every point in the plot is given a symbol. For example, ’with lp
pi 3’ will draw line segments through every data point, but will only place a symbol on every 3rd point. A
negative value for pointinterval will erase the portion of line segment that passes underneath the symbol.
The size of the erased portion is controlled by set pointintervalbox.
linespoints may be abbreviated lp.
Points
The points style displays a small symbol at each point.
The command set pointsize may be used to change the
default size of the points. 1 or 2 columns of basic input
data are required in 2D plots; 1 or 3 columns are required
in 3D plots. See style lines (p. 55). Additional input
columns may be used to provide information such as
variable point size or variable point color.
Polar
with points ps variable
gnuplot 4.7
Polar plots are not really a separate plot style but
are listed here for completeness. The option set polar tells gnuplot to interpret input 2D coordinates as
<angle>,<radius> rather than <x>,<y>. Many, but
not all, 2D plotting styles work in polar mode. The figure shows a combination of plot styles lines and filledcurves. See set polar (p. 143), set rrange (p. 145),
set size square (p. 145).
57
bounding radius 2.5
3.+sin(t)*cos(5*t)
1
2
3
4
Steps
The steps style is only relevant to 2D plotting. It connects consecutive points with two line segments: the first
from (x1,y1) to (x2,y1) and the second from (x2,y1) to
(x2,y2). The input column requires are the same as for
plot styles lines and points. The difference between
fsteps and steps is that fsteps traces first the change
in y and then the change in x. steps traces first the
change in x and then the change in y. To fill the area
between the curve and the baseline at y=0, use fillsteps.
See also
with fillsteps
with steps
steps demo.
Rgbalpha
See image (p. 54).
Rgbimage
See image (p. 54).
Vectors
The 2D vectors style draws a vector from (x,y) to (x+xdelta,y+ydelta). The 3D vectors style is similar,
but requires six columns of basic data. A small arrowhead is drawn at the end of each vector.
4 columns:
6 columns:
x
x
y
y
xdelta ydelta
z xdelta ydelta
zdelta
In both cases, an additional input column (5th in 2D, 7th in 3D) may be used to provide variable (perdatapoint) color information. (see linecolor (p. 34) and rgbcolor variable (p. 35)).
splot with vectors is supported only for set mapping cartesian.
The keywords "with vectors" may be followed by an in-line arrow style specifications, a reference to a
predefined arrow style, or a request to read the index of the desired arrow style for each vector from a
separate column. Note: If you choose "arrowstyle variable" it will fill in all arrow properties at the time the
corresponding vector is drawn; you cannot mix this keyword with other line or arrow style qualifiers in the
plot command.
plot ... with vectors filled heads
plot ... with vectors arrowstyle 3
plot ... using 1:2:3:4:5 with vectors arrowstyle variable
58
gnuplot 4.7
See arrowstyle (p. 146) for more details.
Example:
plot ’file.dat’ using 1:2:3:4 with vectors head filled lt 2
splot ’file.dat’ using 1:2:3:(1):(1):(1) with vectors filled head lw 2
set clip one and set clip two affect vectors drawn in 2D. Please see set clip (p. 103) and arrowstyle
(p. 146).
Xerrorbars
The xerrorbars style is only relevant to 2D data plots.
xerrorbars is like points, except that a horizontal error bar is also drawn. At each point (x,y), a line is
drawn from (xlow,y) to (xhigh,y) or from (x-xdelta,y) to
(x+xdelta,y), depending on how many data columns are
provided. A tic mark is placed at the ends of the error
bar (unless set bars is used — see set bars (p. 100) for
details). The basic style requires either 3 or 4 columns:
3 columns:
4 columns:
x
x
y
y
with xerrorbars
xdelta
xlow xhigh
An additional input column (4th or 5th) may be used to provide information such as variable point color.
Xyerrorbars
The xyerrorbars style is only relevant to 2D data plots.
xyerrorbars is like points, except that horizontal and
vertical error bars are also drawn. At each point (x,y),
lines are drawn from (x,y-ydelta) to (x,y+ydelta) and
from (x-xdelta,y) to (x+xdelta,y) or from (x,ylow) to
(x,yhigh) and from (xlow,y) to (xhigh,y), depending
upon the number of data columns provided. A tic mark
is placed at the ends of the error bar (unless set bars is
used — see set bars (p. 100) for details). Either 4 or
6 input columns are required.
4 columns:
6 columns:
x
x
y
y
xdelta ydelta
xlow xhigh ylow
with xyerrorbars
yhigh
If data are provided in an unsupported mixed form, the using filter on the plot command should be used
to set up the appropriate form. For example, if the data are of the form (x,y,xdelta,ylow,yhigh), then you
can use
plot ’data’ using 1:2:($1-$3):($1+$3):4:5 with xyerrorbars
An additional input column (5th or 7th) may be used to provide variable (per-datapoint) color information.
Yerrorbars
gnuplot 4.7
The yerrorbars (or errorbars) style is only relevant
to 2D data plots. yerrorbars is like points, except
that a vertical error bar is also drawn. At each point
(x,y), a line is drawn from (x,y-ydelta) to (x,y+ydelta)
or from (x,ylow) to (x,yhigh), depending on how many
data columns are provided. A tic mark is placed at the
ends of the error bar (unless set bars is used — see set
bars (p. 100) for details). Either 3 or 4 input columns
are required.
3 columns:
4 columns:
x
x
y
y
59
with yerrorbars
ydelta
ylow yhigh
An additional input column (4th or 5th) may be used to provide information such as variable point color.
See also
errorbar demo.
Xerrorlines
The xerrorlines style is only relevant to 2D data plots.
xerrorlines is like linespoints, except that a horizontal
error line is also drawn. At each point (x,y), a line is
drawn from (xlow,y) to (xhigh,y) or from (x-xdelta,y) to
(x+xdelta,y), depending on how many data columns are
provided. A tic mark is placed at the ends of the error
bar (unless set bars is used — see set bars (p. 100) for
details). The basic style requires either 3 or 4 columns:
3 columns:
4 columns:
x
x
y
y
with xerrorlines
xdelta
xlow xhigh
An additional input column (4th or 5th) may be used to provide information such as variable point color.
Xyerrorlines
The xyerrorlines style is only relevant to 2D data plots.
xyerrorlines is like linespoints, except that horizontal
and vertical error bars are also drawn. At each point
(x,y), lines are drawn from (x,y-ydelta) to (x,y+ydelta)
and from (x-xdelta,y) to (x+xdelta,y) or from (x,ylow)
to (x,yhigh) and from (xlow,y) to (xhigh,y), depending
upon the number of data columns provided. A tic mark
is placed at the ends of the error bar (unless set bars is
used — see set bars (p. 100) for details). Either 4 or
6 input columns are required.
4 columns:
6 columns:
x
x
y
y
xdelta ydelta
xlow xhigh ylow
with xyerrorlines
yhigh
If data are provided in an unsupported mixed form, the using filter on the plot command should be used
to set up the appropriate form. For example, if the data are of the form (x,y,xdelta,ylow,yhigh), then you
can use
plot ’data’ using 1:2:($1-$3):($1+$3):4:5 with xyerrorlines
An additional input column (5th or 7th) may be used to provide variable (per-datapoint) color information.
60
gnuplot 4.7
Yerrorlines
The yerrorlines (or errorlines) style is only relevant to
2D data plots. yerrorlines is like linespoints, except
that a vertical error line is also drawn. At each point
(x,y), a line is drawn from (x,y-ydelta) to (x,y+ydelta)
or from (x,ylow) to (x,yhigh), depending on how many
data columns are provided. A tic mark is placed at the
ends of the error bar (see set bars (p. 100) for details).
Either 3 or 4 input columns are required.
3 columns:
4 columns:
x
x
y
y
with yerrorlines
ydelta
ylow yhigh
An additional input column (4th or 5th) may be used to provide information such as variable point color.
See also
errorbar demo.
3D (surface) plots
3D surface plot with hidden line removal
Z axis
Surface plots are generated using the splot command
rather than the plot command. The style with lines
draws a surface made from a grid of lines. Solid surfaces can be drawn using the style with pm3d. Usually
the surface is displayed at some arbitrary viewing angle,
such that it clearly represents a 3D surface. In this case
the X, Y, and Z axes are all visible in the plot. The
illusion of 3D is enhanced by choosing hidden line removal or depth-sorted surface elements. See hidden3d
(p. 116) and the depthorder (p. 136) option of set
pm3d (p. 135).
X axis
The splot command can also calculate and draw contour
lines corresponding to constant Z values. These contour
lines may be drawn onto the surface itself, or projected
onto the XY plane. See set contour (p. 105).
Y axis
3D surface with projected contours
Z axis
X axis
2D projection (set view map)
Y axis
gnuplot 4.7
61
An important special case of the splot command is to
map the Z coordinate onto a 2D surface by projecting
the plot along the Z axis. See set view map (p. 157).
This plot mode can be used to generate contour plots
and heat maps.
Y axis
projected contours using 'set view map'
Part III
X axis
Commands
This section lists the commands acceptable to gnuplot in alphabetical order. Printed versions of this
document contain all commands; the text available interactively may not be complete. Indeed, on some
systems there may be no commands at all listed under this heading.
Note that in most cases unambiguous abbreviations for command names and their options are permissible,
i.e., "p f(x) w li" instead of "plot f(x) with lines".
In the syntax descriptions, braces ({}) denote optional arguments and a vertical bar (|) separates mutually
exclusive choices.
Cd
The cd command changes the working directory.
Syntax:
cd ’<directory-name>’
The directory name must be enclosed in quotes.
Examples:
cd ’subdir’
cd ".."
It is recommended that Windows users use single-quotes, because backslash [\] has special significance inside
double-quotes and has to be escaped. For example,
cd "c:\newdata"
fails, but
cd ’c:\newdata’
cd "c:\\newdata"
work as expected.
Call
The call command is identical to the load command with one exception: you can have up to ten additional
parameters to the command (delimited according to the standard parser rules) which can be substituted
into the lines read from the file. As each line is read from the called input file, it is scanned for the sequence
$ (dollar-sign) followed by a digit (0–9). If found, the sequence is replaced by the corresponding parameter
from the call command line. If the parameter was specified as a string in the call line, it is substituted
without its enclosing quotes. Sequence $# is replaced by the number of passed parameters. $ followed by
any character will be that character; e.g. use $$ to get a single $. Providing more than ten parameters on
the call command line will cause an error. A parameter that was not provided substitutes as nothing. Files
being called may themselves contain call or load commands.
Syntax:
62
gnuplot 4.7
call "<input-file>" <parameter-0> <parm-1> ... <parm-9>
The name of the input file must be enclosed in quotes, and it is recommended that parameters are similarly
enclosed in quotes (future versions of gnuplot may treat quoted and unquoted arguments differently).
Example:
If the file ’calltest.gp’ contains the line:
print "argc=$# p0=$0 p1=$1 p2=$2 p3=$3 p4=$4 p5=$5 p6=$6 p7=x$7x"
entering the command:
call ’calltest.gp’ "abcd" 1.2 + "’quoted’" -- "$2"
will display:
argc=7 p0=abcd p1=1.2 p2=+ p3=’quoted’ p4=- p5=- p6=$2 p7=xx
NOTE: there is a clash in syntax with the datafile using callback operator. Use $$n or column(n) to
access column n from a datafile inside a called datafile plot.
Clear
The clear command erases the current screen or output device as specified by set output. This usually
generates a formfeed on hardcopy devices. Use set terminal to set the device type.
For some terminals clear erases only the portion of the plotting surface defined by set size, so for these it
can be used in conjunction with set multiplot to create an inset.
Example:
set multiplot
plot sin(x)
set origin 0.5,0.5
set size 0.4,0.4
clear
plot cos(x)
unset multiplot
Please see set multiplot (p. 128), set size (p. 145), and set origin (p. 133) for details of these
commands.
Do
Syntax:
do for <iteration-spec> {
<commands>
<commands>
}
Execute a sequence of commands multiple times. The commands must be enclosed in curly brackets, and
the opening "{" must be on the same line as the do keyword. This command cannot be used with old-style
(un-bracketed) if/else statements. See if (p. 70). For examples of iteration specifiers, see iteration (p. 71).
Example:
set multiplot layout 2,2
do for [name in "A B C D"] {
filename = name . ".dat"
set title sprintf("Condition %s",name)
plot filename title name
}
unset multiplot
gnuplot 4.7
63
Evaluate
The evaluate command executes the commands given as an argument string. Newline characters are not
allowed within the string.
Syntax:
eval <string expression>
This is especially useful for a repetition of similar commands.
Example:
set_label(x, y, text) \
= sprintf("set label ’%s’ at %f, %f point pt 5", text, x, y)
eval set_label(1., 1., ’one/one’)
eval set_label(2., 1., ’two/one’)
eval set_label(1., 2., ’one/two’)
Please see substitution macros (p. 40) for another way to execute commands from a string.
Exit
The commands exit and quit, as well as the END-OF-FILE character (usually Ctrl-D) terminate input
from the current input stream: terminal session, pipe, and file input (pipe).
If input streams are nested (inherited load scripts), then reading will continue in the parent stream. When
the top level stream is closed, the program itself will exit.
The command exit gnuplot will immediately and unconditionally cause gnuplot to exit even if the input
stream is multiply nested. In this case any open output files may not be completed cleanly. Example of use:
bind "ctrl-x" "unset output; exit gnuplot"
See help for batch/interactive (p. 21) for more details.
Fit
The fit command can fit a user-supplied expression to a set of data points (x,z) or (x,y,z), using an implementation of the nonlinear least-squares (NLLS) Marquardt-Levenberg algorithm. Any user-defined variable
occurring in the expression may serve as a fit parameter, but the return type of the expression must be real.
Syntax:
fit {<ranges>} <expression>
’<datafile>’ {datafile-modifiers}
via ’<parameter file>’ | <var1>{,<var2>,...}
Ranges may be specified to temporarily limit the data which is to be fitted; any out-of-range data points are
ignored. The syntax is
[{dummy_variable=}{<min>}{:<max>}],
analogous to plot; see plot ranges (p. 88).
<expression> is any valid gnuplot expression, although it is usual to use a previously user-defined function
of the form f(x) or f(x,y).
<datafile> is treated as in the plot command. All the plot datafile modifiers (using, every,...) except
smooth and the deprecated thru are applicable to fit. See plot datafile (p. 78).
The default data formats for fitting functions with a single independent variable, z=f(x), are z or x:z. That
is, if there is only a single column then it is the dependent variable and the line numbers is the independent
variable. If there are two columns, the first is the independent variable and the second is the dependent
variable.
64
gnuplot 4.7
Those formats can be changed with the datafile using qualifier, for example to take the z value from a
different column or to calculate it from several columns. A third using qualifier (a column number or an
expression), if present, is interpreted as the standard deviation of the corresponding z value and is used to
compute a weight for the datum, 1/s**2. Otherwise, all data points are weighted equally, with a weight of
one. Note that if you don’t specify a using option at all, no z standard deviations are read from the datafile
even if it does have a third column, so you’ll always get unit weights.
To fit a function with two independent variables, z=f(x,y), the required format is using with four items,
x:y:z:s. The complete format must be given — no default columns are assumed for a missing token. Weights
for each data point are evaluated from ’s’ as above. If error estimates are not available, a constant value can
be specified as a constant expression (see plot datafile using (p. 84)), e.g., using 1:2:3:(1).
The fit function may have up to five independent variables. There must be two more using qualifiers than
there are independent variables, unless there is only one variable. The allowed formats, and the default
dummy variable names, are as follows:
z
x:z
x:z:s
x:y:z:s
x:y:t:z:s
x:y:t:u:z:s
x:y:t:u:v:z:s
The dummy variable names may be changed with ranges as noted above. The first range corresponds to the
first using spec, etc. A range may also be given for z (the dependent variable), but that name cannot be
changed.
Multiple datasets may be simultaneously fit with functions of one independent variable by making y a
’pseudo-variable’, e.g., the dataline number, and fitting as two independent variables. See fit multi-branch
(p. 68).
The via qualifier specifies which parameters are to be adjusted, either directly, or by referencing a parameter
file.
Examples:
f(x) = a*x**2 + b*x + c
g(x,y) = a*x**2 + b*y**2 + c*x*y
FIT_LIMIT = 1e-6
fit f(x) ’measured.dat’ via ’start.par’
fit f(x) ’measured.dat’ using 3:($7-5) via ’start.par’
fit f(x) ’./data/trash.dat’ using 1:2:3 via a, b, c
fit g(x,y) ’surface.dat’ using 1:2:3:(1) via a, b, c
fit a0 + a1*x/(1 + a2*x/(1 + a3*x)) ’measured.dat’ via a0,a1,a2,a3
fit a*x + b*y ’surface.dat’ using 1:2:3:(1) via a,b
fit [*:*][yaks=*:*] a*x+b*yaks ’surface.dat’ u 1:2:3:(1) via a,b
fit a*x + b*y + c*t ’foo.dat’ using 1:2:3:4:(1) via a,b,c
h(x,y,t,u,v) = a*x + b*y + c*t + d*u + e*v
fit h(x,y,t,u,v) ’foo.dat’ using 1:2:3:4:5:6:(1) via a,b,c,d,e
After each iteration step, detailed information about the current state of the fit is written to the display.
The same information about the initial and final states is written to a log file, "fit.log". This file is always
appended to, so as to not lose any previous fit history; it should be deleted or renamed as desired. By using
the command set fit logfile, the name of the log file can be changed.
If gnuplot was built with this option, and you activated it using set fit errorvariables, the error for each
fitted parameter will be stored in a variable named like the parameter, but with " err" appended. Thus the
errors can be used as input for further computations.
The fit may be interrupted by pressing Ctrl-C. After the current iteration completes, you have the option
to (1) stop the fit and accept the current parameter values, (2) continue the fit, (3) execute a gnuplot
command as specified by the environment variable FIT SCRIPT. The default for FIT SCRIPT is replot,
gnuplot 4.7
65
so if you had previously plotted both the data and the fitting function in one graph, you can display the
current state of the fit.
Once fit has finished, the update command may be used to store final values in a file for subsequent use as
a parameter file. See update (p. 175) for details.
Adjustable parameters
There are two ways that via can specify the parameters to be adjusted, either directly on the command line
or indirectly, by referencing a parameter file. The two use different means to set initial values.
Adjustable parameters can be specified by a comma-separated list of variable names after the via keyword.
Any variable that is not already defined is created with an initial value of 1.0. However, the fit is more likely
to converge rapidly if the variables have been previously declared with more appropriate starting values.
In a parameter file, each parameter to be varied and a corresponding initial value are specified, one per line,
in the form
varname = value
Comments, marked by ’#’, and blank lines are permissible. The special form
varname = value
# FIXED
means that the variable is treated as a ’fixed parameter’, initialized by the parameter file, but not adjusted by
fit. For clarity, it may be useful to designate variables as fixed parameters so that their values are reported
by fit. The keyword # FIXED has to appear in exactly this form.
Short introduction
fit is used to find a set of parameters that ’best’ fits your data to your user-defined function. The fit is
judged on the basis of the sum of the squared differences or ’residuals’ (SSR) between the input data points
and the function values, evaluated at the same places. This quantity is often called ’chisquare’ (i.e., the
Greek letter chi, to the power of 2). The algorithm attempts to minimize SSR, or more precisely, WSSR, as
the residuals are ’weighted’ by the input data errors (or 1.0) before being squared; see fit error estimates
(p. 66) for details.
That’s why it is called ’least-squares fitting’. Let’s look at an example to see what is meant by ’non-linear’,
but first we had better go over some terms. Here it is convenient to use z as the dependent variable for
user-defined functions of either one independent variable, z=f(x), or two independent variables, z=f(x,y). A
parameter is a user-defined variable that fit will adjust, i.e., an unknown quantity in the function declaration.
Linearity/non-linearity refers to the relationship of the dependent variable, z, to the parameters which fit
is adjusting, not of z to the independent variables, x and/or y. (To be technical, the second {and higher}
derivatives of the fitting function with respect to the parameters are zero for a linear least-squares problem).
For linear least-squares (LLS), the user-defined function will be a sum of simple functions, not involving
any parameters, each multiplied by one parameter. NLLS handles more complicated functions in which
parameters can be used in a large number of ways. An example that illustrates the difference between linear
and nonlinear least-squares is the Fourier series. One member may be written as
z=a*sin(c*x) + b*cos(c*x).
If a and b are the unknown parameters and c is constant, then estimating values of the parameters is a linear
least-squares problem. However, if c is an unknown parameter, the problem is nonlinear.
In the linear case, parameter values can be determined by comparatively simple linear algebra, in one
direct step. However LLS is a special case which is also solved along with more general NLLS problems by
the iterative procedure that gnuplot uses. fit attempts to find the minimum by doing a search. Each step
(iteration) calculates WSSR with a new set of parameter values. The Marquardt-Levenberg algorithm selects
the parameter values for the next iteration. The process continues until a preset criterion is met, either (1)
the fit has "converged" (the relative change in WSSR is less than FIT LIMIT), or (2) it reaches a preset
iteration count limit, FIT MAXITER (see fit control variables (p. 68)). The fit may also be interrupted
and subsequently halted from the keyboard (see fit (p. 63)). The user variable FIT CONVERGED contains
66
gnuplot 4.7
1 if the previous fit command terminated due to convergence; it contains 0 if the previous fit terminated for
any other reason.
Often the function to be fitted will be based on a model (or theory) that attempts to describe or predict
the behaviour of the data. Then fit can be used to find values for the free parameters of the model, to
determine how well the data fits the model, and to estimate an error range for each parameter. See fit
error estimates (p. 66).
Alternatively, in curve-fitting, functions are selected independent of a model (on the basis of experience as
to which are likely to describe the trend of the data with the desired resolution and a minimum number of
parameters*functions.) The fit solution then provides an analytic representation of the curve.
However, if all you really want is a smooth curve through your data points, the smooth option to plot may
be what you’ve been looking for rather than fit.
Error estimates
In fit, the term "error" is used in two different contexts, data error estimates and parameter error estimates.
Data error estimates are used to calculate the relative weight of each data point when determining the
weighted sum of squared residuals, WSSR or chisquare. They can affect the parameter estimates, since they
determine how much influence the deviation of each data point from the fitted function has on the final
values. Some of the fit output information, including the parameter error estimates, is more meaningful if
accurate data error estimates have been provided.
The ’statistical overview’ describes some of the fit output and gives some background for the ’practical
guidelines’.
Statistical overview
The theory of non-linear least-squares (NLLS) is generally described in terms of a normal distribution of
errors, that is, the input data is assumed to be a sample from a population having a given mean and a
Gaussian (normal) distribution about the mean with a given standard deviation. For a sample of sufficiently
large size, and knowing the population standard deviation, one can use the statistics of the chisquare distribution to describe a "goodness of fit" by looking at the variable often called "chisquare". Here, it is
sufficient to say that a reduced chisquare (chisquare/degrees of freedom, where degrees of freedom is the
number of datapoints less the number of parameters being fitted) of 1.0 is an indication that the weighted
sum of squared deviations between the fitted function and the data points is the same as that expected for
a random sample from a population characterized by the function with the current value of the parameters
and the given standard deviations.
If the standard deviation for the population is not constant, as in counting statistics where variance = counts,
then each point should be individually weighted when comparing the observed sum of deviations and the
expected sum of deviations.
At the conclusion fit reports ’stdfit’, the standard deviation of the fit, which is the rms of the residuals, and
the variance of the residuals, also called ’reduced chisquare’ when the data points are weighted. The number
of degrees of freedom (the number of data points minus the number of fitted parameters) is used in these
estimates because the parameters used in calculating the residuals of the datapoints were obtained from the
same data. These values are exported to the variables
FIT_NDF = Number of degrees of freedom
FIT_WSSR = Weighted sum-of-squares residual
FIT_STDFIT = sqrt(WSSR/NDF)
To estimate confidence levels for the parameters, one can use the minimum chisquare obtained from the fit
and chisquare statistics to determine the value of chisquare corresponding to the desired confidence level,
but considerably more calculation is required to determine the combinations of parameters which produce
such values.
Rather than determine confidence intervals, fit reports parameter error estimates which are readily obtained
from the variance-covariance matrix after the final iteration. By convention, these estimates are called
gnuplot 4.7
67
"standard errors" or "asymptotic standard errors", since they are calculated in the same way as the standard
errors (standard deviation of each parameter) of a linear least-squares problem, even though the statistical
conditions for designating the quantity calculated to be a standard deviation are not generally valid for the
NLLS problem. The asymptotic standard errors are generally over-optimistic and should not be used for
determining confidence levels, but are useful for qualitative purposes.
The final solution also produces a correlation matrix indicating correlation of parameters in the region of the
solution; The main diagonal elements, autocorrelation, are always 1; if all parameters were independent, the
off-diagonal elements would be nearly 0. Two variables which completely compensate each other would have
an off-diagonal element of unit magnitude, with a sign depending on whether the relation is proportional or
inversely proportional. The smaller the magnitudes of the off-diagonal elements, the closer the estimates of
the standard deviation of each parameter would be to the asymptotic standard error.
Practical guidelines
If you have a basis for assigning weights to each data point, doing so lets you make use of additional knowledge
about your measurements, e.g., take into account that some points may be more reliable than others. That
may affect the final values of the parameters.
Weighting the data provides a basis for interpreting the additional fit output after the last iteration. Even
if you weight each point equally, estimating an average standard deviation rather than using a weight of 1
makes WSSR a dimensionless variable, as chisquare is by definition.
Each fit iteration will display information which can be used to evaluate the progress of the fit. (An ’*’
indicates that it did not find a smaller WSSR and is trying again.) The ’sum of squares of residuals’, also
called ’chisquare’, is the WSSR between the data and your fitted function; fit has minimized that. At this
stage, with weighted data, chisquare is expected to approach the number of degrees of freedom (data points
minus parameters). The WSSR can be used to calculate the reduced chisquare (WSSR/ndf) or stdfit, the
standard deviation of the fit, sqrt(WSSR/ndf). Both of these are reported for the final WSSR.
If the data are unweighted, stdfit is the rms value of the deviation of the data from the fitted function, in
user units.
If you supplied valid data errors, the number of data points is large enough, and the model is correct, the
reduced chisquare should be about unity. (For details, look up the ’chi-squared distribution’ in your favourite
statistics reference.) If so, there are additional tests, beyond the scope of this overview, for determining how
well the model fits the data.
A reduced chisquare much larger than 1.0 may be due to incorrect data error estimates, data errors not
normally distributed, systematic measurement errors, ’outliers’, or an incorrect model function. A plot of
the residuals, e.g., plot ’datafile’ using 1:($2-f($1)), may help to show any systematic trends. Plotting
both the data points and the function may help to suggest another model.
Similarly, a reduced chisquare less than 1.0 indicates WSSR is less than that expected for a random sample
from the function with normally distributed errors. The data error estimates may be too large, the statistical
assumptions may not be justified, or the model function may be too general, fitting fluctuations in a particular
sample in addition to the underlying trends. In the latter case, a simpler function may be more appropriate.
You’ll have to get used to both fit and the kind of problems you apply it to before you can relate the
standard errors to some more practical estimates of parameter uncertainties or evaluate the significance of
the correlation matrix.
Note that fit, in common with most NLLS implementations, minimizes the weighted sum of squared distances
(y-f(x))**2. It does not provide any means to account for "errors" in the values of x, only in y. Also, any
"outliers" (data points outside the normal distribution of the model) will have an exaggerated effect on the
solution.
Control
There are a number of gnuplot variables that can be defined to affect fit. Those which can be defined once
gnuplot is running are listed under ’control variables’ while those defined before starting gnuplot are listed
under ’environment variables’.
68
gnuplot 4.7
Control variables
The default epsilon limit (1e-5) may be changed by declaring a value for
FIT_LIMIT
When the sum of squared residuals changes between two iteration steps by a factor less than this number
(epsilon), the fit is considered to have ’converged’.
The maximum number of iterations may be limited by declaring a value for
FIT_MAXITER
A value of 0 (or not defining it at all) means that there is no limit.
If you need even more control about the algorithm, and know the Marquardt-Levenberg algorithm well, there
are some more variables to influence it. The startup value of lambda is normally calculated automatically
from the ML-matrix, but if you want to, you may provide your own one with
FIT_START_LAMBDA
Specifying FIT START LAMBDA as zero or less will re-enable the automatic selection. The variable
FIT_LAMBDA_FACTOR
gives the factor by which lambda is increased or decreased whenever the chi-squared target function increased or decreased significantly. Setting FIT LAMBDA FACTOR to zero re-enables the default factor of
10.0.
Other variables with the FIT prefix may be added to fit, so it is safer not to use that prefix for user-defined
variables.
The variables FIT SKIP and FIT INDEX were used by earlier releases of gnuplot with a ’fit’ patch called
gnufit and are no longer available. The datafile every modifier provides the functionality of FIT SKIP.
FIT INDEX was used for multi-branch fitting, but multi-branch fitting of one independent variable is now
done as a pseudo-3D fit in which the second independent variable and using are used to specify the branch.
See fit multi-branch (p. 68).
Environment variables
The environment variables must be defined before gnuplot is executed; how to do so depends on your
operating system.
FIT_LOG
changes the name (and/or path) of the file to which the fit log will be written from the default of "fit.log"
in the working directory. The default value can be overwritten using the command set fit logfile.
FIT_SCRIPT
specifies a command that may be executed after an user interrupt. The default is replot, but a plot or
load command may be useful to display a plot customized to highlight the progress of the fit.
Multi-branch
In multi-branch fitting, multiple data sets can be simultaneously fit with functions of one independent
variable having common parameters by minimizing the total WSSR. The function and parameters (branch)
for each data set are selected by using a ’pseudo-variable’, e.g., either the dataline number (a ’column’ index
of -1) or the datafile index (-2), as the second independent variable.
Example: Given two exponential decays of the form, z=f(x), each describing a different data set but having
a common decay time, estimate the values of the parameters. If the datafile has the format x:z:s, then
f(x,y) = (y==0) ? a*exp(-x/tau) : b*exp(-x/tau)
fit f(x,y) ’datafile’ using 1:-2:2:3 via a, b, tau
For a more complicated example, see the file "hexa.fnc" used by the "fit.dem" demo.
Appropriate weighting may be required since unit weights may cause one branch to predominate if there is
a difference in the scale of the dependent variable. Fitting each branch separately, using the multi-branch
solution as initial values, may give an indication as to the relative effect of each branch on the joint solution.
gnuplot 4.7
69
Starting values
Nonlinear fitting is not guaranteed to converge to the global optimum (the solution with the smallest sum of
squared residuals, SSR), and can get stuck at a local minimum. The routine has no way to determine that;
it is up to you to judge whether this has happened.
fit may, and often will get "lost" if started far from a solution, where SSR is large and changing slowly as
the parameters are varied, or it may reach a numerically unstable region (e.g., too large a number causing
a floating point overflow) which results in an "undefined value" message or gnuplot halting.
To improve the chances of finding the global optimum, you should set the starting values at least roughly in
the vicinity of the solution, e.g., within an order of magnitude, if possible. The closer your starting values are
to the solution, the less chance of stopping at another minimum. One way to find starting values is to plot
data and the fitting function on the same graph and change parameter values and replot until reasonable
similarity is reached. The same plot is also useful to check whether the fit stopped at a minimum with a
poor fit.
Of course, a reasonably good fit is not proof there is not a "better" fit (in either a statistical sense, characterized by an improved goodness-of-fit criterion, or a physical sense, with a solution more consistent with the
model.) Depending on the problem, it may be desirable to fit with various sets of starting values, covering
a reasonable range for each parameter.
Tips
Here are some tips to keep in mind to get the most out of fit. They’re not very organized, so you’ll have to
read them several times until their essence has sunk in.
The two forms of the via argument to fit serve two largely distinct purposes. The via "file" form is best
used for (possibly unattended) batch operation, where you just supply the startup values in a file and can
later use update to copy the results back into another (or the same) parameter file.
The via var1, var2, ... form is best used interactively, where the command history mechanism may be
used to edit the list of parameters to be fitted or to supply new startup values for the next try. This is
particularly useful for hard problems, where a direct fit to all parameters at once won’t work without good
starting values. To find such, you can iterate several times, fitting only some of the parameters, until the
values are close enough to the goal that the final fit to all parameters at once will work.
Make sure that there is no mutual dependency among parameters of the function you are fitting. For
example, don’t try to fit a*exp(x+b), because a*exp(x+b)=a*exp(b)*exp(x). Instead, fit either a*exp(x) or
exp(x+b).
A technical issue: the parameters must not be too different in magnitude. The larger the ratio of the
largest and the smallest absolute parameter values, the slower the fit will converge. If the ratio is close to
or above the inverse of the machine floating point precision, it may take next to forever to converge, or
refuse to converge at all. You will have to adapt your function to avoid this, e.g., replace ’parameter’ by
’1e9*parameter’ in the function definition, and divide the starting value by 1e9.
If you can write your function as a linear combination of simple functions weighted by the parameters to be
fitted, by all means do so. That helps a lot, because the problem is no longer nonlinear and should converge
with only a small number of iterations, perhaps just one.
Some prescriptions for analysing data, given in practical experimentation courses, may have you first fit some
functions to your data, perhaps in a multi-step process of accounting for several aspects of the underlying
theory one by one, and then extract the information you really wanted from the fitting parameters of those
functions. With fit, this may often be done in one step by writing the model function directly in terms of
the desired parameters. Transforming data can also quite often be avoided, though sometimes at the cost of
a more difficult fit problem. If you think this contradicts the previous paragraph about simplifying the fit
function, you are correct.
A "singular matrix" message indicates that this implementation of the Marquardt-Levenberg algorithm
can’t calculate parameter values for the next iteration. Try different starting values, writing the function in
another form, or a simpler function.
Finally, a nice quote from the manual of another fitting package (fudgit), that kind of summarizes all these
70
gnuplot 4.7
issues: "Nonlinear fitting is an art!"
Help
The help command displays built-in help. To specify information on a particular topic use the syntax:
help {<topic>}
If <topic> is not specified, a short message is printed about gnuplot. After help for the requested topic is
given, a menu of subtopics is given; help for a subtopic may be requested by typing its name, extending the
help request. After that subtopic has been printed, the request may be extended again or you may go back
one level to the previous topic. Eventually, the gnuplot command line will return.
If a question mark (?) is given as the topic, the list of topics currently available is printed on the screen.
History
history command lists or saves previous entries in the history of the command line editing, or executes an
entry.
Here you find ’usage by examples’:
history
# show the complete history
history 5
# show last 5 entries in the history
history quiet 5
# show last 5 entries without entry numbers
history "hist.gp"
# write the complete history to file hist.gp
history "hist.gp" append # append the complete history to file hist.gp
history 10 "hist.gp" # write last 10 commands to file hist.gp
history 10 "|head -5 >>diary.gp" # write 5 history commands using pipe
history ?load
# show all history entries starting with "load"
history ?"set c"
# like above, several words enclosed in quotes
hi !reread
# execute last entry starting with "reread"
hist !"set xr"
# like above, several words enclosed in quotes
hi !hi
# guess yourself :-))
On systems which support a popen function (Unix), the output of history can be piped through an external
program by starting the file name with a ’|’, as one of the above examples demonstrates.
If
New syntax:
if (<condition>) { <commands>;
<commands>
<commands>
} else {
<commands>
}
Old syntax:
if (<condition>) <command-line> [; else if (<condition>) ...; else ...]
This version of gnuplot supports block-structured if/else statements. If the keyword if or else is immediately
followed by an opening "{", then conditional execution applies to all statements, possibly on multiple input
lines, until a matching "}" terminates the block. If commands may be nested.
The old single-line if/else syntax is still supported, but can not be mixed with the new block-structured
syntax. See if-old (p. 71).
gnuplot 4.7
71
If-old
Through gnuplot version 4.4, the scope of the if/else commands was limited to a single input line. This has
been replaced by allowing a multi-line clause to be enclosed in curly brackets. The old syntax is still honored
by itself but cannot be used inside a bracketed clause.
If no opening "{" follows the if keyword, the command(s) in <command-line> will be executed if
<condition> is true (non-zero) or skipped if <condition> is false (zero). Either case will consume commands on the input line until the end of the line or an occurrence of else. Note that use of ; to allow
multiple commands on the same line will not end the conditionalized commands.
Examples:
pi=3
if (pi!=acos(-1)) print "?Fixing pi!"; pi=acos(-1); print pi
will display:
?Fixing pi!
3.14159265358979
but
if (1==2) print "Never see this"; print "Or this either"
will not display anything.
else:
v=0
v=v+1; if (v%2) print "2" ; else if (v%3) print "3"; else print "fred"
(repeat the last line repeatedly!)
See reread (p. 95) for an example of using if and reread together to perform a loop.
Iteration
The plot, splot, set and unset commands may optionally contain an iteration clause. This has the effect
of executing the basic command multiple times, each time re-evaluating any expressions that make use of
the iteration control variable. Iteration of arbitrary command sequences can be requested using the do
command. Two forms of iteration clause are currently supported:
for [intvar = start:end{:increment}]
for [stringvar in "A B C D"]
Examples:
plot for [filename in "A.dat B.dat C.dat"] filename using 1:2 with lines
plot for [basename in "A B C"] basename.".dat" using 1:2 with lines
set for [i = 1:10] style line i lc rgb "blue"
unset for [tag = 100:200] label tag
Nested iteration is supported:
set for [i=1:9] for [j=1:9] label i*10+j sprintf("%d",i*10+j) at i,j
See additional documentation for plot iteration (p. 89), do (p. 62).
Load
The load command executes each line of the specified input file as if it had been typed in interactively.
Files created by the save command can later be loaded. Any text file containing valid commands can
be created and then executed by the load command. Files being loaded may themselves contain load or
call commands. See comments (p. 22) for information about comments in commands. To load with
arguments, see call (p. 61).
Syntax:
72
gnuplot 4.7
load "<input-file>"
The name of the input file must be enclosed in quotes.
The special filename "-" may be used to load commands from standard input. This allows a gnuplot
command file to accept some commands from standard input. Please see help for batch/interactive
(p. 21) for more details.
On some systems which support a popen function (Unix), the load file can be read from a pipe by starting
the file name with a ’<’.
Examples:
load ’work.gnu’
load "func.dat"
load "< loadfile_generator.sh"
The load command is performed implicitly on any file names given as arguments to gnuplot. These are
loaded in the order specified, and then gnuplot exits.
Lower
Syntax:
lower {plot_window_nb}
The lower command lowers (opposite to raise) plot window(s) associated with the interactive terminal of
your gnuplot session, i.e. pm, win, wxt or x11. It puts the plot window to bottom in the z-order windows
stack of the window manager of your desktop.
As x11 and wxt support multiple plot windows, then by default they lower these windows in descending
order of most recently created on top to the least recently created on bottom. If a plot number is supplied
as an optional parameter, only the associated plot window will be lowered if it exists.
The optional parameter is ignored for single plot-window terminals, i.e. pm and win.
Pause
The pause command displays any text associated with the command and then waits a specified amount of
time or until the carriage return is pressed. pause is especially useful in conjunction with load files.
Syntax:
pause <time> {"<string>"}
pause mouse {<endcondition>}{, <endcondition>} {"<string>"}
<time> may be any constant or expression. Choosing -1 will wait until a carriage return is hit, zero (0)
won’t pause at all, and a positive number will wait the specified number of seconds. The time is rounded to
an integer number of seconds if subsecond time resolution is not supported by the given platform. pause 0
is synonymous with print.
If the current terminal supports mousing, then pause mouse will terminate on either a mouse click or on
ctrl-C. For all other terminals, or if mousing is not active, pause mouse is equivalent to pause -1.
If one or more end conditions are given after pause mouse, then any one of the conditions will terminate
the pause. The possible end conditions are keypress, button1, button2, button3, close, and any. If
the pause terminates on a keypress, then the ascii value of the key pressed is returned in MOUSE KEY.
The character itself is returned as a one character string in MOUSE CHAR. Hotkeys (bind command) are
disabled if keypress is one of the end conditions. Zooming is disabled if button3 is one of the end conditions.
In all cases the coordinates of the mouse are returned in variables MOUSE X, MOUSE Y, MOUSE X2,
MOUSE Y2. See mouse variables (p. 38).
Note: Since pause communicates with the operating system rather than the graphics, it may behave differently with different device drivers (depending upon how text and graphics are mixed).
Examples:
gnuplot 4.7
pause
pause
pause
pause
pause
pause
pause
pause
73
-1
# Wait until a carriage return is hit
3
# Wait three seconds
-1 "Hit return to continue"
10 "Isn’t this pretty? It’s a cubic spline."
mouse "Click any mouse button on selected data point"
mouse keypress "Type a letter from A-F in the active window"
mouse button1,keypress
mouse any "Any key or button will terminate"
The variant "pause mouse key" will resume after any keypress in the active plot window. If you want to
wait for a particular key to be pressed, you can use a reread loop such as:
print "I will resume after you hit the Tab key in the plot window"
load "wait_for_tab"
File "wait for tab" contains the lines
pause mouse key
if (MOUSE_KEY != 9) reread
Plot
plot is the primary command for drawing plots with gnuplot. It creates plots of functions and data in many,
many ways. plot is used to draw 2D functions and data; splot draws 2D projections of 3D surfaces and
data. plot and splot offer many features in common; see splot (p. 169) for differences. Note specifically
that although the binary <binary list> variation does work for both plot and splot, there are small
differences between them.
Syntax:
plot {<ranges>}
{<iteration>}
{<function> | {"<datafile>" {datafile-modifiers}}}
{axes <axes>} {<title-spec>} {with <style>}
{, {definitions{,}} <function> ...}
where either a <function> or the name of a data file enclosed in quotes is supplied. A function is a
mathematical expression or a pair of mathematical expressions in parametric mode. Functions may be
builtin, user-defined, or provided in the plot command itself. Multiple datafiles and/or functions may be
plotted in a single command, separated by commas. See data (p. 78), functions (p. 88).
Examples:
plot
plot
plot
plot
plot
sin(x)
sin(x), cos(x)
f(x) = sin(x*a), a = .2, f(x), a = .4, f(x)
"datafile.1" with lines, "datafile.2" with points
[t=1:10] [-pi:pi*2] tan(t), \
"data.1" using (tan($2)):($3/$4) smooth csplines \
axes x1y2 notitle with lines 5
plot for [datafile in "spinach.dat broccoli.dat"] datafile
See also show plot (p. 134).
Axes
There are four possible sets of axes available; the keyword <axes> is used to select the axes for which a
particular line should be scaled. x1y1 refers to the axes on the bottom and left; x2y2 to those on the top
and right; x1y2 to those on the bottom and right; and x2y1 to those on the top and left. Ranges specified
on the plot command apply only to the first set of axes (bottom left).
74
gnuplot 4.7
Binary
BINARY DATA FILES:
Some earlier versions of gnuplot automatically detected binary data files. It is now necessary to provide
the keyword binary after the filename. Adequate details of the file format must be given on the command
line or extracted from the file itself for a supported binary filetype. In particular, there are two structures
for binary files, binary matrix format and binary general format.
The binary matrix format contains a two dimensional array of 32 bit IEEE float values with an additional
column and row of coordinate values. As with ASCII matrix, in the using list, enumeration of the coordinate
row constitutes column 1, enumeration of the coordinate column constitutes column 2, and the array of values
constitutes column 3.
The binary general format contains an arbitrary number of columns for which information must be specified
at the command line. For example, array, record, format and using can indicate the size, format and
dimension of data. There are a variety of useful commands for skipping file headers and changing endianess.
There are a set of commands for positioning and translating data since often coordinates are not part of the
file when uniform sampling is inherent in the data. Different from matrix binary or ASCII, general binary
does not treat the generated columns as 1, 2 or 3 in the using list. Rather, column 1 begins with column 1
of the file, or as specified in the format list.
There are global default settings for the various binary options which may be set using the same syntax as the
options when used as part of the (s)plot <filename> binary ... command. This syntax is set datafile
binary .... The general rule is that common command-line specified parameters override file-extracted
parameters which override default parameters.
Binary matrix is the default binary format when no keywords specific to binary general are given, i.e.,
array, record, format, filetype.
General binary data can be entered at the command line via the special file name ’-’. However, this is
intended for use through a pipe where programs can exchange binary data, not for keyboards. There is
no "end of record" character for binary data. Gnuplot continues reading from a pipe until it has read the
number of points declared in the array qualifier. See binary matrix (p. 170) or binary general (p. 74)
for more details.
The index keyword is not supported, since the file format allows only one surface per file. The every and
using filters are supported. using operates as if the data were read in the above triplet form.
Binary File Splot Demo.
General
General binary data in which format information is not necessarily part of the file can be read by giving
further details about the file format at the command line. Although the syntax is slightly arcane to the
casual user, general binary is particularly useful for application programs using gnuplot and sending large
amounts of data.
Syntax:
plot ’<file_name>’ {binary <binary list>} ...
splot ’<file_name>’ {binary <binary list>} ...
General binary format is activated by keywords in <binary list> pertaining to information about file structure, i.e., array, record, format or filetype. Otherwise, matrix binary format is assumed. (See binary
matrix (p. 170) for more details.)
There are some standard file types that may be read for which details about the binary format may be
extracted automatically. (Type show datafile binary at the command line for a list.) Otherwise, details
must be specified at the command line or set in the defaults. Keywords are described below.
The keyword filetype in <binary list> controls the routine used to read the file, i.e., the format of the data.
For a list of the supported file types, type show datafile binary filetypes. If no file type is given, the
rule is that traditional gnuplot binary is assumed for splot if the binary keyword stands alone. In all other
circumstances, for plot or when one of the <binary list> keywords appears, a raw binary file is assumed
gnuplot 4.7
75
whereby the keywords specify the binary format.
General binary data files fall into two basic classes, and some files may be of both classes depending upon
how they are treated. There is that class for which uniform sampling is assumed and point coordinates must
be generated. This is the class for which full control via the <binary list> keywords applies. For this class,
the settings precedence is that command line parameters override in-file parameters, which override default
settings. The other class is that set of files for which coordinate information is contained within the file or
there is possibly a non-uniform sampling such as gnuplot binary.
Other than for the unique data files such as gnuplot binary, one should think of binary data as conceptually
the same as ASCII data. Each point has columns of information which are selected via the <using list>
associated with using. When no format string is specified, gnuplot will retrieve a number of binary variables
equal to the largest column given in the <using list>. For example, using 1:3 will result in three columns
being read, of which the second will be ignored. There are default using lists based upon the typical number
of parameters associated with a certain plot type. For example, with image has a default of using 1,
while with rgbimage has a default of using 1:2:3. Note that the special characters for using representing
point/line/index generally should not be used for binary data. There are keywords in <binary list> that
control this.
Array
Describes the sampling array dimensions associated with the binary file. The coordinates will be generated
by gnuplot. A number must be specified for each dimension of the array. For example, array=(10,20)
means the underlying sampling structure is two-dimensional with 10 points along the first (x) dimension and
20 points along the second (y) dimension. A negative number indicates that data should be read until the
end of file. If there is only one dimension, the parentheses may be omitted. A colon can be used to separate
the dimensions for multiple records. For example, array=25:35 indicates there are two one-dimensional
records in the file.
Note:
Gnuplot version 4.2 used the syntax array=128x128 rather than
array=(128,128). The older syntax is now deprecated, but may
still work if your copy of gnuplot was built to support
backwards compatibility.
Record
This keyword serves the same function as array, having the same syntax. However, record causes gnuplot
to not generate coordinate information. This is for the case where such information may be included in one
of the columns of the binary data file.
Skip
This keyword allows you to skip sections of a binary file. For instance, if the file contains a 1024 byte header
before the start of the data region you would probably want to use
plot ’<file_name>’ binary skip=1024 ...
If there are multiple records in the file, you may specify a leading offset for each. For example, to skip 512
bytes before the 1st record and 256 bytes before the second and third records
plot ’<file_name> binary record=356:356:356 skip=512:256:256 ...
Format
The default binary format is a float. For more flexibility, the format can include details about variable sizes.
For example, format="%uchar%int%float" associates an unsigned character with the first using column,
an int with the second column and a float with the third column. If the number of size specifications is less
than the greatest column number, the size is implicitly taken to be similar to the last given variable size.
76
gnuplot 4.7
Furthermore, similar to the using specification, the format can include discarded columns via the * character
and have implicit repetition via a numerical repeat-field. For example, format="%*2int%3float" causes
gnuplot to discard two ints before reading three floats. To list variable sizes, type show datafile binary
datasizes. There are a group of names that are machine dependent along with their sizes in bytes for the
particular compilation. There is also a group of names which attempt to be machine independent.
Endian
Often the endianess of binary data in the file does not agree with the endianess used by the platform on which
gnuplot is running. Several words can direct gnuplot how to arrange bytes. For example endian=little
means treat the binary file as having byte significance from least to greatest. The options are
little:
big:
default:
swap (swab):
least significant to greatest significance
greatest significance to least significance
assume file endianess is the same as compiler
Interchange the significance. (If things
don’t look right, try this.)
Gnuplot can support "middle" ("pdp") endian if it is compiled with that option.
Filetype
For some standard binary file formats gnuplot can extract all the necessary information from the file in
question. As an example, "format=edf" will read ESRF Header File format files. For a list of the currently
supported file formats, type show datafile binary filetypes.
There is a special file type called auto for which gnuplot will check if the binary file’s extension is a quasistandard extension for a supported format.
Command line keywords may be used to override settings extracted from the file. The settings from the file
override any defaults. (See set datafile binary (p. 108) for details.)
Avs avs is one of the automatically recognized binary file types for images. AVS is an extremely simple
format, suitable mostly for streaming between applications. It consists of 2 longs (xwidth, ywidth) followed
by a stream of pixels, each with four bytes of information alpha/red/green/blue.
Edf edf is one of the automatically recognized binary file types for images. EDF stands for ESRF Data
Format, and it supports both edf and ehf formats (the latter means ESRF Header Format). More information
on specifications can be found at
http://www.edfplus.info/specs
Png If gnuplot was configured to use the libgd library for png/gif/jpeg output, then it can also be used to
read these same image types as binary files. You can use an explicit command
plot ’file.png’ binary filetype=png
Or the file type will be recognized automatically from the extension if you have previously requested
set datafile binary filetype=auto
Keywords
The following keywords apply only when generating coordinates from binary data files. That is, the control
mapping the individual elements of a binary array, matrix, or image to specific x/y/z positions.
gnuplot 4.7
77
Scan A great deal of confusion can arise concerning the relationship between how gnuplot scans a binary file
and the dimensions seen on the plot. To lessen the confusion, conceptually think of gnuplot always scanning
the binary file point/line/plane or fast/medium/slow. Then this keyword is used to tell gnuplot how to map
this scanning convention to the Cartesian convention shown in plots, i.e., x/y/z. The qualifier for scan is a
two or three letter code representing where point is assigned (first letter), line is assigned (second letter), and
plane is assigned (third letter). For example, scan=yx means the fastest, point-by-point, increment should
be mapped along the Cartesian y dimension and the middle, line-by-line, increment should be mapped along
the x dimension.
When the plotting mode is plot, the qualifier code can include the two letters x and y. For splot, it can
include the three letters x, y and z.
There is nothing restricting the inherent mapping from point/line/plane to apply only to Cartesian coordinates. For this reason there are cylindrical coordinate synonyms for the qualifier codes where t (theta), r
and z are analogous to the x, y and z of Cartesian coordinates.
Transpose Shorthand notation for scan=yx or scan=yxz.
Dx, dy, dz When gnuplot generates coordinates, it uses the spacing described by these keywords. For
example dx=10 dy=20 would mean space samples along the x dimension by 10 and space samples along
the y dimension by 20. dy cannot appear if dx does not appear. Similarly, dz cannot appear if dy does
not appear. If the underlying dimensions are greater than the keywords specified, the spacing of the highest
dimension given is extended to the other dimensions. For example, if an image is being read from a file and
only dx=3.5 is given gnuplot uses a delta x and delta y of 3.5.
The following keywords also apply only when generating coordinates. However they may also be used with
matrix binary files.
Flipx, flipy, flipz Sometimes the scanning directions in a binary datafile are not consistent with that
assumed by gnuplot. These keywords can flip the scanning direction along dimensions x, y, z.
Origin When gnuplot generates coordinates based upon transposition and flip, it attempts to always
position the lower left point in the array at the origin, i.e., the data lies in the first quadrant of a Cartesian
system after transpose and flip.
To position the array somewhere else on the graph, the origin keyword directs gnuplot to position the lower
left point of the array at a point specified by a tuple. The tuple should be a double for plot and a triple for
splot. For example, origin=(100,100):(100,200) is for two records in the file and intended for plotting
in two dimensions. A second example, origin=(0,0,3.5), is for plotting in three dimensions.
Center Similar to origin, this keyword will position the array such that its center lies at the point given
by the tuple. For example, center=(0,0). Center does not apply when the size of the array is Inf.
Rotate The transpose and flip commands provide some flexibility in generating and orienting coordinates.
However, for full degrees of freedom, it is possible to apply a rotational vector described by a rotational
angle in two dimensions.
The rotate keyword applies to the two-dimensional plane, whether it be plot or splot. The rotation is done
with respect to the positive angle of the Cartesian plane.
The angle can be expressed in radians, radians as a multiple of pi, or degrees. For example, rotate=1.5708,
rotate=0.5pi and rotate=90deg are equivalent.
If origin is specified, the rotation is done about the lower left sample point before translation. Otherwise,
the rotation is done about the array center.
78
gnuplot 4.7
Perpendicular For splot, the concept of a rotational vector is implemented by a triple representing the
vector to be oriented normal to the two-dimensional x-y plane. Naturally, the default is (0,0,1). Thus
specifying both rotate and perpendicular together can orient data myriad ways in three-space.
The two-dimensional rotation is done first, followed by the three-dimensional rotation. That is, if R’ is the
rotational 2 x 2 matrix described by an angle, and P is the 3 x 3 matrix projecting (0,0,1) to (xp,yp,zp),
let R be constructed from R’ at the upper left sub-matrix, 1 at element 3,3 and zeros elsewhere. Then the
matrix formula for translating data is v’ = P R v, where v is the 3 x 1 vector of data extracted from the
data file. In cases where the data of the file is inherently not three-dimensional, logical rules are used to
place the data in three-space. (E.g., usually setting the z-dimension value to zero and placing 2D data in
the x-y plane.)
Data
Discrete data contained in a file can be displayed by specifying the name of the data file (enclosed in single
or double quotes) on the plot command line.
Syntax:
plot ’<file_name>’ {binary <binary list>}
{{nonuniform} matrix}
{index <index list> | index "<name>"}
{every <every list>}
{thru <thru expression>}
{using <using list>}
{smooth <option>}
{volatile} {noautoscale}
The modifiers binary, index, every, thru, using, and smooth are discussed separately. In brief, binary
allows data entry from a binary file (default is ASCII), index selects which data sets in a multi-data-set file
are to be plotted, every specifies which points within a single data set are to be plotted, using determines
how the columns within a single record are to be interpreted (thru is a special case of using), and smooth
allows for simple interpolation and approximation. (splot has a similar syntax, but does not support the
smooth and thru options.)
The noautoscale keyword means that the points making up this plot will be ignored when automatically
determining axis range limits.
ASCII DATA FILES:
Data files should contain at least one data point per record (using can select one data point from the record).
Records beginning with # (and also with ! on VMS) will be treated as comments and ignored. Each data
point represents an (x,y) pair. For plots with error bars or error bars with lines (see set style errorbars
(p. 58) or set style errorlines (p. 60)), each data point is (x,y,ydelta), (x,y,ylow,yhigh), (x,y,xdelta),
(x,y,xlow,xhigh), or (x,y,xlow,xhigh,ylow,yhigh).
In all cases, the numbers of each record of a data file must be separated by white space (one or more blanks
or tabs) unless a format specifier is provided by the using option. This white space divides each record
into columns. However, whitespace inside a pair of double quotes is ignored when counting columns, so the
following datafile line has three columns:
1.0 "second column" 3.0
Data may be written in exponential format with the exponent preceded by the letter e or E. The fortran
exponential specifiers d, D, q, and Q may also be used if the command set datafile fortran is in effect.
Only one column (the y value) need be provided. If x is omitted, gnuplot provides integer values starting
at 0.
In datafiles, blank records (records with no characters other than blanks and a newline and/or carriage
return) are significant.
Single blank records designate discontinuities in a plot; no line will join points separated by a blank records
(if they are plotted with a line style).
gnuplot 4.7
79
Two blank records in a row indicate a break between separate data sets. See index (p. 80).
If autoscaling has been enabled (set autoscale), the axes are automatically extended to include all datapoints, with a whole number of tic marks if tics are being drawn. This has two consequences: i) For splot,
the corner of the surface may not coincide with the corner of the base. In this case, no vertical line is drawn.
ii) When plotting data with the same x range on a dual-axis graph, the x coordinates may not coincide if
the x2tics are not being drawn. This is because the x axis has been autoextended to a whole number of tics,
but the x2 axis has not. The following example illustrates the problem:
reset; plot ’-’, ’-’ axes x2y1
1 1
19 19
e
1 1
19 19
e
To avoid this, you can use the fixmin/fixmax feature of the set autoscale command, which turns off the
automatic extension of the axis range up to the next tic mark.
Label coordinates and text can also be read from a data file (see labels (p. 55)).
Every
The every keyword allows a periodic sampling of a data set to be plotted.
In the discussion a "point" is a datum defined by a single record in the file; "block" here will mean the same
thing as "datablock" (see glossary (p. 33)).
Syntax:
plot ’file’ every {<point_incr>}
{:{<block_incr>}
{:{<start_point>}
{:{<start_block>}
{:{<end_point>}
{:<end_block>}}}}}
The data points to be plotted are selected according to a loop from <start point> to <end point> with
increment <point incr> and the blocks according to a loop from <start block> to <end block> with
increment <block incr>.
The first datum in each block is numbered ’0’, as is the first block in the file.
Note that records containing unplottable information are counted.
Any of the numbers can be omitted; the increments default to unity, the start values to the first point or
block, and the end values to the last point or block. If every is not specified, all points in all lines are
plotted.
Examples:
every
every
every
every
:::3::3
:::::9
2:2
::5::15
#
#
#
#
selects
selects
selects
selects
just the fourth block (’0’ is first)
the first 10 blocks
every other point in every other block
points 5 through 15 in each block
See
simple plot demos (simple.dem)
,
Non-parametric splot demos
, and
Parametric splot demos
.
80
gnuplot 4.7
Example datafile
This example plots the data in the file "population.dat" and a theoretical curve:
pop(x) = 103*exp((1965-x)/10)
set xrange [1960:1990]
plot ’population.dat’, pop(x)
The file "population.dat" might contain:
# Gnu population in Antarctica since 1965
1965
103
1970
55
1975
34
1980
24
1985
10
Binary examples:
# Selects two float values (second one implicit) with a float value
# discarded between them for an indefinite length of 1D data.
plot ’<file_name>’ binary format="%float%*float" using 1:2 with lines
# The data file header contains all details necessary for creating
# coordinates from an EDF file.
plot ’<file_name>’ binary filetype=edf with image
plot ’<file_name>.edf’ binary filetype=auto with image
# Selects three unsigned characters for components of a raw RGB image
# and flips the y-dimension so that typical image orientation (start
# at top left corner) translates to the Cartesian plane. Pixel
# spacing is given and there are two images in the file. One of them
# is translated via origin.
plot ’<file_name>’ binary array=(512,1024):(1024,512) format=’%uchar’ \
dx=2:1 dy=1:2 origin=(0,0):(1024,1024) flipy u 1:2:3 w rgbimage
# Four separate records in which the coordinates are part of the
# data file. The file was created with a endianess different from
# the system on which gnuplot is running.
splot ’<file_name>’ binary record=30:30:29:26 endian=swap u 1:2:3
# Same input file, but this time we skip the 1st and 3rd records
splot ’<file_name>’ binary record=30:26 skip=360:348 endian=swap u 1:2:3
See also binary matrix (p. 170).
Index
The index keyword allows you to select specific data sets in a multi-data-set file for plotting.
Syntax:
plot ’file’ index { <m>{:<n>{:<p>}} | "<name>" }
Data sets are separated by pairs of blank records. index <m> selects only set <m>; index <m>:<n>
selects sets in the range <m> to <n>; and index <m>:<n>:<p> selects indices <m>, <m>+<p>,
<m>+2<p>, etc., but stopping at <n>. Following C indexing, the index 0 is assigned to the first data set
in the file. Specifying too large an index results in an error message. If <p> is specified but <n> is left
blank then every <p>-th dataset is read until the end of the file. If index is not specified, the entire file is
plotted as a single data set.
Example:
gnuplot 4.7
81
plot ’file’ index 4:5
For each point in the file, the index value of the data set it appears in is available via the pseudo-column
column(-2). This leads to an alternative way of distinguishing individual data sets within a file as shown
below. This is more awkward than the index command if all you are doing is selecting one data set for
plotting, but is very useful if you want to assign different properties to each data set. See pseudocolumns
(p. 86), lc variable (p. 35).
Example:
plot ’file’ using 1:(column(-2)==4 ? $2 : NaN)
# very awkward
plot ’file’ using 1:2:(column(-2)) linecolor variable # very useful!
index ’<name>’ selects the data set with name ’<name>’. Names are assigned to data sets in comment
lines. The comment character and leading white space are removed from the comment line. If the resulting
line starts with <name>, the following data set is now named <name> and can be selected.
Example:
plot ’file’ index ’Population’
Please note that every comment that starts with <name> will name the following data set. To avoid
problems it may be useful to choose a naming scheme like ’== Population ==’ or ’[Population]’.
Smooth
gnuplot includes a few general-purpose routines for interpolation and approximation of data; these are
grouped under the smooth option. More sophisticated data processing may be performed by preprocessing
the data externally or by using fit with an appropriate model.
Syntax:
smooth {unique | frequency | cumulative | cnormal | kdensity
| csplines | acsplines | bezier | sbezier}
unique, frequency, cumulative and cnormal plot the data after making them monotonic. Each of the
other routines uses the data to determine the coefficients of a continuous curve between the endpoints of
the data. This curve is then plotted in the same manner as a function, that is, by finding its value at
uniform intervals along the abscissa (see set samples (p. 145)) and connecting these points with straight
line segments (if a line style is chosen).
If autoscale is in effect, the ranges will be computed such that the plotted curve lies within the borders of
the graph.
If autoscale is not in effect, and the smooth option is either acspline or cspline, the sampling of the
generated curve is done across the intersection of the x range covered by the input data and the fixed
abscissa range as defined by set xrange.
If too few points are available to allow the selected option to be applied, an error message is produced. The
minimum number is one for unique and frequency, four for acsplines, and three for the others.
The smooth options have no effect on function plots.
Acsplines The acsplines option approximates the data with a "natural smoothing spline". After the data
are made monotonic in x (see smooth unique (p. 82)), a curve is piecewise constructed from segments of
cubic polynomials whose coefficients are found by the weighting the data points; the weights are taken from
the third column in the data file. That default can be modified by the third entry in the using list, e.g.,
plot ’data-file’ using 1:2:(1.0) smooth acsplines
Qualitatively, the absolute magnitude of the weights determines the number of segments used to construct
the curve. If the weights are large, the effect of each datum is large and the curve approaches that produced
by connecting consecutive points with natural cubic splines. If the weights are small, the curve is composed
82
gnuplot 4.7
of fewer segments and thus is smoother; the limiting case is the single segment produced by a weighted linear
least squares fit to all the data. The smoothing weight can be expressed in terms of errors as a statistical
weight for a point divided by a "smoothing factor" for the curve so that (standard) errors in the file can be
used as smoothing weights.
Example:
sw(x,S)=1/(x*x*S)
plot ’data_file’ using 1:2:(sw($3,100)) smooth acsplines
Bezier The bezier option approximates the data with a Bezier curve of degree n (the number of data
points) that connects the endpoints.
Csplines The csplines option connects consecutive points by natural cubic splines after rendering the
data monotonic (see smooth unique (p. 82)).
Sbezier The sbezier option first renders the data monotonic (unique) and then applies the bezier
algorithm.
Unique The unique option makes the data monotonic in x; points with the same x-value are replaced by
a single point having the average y-value. The resulting points are then connected by straight line segments.
Frequency The frequency option makes the data monotonic in x; points with the same x-value are
replaced by a single point having the summed y-values. The resulting points are then connected by straight
line segments. See also
smooth.dem
Cumulative The cumulative option makes the data monotonic in x; points with the same x-value are
replaced by a single point containing the cumulative sum of y-values of all data points with lower x-values
(i.e. to the left of the current data point). This can be used to obtain a cumulative distribution function
from data. See also
smooth.dem
Cnormal The cnormal option makes the data monotonic in x and normalises the y-values onto the range
[0:1]. Points with the same x-value are replaced by a single point containing the cumulative sum of y-values
of all data points with lower x-values (i.e. to the left of the current data point) divided by the total sum
of all y-values. This can be used to obtain a normalised cumulative distribution function from data (useful
when comparing sets of samples with differing numbers of members). See also
smooth.dem
Kdensity The kdensity option is a way to plot a kernel density estimate (which is a smooth histogram)
for a random collection of points, using Gaussian kernels. A Gaussian is placed at the location of each point
in the first column and the sum of all these Gaussians is plotted as a function. The value in the second
column is taken as weight of the Gaussian. (To obtain a normalized histogram, this should be 1/numberof-points). The value of the third column, if supplied, is taken as the bandwidth for the kernels. If only
two columns have been specified, or if the value of the third column is zero or less, gnuplot calculates the
bandwidth which would be optimal if the input data was normally distributed. (This will usually be a very
conservative, i.e. broad bandwidth.)
Special-filenames
There are a few filenames that have a special meaning: ’ ’, ’-’, ’+’ and ’++’.
gnuplot 4.7
83
The empty filename ’ ’ tells gnuplot to re-use the previous input file in the same plot command. So to plot
two columns from the same input file:
plot ’filename’ using 1:2, ’’ using 1:3
The special filenames ’+’ and ’++’ are a mechanism to allow the full range of using specifiers and plot styles
with in-line functions. Normally a function plot can only have a single y (or z) value associated with each
sampled point. The pseudo-file ’+’ treats the sampled points as column 1, and allows additional column
values to be specified via a using specification, just as for a true input file. The number of samples returned
is controlled by set samples. Example:
plot ’+’ using ($1):(sin($1)):(sin($1)**2) with filledcurves
Similarly the pseudo-file ’++’ returns 2 columns of data forming a regular grid of [x,y] coordinates with the
number of points along x controlled by set samples and the number of points along y controlled by set
isosamples. You must set xrange and yrange before plotting ’++’. Examples:
splot ’++’ using 1:2:(sin($1)*sin($2)) with pm3d
plot ’++’ using 1:2:(sin($1)*sin($2)) with image
The special filename ’-’ specifies that the data are inline; i.e., they follow the command. Only the data
follow the command; plot options like filters, titles, and line styles remain on the plot command line. This
is similar to << in unix shell script, and $DECK in VMS DCL. The data are entered as though they are
being read from a file, one data point per record. The letter "e" at the start of the first column terminates
data entry. The using option can be applied to these data — using it to filter them through a function
might make sense, but selecting columns probably doesn’t!
’-’ is intended for situations where it is useful to have data and commands together, e.g., when gnuplot is
run as a sub-process of some front-end application. Some of the demos, for example, might use this feature.
While plot options such as index and every are recognized, their use forces you to enter data that won’t
be used. For example, while
plot ’-’ index 0, ’-’ index 1
2
4
6
10
12
14
e
2
4
6
10
12
14
e
does indeed work,
plot ’-’, ’-’
2
4
6
e
10
12
14
e
84
gnuplot 4.7
is a lot easier to type.
If you use ’-’ with replot, you may need to enter the data more than once. See replot (p. 94), refresh
(p. 94).
A blank filename (’ ’) specifies that the previous filename should be reused. This can be useful with things
like
plot ’a/very/long/filename’ using 1:2, ’’ using 1:3, ’’ using 1:4
(If you use both ’-’ and ’ ’ on the same plot command, you’ll need to have two sets of inline data, as in the
example above.)
On systems with a popen function, the datafile can be piped through a shell command by starting the file
name with a ’<’. For example,
pop(x) = 103*exp(-x/10)
plot "< awk ’{print $1-1965, $2}’ population.dat", pop(x)
would plot the same information as the first population example but with years since 1965 as the x axis. If
you want to execute this example, you have to delete all comments from the data file above or substitute
the following command for the first part of the command above (the part up to the comma):
plot "< awk ’$0 !~ /^#/ {print $1-1965, $2}’ population.dat"
While this approach is most flexible, it is possible to achieve simple filtering with the using or thru keywords.
Thru
The thru function is provided for backward compatibility.
Syntax:
plot ’file’ thru f(x)
It is equivalent to:
plot ’file’ using 1:(f($2))
While the latter appears more complex, it is much more flexible. The more natural
plot ’file’ thru f(y)
also works (i.e. you can use y as the dummy variable).
thru is parsed for splot and fit but has no effect.
Using
The most common datafile modifier is using. It tells the program which columns of data in the input file
are to be plotted.
Syntax:
plot ’file’ using <entry> {:<entry> {:<entry> ...}} {’format’}
If a format is specified, it is used to read in each datafile record using the C library ’scanf’ function. Otherwise
the record is interpreted as consisting of columns (fields) of data separated by whitespace (spaces and/or
tabs), but see datafile separator (p. 108).
Each <entry> may be a simple column number that selects the value from one field of the input file, a string
that matches a column label in the first line of a data set, an expression enclosed in parentheses, or a special
function not enclosed in parentheses such as xticlabels(2).
If the entry is an expression in parentheses, then the function column(N) may be used to indicate the value
in column N. That is, column(1) refers to the first item read, column(2) to the second, and so on. The
special symbols $1, $2, ... are shorthand for column(1), column(2) ... The function valid(N) tests whether
the value in the Nth column is a valid number. If each column of data in the input file contains a label in
the first row rather than a data value, this label can be used to identify the column on input and/or in the
plot legend. The column() function can be used to select an input column by label rather than by column
number. For example, if the data file contains
gnuplot 4.7
Height
val1
...
Weight
val1
...
85
Age
val1
...
then the following plot commands are all equivalent
plot ’datafile’ using
plot ’datafile’ using
’’ using
plot ’datafile’ using
3:1, ’’ using 3:2
(column("Age")):(column(1)), \
(column("Age")):(column(2))
"Age":"Height", ’’ using "Age":"Weight"
To use the column labels in the plot legend, use set key autotitle columnhead.
In addition to the actual columns 1...N in the input data file, gnuplot presents data from several "pseudocolumns" that hold bookkeeping information. E.g. $0 or column(0) returns the sequence number of this
data record within a dataset. Please see pseudocolumns (p. 86).
An empty <entry> will default to its order in the list of entries. For example, using ::4 is interpreted as
using 1:2:4.
If the using list has only a single entry, that <entry> will be used for y and the data point number (pseudocolumn $0) is used for x; for example, "plot ’file’ using 1" is identical to "plot ’file’ using 0:1". If the
using list has two entries, these will be used for x and y. See set style (p. 146) and fit (p. 63) for details
about plotting styles that make use of data from additional columns of input.
’scanf’ accepts several numerical specifications but gnuplot requires all inputs to be double-precision floatingpoint variables, so "%lf" is essentially the only permissible specifier. A format string given by the user must
contain at least one such input specifier, and no more than seven of them. ’scanf’ expects to see white space
— a blank, tab ("\t"), newline ("\n"), or formfeed ("\f") — between numbers; anything else in the input
stream must be explicitly skipped.
Note that the use of "\t", "\n", or "\f" requires use of double-quotes rather than single-quotes.
Using examples This creates a plot of the sum of the 2nd and 3rd data against the first: The format string
specifies comma- rather than space-separated columns. The same result could be achieved by specifying set
datafile separator ",".
plot ’file’ using 1:($2+$3) ’%lf,%lf,%lf’
In this example the data are read from the file "MyData" using a more complicated format:
plot ’MyData’ using "%*lf%lf%*20[^\n]%lf"
The meaning of this format is:
%*lf
%lf
%*20[^\n]
%lf
ignore
read a
ignore
read a
a number
double-precision number (x by default)
20 non-newline characters
double-precision number (y by default)
One trick is to use the ternary ?: operator to filter data:
plot ’file’ using 1:($3>10 ? $2 : 1/0)
which plots the datum in column two against that in column one provided the datum in column three exceeds
ten. 1/0 is undefined; gnuplot quietly ignores undefined points, so unsuitable points are suppressed. Or
you can use the pre-defined variable NaN to achieve the same result.
In fact, you can use a constant expression for the column number, provided it doesn’t start with an opening
parenthesis; constructs like using 0+(complicated expression) can be used. The crucial point is that
the expression is evaluated once if it doesn’t start with a left parenthesis, or once for each data point read
if it does.
If timeseries data are being used, the time can span multiple columns. The starting column should be
specified. Note that the spaces within the time must be included when calculating starting columns for
86
gnuplot 4.7
other data. E.g., if the first element on a line is a time with an embedded space, the y value should be
specified as column three.
It should be noted that plot ’file’, plot ’file’ using 1:2, and plot ’file’ using ($1):($2) can be subtly
different: 1) if file has some lines with one column and some with two, the first will invent x values when they
are missing, the second will quietly ignore the lines with one column, and the third will store an undefined
value for lines with one point (so that in a plot with lines, no line joins points across the bad point); 2) if
a line contains text at the first column, the first will abort the plot on an error, but the second and third
should quietly skip the garbage.
In fact, it is often possible to plot a file with lots of lines of garbage at the top simply by specifying
plot ’file’ using 1:2
However, if you want to leave text in your data files, it is safer to put the comment character (#) in the first
column of the text lines.
Pseudocolumns Expressions in the using clause of a plot statement can refer to additional bookkeeping
values in addition to the actual data values contained in the input file. These are contained in "pseudocolumns".
column(0)
The sequential order of each point within a data set.
The counter starts at 0 and is reset by two sequential blank
records. The shorthand form $0 is available.
column(-1) This counter starts at 0 and is reset by a single blank line.
This corresponds to the data line in array or grid data.
column(-2) The index number of the current data set within a file that
contains multiple data sets. See ‘index‘.
Xticlabels Axis tick labels can be generated via a string function, usually taking a data column as an
argument. The simplest form uses the data column itself as a string. That is, xticlabels(N) is shorthand for
xticlabels(stringcolumn(N)). This example uses the contents of column 3 as x-axis tick labels.
plot ’datafile’ using <xcol>:<ycol>:xticlabels(3) with <plotstyle>
Axis tick labels may be generated for any of the plot axes: x x2 y y2 z. The ticlabels(<labelcol>) specifiers
must come after all of the data coordinate specifiers in the using portion of the command. For each data
point which has a valid set of X,Y[,Z] coordinates, the string value given to xticlabels() is added to the list
of xtic labels at the same X coordinate as the point it belongs to. xticlabels() may be shortened to xtic()
and so on.
Example:
splot "data" using 2:4:6:xtic(1):ytic(3):ztic(6)
In this example the x and y axis tic labels are taken from different columns than the x and y coordinate
values. The z axis tics, however, are generated from the z coordinate of the corresponding point.
Example:
plot "data" using 1:2:xtic( $3 > 10. ? "A" : "B" )
This example shows the use of a string-valued function to generate x-axis tick labels. Each point in the data
file generates a tick mark on x labeled either "A" or "B" depending on the value in column 3.
X2ticlabels See plot using xticlabels (p. 86).
Yticlabels See plot using xticlabels (p. 86).
Y2ticlabels See plot using xticlabels (p. 86).
gnuplot 4.7
87
Zticlabels See plot using xticlabels (p. 86).
Volatile
The volatile keyword indicates that the data previously read from the input stream or file may not be
available for re-reading. This tells the program to use refresh rather than replot commands whenever
possible. See refresh (p. 94).
Errorbars
Error bars are supported for 2D data file plots by reading one to four additional columns (or using entries);
these additional values are used in different ways by the various errorbar styles.
In the default situation, gnuplot expects to see three, four, or six numbers on each line of the data file —
either
(x, y, ydelta),
(x, y, ylow, yhigh),
(x, y, xdelta),
(x, y, xlow, xhigh),
(x, y, xdelta, ydelta), or
(x, y, xlow, xhigh, ylow, yhigh).
The x coordinate must be specified. The order of the numbers must be exactly as given above, though the
using qualifier can manipulate the order and provide values for missing columns. For example,
plot ’file’ with errorbars
plot ’file’ using 1:2:(sqrt($1)) with xerrorbars
plot ’file’ using 1:2:($1-$3):($1+$3):4:5 with xyerrorbars
The last example is for a file containing an unsupported combination of relative x and absolute y errors.
The using entry generates absolute x min and max from the relative error.
The y error bar is a vertical line plotted from (x, ylow) to (x, yhigh). If ydelta is specified instead of ylow
and yhigh, ylow = y - ydelta and yhigh = y + ydelta are derived. If there are only two numbers on the
record, yhigh and ylow are both set to y. The x error bar is a horizontal line computed in the same fashion.
To get lines plotted between the data points, plot the data file twice, once with errorbars and once with
lines (but remember to use the notitle option on one to avoid two entries in the key). Alternately, use the
errorlines command (see errorlines (p. 87)).
The error bars have crossbars at each end unless set bars is used (see set bars (p. 100) for details).
If autoscaling is on, the ranges will be adjusted to include the error bars.
See also
errorbar demos.
See plot using (p. 84), plot with (p. 91), and set style (p. 146) for more information.
Errorlines
Lines with error bars are supported for 2D data file plots by reading one to four additional columns (or
using entries); these additional values are used in different ways by the various errorlines styles.
In the default situation, gnuplot expects to see three, four, or six numbers on each line of the data file —
either
(x, y, ydelta),
(x, y, ylow, yhigh),
(x, y, xdelta),
(x, y, xlow, xhigh),
(x, y, xdelta, ydelta), or
(x, y, xlow, xhigh, ylow, yhigh).
88
gnuplot 4.7
The x coordinate must be specified. The order of the numbers must be exactly as given above, though the
using qualifier can manipulate the order and provide values for missing columns. For example,
plot ’file’ with errorlines
plot ’file’ using 1:2:(sqrt($1)) with xerrorlines
plot ’file’ using 1:2:($1-$3):($1+$3):4:5 with xyerrorlines
The last example is for a file containing an unsupported combination of relative x and absolute y errors.
The using entry generates absolute x min and max from the relative error.
The y error bar is a vertical line plotted from (x, ylow) to (x, yhigh). If ydelta is specified instead of ylow
and yhigh, ylow = y - ydelta and yhigh = y + ydelta are derived. If there are only two numbers on the
record, yhigh and ylow are both set to y. The x error bar is a horizontal line computed in the same fashion.
The error bars have crossbars at each end unless set bars is used (see set bars (p. 100) for details).
If autoscaling is on, the ranges will be adjusted to include the error bars.
See plot using (p. 84), plot with (p. 91), and set style (p. 146) for more information.
Functions
Built-in or user-defined functions can be displayed by the plot and splot commands in addition to, or instead
of, data read from a file. The requested function is evaluated by sampling at regular intervals spanning the
independent axis range[s]. See set samples (p. 145) and set isosamples (p. 118). Example:
approx(ang) = ang - ang**3 / (3*2)
plot sin(x) title "sin(x)", approx(x) title "approximation"
To set a default plot style for functions, see set style function (p. 149). For information on built-in
functions, see expressions functions (p. 26). For information on defining your own functions, see userdefined (p. 31).
Parametric
When in parametric mode (set parametric) mathematical expressions must be given in pairs for plot and
in triplets for splot.
Examples:
plot sin(t),t**2
splot cos(u)*cos(v),cos(u)*sin(v),sin(u)
Data files are plotted as before, except any preceding parametric function must be fully specified before a
data file is given as a plot. In other words, the x parametric function (sin(t) above) and the y parametric
function (t**2 above) must not be interrupted with any modifiers or data functions; doing so will generate
a syntax error stating that the parametric function is not fully specified.
Other modifiers, such as with and title, may be specified only after the parametric function has been
completed:
plot sin(t),t**2 title ’Parametric example’ with linespoints
See also
Parametric Mode Demos.
Ranges
The optional ranges specify the region of the graph that will be displayed. Note that if you specify the range
as part of a plot command rather than using a separate set range statement, you will not be able to pan
or zoom the plot interactively, and will not be able to change the range later and then replot.
Syntax:
gnuplot 4.7
89
[{<dummy-var>=}{{<min>}:{<max>}}]
[{{<min>}:{<max>}}]
The first form applies to the independent variable (xrange or trange, if in parametric mode). The second
form applies to the dependent variable yrange (and xrange, too, if in parametric mode). <dummy-var> is
a new name for the independent variable. (The defaults may be changed with set dummy.) The optional
<min> and <max> terms can be constant expressions or *.
In non-parametric mode, the order in which ranges must be given is xrange and yrange.
In parametric mode, the order for the plot command is trange, xrange, and yrange. The following plot
command shows setting the trange to [-pi:pi], the xrange to [-1.3:1.3] and the yrange to [-1:1] for the
duration of the graph:
plot [-pi:pi] [-1.3:1.3] [-1:1] sin(t),t**2
Note that the x2range and y2range cannot be specified here — set x2range and set y2range must be
used.
Ranges are interpreted in the order listed above for the appropriate mode. Once all those needed are
specified, no further ones must be listed, but unneeded ones cannot be skipped — use an empty range [] as
a placeholder.
* can be used to allow autoscaling of either of min and max. See also set autoscale (p. 98).
Ranges specified on the plot or splot command line affect only that graph; use the set xrange, set yrange,
etc., commands to change the default ranges for future graphs.
With time data, you must provide the range (in the same manner as the time appears in the datafile) within
quotes. gnuplot uses the timefmt string to read the value — see set timefmt (p. 155).
Examples:
This uses the current ranges:
plot cos(x)
This sets the x range only:
plot [-10:30] sin(pi*x)/(pi*x)
This is the same, but uses t as the dummy-variable:
plot [t = -10 :30] sin(pi*t)/(pi*t)
This sets both the x and y ranges:
plot [-pi:pi] [-3:3] tan(x), 1/x
This sets only the y range, and turns off autoscaling on both axes:
plot [ ] [-2:sin(5)*-8] sin(x)**besj0(x)
This sets xmax and ymin only:
plot [:200] [-pi:] exp(sin(x))
This sets the x range for a timeseries:
set timefmt "%d/%m/%y %H:%M"
plot ["1/6/93 12:00":"5/6/93 12:00"] ’timedata.dat’
Iteration
If many similar files or functions are to be plotted together, it may be convenient to do so by iterating over
a shared plot command.
Syntax:
plot for [<variable> = <start> : <end> {:<increment>}]
plot for [<variable> in "string of words"]
90
gnuplot 4.7
The scope of an iteration ends at the next comma or the end of the command, whichever comes first. Iteration
can not be nested.
This will plot one curve, sin(3x), because iteration ends at the comma
plot for [i=1:3] j=i, sin(j*x)
This will plot three curves because there is no comma after the definition of j
plot for [i=1:3] j=i sin(j*x)
Example:
plot for [dataset in "apples bananas"] dataset."dat" title dataset
In this example iteration is used both to generate a file name and a corresponding title.
Example:
file(n) = sprintf("dataset_%d.dat",n)
splot for [i=1:10] file(i) title sprintf("dataset %d",i)
This example defines a string-valued function that generates file names, and plots ten such files together.
The iteration variable (’i’ in this example) is treated as an integer, and may be used more than once.
Example:
set key left
plot for [n=1:4] x**n sprintf("%d",n)
This example plots a family of functions.
Example:
list = "apple banana cabbage daikon eggplant"
item(n) = word(list,n)
plot for [i=1:words(list)] item[i].".dat" title item(i)
list = "new stuff"
replot
This example steps through a list and plots once per item. Because the items are retrieved dynamically, you
can change the list and then replot.
Example:
list = "apple banana cabbage daikon eggplant"
plot for [i in list] i.".dat" title i
list = "new stuff"
replot
This is example does exactly the same thing as the previous example, but uses the string iterator form of
the command rather than an integer iterator.
Title
By default each plot is listed in the key by the corresponding function or file name. You can give an explicit
plot title instead using the title option.
Syntax:
title <text> | notitle [<ignored text>]
title columnheader | title columnheader(N)
where <text> is a quoted string or an expression that evaluates to a string. The quotes will not be shown
in the key.
There is also an option that will interpret the first entry in a column of input data (i.e. the column header)
as a text field, and use it as the key title. See datastrings (p. 23). This can be made the default by
specifying set key autotitle columnhead.
gnuplot 4.7
91
The line title and sample can be omitted from the key by using the keyword notitle. A null title (title
’ ’) is equivalent to notitle. If only the sample is wanted, use one or more blanks (title ’ ’). If notitle is
followed by a string this string is ignored.
If key autotitles is set (which is the default) and neither title nor notitle are specified the line title is the
function name or the file name as it appears on the plot command. If it is a file name, any datafile modifiers
specified will be included in the default title.
The layout of the key itself (position, title justification, etc.) can be controlled by set key. Please see set
key (p. 119) for details.
Examples:
This plots y=x with the title ’x’:
plot x
This plots x squared with title "x^2" and file "data.1" with title "measured data":
plot x**2 title "x^2", ’data.1’ t "measured data"
This puts an untitled circular border around a polar graph:
set polar; plot my_function(t), 1 notitle
Plot multiple columns of data, each of which contains its own title in the file
plot for [i=1:4] ’data’ using i title columnhead
With
Functions and data may be displayed in one of a large number of styles. The with keyword provides the
means of selection.
Syntax:
with <style> { {linestyle | ls <line_style>}
| {{linetype | lt <line_type>}
{linewidth | lw <line_width>}
{linecolor | lc <colorspec>}
{pointtype | pt <point_type>}
{pointsize | ps <point_size>}
{fill | fs <fillstyle>}
{nohidden3d} {nocontours} {nosurface}
{palette}}
}
where <style> is one of
lines
points
linespoints
dots
impulses
labels
steps
fsteps
histeps
errorbars
errorlines
financebars
vectors
xerrorbar
xerrorlines
xyerrorbars
xyerrorlines
yerrorbars
yerrorlines
or
boxes
boxerrorbars
boxxyerrorbars
boxplot
candlesticks
filledcurves
histograms
image
rgbimage
rgbalpha
circles
ellipses
pm3d
The first group of styles have associated line, point, and text properties. The second group of styles also have
fill properties. See fillstyle (p. 148). Some styles have further sub-styles. See plotting styles (p. 43) for
details of each.
A default style may be chosen by set style function and set style data.
92
gnuplot 4.7
By default, each function and data file will use a different line type and point type, up to the maximum
number of available types. All terminal drivers support at least six different point types, and re-use them, in
order, if more are required. To see the complete set of line and point types available for the current terminal,
type test (p. 174).
If you wish to choose the line or point type for a single plot, <line type> and <point type> may be specified.
These are positive integer constants (or expressions) that specify the line type and point type to be used for
the plot. Use test to display the types available for your terminal.
You may also scale the line width and point size for a plot by using <line width> and <point size>, which
are specified relative to the default values for each terminal. The pointsize may also be altered globally —
see set pointsize (p. 143) for details. But note that both <point size> as set here and as set by set
pointsize multiply the default point size — their effects are not cumulative. That is, set pointsize 2; plot
x w p ps 3 will use points three times default size, not six.
It is also possible to specify pointsize variable either as part of a line style or for an individual plot. In
this case one extra column of input is required, i.e. 3 columns for a 2D plot and 4 columns for a 3D splot.
The size of each individual point is determined by multiplying the global pointsize by the value read from
the data file.
If you have defined specific line type/width and point type/size combinations with set style line, one of
these may be selected by setting <line style> to the index of the desired style.
If gnuplot was built with pm3d support, the special keyword palette is allowed for smooth color change of
lines, points and dots in splots. The color is chosen from a smooth palette which was set previously with the
command set palette. The color value corresponds to the z-value of the point coordinates or to the color
coordinate if specified by the 4th parameter in using. Both 2D and 3D plots (plot and splot commands)
can use palette colors as specified by either their fractional value or the corresponding value mapped to the
colorbox range. A palette color value can also be read from an explicitly specified input column in the using
specifier. See colors (p. 33), set palette (p. 138), linetype (p. 124).
The keyword nohidden3d applies only to plots made with the splot command. Normally the global option
set hidden3d applies to all plots in the graph. You can attach the nohidden3d option to any individual
plots that you want to exclude from the hidden3d processing. The individual elements other than surfaces
(i.e. lines, dots, labels, ...) of a plot marked nohidden3d will all be drawn, even if they would normally be
obscured by other plot elements.
Similarly, the keyword nocontours will turn off contouring for an individual plot even if the global property
set contour is active.
Similarly, the keyword nosurface will turn off the 3D surface for an individual plot even if the global
property set surface is active.
The keywords may be abbreviated as indicated.
Note that the linewidth, pointsize and palette options are not supported by all terminals.
Examples:
This plots sin(x) with impulses:
plot sin(x) with impulses
This plots x with points, x**2 with the default:
plot x w points, x**2
This plots tan(x) with the default function style, file "data.1" with lines:
plot [ ] [-2:5] tan(x), ’data.1’ with l
This plots "leastsq.dat" with impulses:
plot ’leastsq.dat’ w i
This plots the data file "population" with boxes:
plot ’population’ with boxes
This plots "exper.dat" with errorbars and lines connecting the points (errorbars require three or four
columns):
gnuplot 4.7
93
plot ’exper.dat’ w lines, ’exper.dat’ notitle w errorbars
Another way to plot "exper.dat" with errorlines (errorbars require three or four columns):
plot ’exper.dat’ w errorlines
This plots sin(x) and cos(x) with linespoints, using the same line type but different point types:
plot sin(x) with linesp lt 1 pt 3, cos(x) with linesp lt 1 pt 4
This plots file "data" with points of type 3 and twice usual size:
plot ’data’ with points pointtype 3 pointsize 2
This plots file "data" with variable pointsize read from column 4
plot ’data’ using 1:2:4 with points pt 5 pointsize variable
This plots two data sets with lines differing only by weight:
plot ’d1’ t "good" w l lt 2 lw 3, ’d2’ t "bad" w l lt 2 lw 1
This plots filled curve of x*x and a color stripe:
plot x*x with filledcurve closed, 40 with filledcurve y1=10
This plots x*x and a color box:
plot x*x, (x>=-5 && x<=5 ? 40 : 1/0) with filledcurve y1=10 lt 8
This plots a surface with color lines:
splot x*x-y*y with line palette
This plots two color surfaces at different altitudes:
splot x*x-y*y with pm3d, x*x+y*y with pm3d at t
Print
The print command prints the value of <expression> to the screen. It is synonymous with pause 0.
<expression> may be anything that gnuplot can evaluate that produces a number, or it can be a string.
Syntax:
print <expression> {, <expression>, ...}
See expressions (p. 25). The output file can be set with set print.
Pwd
The pwd command prints the name of the working directory to the screen.
Note that if you wish to store the current directory into a string variable or use it in string expressions, then
you can use variable GPVAL PWD, see show variables all (p. 156).
Quit
The exit and quit commands and END-OF-FILE character will exit gnuplot. Each of these commands
will clear the output device (as does the clear command) before exiting.
94
gnuplot 4.7
Raise
Syntax:
raise {plot_window_nb}
The raise command raises (opposite to lower) plot window(s) associated with the interactive terminal of
your gnuplot session, i.e. pm, win, wxt or x11. It puts the plot window to front (top) in the z-order
windows stack of the window manager of your desktop.
As x11 and wxt support multiple plot windows, then by default they raise these windows in descending
order of most recently created on top to the least recently created on bottom. If a plot number is supplied
as an optional parameter, only the associated plot window will be raised if it exists.
The optional parameter is ignored for single plot-windows terminal, i.e. pm and win.
If the window is not raised under X11, then perhaps the plot window is running in a different X11 session
(telnet or ssh session, for example), or perhaps raising is blocked by your window manager policy setting.
Refresh
The refresh command is similar to replot, with two major differences. refresh reformats and redraws the
current plot using the data already read in. This means that you can use refresh for plots with in-line
data (pseudo-device ’-’) and for plots from datafiles whose contents are volatile. You cannot use the refresh
command to add new data to an existing plot.
Mousing operations, in particular zoom and unzoom, will use refresh rather than replot if appropriate.
Example:
plot ’datafile’ volatile with lines, ’-’ with labels
100 200 "Special point"
e
# Various mousing operations go here
set title "Zoomed in view"
set term post
set output ’zoom.ps’
refresh
Replot
The replot command without arguments repeats the last plot or splot command. This can be useful for
viewing a plot with different set options, or when generating the same plot for several devices.
Arguments specified after a replot command will be added onto the last plot or splot command (with
an implied ’,’ separator) before it is repeated. replot accepts the same arguments as the plot and splot
commands except that ranges cannot be specified. Thus you can use replot to plot a function against the
second axes if the previous command was plot but not if it was splot.
N.B. — use of
plot ’-’ ; ... ; replot
is not recommended, because it will require that you type in the data all over again. In most cases you can
use the refresh command instead, which will redraw the plot using the data previously read in.
Note that replot does not work in multiplot mode, since it reproduces only the last plot rather than the
entire screen.
See also command-line-editing (p. 22) for ways to edit the last plot (p. 73) (splot (p. 169)) command.
See also show plot (p. 134) to show the whole current plotting command, and the possibility to copy it
into the history (p. 70).
gnuplot 4.7
95
Reread
The reread command causes the current gnuplot command file, as specified by a load command or on the
command line, to be reset to its starting point before further commands are read from it. This essentially
implements an endless loop of the commands from the beginning of the command file to the reread command.
(But this is not necessarily a disaster — reread can be very useful when used in conjunction with if.) The
reread command has no effect if input from standard input.
Examples:
Suppose the file "looper" contains the commands
a=a+1
plot sin(x*a)
pause -1
if(a<5) reread
and from within gnuplot you submit the commands
a=0
load ’looper’
The result will be five plots (separated by the pause message).
Suppose the file "data" contains six columns of numbers with a total yrange from 0 to 10; the first is x and
the next are five different functions of x. Suppose also that the file "plotter" contains the commands
c_p = c_p+1
plot "$0" using 1:c_p with lines linetype c_p
if(c_p < n_p) reread
and from within gnuplot you submit the commands
n_p=6
c_p=1
unset key
set yrange [0:10]
set multiplot
call ’plotter’ ’data’
unset multiplot
The result is a single graph consisting of five plots. The yrange must be set explicitly to guarantee that the
five separate graphs (drawn on top of each other in multiplot mode) will have exactly the same axes. The
linetype must be specified; otherwise all the plots would be drawn with the same type. See animate.dem in
demo directory for an animated example.
Reset
The reset command causes all graph-related options that can be set with the set command to take on their
default values. This command is useful, e.g., to restore the default graph settings at the end of a command
file, or to return to a defined state after lots of settings have been changed within a command file. Please
refer to the set command to see the default values that the various options take.
The following are not affected by reset.
‘set term‘ ‘set output‘ ‘set loadpath‘ ‘set fontpath‘ ‘set linetype‘
‘set encoding‘ ‘set decimalsign‘ ‘set locale‘ ‘set psdir‘
reset errors clears only the error state variables GPVAL ERRNO and GPVAL ERRMSG.
reset bind restores all hotkey bindings to their default state.
96
gnuplot 4.7
Save
The save command saves user-defined functions, variables, the set term status, all set options, or all of
these, plus the last plot (splot) command to the specified file.
Syntax:
save
{<option>} ’<filename>’
where <option> is functions, variables, terminal or set. If no option is used, gnuplot saves functions,
variables, set options and the last plot (splot) command.
saved files are written in text format and may be read by the load command. For save with the set option
or without any option, the terminal choice and the output filename are written out as a comment, to get
an output file that works in other installations of gnuplot, without changes and without risk of unwillingly
overwriting files.
save terminal will write out just the terminal status, without the comment marker in front of it. This is
mainly useful for switching the terminal setting for a short while, and getting back to the previously set
terminal, afterwards, by loading the saved terminal status. Note that for a single gnuplot session you may
rather use the other method of saving and restoring current terminal by the commands set term push and
set term pop, see set term (p. 153).
The filename must be enclosed in quotes.
The special filename "-" may be used to save commands to standard output. On systems which support
a popen function (Unix), the output of save can be piped through an external program by starting the
file name with a ’|’. This provides a consistent interface to gnuplot’s internal settings to programs which
communicate with gnuplot through a pipe. Please see help for batch/interactive (p. 21) for more details.
Examples:
save
save
save
save
save
save
save
’work.gnu’
functions ’func.dat’
var ’var.dat’
set ’options.dat’
term ’myterm.gnu’
’-’
’|grep title >t.gp’
Set-show
The set command can be used to set lots of options. No screen is drawn, however, until a plot, splot, or
replot command is given.
The show command shows their settings; show all shows all the settings.
Options changed using set can be returned to the default state by giving the corresponding unset command.
See also the reset (p. 95) command, which returns all settable parameters to default values.
If a variable contains time/date data, show will display it according to the format currently defined by
set timefmt, even if that was not in effect when the variable was initially defined. The set and unset
commands may optionally contain an iteration clause. See iteration (p. 71).
Angles
By default, gnuplot assumes the independent variable in polar graphs is in units of radians. If set angles
degrees is specified before set polar, then the default range is [0:360] and the independent variable has
units of degrees. This is particularly useful for plots of data files. The angle setting also applies to 3D
mapping as set via the set mapping command.
Syntax:
set angles {degrees | radians}
show angles
gnuplot 4.7
97
The angle specified in set grid polar is also read and displayed in the units specified by set angles.
set angles also affects the arguments of the machine-defined functions sin(x), cos(x) and tan(x), and the
outputs of asin(x), acos(x), atan(x), atan2(x), and arg(x). It has no effect on the arguments of hyperbolic
functions or Bessel functions. However, the output arguments of inverse hyperbolic functions of complex
arguments are affected; if these functions are used, set angles radians must be in effect to maintain
consistency between input and output arguments.
x={1.0,0.1}
set angles radians
y=sinh(x)
print y
#prints {1.16933, 0.154051}
print asinh(y) #prints {1.0, 0.1}
but
set angles degrees
y=sinh(x)
print y
#prints {1.16933, 0.154051}
print asinh(y) #prints {57.29578, 5.729578}
See also
poldat.dem:
polar plot using set angles demo.
Arrow
Arbitrary arrows can be placed on a plot using the set arrow command.
Syntax:
set
set
set
set
set
arrow
arrow
arrow
arrow
arrow
{<tag>} from <position> to <position>
{<tag>} from <position> rto <position>
{<tag>} from <position> length <coord> angle <ang>
<tag> arrowstyle | as <arrow_style>
<tag> {nohead | head | backhead | heads}
{size <headlength>,<headangle>{,<backangle>}}
{filled | empty | nofilled}
{front | back}
{linestyle <line_style>}
{linetype <line_type>} {linewidth <line_width}
unset arrow {<tag>}
show arrow {<tag>}
<tag> is an integer that identifies the arrow. If no tag is given, the lowest unused tag value is assigned
automatically. The tag can be used to delete or change a specific arrow. To change any attribute of an
existing arrow, use the set arrow command with the appropriate tag and specify the parts of the arrow to
be changed.
The position of the first end point of the arrow is always specified by "from". The other end point can
be specified using any of three different mechanisms. The <position>s are specified by either x,y or x,y,z,
and may be preceded by first, second, graph, screen, or character to select the coordinate system.
Unspecified coordinates default to 0. See coordinates (p. 22) for details. A coordinate system specifier
does not carry over from the first endpoint description the second.
1) "to <position>" specifies the absolute coordinates of the other end..
2) "rto <position>" specifies an offset to the "from" position. For linear axes, graph and screen coordinates,
the distance between the start and the end point corresponds to the given relative coordinate. For logarithmic
axes, the relative given coordinate corresponds to the factor of the coordinate between start and end point.
Thus, a negative relative value or zero are not allowed for logarithmic axes.
3) "length <coordinate> angle <angle>" specifies the orientation of the arrow in the plane of the graph.
Again any of the coordinate systems can be used to specify the length. The angle is always in degrees.
98
gnuplot 4.7
Other characteristics of the arrow can either be specified as a pre-defined arrow style or by providing them
in set arrow command. For a detailed explanation of arrow characteristics, see arrowstyle (p. 146).
Examples:
To set an arrow pointing from the origin to (1,2) with user-defined linestyle 5, use:
set arrow to 1,2 ls 5
To set an arrow from bottom left of plotting area to (-5,5,3), and tag the arrow number 3, use:
set arrow 3 from graph 0,0 to -5,5,3
To change the preceding arrow to end at 1,1,1, without an arrow head and double its width, use:
set arrow 3 to 1,1,1 nohead lw 2
To draw a vertical line from the bottom to the top of the graph at x=3, use:
set arrow from 3, graph 0 to 3, graph 1 nohead
To draw a vertical arrow with T-shape ends, use:
set arrow 3 from 0,-5 to 0,5 heads size screen 0.1,90
To draw an arrow relatively to the start point, where the relative distances are given in graph coordinates,
use:
set arrow from 0,-5 rto graph 0.1,0.1
To draw an arrow with relative end point in logarithmic x axis, use:
set logscale x
set arrow from 100,-5 rto 10,10
This draws an arrow from 100,-5 to 1000,5. For the logarithmic x axis, the relative coordinate 10 means
"factor 10" while for the linear y axis, the relative coordinate 10 means "difference 10".
To delete arrow number 2, use:
unset arrow 2
To delete all arrows, use:
unset arrow
To show all arrows (in tag order), use:
show arrow
arrows demos.
Autoscale
Autoscaling may be set individually on the x, y or z axis or globally on all axes. The default is to autoscale
all axes. If you want to autoscale based on a subset of the plots in the figure, you can mark the other ones
with the flag noautoscale. See datafile (p. 78).
Syntax:
set autoscale {<axes>{|min|max|fixmin|fixmax|fix} | fix | keepfix}
set autoscale noextend
unset autoscale {<axes>}
show autoscale
where <axes> is either x, y, z, cb, x2, y2 or xy. A keyword with min or max appended (this cannot
be done with xy) tells gnuplot to autoscale just the minimum or maximum of that axis. If no keyword is
given, all axes are autoscaled.
A keyword with fixmin, fixmax or fix appended tells gnuplot to disable extension of the axis range to the
next tic mark position, for autoscaled axes using equidistant tics; set autoscale fix sets this for all axes.
Command set autoscale keepfix autoscales all axes while keeping the fix settings.
gnuplot 4.7
99
set autoscale noextend is a synonym for set autoscale fix.
When autoscaling, the axis range is automatically computed and the dependent axis (y for a plot and z for
splot) is scaled to include the range of the function or data being plotted.
If autoscaling of the dependent axis (y or z) is not set, the current y or z range is used.
Autoscaling the independent variables (x for plot and x,y for splot) is a request to set the domain to match
any data file being plotted. If there are no data files, autoscaling an independent variable has no effect. In
other words, in the absence of a data file, functions alone do not affect the x range (or the y range if plotting
z = f(x,y)).
Please see set xrange (p. 160) for additional information about ranges.
The behavior of autoscaling remains consistent in parametric mode, (see set parametric (p. 134)). However, there are more dependent variables and hence more control over x, y, and z axis scales. In parametric
mode, the independent or dummy variable is t for plots and u,v for splots. autoscale in parametric mode,
then, controls all ranges (t, u, v, x, y, and z) and allows x, y, and z to be fully autoscaled.
Autoscaling works the same way for polar mode as it does for parametric mode for plot, with the extension
that in polar mode set dummy can be used to change the independent variable from t (see set dummy
(p. 111)).
When tics are displayed on second axes but no plot has been specified for those axes, x2range and y2range
are inherited from xrange and yrange. This is done before xrange and yrange are autoextended to a whole
number of tics, which can cause unexpected results. You can use the fixmin or fixmax options to avoid
this.
Examples:
This sets autoscaling of the y axis (other axes are not affected):
set autoscale y
This sets autoscaling only for the minimum of the y axis (the maximum of the y axis and the other axes are
not affected):
set autoscale ymin
This disables extension of the x2 axis tics to the next tic mark, thus keeping the exact range as found in the
plotted data and functions:
set autoscale x2fixmin
set autoscale x2fixmax
This sets autoscaling of the x and y axes:
set autoscale xy
This sets autoscaling of the x, y, z, x2 and y2 axes:
set autoscale
This disables autoscaling of the x, y, z, x2 and y2 axes:
unset autoscale
This disables autoscaling of the z axis only:
unset autoscale z
Parametric mode
When in parametric mode (set parametric), the xrange is as fully scalable as the y range. In other words,
in parametric mode the x axis can be automatically scaled to fit the range of the parametric function that
is being plotted. Of course, the y axis can also be automatically scaled just as in the non-parametric case.
If autoscaling on the x axis is not set, the current x range is used.
Data files are plotted the same in parametric and non-parametric mode. However, there is a difference
in mixed function and data plots: in non-parametric mode with autoscaled x, the x range of the datafile
controls the x range of the functions; in parametric mode it has no influence.
100
gnuplot 4.7
For completeness a last command set autoscale t is accepted. However, the effect of this "scaling" is
very minor. When gnuplot determines that the t range would be empty, it makes a small adjustment if
autoscaling is true. Otherwise, gnuplot gives an error. Such behavior may, in fact, not be very useful and
the command set autoscale t is certainly questionable.
splot extends the above ideas as you would expect. If autoscaling is set, then x, y, and z ranges are computed
and each axis scaled to fit the resulting data.
Polar mode
When in polar mode (set polar), the xrange and the yrange may be left in autoscale mode. If set rrange
is used to limit the extent of the polar axis, then xrange and yrange will adjust to match this automatically.
However, explicit xrange and yrange commands can later be used to make further adjustments. See set
rrange (p. 145). The trange may also be autoscaled. Note that if the trange is contained within one
quadrant, autoscaling will produce a polar plot of only that single quadrant.
Explicitly setting one or two ranges but not others may lead to unexpected results. See also
polar demos.
Bars
The set bars command controls the tics at the ends of error bars, and also at the end of the whiskers
belonging to a boxplot.
Syntax:
set bars {small | large | fullwidth | <size>} {front | back}
unset bars
show bars
small is a synonym for 0.0, and large for 1.0. The default is 1.0 if no size is given.
The keyword fullwidth is relevant only to boxplots and to histograms with errorbars. It sets the width of
the errorbar ends to be the same as the width of the associated box. It does not change the width of the
box itself.
The front and back keywords are relevant only to errorbars attached to filled rectangles (boxes, candlesticks,
histograms).
Bind
Show the current state of all hotkey bindings. See bind (p. 36).
Bmargin
The command set bmargin sets the size of the bottom margin. Please see set margin (p. 126) for details.
Border
The set border and unset border commands control the display of the graph borders for the plot and
splot commands. Note that the borders do not necessarily coincide with the axes; with plot they often do,
but with splot they usually do not.
Syntax:
set border {<integer>} {front | back} {linewidth | lw <line_width>}
{{linestyle | ls <line_style>} | {linetype | lt <line_type>}}
unset border
show border
gnuplot 4.7
101
With a splot displayed in an arbitrary orientation, like set view 56,103, the four corners of the x-y plane
can be referred to as "front", "back", "left" and "right". A similar set of four corners exist for the top surface,
of course. Thus the border connecting, say, the back and right corners of the x-y plane is the "bottom right
back" border, and the border connecting the top and bottom front corners is the "front vertical". (This
nomenclature is defined solely to allow the reader to figure out the table that follows.)
The borders are encoded in a 12-bit integer: the bottom four bits control the border for plot and the sides
of the base for splot; the next four bits control the verticals in splot; the top four bits control the edges
on top of the splot. In detail, <integer> should be the sum of the appropriate entries from the following
table:
Graph Border Encoding
Bit
plot
splot
1
bottom
bottom left front
2
left
bottom left back
4
top
bottom right front
8
right
bottom right back
16
no effect
left vertical
32
no effect
back vertical
64
no effect
right vertical
128 no effect
front vertical
256 no effect
top left back
512 no effect
top right back
1024 no effect
top left front
2048 no effect
top right front
Various bits or combinations of bits may be added together in the command.
The default is 31, which is all four sides for plot, and base and z axis for splot.
In 2D plots the border is normally drawn on top of all plots elements (front). If you want the border to be
drawn behind the plot elements, use set border back.
Using the optional <line style>, <line type> and <line width> specifiers, the way the border lines are
drawn can be influenced (limited by what the current terminal driver supports).
For plot, tics may be drawn on edges other than bottom and left by enabling the second axes – see set
xtics (p. 162) for details.
If a splot draws only on the base, as is the case with "unset surface; set contour base", then the verticals
and the top are not drawn even if they are specified.
The set grid options ’back’, ’front’ and ’layerdefault’ also control the order in which the border lines are
drawn with respect to the output of the plotted data.
Examples:
Draw default borders:
set border
Draw only the left and bottom (plot) or both front and back bottom left (splot) borders:
set border 3
Draw a complete box around a splot:
set border 4095
Draw a topless box around a splot, omitting the front vertical:
set border 127+256+512 # or set border 1023-128
Draw only the top and right borders for a plot and label them as axes:
unset xtics; unset ytics; set x2tics; set y2tics; set border 12
102
gnuplot 4.7
Boxwidth
The set boxwidth command is used to set the default width of boxes in the boxes, boxerrorbars,
boxplot, candlesticks and histograms styles.
Syntax:
set boxwidth {<width>} {absolute|relative}
show boxwidth
By default, adjacent boxes are extended in width until they touch each other. A different default width may
be specified using the set boxwidth command. Relative widths are interpreted as being a fraction of this
default width.
An explicit value for the boxwidth is interpreted as being a number of units along the current x axis
(absolute) unless the modifier relative is given. If the x axis is a log-scale (see set log (p. 125)) then the
value of boxwidth is truly "absolute" only at x=1; this physical width is maintained everywhere along the
axis (i.e. the boxes do not become narrower the value of x increases). If the range spanned by a log scale x
axis is far from x=1, some experimentation may be required to find a useful value of boxwidth.
The default is superseded by explicit width information taken from an extra data column in styles boxes
or boxerrorbars. In a four-column data set, the fourth column will be interpreted as the box width unless
the width is set to -2.0, in which case the width will be calculated automatically. See style boxes (p. 44)
and style boxerrorbars (p. 43) for more details.
To set the box width to automatic use the command
set boxwidth
or, for four-column data,
set boxwidth -2
The same effect can be achieved with the using keyword in plot:
plot ’file’ using 1:2:3:4:(-2)
To set the box width to half of the automatic size use
set boxwidth 0.5 relative
To set the box width to an absolute value of 2 use
set boxwidth 2 absolute
Clabel
gnuplot will vary the linetype used for each contour level when clabel is set. When this option on (the
default), a legend labels each linestyle with the z level it represents. It is not possible at present to separate
the contour labels from the surface key.
Syntax:
set clabel {’<format>’}
unset clabel
show clabel
The default for the format string is %8.3g, which gives three decimal places. This may produce poor label
alignment if the key is altered from its default configuration.
The first contour linetype, or only contour linetype when clabel is off, is the surface linetype +1; contour
points are the same style as surface points.
See also set contour (p. 105).
gnuplot 4.7
103
Clip
gnuplot can clip data points and lines that are near the boundaries of a graph.
Syntax:
set clip <clip-type>
unset clip <clip-type>
show clip
Three clip types for points and lines are supported by gnuplot: points, one, and two. One, two, or all
three clip types may be active for a single graph. Note that clipping of color filled quadrangles drawn by
pm3d maps and surfaces is not controlled by this command, but by set pm3d clip1in and set pm3d
clip4in.
The points clip type forces gnuplot to clip (actually, not plot at all) data points that fall within but too
close to the boundaries. This is done so that large symbols used for points will not extend outside the
boundary lines. Without clipping points near the boundaries, the plot may look bad. Adjusting the x and
y ranges may give similar results.
Setting the one clip type causes gnuplot to draw a line segment which has only one of its two endpoints
within the graph. Only the in-range portion of the line is drawn. The alternative is to not draw any portion
of the line segment.
Some lines may have both endpoints out of range, but pass through the graph. Setting the two clip-type
allows the visible portion of these lines to be drawn.
In no case is a line drawn outside the graph.
The defaults are noclip points, clip one, and noclip two.
To check the state of all forms of clipping, use
show clip
For backward compatibility with older versions, the following forms are also permitted:
set clip
unset clip
set clip is synonymous with set clip points; unset clip turns off all three types of clipping.
Cntrparam
set cntrparam controls the generation of contours and their smoothness for a contour plot. show contour
displays current settings of cntrparam as well as contour.
Syntax:
set cntrparam { {
|
|
|
|
|
linear
cubicspline
bspline
points <n>
order <n>
levels { auto {<n>} | <n>
| discrete <z1> {,<z2>{,<z3>...}}
| incremental <start>, <incr> {,<end>}
}
}
}
show contour
This command has two functions. First, it sets the values of z for which contour points are to be determined
(by linear interpolation between data points or function isosamples.) Second, it controls the way contours
are drawn between the points determined to be of equal z. <n> should be an integral constant expression
and <z1>, <z2> ... any constant expressions. The parameters are:
104
gnuplot 4.7
linear, cubicspline, bspline — Controls type of approximation or interpolation. If linear, then straight
line segments connect points of equal z magnitude. If cubicspline, then piecewise-linear contours are
interpolated between the same equal z points to form somewhat smoother contours, but which may undulate.
If bspline, a guaranteed-smoother curve is drawn, which only approximates the position of the points of
equal-z.
points — Eventually all drawings are done with piecewise-linear strokes. This number controls the number
of line segments used to approximate the bspline or cubicspline curve. Number of cubicspline or bspline
segments (strokes) = points * number of linear segments.
order — Order of the bspline approximation to be used. The bigger this order is, the smoother the resulting
contour. (Of course, higher order bspline curves will move further away from the original piecewise linear
data.) This option is relevant for bspline mode only. Allowed values are integers in the range from 2 (linear)
to 10.
levels — Selection of contour levels, controlled by auto (default), discrete, incremental, and <n>, number
of contour levels.
For auto, <n> specifies a nominal number of levels; the actual number will be adjusted to give simple labels.
If the surface is bounded by zmin and zmax, contours will be generated at integer multiples of dz between
zmin and zmax, where dz is 1, 2, or 5 times some power of ten (like the step between two tic marks).
For levels discrete, contours will be generated at z = <z1>, <z2> ... as specified; the number of discrete
levels sets the number of contour levels. In discrete mode, any set cntrparam levels <n> are ignored.
For incremental, contours are generated at values of z beginning at <start> and increasing by <increment>,
until the number of contours is reached. <end> is used to determine the number of contour levels, which
will be changed by any subsequent set cntrparam levels <n>. If the z axis is logarithmic, <increment>
will be interpreted as a factor, just like in set ztics.
If the command set cntrparam is given without any arguments specified, the defaults are used: linear, 5
points, order 4, 5 auto levels.
Examples:
set cntrparam bspline
set cntrparam points 7
set cntrparam order 10
To select levels automatically, 5 if the level increment criteria are met:
set cntrparam levels auto 5
To specify discrete levels at .1, .37, and .9:
set cntrparam levels discrete .1,1/exp(1),.9
To specify levels from 0 to 4 with increment 1:
set cntrparam levels incremental
0,1,4
To set the number of levels to 10 (changing an incremental end or possibly the number of auto levels):
set cntrparam levels 10
To set the start and increment while retaining the number of levels:
set cntrparam levels incremental 100,50
See also set contour (p. 105) for control of where the contours are drawn, and set clabel (p. 102) for
control of the format of the contour labels and linetypes.
See also
contours demo (contours.dem)
and
contours with user defined levels demo (discrete.dem).
gnuplot 4.7
105
Color box
The color scheme, i.e. the gradient of the smooth color with min z and max z values of pm3d’s palette, is
drawn in a color box unless unset colorbox.
set colorbox
set colorbox {
{ vertical | horizontal }
{ default | user }
{ origin x, y }
{ size x, y }
{ front | back }
{ noborder | bdefault | border [line style] }
}
show colorbox
unset colorbox
Color box position can be default or user. If the latter is specified the values as given with the origin and
size subcommands are used. The box can be drawn after (front) or before (back) the graph or the surface.
The orientation of the color gradient can be switched by options vertical and horizontal.
origin x, y and size x, y are used only in combination with the user option. The x and y values are
interpreted as screen coordinates by default, and this is the only legal option for 3D plots. 2D plots,
including splot with set view map, allow any coordinate system to be specified. Try for example:
set colorbox horiz user origin .1,.02 size .8,.04
which will draw a horizontal gradient somewhere at the bottom of the graph.
border turns the border on (this is the default). noborder turns the border off. If an positive integer
argument is given after border, it is used as a line style tag which is used for drawing the border, e.g.:
set style line 2604 linetype -1 linewidth .4
set colorbox border 2604
will use line style 2604, a thin line with the default border color (-1) for drawing the border. bdefault
(which is the default) will use the default border line style for drawing the border of the color box.
The axis of the color box is called cb and it is controlled by means of the usual axes commands, i.e.
set/unset/show with cbrange, [m]cbtics, format cb, grid [m]cb, cblabel, and perhaps even cbdata,
[no]cbdtics, [no]cbmtics.
set colorbox without any parameter switches the position to default. unset colorbox resets the default
parameters for the colorbox and switches the colorbox off.
See also help for set pm3d (p. 135), set palette (p. 138), x11 pm3d (p. 232), and set style line
(p. 150).
Colornames
Gnuplot knows a limited number of color names. You can use these to define the color range spanned by a
pm3d palette, or to assign a terminal-independent color to a particular linetype or linestyle. To see the list
of known color names, use the command show colornames (p. 105). Example:
set style line 1 linecolor rgb "sea-green"
Contour
set contour enables contour drawing for surfaces. This option is available for splot only. It requires grid
data, see grid data (p. 172) for more details. If contours are desired from non-grid data, set dgrid3d can
be used to create an appropriate grid.
Syntax:
106
gnuplot 4.7
set contour {base | surface | both}
unset contour
show contour
The three options specify where to draw the contours: base draws the contours on the grid base where the
x/ytics are placed, surface draws the contours on the surfaces themselves, and both draws the contours on
both the base and the surface. If no option is provided, the default is base.
See also set cntrparam (p. 103) for the parameters that affect the drawing of contours, and set clabel
(p. 102) for control of labelling of the contours.
The surface can be switched off (see set surface (p. 152)), giving a contour-only graph. Though it is
possible to use set size to enlarge the plot to fill the screen, more control over the output format can be
obtained by writing the contour information to a file, and rereading it as a 2D datafile plot:
unset surface
set contour
set cntrparam ...
set table ’filename’
splot ...
unset table
# contour info now in filename
set term <whatever>
plot ’filename’
In order to draw contours, the data should be organized as "grid data". In such a file all the points for a
single y-isoline are listed, then all the points for the next y-isoline, and so on. A single blank line (a line
containing no characters other than blank spaces and a carriage return and/or a line feed) separates one
y-isoline from the next. See also splot datafile (p. 169).
See also
contours demo (contours.dem)
and
contours with user defined levels demo (discrete.dem).
Data style
This form of the command is deprecated. Please see set style data (p. 148).
Datafile
The set datafile command options control interpretation of fields read from input data files by the plot,
splot, and fit commands. Six such options are currently implemented.
Set datafile fortran
The set datafile fortran command enables a special check for values in the input file expressed as Fortran
D or Q constants. This extra check slows down the input process, and should only be selected if you do
in fact have datafiles containing Fortran D or Q constants. The option can be disabled again using unset
datafile fortran.
Set datafile nofpe trap
The set datafile nofpe trap command tells gnuplot not to re-initialize a floating point exception handler
before every expression evaluation used while reading data from an input file. This can significantly speed
data input from very large files at the risk of program termination if a floating-point exception is generated.
gnuplot 4.7
107
Set datafile missing
The set datafile missing command allows you to tell gnuplot what character string is used in a data file
to denote missing data. Exactly how this missing value will be treated depends on the using specifier of the
plot or splot command.
Syntax:
set datafile missing {"<string>"}
show datafile missing
unset datafile
Example:
# Ignore entries containing IEEE NaN ("Not a Number") code
set datafile missing "NaN"
Example:
set style data linespoints
plot ’-’
1 10
2 20
3 ?
4 40
5 50
e
set datafile missing "?"
plot ’-’
1 10
2 20
3 ?
4 40
5 50
e
plot ’-’ using 1:2
1 10
2 20
3 ?
4 40
5 50
e
plot ’-’ using 1:($2)
1 10
2 20
3 ?
4 40
5 50
e
The first plot will recognize only the first datum in the "3 ?" line. It will use the single-datum-on-a-line
convention that the line number is "x" and the datum is "y", so the point will be plotted (in this case
erroneously) at (2,3).
The second and third plot commands will correctly ignore the middle line. The plotted line will connect
the points at (2,20) and (4,40).
The fourth plot will also correctly ignore the middle line, but the plotted line will not connect the points at
(2,20) and (4,40).
There is no default character for missing, but in many cases any non-parsible string of characters found
where a numerical value is expected will be treated as missing data.
108
gnuplot 4.7
Set datafile separator
The command set datafile separator "<char>" tells gnuplot that data fields in subsequent input files are
separated by <char> rather than by whitespace. The most common use is to read in csv (comma-separated
value) files written by spreadsheet or database programs. By default data fields are separated by whitespace.
Syntax:
set datafile separator {"<char>" | whitespace}
Examples:
# Input file contains tab-separated fields
set datafile separator "\t"
# Input file contains comma-separated values fields
set datafile separator ","
Set datafile commentschars
The set datafile commentschars command allows you to tell gnuplot what characters are used in a data
file to denote comments. Gnuplot will ignore rest of the line behind the specified characters if either of them
is the first non-blank character on the line.
Syntax:
set datafile commentschars {"<string>"}
show datafile commentschars
unset commentschars
Default value of the string is "#!" on VMS and "#" otherwise.
Then, the following line in a data file is completely ignored
# 1 2 3 4
but the following
1 # 3 4
produces rather unexpected plot unless
set datafile missing ’#’
is specified as well.
Example:
set datafile commentschars "#!%"
Set datafile binary
The set datafile binary command is used to set the defaults when reading binary data files. The syntax
matches precisely that used for commands plot and splot. See binary matrix (p. 170) and binary
general (p. 74) for details about the keywords that can be present in <binary list>.
Syntax:
set datafile binary <binary list>
show datafile binary
show datafile
unset datafile
Examples:
set datafile binary filetype=auto
set datafile binary array=(512,512) format="%uchar"
show datafile binary
# list current settings
gnuplot 4.7
109
Decimalsign
The set decimalsign command selects a decimal sign for numbers printed into tic labels or set label
strings.
Syntax:
set decimalsign {<value> | locale {"<locale>"}}
unset decimalsign
show decimalsign
The argument <value> is a string to be used in place of the usual decimal point. Typical choices include
the period, ’.’, and the comma, ’,’, but others may be useful, too. If you omit the <value> argument, the
decimal separator is not modified from the usual default, which is a period. Unsetting decimalsign has the
same effect as omitting <value>.
Example:
Correct typesetting in most European countries requires:
set decimalsign ’,’
Please note: If you set an explicit string, this affects only numbers that are printed using gnuplot’s gprintf()
formatting routine, include axis tics. It does not affect the format expected for input data, and it does not
affect numbers printed with the sprintf() formatting routine. To change the behavior of both input and
output formatting, instead use the form
set decimalsign locale
This instructs the program to use both input and output formats in accordance with the current setting of
the LC ALL, LC NUMERIC, or LANG environmental variables.
set decimalsign locale "foo"
This instructs the program to format all input and output in accordance with locale "foo", which must
be installed. If locale "foo" is not found then an error message is printed and the decimal sign setting is
unchanged. On linux systems you can get a list of the locales installed on your machine by typing "locale
-a". A typical linux locale string is of the form "sl SI.UTF-8". A typical Windows locale string is of the
form "Slovenian Slovenia.1250" or "slovenian". Please note that interpretation of the locale settings is done
by the C library at runtime. Older C libraries may offer only partial support for locale settings such as the
thousands grouping separator character.
set decimalsign locale; set decimalsign "."
This sets all input and output to use whatever decimal sign is correct for the current locale, but over-rides
this with an explicit ’.’ in numbers formatted using gnuplot’s internal gprintf() function.
Dgrid3d
The set dgrid3d command enables, and can set parameters for, non-grid to grid data mapping. See splot
grid data (p. 172) for more details about the grid data structure.
Syntax:
set dgrid3d {<rows>} {,{<cols>}}
{ splines |
qnorm {<norm>} |
(gauss | cauchy | exp | box | hann)
{kdensity} {<dx>} {,<dy>} }
unset dgrid3d
show dgrid3d
By default dgrid3d is disabled. When enabled, 3D data read from a file are always treated as a scattered
data set. A grid with dimensions derived from a bounding box of the scattered data and size as specified by
110
gnuplot 4.7
the row/col size parameters is created for plotting and contouring. The grid is equally spaced in x (rows)
and in y (columns); the z values are computed as weighted averages or spline interpolations of the scattered
points’ z values. In other words, a regularly spaced grid is created and the a smooth approximation to the
raw data is evaluated for all grid points. This approximation is plotted in place of the raw data.
The number of columns defaults to the number of rows, which defaults to 10.
Several algorithms are available to calculate the approximation from the raw data. Some of these algorithms
can take additional parameters. These interpolations are such the closer the data point is to a grid point,
the more effect it has on that grid point.
The splines algorithm calculates an interpolation based on "thin plate splines". It does not take additional
parameters.
The qnorm algorithm calculates a weighted average of the input data at each grid point. Each data point
is weighted inversely by its distance from the grid point raised to the norm power. (Actually, the weights
are given by the inverse of dx^norm + dy^norm, where dx and dy are the components of the separation of
the grid point from each data point. For some norms that are powers of two, specifically 4, 8, and 16, the
computation is optimized by using the Euclidean distance in the weight calculation, (dx^2+dy^2)^norm/2.
However, any non-negative integer can be used.) The power of the norm can be specified as a single optional
parameter. This algorithm is the default.
Finally, several smoothing kernels are available to calculate weighted averages: z = Sum i w(d i) * z i /
Sum i w(d i), where z i is the value of the i-th data point and d i is the distance between the current grid
point and the location of the i-th data point. All kernels assign higher weights to data points that are close
to the current grid point and lower weights to data points further away.
The following kernels are available:
gauss :
w(d) = exp(-d*d)
cauchy :
w(d) = 1/(1 + d*d)
exp :
w(d) = exp(-d)
box :
w(d) = 1
= 0
hann :
w(d) = 0.5*(1-cos(2*pi*d))
w(d) = 0
if d<1
otherwise
if d<1
otherwise
When using one of these five smoothing kernels, up to two additional numerical parameters can be specified:
dx and dy. These are used to rescale the coordinate differences when calculating the distance: d i = sqrt(
((x-x i)/dx)**2 + ((y-y i)/dy)**2 ), where x,y are the coordinates of the current grid point and x i,y i are
the coordinates of the i-th data point. The value of dy defaults to the value of dx, which defaults to 1. The
parameters dx and dy make it possible to control the radius over which data points contribute to a grid
point IN THE UNITS OF THE DATA ITSELF.
The optional keyword kdensity2d, which must come after the name of the kernel, but before the (optional)
scale parameters, modifies the algorithm so that the values calculated for the grid points are not divided by
the sum of the weights ( z = Sum i w(d i) * z i ). If all z i are constant, this effectively plots a bivariate
kernel density estimate: a kernel function (one of the five defined above) is placed at each data point, the
sum of these kernels is evaluated at every grid point, and this smooth surface is plotted instead of the
original data. This is similar in principle to + what the smooth kdensity option does to 1D datasets. (See
kdensity2d.dem for usage demo)
A slightly different syntax is also supported for reasons of backwards compatibility. If no interpolation
algorithm has been explicitly selected, the qnorm algorithm is assumed. Up to three comma-separated,
optional parameters can be specified, which are interpreted as the the number of rows, the number of
columns, and the norm value, respectively.
The dgrid3d option is a simple scheme which replaces scattered data with weighted averages on a regular
grid. More sophisticated approaches to this problem exist and should be used to preprocess the data outside
gnuplot if this simple solution is found inadequate.
See also
dgrid3d.dem:
and
dgrid3d demo.
gnuplot 4.7
scatter.dem:
111
dgrid3d demo.
Dummy
The set dummy command changes the default dummy variable names.
Syntax:
set dummy {<dummy-var>} {,<dummy-var>}
show dummy
By default, gnuplot assumes that the independent, or "dummy", variable for the plot command is "t" if
in parametric or polar mode, or "x" otherwise. Similarly the independent variables for the splot command
are "u" and "v" in parametric mode (splot cannot be used in polar mode), or "x" and "y" otherwise.
It may be more convenient to call a dummy variable by a more physically meaningful or conventional name.
For example, when plotting time functions:
set dummy t
plot sin(t), cos(t)
At least one dummy variable must be set on the command; set dummy by itself will generate an error
message.
Examples:
set dummy u,v
set dummy ,s
The second example sets the second variable to s.
Encoding
The set encoding command selects a character encoding. Syntax:
set encoding {<value>}
set encoding locale
show encoding
Valid values are
default
- tells a terminal to use its default encoding
iso_8859_1 - the most common Western European encoding used by many
Unix workstations and by MS-Windows. This encoding is
known in the PostScript world as ’ISO-Latin1’.
iso_8859_15 - a variant of iso_8859_1 that includes the Euro symbol
iso_8859_2 - used in Central and Eastern Europe
iso_8859_9 - used in Turkey (also known as Latin5)
koi8r
- popular Unix cyrillic encoding
koi8u
- ukrainian Unix cyrillic encoding
cp437
- codepage for MS-DOS
cp850
- codepage for OS/2, Western Europe
cp852
- codepage for OS/2, Central and Eastern Europe
cp950
- MS version of Big5 (emf terminal only)
cp1250
- codepage for MS Windows, Central and Eastern Europe
cp1251
- codepage for 8-bit Russian, Serbian, Bulgarian, Macedonian
cp1254
- codepage for MS Windows, Turkish (superset of Latin5)
sjis
- shift-JIS Japanese encoding
utf8
- variable-length (multibyte) representation of Unicode
entry point for each character
The command set encoding locale is different from the other options. It attempts to determine the current
locale from the runtime environment. On most systems this is controlled by the environmental variables
112
gnuplot 4.7
LC ALL, LC CTYPE, or LANG. This mechanism is necessary, for example, to pass multibyte character
encodings such as UTF-8 or EUC JP to the wxt and cairopdf terminals. This command does not affect
the locale-specific representation of dates or numbers. See also set locale (p. 125) and set decimalsign
(p. 109).
Generally you must set the encoding before setting the terminal type. Note that encoding is not supported
by all terminal drivers and that the device must be able to produce the desired non-standard characters.
Fit
The fit setting defines where the fit command writes its output.
Syntax:
set fit {logfile {"<filename>"}} {{no}errorvariables} {{no}quiet}
unset fit
show fit
The <filename> argument must be enclosed in single or double quotes.
If no filename is given or unset fit is used the log file is reset to its default value "fit.log" or the value of
the environmental variable FIT LOG.
If the given logfile name ends with a / or \, it is interpreted to be a directory name, and the actual filename
will be "fit.log" in that directory.
If the errorvariables option is turned on, the error of each fitted parameter computed by fit will be copied
to a user-defined variable whose name is formed by appending " err" to the name of the parameter itself.
This is useful mainly to put the parameter and its error onto a plot of the data and the fitted function, for
reference, as in:
set fit errorvariables
fit f(x) ’datafile’ using 1:2 via a, b
print "error of a is:", a_err
set label ’a=%6.2f’, a, ’+/- %6.2f’, a_err
plot ’datafile’ using 1:2, f(x)
By default the information written to the log file is also echoed to the terminal session. set fit quiet turns
off the echo.
Fontpath
The fontpath setting defines additional locations for font files searched when including font files. Currently
only the postscript terminal supports fontpath. If a file cannot be found in the current directory, the
directories in fontpath are tried. Further documentation concerning the supported file formats is included
in the terminal postscript section of the documentation.
Syntax:
set fontpath {"pathlist1" {"pathlist2"...}}
show fontpath
Path names may be entered as single directory names, or as a list of path names separated by a platformspecific path separator, eg. colon (’:’) on Unix, semicolon (’;’) on DOS/Windows/OS/2 platforms. The show
fontpath, save and save set commands replace the platform-specific separator with a space character (’ ’)
for maximum portability. If a directory name ends with an exclamation mark (’ !’) also the subdirectories
of this directory are searched for font files.
If the environmental variable GNUPLOT FONTPATH is set, its contents are appended to fontpath. If it
is not set, a system dependent default value is used. It is set by testing several directories for existence when
using the fontpath the first time. Thus, the first call of set fontpath, show fontpath, save fontpath,
plot, or splot with embedded font files takes a little more time. If you want to save this time you may set
the environmental variable GNUPLOT FONTPATH since probing is switched off, then. You can find out
which is the default fontpath by using show fontpath.
gnuplot 4.7
113
show fontpath prints the contents of the user-defined fontpath and the system fontpath separately. However, the save and save set commands save only the user-specified parts of fontpath.
For terminal drivers that access fonts by filename via the gd library, the font search path is controlled by
the environmental variable GDFONTPATH.
Format
The format of the tic-mark labels can be set with the set format command or with the set tics format
or individual set {axis}tics format commands.
Syntax:
set format {<axes>} {"<format-string>"}
set format {<axes>} {’<format-string>’}
show format
where <axes> is either x, y, xy, x2, y2, z, cb or nothing (which applies the format to all axes). The
following two commands are equivalent:
set format y "%.2f"
set ytics format "%.2f"
The length of the string is restricted to 100 characters. The default format is "% g", but other formats such
as "%.2f" or "%3.0em" are often desirable. The format "$%g$" is often desirable for LaTeX. If no format
string is given, the format will be returned to the default. If the empty string "" is given, tics will have no
labels, although the tic mark will still be plotted. To eliminate the tic marks, use unset xtics or set tics
scale 0.
Newline (\n) and enhanced text markup is accepted in the format string. Use double-quotes rather than
single-quotes in this case. See also syntax (p. 41). Characters not preceded by "%" are printed verbatim.
Thus you can include spaces and labels in your format string, such as "%g m", which will put " m" after
each number. If you want "%" itself, double it: "%g %%".
See also set xtics (p. 162) for more information about tic labels, and set decimalsign (p. 109) for how
to use non-default decimal separators in numbers printed this way. See also
electron demo (electron.dem).
Gprintf
The string function gprintf("format",x) uses gnuplot’s own format specifiers, as do the gnuplot commands
set format, set timestamp, and others. These format specifiers are not the same as those used by the
standard C-language routine sprintf(). gprintf() accepts only a single variable to be formatted. Gnuplot
also provides an sprintf("format",x1,x2,...) routine if you prefer. For a list of gnuplot’s format options, see
format specifiers (p. 113).
Format specifiers
The acceptable formats (if not in time/date mode) are:
114
gnuplot 4.7
Format
%f
%e or %E
%g or %G
%x or %X
%o or %O
%t
%l
%s
%T
%L
%S
%c
%b
%B
%P
Tic-mark label numerical format specifiers
Explanation
floating point notation
exponential notation; an ”e” or ”E” before the power
the shorter of %e (or %E) and %f
hex
octal
mantissa to base 10
mantissa to base of current logscale
mantissa to base of current logscale; scientific power
power to base 10
power to base of current logscale
scientific power
character replacement for scientific power
mantissa of ISO/IEC 80000 notation (ki, Mi, Gi, Ti, Pi, Ei, Zi, Yi)
prefix of ISO/IEC 80000 notation (ki, Mi, Gi, Ti, Pi, Ei, Zi, Yi)
multiple of pi
A ’scientific’ power is one such that the exponent is a multiple of three. Character replacement of scientific
powers ("%c") has been implemented for powers in the range -18 to +18. For numbers outside of this range
the format reverts to exponential.
Other acceptable modifiers (which come after the "%" but before the format specifier) are "-", which leftjustifies the number; "+", which forces all numbers to be explicitly signed; " " (a space), which makes
positive numbers have a space in front of them where negative numbers have "-"; "#", which places a
decimal point after floats that have only zeroes following the decimal point; a positive integer, which defines
the field width; "0" (the digit, not the letter) immediately preceding the field width, which indicates that
leading zeroes are to be used instead of leading blanks; and a decimal point followed by a non-negative
integer, which defines the precision (the minimum number of digits of an integer, or the number of digits
following the decimal point of a float).
Some systems may not support all of these modifiers but may also support others; in case of doubt, check
the appropriate documentation and then experiment.
Examples:
set
set
set
set
set
set
set
set
format
format
format
format
format
format
format
format
y
y
y
y
y
y
y
y
"%t"; set ytics (5,10)
#
"%s"; set ytics (500,1000)
#
"%+-12.3f"; set ytics(12345)
#
"%.2t*10^%+03T"; set ytic(12345)#
"%s*10^{%S}"; set ytic(12345)
#
"%s %cg"; set ytic(12345)
#
"%.0P pi"; set ytic(6.283185)
#
"%.0f%%"; set ytic(50)
#
"5.0" and "1.0"
"500" and "1.0"
"+12345.000 "
"1.23*10^+04"
"12.345*10^{3}"
"12.345 kg"
"2 pi"
"50%"
set log y 2; set format y ’%l’; set ytics (1,2,3)
#displays "1.0", "1.0" and "1.5" (since 3 is 1.5 * 2^1)
There are some problem cases that arise when numbers like 9.999 are printed with a format that requires
both rounding and a power.
If the data type for the axis is time/date, the format string must contain valid codes for the ’strftime’
function (outside of gnuplot, type "man strftime"). See set timefmt (p. 155) for a list of the allowed
input format codes.
Time/date specifiers
In time/date mode, the acceptable formats are:
gnuplot 4.7
115
Tic-mark label Date/Time Format Specifiers
Format Explanation
%a
abbreviated name of day of the week
%A
full name of day of the week
%b or %h abbreviated name of the month
%B
full name of the month
%d
day of the month, 01–31
%D
shorthand for "%m/%d/%y" (only output)
%F
shorthand for "%Y-%m-%d" (only output)
%k
hour, 0–23 (one or two digits)
%H
hour, 00–23 (always two digits)
%l
hour, 1–12 (one or two digits)
%I
hour, 01–12 (always two digits)
%j
day of the year, 1–366
%m
month, 01–12
%M
minute, 0–60
%p
”am” or ”pm”
%r
shorthand for "%I:%M:%S %p" (only output)
%R
shorthand for %H:%M" (only output)
%S
second, integer 0–60 on output, (double) on input
%s
number of seconds since start of year 2000
%T
shorthand for "%H:%M:%S" (only output)
%U
week of the year (week starts on Sunday)
%w
day of the week, 0–6 (Sunday = 0)
%W
week of the year (week starts on Monday)
%y
year, 0-99 in range 1969-2068
%Y
year, 4-digit
Except for the non-numerical formats, these may be preceded by a "0" ("zero", not "oh") to pad the field
length with leading zeroes, and a positive digit, to define the minimum field width (which will be overridden
if the specified width is not large enough to contain the number). The %S format also accepts a precision
specifier so that fractional seconds can be written. There is a 24-character limit to the length of the printed
text; longer strings will be truncated.
Examples:
Suppose the text is "76/12/25 23:11:11". Then
set format x
# defaults to "12/25/76" \n "23:11"
set format x "%A, %d %b %Y" # "Saturday, 25 Dec 1976"
set format x "%r %D"
# "11:11:11 pm 12/25/76"
Suppose the text is "98/07/06 05:04:03.123456". Then
set format x "%1y/%2m/%3d %01H:%02M:%06.3S"
# "98/ 7/
6 5:04:03.123"
Function style
This form of the command is deprecated. Please see set style function (p. 149).
Functions
The show functions command lists all user-defined functions and their definitions.
Syntax:
show functions
For information about the definition and usage of functions in gnuplot, please see expressions (p. 25).
See also
116
gnuplot 4.7
splines as user defined functions (spline.dem)
and
use of functions and complex variables for airfoils (airfoil.dem).
Grid
The set grid command allows grid lines to be drawn on the plot.
Syntax:
set grid {{no}{m}xtics} {{no}{m}ytics} {{no}{m}ztics}
{{no}{m}x2tics} {{no}{m}y2tics}
{{no}{m}cbtics}
{polar {<angle>}}
{layerdefault | front | back}
{ {linestyle <major_linestyle>}
| {linetype | lt <major_linetype>}
{linewidth | lw <major_linewidth>}
{ , {linestyle | ls <minor_linestyle>}
| {linetype | lt <minor_linetype>}
{linewidth | lw <minor_linewidth>} } }
unset grid
show grid
The grid can be enabled and disabled for the major and/or minor tic marks on any axis, and the linetype
and linewidth can be specified for major and minor grid lines, also via a predefined linestyle, as far as the
active terminal driver supports this.
Additionally, a polar grid can be selected for 2D plots — circles are drawn to intersect the selected tics, and
radial lines are drawn at definable intervals. (The interval is given in degrees or radians, depending on the
set angles setting.) Note that a polar grid is no longer automatically generated in polar mode.
The pertinent tics must be enabled before set grid can draw them; gnuplot will quietly ignore instructions
to draw grid lines at non-existent tics, but they will appear if the tics are subsequently enabled.
If no linetype is specified for the minor gridlines, the same linetype as the major gridlines is used. The
default polar angle is 30 degrees.
If front is given, the grid is drawn on top of the graphed data. If back is given, the grid is drawn underneath
the graphed data. Using front will prevent the grid from being obscured by dense data. The default setup,
layerdefault, is equivalent to back for 2D plots. In 3D plots the default is to split up the grid and the
graph box into two layers: one behind, the other in front of the plotted data and functions. Since hidden3d
mode does its own sorting, it ignores all grid drawing order options and passes the grid lines through the
hidden line removal machinery instead. These options actually affect not only the grid, but also the lines
output by set border and the various ticmarks (see set xtics (p. 162)).
Z grid lines are drawn on the bottom of the plot. This looks better if a partial box is drawn around the plot
— see set border (p. 100).
Hidden3d
The set hidden3d command enables hidden line removal for surface plotting (see splot (p. 169)). Some
optional features of the underlying algorithm can also be controlled using this command.
Syntax:
set hidden3d {defaults} |
{ {front|back}
{{offset <offset>} | {nooffset}}
{trianglepattern <bitpattern>}
{{undefined <level>} | {noundefined}}
{{no}altdiagonal}
gnuplot 4.7
117
{{no}bentover} }
unset hidden3d
show hidden3d
In contrast to the usual display in gnuplot, hidden line removal actually treats the given function or data
grids as real surfaces that can’t be seen through, so plot elements behind the surface will be hidden by it.
For this to work, the surface needs to have ’grid structure’ (see splot datafile (p. 169) about this), and it
has to be drawn with lines or with linespoints.
When hidden3d is set, both the hidden portion of the surface and possibly its contours drawn on the base
(see set contour (p. 105)) as well as the grid will be hidden. Each surface has its hidden parts removed
with respect to itself and to other surfaces, if more than one surface is plotted. Contours drawn on the
surface (set contour surface) don’t work.
Labels and arrows are always visible and are unaffected. The key box is never hidden by the surface. As of
gnuplot version 4.6, hidden3d also affects 3D plotting styles points, labels, vectors, and impulses even if
no surface is present in the graph. Individual plots within the graph may be explicitly excluded from this
processing by appending the extra option nohidden3d to the with specifier.
Hidden3d does not affect solid surfaces drawn using the pm3d mode. To achieve a similar effect purely
for pm3d surfaces, use instead set pm3d depthorder. To mix pm3d surfaces with normal hidden3d
processing, use the option set hidden3d front to force all elements included in hidden3d processing to be
drawn after any remaining plot elements. Then draw the surface twice, once with lines lt -2 and a second
time with pm3d. The first instance will include the surface during calculation of occluded elements but
will not draw the surface itself.
Functions are evaluated at isoline intersections. The algorithm interpolates linearly between function points
or data points when determining the visible line segments. This means that the appearance of a function
may be different when plotted with hidden3d than when plotted with nohidden3d because in the latter
case functions are evaluated at each sample. Please see set samples (p. 145) and set isosamples (p. 118)
for discussion of the difference.
The algorithm used to remove the hidden parts of the surfaces has some additional features controllable by
this command. Specifying defaults will set them all to their default settings, as detailed below. If defaults
is not given, only explicitly specified options will be influenced: all others will keep their previous values, so
you can turn on/off hidden line removal via set {no}hidden3d, without modifying the set of options you
chose.
The first option, offset, influences the linetype used for lines on the ’back’ side. Normally, they are drawn
in a linetype one index number higher than the one used for the front, to make the two sides of the surface
distinguishable. You can specify a different linetype offset to add instead of the default 1, by offset <offset>.
Option nooffset stands for offset 0, making the two sides of the surface use the same linetype.
Next comes the option trianglepattern <bitpattern>. <bitpattern> must be a number between 0 and
7, interpreted as a bit pattern. Each bit determines the visibility of one edge of the triangles each surface
is split up into. Bit 0 is for the ’horizontal’ edges of the grid, Bit 1 for the ’vertical’ ones, and Bit 2 for
the diagonals that split each cell of the original grid into two triangles. The default pattern is 3, making all
horizontal and vertical lines visible, but not the diagonals. You may want to choose 7 to see those diagonals
as well.
The undefined <level> option lets you decide what the algorithm is to do with data points that are
undefined (missing data, or undefined function values), or exceed the given x-, y- or z-ranges. Such points
can either be plotted nevertheless, or taken out of the input data set. All surface elements touching a point
that is taken out will be taken out as well, thus creating a hole in the surface. If <level> = 3, equivalent to
option noundefined, no points will be thrown away at all. This may produce all kinds of problems elsewhere,
so you should avoid this. <level> = 2 will throw away undefined points, but keep the out-of-range ones.
<level> = 1, the default, will get rid of out-of-range points as well.
By specifying noaltdiagonal, you can override the default handling of a special case can occur if undefined
is active (i.e. <level> is not 3). Each cell of the grid-structured input surface will be divided in two triangles
along one of its diagonals. Normally, all these diagonals have the same orientation relative to the grid. If
exactly one of the four cell corners is excluded by the undefined handler, and this is on the usual diagonal,
both triangles will be excluded. However if the default setting of altdiagonal is active, the other diagonal
118
gnuplot 4.7
will be chosen for this cell instead, minimizing the size of the hole in the surface.
The bentover option controls what happens to another special case, this time in conjunction with the
trianglepattern. For rather crumply surfaces, it can happen that the two triangles a surface cell is divided
into are seen from opposite sides (i.e. the original quadrangle is ’bent over’), as illustrated in the following
ASCII art:
original quadrangle:
("set view 0,0")
A--B
| /|
|/ |
C--D
displayed quadrangle:
("set view 75,75" perhaps)
C----B
|\
|
| \ |
| \ |
|
\|
A
D
If the diagonal edges of the surface cells aren’t generally made visible by bit 2 of the <bitpattern> there,
the edge CB above wouldn’t be drawn at all, normally, making the resulting display hard to understand.
Therefore, the default option of bentover will turn it visible in this case. If you don’t want that, you may
choose nobentover instead. See also
hidden line removal demo (hidden.dem)
and
complex hidden line demo (singulr.dem).
Historysize
Note: the command set historysize is only available when gnuplot has been configured to use the GNU
readline library.
Syntax:
set historysize <int>
unset historysize
When leaving gnuplot, the value of historysize is used for truncating the history to at most that much lines.
The default is 500. unset historysize will disable history truncation and thus allow an infinite number of
lines to be written to the history file.
Isosamples
The isoline density (grid) for plotting functions as surfaces may be changed by the set isosamples command.
Syntax:
set isosamples <iso_1> {,<iso_2>}
show isosamples
Each function surface plot will have <iso 1> iso-u lines and <iso 2> iso-v lines. If you only specify <iso 1>,
<iso 2> will be set to the same value as <iso 1>. By default, sampling is set to 10 isolines per u or v axis.
A higher sampling rate will produce more accurate plots, but will take longer. These parameters have no
effect on data file plotting.
An isoline is a curve parameterized by one of the surface parameters while the other surface parameter is
fixed. Isolines provide a simple means to display a surface. By fixing the u parameter of surface s(u,v), the
iso-u lines of the form c(v) = s(u0,v) are produced, and by fixing the v parameter, the iso-v lines of the form
c(u) = s(u,v0) are produced.
When a function surface plot is being done without the removal of hidden lines, set samples controls the
number of points sampled along each isoline; see set samples (p. 145) and set hidden3d (p. 116). The
contour algorithm assumes that a function sample occurs at each isoline intersection, so change in samples
as well as isosamples may be desired when changing the resolution of a function surface/contour.
gnuplot 4.7
119
Key
The set key command enables a key (or legend) describing plots on a plot.
The contents of the key, i.e., the names given to each plotted data set and function and samples of the
lines and/or symbols used to represent them, are determined by the title and with options of the {s}plot
command. Please see plot title (p. 90) and plot with (p. 91) for more information.
Syntax:
set key {on|off} {default}
{{inside | outside} | {lmargin | rmargin | tmargin | bmargin}
| {at <position>}}
{left | right | center} {top | bottom | center}
{vertical | horizontal} {Left | Right}
{{no}opaque}
{{no}reverse} {{no}invert}
{samplen <sample_length>} {spacing <vertical_spacing>}
{width <width_increment>}
{height <height_increment>}
{{no}autotitle {columnheader}}
{title "<text>"} {{no}enhanced}
{font "<face>,<size>"} {textcolor <colorspec>}
{{no}box { {linestyle | ls <line_style>}
| {linetype | lt <line_type>}
{linewidth | lw <line_width>}}}
{maxcols {<max no. of columns> | auto}}
{maxrows {<max no. of rows> | auto}}
unset key
show key
The key contains a title and a sample (line, point, box) for each plot in the graph. The key may be turned
off by requesting set key off or unset key. Individual key entries may be turned off by using the notitle
keyword in the corresponding plot command.
Elements within the key are stacked according to vertical or horizontal. In the case of vertical, the key
occupies as few columns as possible. That is, elements are aligned in a column until running out of vertical
space at which point a new column is started. The vertical space may be limited using ’maxrows’. In the
case of horizontal, the key occupies as few rows as possible. The horizontal space may be limited using
’maxcols’.
By default the key is placed in the upper right inside corner of the graph. The keywords left, right, top,
bottom, center, inside, outside, lmargin, rmargin, tmargin, bmargin (, above, over, below and
under) may be used to automatically place the key in other positions of the graph. Also an at <position>
may be given to indicate precisely where the plot should be placed. In this case, the keywords left, right, top,
bottom and center serve an analogous purpose for alignment. For more information, see key placement
(p. 120).
Justification of the plot titles within the key is controlled by Left or Right (default). The text and sample
can be reversed (reverse) and a box can be drawn around the key (box {...}) in a specified linetype and
linewidth, or a user-defined linestyle.
By default the key is built up one plot at a time. That is, the key symbol and title are drawn at the same
time as the corresponding plot. That means newer plots may sometimes place elements on top of the key.
set key opaque causes the key to be generated after all the plots. In this case the key area is filled with
background color and then the key symbols and titles are written. Therefore the key itself may obscure
portions of some plot elements. The default can be restored by set key noopaque.
By default the first plot label is at the top of the key and successive labels are entered below it. The invert
option causes the first label to be placed at the bottom of the key, with successive labels entered above it.
This option is useful to force the vertical ordering of labels in the key to match the order of box types in a
stacked histogram.
The <height increment> is a number of character heights to be added to or subtracted from the height of
120
gnuplot 4.7
the key box. This is useful mainly when you are putting a box around the key and want larger borders
around the key entries.
All plotted curves of plots and splots are titled according to the default option autotitles. The automatic
generation of titles can be suppressed by noautotitles; then only those titles explicitly defined by (s)plot
... title ... will be drawn.
The command set key autotitle columnheader causes the first entry in each column of input data to be
interpreted as a text string and used as a title for the corresponding plot. If the quantity being plotted is a
function of data from several columns, gnuplot may be confused as to which column to draw the title from.
In this case it is necessary to specify the column explicitly in the plot command, e.g.
plot "datafile" using (($2+$3)/$4) title columnhead(3) with lines
An overall title can be put on the key (title "<text>") — see also syntax (p. 41) for the distinction
between text in single- or double-quotes. The key title uses the same justification as do the plot titles.
The defaults for set key are on, right, top, vertical, Right, noreverse, noinvert, samplen 4, spacing
1.25, title "", and nobox. The default <linetype> is the same as that used for the plot borders. Entering
set key default returns the key to its default configuration.
The key is drawn as a sequence of lines, with one plot described on each line. On the right-hand side (or
the left-hand side, if reverse is selected) of each line is a representation that attempts to mimic the way
the curve is plotted. On the other side of each line is the text description (the line title), obtained from the
plot command. The lines are vertically arranged so that an imaginary straight line divides the left- and
right-hand sides of the key. It is the coordinates of the top of this line that are specified with the set key
command. In a plot, only the x and y coordinates are used to specify the line position. For a splot, x, y
and z are all used as a 3D location mapped using the same mapping as the graph itself to form the required
2D screen position of the imaginary line.
When using the TeX or other terminals where formatting information is embedded in the string, gnuplot
can only estimate the correctly exact width of the string for key positioning. If the key is to be positioned
at the left, it may be convenient to use the combination set key left Left reverse.
If splot is being used to draw contours, the contour labels will be listed in the key. If the alignment of these
labels is poor or a different number of decimal places is desired, the label format can be specified. See set
clabel (p. 102) for details.
Examples:
This places the key at the default location:
set key default
This disables the key:
unset key
This places a key at coordinates 2,3.5,2 in the default (first) coordinate system:
set key at 2,3.5,2
This places the key below the graph:
set key below
This places the key in the bottom left corner, left-justifies the text, gives it a title, and draws a box around
it in linetype 3:
set key left bottom Left title ’Legend’ box 3
Key placement
To understand positioning, the best concept is to think of a region, i.e., inside/outside, or one of the margins.
Along with the region, keywords left/center/right (l/c/r) and top/center/bottom (t/c/b) control where
within the particular region the key should be placed.
When in inside mode, the keywords left (l), right (r), top (t), bottom (b), and center (c) push the key
out toward the plot boundary as illustrated:
gnuplot 4.7
t/l
t/c
t/r
c/l
c
c/r
b/l
b/c
b/r
121
When in outside mode, automatic placement is similar to the above illustration, but with respect to the
view, rather than the graph boundary. That is, a border is moved inward to make room for the key outside of
the plotting area, although this may interfere with other labels and may cause an error on some devices. The
particular plot border that is moved depends upon the position described above and the stacking direction.
For options centered in one of the dimensions, there is no ambiguity about which border to move. For the
corners, when the stack direction is vertical, the left or right border is moved inward appropriately. When
the stack direction is horizontal, the top or bottom border is moved inward appropriately.
The margin syntax allows automatic placement of key regardless of stack direction. When one of the margins
lmargin (lm), rmargin (rm), tmargin (tm), and bmargin (bm) is combined with a single, non-conflicting
direction keyword, the following illustrated positions may contain the key:
l/tm
c/tm
r/tm
t/lm
t/rm
c/lm
c/rm
b/lm
b/rm
l/bm
c/bm
r/bm
Keywords above and over are synonymous with tmargin. For version compatibility, above or over without
an additional l/c/r or stack direction keyword uses center and horizontal. Keywords below and under
are synonymous with bmargin. For compatibility, below or under without an additional l/c/r or stack
direction keyword uses center and horizontal. A further compatibility issue is that outside appearing
without an additional t/b/c or stack direction keyword uses top, right and vertical (i.e., the same as t/rm
above).
The <position> can be a simple x,y,z as in previous versions, but these can be preceded by one of five
keywords (first, second, graph, screen, character) which selects the coordinate system in which the
position of the first sample line is specified. See coordinates (p. 22) for more details. The effect of
left, right, top, bottom, and center when <position> is given is to align the key as though it were text
positioned using the label command, i.e., left means left align with key to the right of <position>, etc.
Key samples
By default, each plot on the graph generates a corresponding entry in the key. This entry contains a plot
title and a sample line/point/box of the same color and fill properties as used in the plot itself. The font
and textcolor properties control the appearance of the individual plot titles that appear in the key. Setting
the textcolor to "variable" causes the text for each key entry to be the same color as the line or fill color for
that plot. This was the default in some earlier versions of gnuplot.
The length of the sample line can be controlled by samplen. The sample length is computed as the sum of
the tic length and <sample length> times the character width. samplen also affects the positions of point
samples in the key since these are drawn at the midpoint of the sample line, even if the sample line itself is
not drawn.
The vertical spacing between lines is controlled by spacing. The spacing is set equal to the product of the
pointsize, the vertical tic size, and <vertical spacing>. The program will guarantee that the vertical spacing
is no smaller than the character height.
The <width increment> is a number of character widths to be added to or subtracted from the length of the
string. This is useful only when you are putting a box around the key and you are using control characters
in the text. gnuplot simply counts the number of characters in the string when computing the box width;
this allows you to correct it.
122
gnuplot 4.7
Label
Arbitrary labels can be placed on the plot using the set label command.
Syntax:
set label {<tag>} {"<label text>"} {at <position>}
{left | center | right}
{norotate | rotate {by <degrees>}}
{font "<name>{,<size>}"}
{noenhanced}
{front | back}
{textcolor <colorspec>}
{point <pointstyle> | nopoint}
{offset <offset>}
unset label {<tag>}
show label
The <position> is specified by either x,y or x,y,z, and may be preceded by first, second, graph, screen,
or character to select the coordinate system. See coordinates (p. 22) for details.
The tag is an integer that is used to identify the label. If no <tag> is given, the lowest unused tag value is
assigned automatically. The tag can be used to delete or modify a specific label. To change any attribute of
an existing label, use the set label command with the appropriate tag, and specify the parts of the label to
be changed.
The <label text> can be a string constant, a string variable, or a string- valued expression. See strings
(p. 39), sprintf (p. 27), and gprintf (p. 113).
By default, the text is placed flush left against the point x,y,z. To adjust the way the label is positioned with
respect to the point x,y,z, add the justification parameter, which may be left, right or center, indicating
that the point is to be at the left, right or center of the text. Labels outside the plotted boundaries are
permitted but may interfere with axis labels or other text.
If rotate is given, the label is written vertically (if the terminal can do so, of course). If rotate by
<degrees> is given, conforming terminals will try to write the text at the specified angle; non-conforming
terminals will treat this as vertical text.
Font and its size can be chosen explicitly by font "<name>{,<size>}" if the terminal supports font
settings. Otherwise the default font of the terminal will be used.
Normally the enhanced text mode string interpretation, if enabled for the current terminal, is applied to all
text strings including label text. The noenhanced property can be used to exempt a specific label from
the enhanced text mode processing. The can be useful if the label contains underscores, for example. See
enhanced text (p. 24).
If front is given, the label is written on top of the graphed data. If back is given (the default), the label is
written underneath the graphed data. Using front will prevent a label from being obscured by dense data.
textcolor <colorspec> changes the color of the label text. <colorspec> can be a linetype, an rgb color, or
a palette mapping. See help for colorspec (p. 34) and palette (p. 138). textcolor may be abbreviated
tc.
‘tc default‘ resets the text color to its default state.
‘tc lt <n>‘ sets the text color to that of line type <n>.
‘tc ls <n>‘ sets the text color to that of line style <n>.
‘tc palette z‘ selects a palette color corresponding to the label z position.
‘tc palette cb <val>‘ selects a color corresponding to <val> on the colorbar.
‘tc palette fraction <val>‘, with 0<=val<=1, selects a color corresponding to
the mapping [0:1] to grays/colors of the ‘palette‘.
‘tc rgb "#RRGGBB"‘ selects an arbitrary 24-bit RGB color.
If a <pointstyle> is given, using keywords lt, pt and ps, see style (p. 91), a point with the given style
and color of the given line type is plotted at the label position and the text of the label is displaced slightly.
This option is used by default for placing labels in mouse enhanced terminals. Use nopoint to turn off the
drawing of a point near the label (this is the default).
gnuplot 4.7
123
The displacement defaults to 1,1 in pointsize units if a <pointstyle> is given, 0,0 if no <pointstyle> is
given. The displacement can be controlled by the optional offset <offset> where <offset> is specified
by either x,y or x,y,z, and may be preceded by first, second, graph, screen, or character to select the
coordinate system. See coordinates (p. 22) for details.
If one (or more) axis is timeseries, the appropriate coordinate should be given as a quoted time string
according to the timefmt format string. See set xdata (p. 158) and set timefmt (p. 155).
The EEPIC, Imagen, LaTeX, and TPIC drivers allow \\ in a string to specify a newline.
Label coordinates and text can also be read from a data file (see labels (p. 55)).
Examples:
To set a label at (1,2) to "y=x", use:
set label "y=x" at 1,2
To set a Sigma of size 24, from the Symbol font set, at the center of the graph, use:
set label "S" at graph 0.5,0.5 center font "Symbol,24"
To set a label "y=x^2" with the right of the text at (2,3,4), and tag the label as number 3, use:
set label 3 "y=x^2" at 2,3,4 right
To change the preceding label to center justification, use:
set label 3 center
To delete label number 2, use:
unset label 2
To delete all labels, use:
unset label
To show all labels (in tag order), use:
show label
To set a label on a graph with a timeseries on the x axis, use, for example:
set timefmt "%d/%m/%y,%H:%M"
set label "Harvest" at "25/8/93",1
To display a freshly fitted parameter on the plot with the data and the fitted function, do this after the fit,
but before the plot:
set label sprintf("a = %3.5g",par_a) at 30,15
bfit = gprintf("b = %s*10^%S",par_b)
set label bfit at 30,20
To display a function definition along with its fitted parameters, use:
f(x)=a+b*x
fit f(x) ’datafile’ via a,b
set label GPFUN_f at graph .05,.95
set label sprintf("a = %g", a) at graph .05,.90
set label sprintf("b = %g", b) at graph .05,.85
To set a label displaced a little bit from a small point:
set label ’origin’ at 0,0 point lt 1 pt 2 ps 3 offset 1,-1
To set a label whose color matches the z value (in this case 5.5) of some point on a 3D splot colored using
pm3d:
set label ’text’ at 0,0,5.5 tc palette z
124
gnuplot 4.7
Linetype
The set linetype command allows you to redefine the basic linetypes used for plots. The command options
are identical to those for "set style line". Unlike line styles, redefinitions by set linetype are persistent;
they are not affected by reset.
For example, linetypes one and two default to red and green. If you redefine them like this:
set linetype 1 lw 2 lc rgb "blue" pointtype 6
set linetype 2 lw 2 lc rgb "forest-green" pointtype 8
everywhere that uses lt 1 will now get a thick blue line rather than a thin red line (the previous default
meaning of lt 1). This includes uses such as the definition of a temporary linestyle derived from the base
linetype 1.
Note: This command is new to gnuplot version 4.6. It supersedes a rather cryptic command in version 4.2
"set style increment user". The older command is now deprecated.
This mechanism can be used to define a set of personal preferences for the sequence of lines used in gnuplot.
The recommended way to do this is to add to the run-time initialization file ˜ /.gnuplot a sequence of
commands like
if ((GPVAL_VERSION < 4.5) \
|| (!strstrt(GPVAL_COMPILE_OPTIONS,"+USER_LINETYPES"))) \
exit
set linetype 1 lc rgb "dark-violet" lw 2 pt 0
set linetype 2 lc rgb "sea-green"
lw 2 pt 7
set linetype 3 lc rgb "cyan"
lw 2 pt 6 pi -1
set linetype 4 lc rgb "dark-red"
lw 2 pt 5 pi -1
set linetype 5 lc rgb "blue"
lw 2 pt 8
set linetype 6 lc rgb "dark-orange" lw 2 pt 3
set linetype 7 lc rgb "black"
lw 2 pt 11
set linetype 8 lc rgb "goldenrod"
lw 2
set linetype cycle 8
Every time you run gnuplot the line types will be initialized to these values. You may initialize as many
linetypes as you like. If you do not redefine, say, linetype 3 then it will continue to have the default properties
(in this case blue, pt 3, lw 1, etc). The first few lines of the example script insure that the commands will
be skipped by older versions of gnuplot.
Similar script files can be used to define theme-based color choices, or sets of colors optimized for a particular
plot type or output device.
The command set linetype cycle 8 tells gnuplot to re-use these definitions for the color and linewidth of
higher-numbered linetypes. That is, linetypes 9-16, 17-24, and so on will use this same sequence of colors
and widths. The point properties (pointtype, pointsize, pointinterval) are not affected by this command.
unset linetype cycle disables this feature. If the line properties of a higher numbered linetype are explicitly
defined, this takes precedence over the recycled low-number linetype properties.
Lmargin
The command set lmargin sets the size of the left margin. Please see set margin (p. 126) for details.
Loadpath
The loadpath setting defines additional locations for data and command files searched by the call, load,
plot and splot commands. If a file cannot be found in the current directory, the directories in loadpath
are tried.
Syntax:
set loadpath {"pathlist1" {"pathlist2"...}}
show loadpath
gnuplot 4.7
125
Path names may be entered as single directory names, or as a list of path names separated by a platformspecific path separator, eg. colon (’:’) on Unix, semicolon (’;’) on DOS/Windows/OS/2 platforms. The show
loadpath, save and save set commands replace the platform-specific separator with a space character (’
’).
If the environment variable GNUPLOT LIB is set, its contents are appended to loadpath. However, show
loadpath prints the contents of set loadpath and GNUPLOT LIB separately. Also, the save and save
set commands ignore the contents of GNUPLOT LIB.
Locale
The locale setting determines the language with which {x,y,z}{d,m}tics will write the days and months.
Syntax:
set locale {"<locale>"}
<locale> may be any language designation acceptable to your installation. See your system documentation
for the available options. The command set locale "" will try to determine the locale from the LC TIME,
LC ALL, or LANG environment variables.
To change the decimal point locale, see set decimalsign (p. 109). To change the character encoding to
the current locale, see set encoding (p. 111).
Logscale
Syntax:
set logscale <axes> {<base>}
unset logscale <axes>
show logscale
where <axes> may be any combinations of x, x2, y, y2, z, cb, and r in any order. <base> is the base
of the log scaling (default is base 10). If no axes are specified, the command affects all axes except r. The
command unset logscale turns off log scaling for all axes.
Examples:
To enable log scaling in both x and z axes:
set logscale xz
To enable scaling log base 2 of the y axis:
set logscale y 2
To enable z and color log axes for a pm3d plot:
set logscale zcb
To disable z axis log scaling:
unset logscale z
Macros
If command line macro substitution is enabled, then tokens in the command line of the form
@<stringvariablename> will be replaced by the text string contained in <stringvariablename>. See substitution (p. 39).
Syntax:
set macros
126
gnuplot 4.7
Mapping
If data are provided to splot in spherical or cylindrical coordinates, the set mapping command should be
used to instruct gnuplot how to interpret them.
Syntax:
set mapping {cartesian | spherical | cylindrical}
A cartesian coordinate system is used by default.
For a spherical coordinate system, the data occupy two or three columns (or using entries). The first two
are interpreted as the azimuthal and polar angles theta and phi (or "longitude" and "latitude"), in the units
specified by set angles. The radius r is taken from the third column if there is one, or is set to unity if
there is no third column. The mapping is:
x = r * cos(theta) * cos(phi)
y = r * sin(theta) * cos(phi)
z = r * sin(phi)
Note that this is a "geographic" spherical system, rather than a "polar" one (that is, phi is measured from
the equator, rather than the pole).
For a cylindrical coordinate system, the data again occupy two or three columns. The first two are interpreted
as theta (in the units specified by set angles) and z. The radius is either taken from the third column or
set to unity, as in the spherical case. The mapping is:
x = r * cos(theta)
y = r * sin(theta)
z = z
The effects of mapping can be duplicated with the using filter on the splot command, but mapping may
be more convenient if many data files are to be processed. However even if mapping is used, using may
still be necessary if the data in the file are not in the required order.
mapping has no effect on plot.
world.dem:
mapping demos.
Margin
The margin is the distance between the plot border and the outer edge of the canvas. The size of the margin
is chosen automatically, but can be overridden by the set margin commands. show margin shows the
current settings. To alter the distance between the inside of the plot border and the data in the plot itself,
see set offsets (p. 133).
Syntax:
set bmargin
set lmargin
set rmargin
set tmargin
show margin
{{at
{{at
{{at
{{at
screen}
screen}
screen}
screen}
<margin>}
<margin>}
<margin>}
<margin>}
The default units of <margin> are character heights or widths, as appropriate. A positive value defines the
absolute size of the margin. A negative value (or none) causes gnuplot to revert to the computed value.
For 3D plots, only the left margin can be set using character units.
The keywords at screen indicates that the margin is specified as a fraction of the full drawing area. This
can be used to precisely line up the corners of individual 2D and 3D graphs in a multiplot. This placement
ignores the current values of set origin and set size, and is intended as an alternative method for positioning
graphs within a multiplot.
Normally the margins of a plot are automatically calculated based on tics, tic labels, axis labels, the plot
title, the timestamp and the size of the key if it is outside the borders. If, however, tics are attached to the
axes (set xtics axis, for example), neither the tics themselves nor their labels will be included in either the
margin calculation or the calculation of the positions of other text to be written in the margin. This can
lead to tic labels overwriting other text if the axis is very close to the border.
gnuplot 4.7
127
Mouse
The command set mouse enables mouse actions for the current interactive terminal. It is usually enabled
by default in interactive mode, but disabled by default if commands are being read from a file.
There are two mouse modes. The 2D mode works for plot commands and for splot maps (i.e. set view
with z-rotation 0, 90, 180, 270 or 360 degrees, including set view map). In this mode the mouse position is
tracked and you can pan or zoom using the mouse buttons or arrow keys. Some terminals support toggling
individual plots on/off by clicking on the corresponding key title or on a separate widget.
For 3D graphs splot, the view and scaling of the graph can be changed with mouse buttons 1 and 2,
respectively. A vertical motion of Button 2 with the shift key held down changes the xyplane. If additionally
to these buttons the modifier <ctrl> is held down, the coordinate axes are displayed but the data are
suppressed. This is useful for large data sets.
Mousing is not available inside multiplot mode. When multiplot is completed using unset multiplot, then
the mouse will be turned on again but acts only on the most recent plot within the multiplot (like replot
does).
Syntax:
set mouse {doubleclick <ms>} {nodoubleclick} \
{{no}zoomcoordinates} \
{noruler | ruler {at x,y}} \
{polardistance{deg|tan} | nopolardistance} \
{format <string>} \
{clipboardformat <int>/<string>} \
{mouseformat <int>/<string>} \
{{no}labels {"labeloptions"}} \
{{no}zoomjump} {{no}verbose}
unset mouse
The options noruler and ruler switch the ruler off and on, the latter optionally setting the origin at the
given coordinates. While the ruler is on, the distance in user units from the ruler origin to the mouse is
displayed continuously. By default, toggling the ruler has the key binding ’r’.
The option polardistance determines if the distance between the mouse cursor and the ruler is also shown
in polar coordinates (distance and angle in degrees or tangent (slope)). This corresponds to the default key
binding ’5’.
Choose the option labels to define persistent gnuplot labels using Button 2. The default is nolabels, which
makes Button 2 draw only a temporary label at the mouse position. Labels are drawn with the current
setting of mouseformat. The labeloptions string is passed to the set label command. The default is
"point pointstyle 1" which will plot a small plus at the label position. Temporary labels will disappear at
the next replot or mouse zoom operation. Persistent labels can be removed by holding the Ctrl-Key down
while clicking Button 2 on the label’s point. The threshold for how close you must be to the label is also
determined by the pointsize.
If the option verbose is turned on the communication commands are shown during execution. This option
can also be toggled by hitting 6 in the driver’s window. verbose is off by default.
Press ’h’ in the driver’s window for a short summary of the mouse and key bindings. This will also display
user defined bindings or hotkeys which can be defined using the bind command, see help for bind (p. 36).
Note, that user defined hotkeys may override the default bindings. See also help for bind (p. 36) and
label (p. 122).
Doubleclick
The doubleclick resolution is given in milliseconds and used for Button 1, which copies the current mouse
position to the clipboard. The default value is 300 ms. Setting the value to 0 ms triggers the copy on a
single click.
128
gnuplot 4.7
Mouseformat
The set mouse format command specifies a format string for sprintf() which determines how the mouse
cursor [x,y] coordinates are printed to the plot window and to the clipboard. The default is "% #g".
set mouse clipboardformat and set mouse mouseformat are used for formatting the text on Button1
and Button2 actions – copying the coordinates to the clipboard and temporarily annotating the mouse
position. An integer argument selects one of the format options in the table below. A string argument is
used as a format for sprintf() in option 6 and should contain two float specifiers. Example:
‘set mouse mouseformat "mouse x,y = %5.2g, %10.3f"‘.
Use set mouse mouseformat "" to turn this string off again.
The
0
1
2
3
4
5
6
7
following formats are available:
default (same as 1)
axis coordinates
1.23, 2.45
graph coordinates (from 0 to 1)
/0.00, 1.00/
x = timefmt
y = axis
[(as set by ‘set timefmt‘), 2.45]
x = date
y = axis
[31. 12. 1999, 2.45]
x = time
y = axis
[23:59, 2.45]
x = date time
y = axis
[31. 12. 1999 23:59, 2.45]
format from ‘set mouse mouseformat‘, e.g. "mouse x,y = 1.23,
2.450"
Scrolling
X and Y axis scaling in both 2D and 3D graphs can be adjusted using the mouse wheel. <wheel-up>
scrolls up (increases both YMIN and YMAX by ten percent of the Y range, and increases both Y2MIN and
Y2MAX likewise), and <wheel down> scrolls down. <shift-wheel-up> scrolls left (decreases both XMIN
and XMAX, and both X2MIN and X2MAX), and <shift-wheel-down> scrolls right. <control-wheel-up>
zooms in toward the center of the plot, and <control-wheel-down> zooms out. <shift-control-wheel-up>
zooms in along the X and X2 axes only, and <shift-control-wheel-down> zooms out along the X and X2
axes only.
X11 mouse
If multiple X11 plot windows have been opened using the set term x11 <n> terminal option, then only
the current plot window supports the entire range of mouse commands and hotkeys. The other windows
will, however, continue to display mouse coordinates at the lower left.
Zoom
Zooming is usually accomplished by holding down the left mouse button and dragging the mouse to delineate
a zoom region. Some platforms may require using a different mouse button. The original plot can be restored
by typing the ’u’ hotkey in the plot window. The hotkeys ’p’ and ’n’ step back and forth through a history
of zoom operations.
The option zoomcoordinates determines if the coordinates of the zoom box are drawn at the edges while
zooming. This is on by default.
If the option zoomjump is on, the mouse pointer will be automatically offset a small distance after starting
a zoom region with button 3. This can be useful to avoid a tiny (or even empty) zoom region. zoomjump
is off by default.
Multiplot
The command set multiplot places gnuplot in the multiplot mode, in which several plots are placed on
the same page, window, or screen.
Syntax:
gnuplot 4.7
129
set multiplot { layout <rows>,<cols>
{rowsfirst|columnsfirst} {downwards|upwards}
{title <page title>}
{scale <xscale>{,<yscale>}} {offset <xoff>{,<yoff>}}
}
unset multiplot
For some terminals, no plot is displayed until the command unset multiplot is given, which causes the
entire page to be drawn and then returns gnuplot to its normal single-plot mode. For other terminals, each
separate plot command produces an updated display, either by redrawing all previous ones and the newly
added plot, or by just adding the new plot to the existing display.
The area to be used by the next plot is not erased before doing the new plot. The clear command can be
used to do this if wanted, as is typically the case for "inset" plots.
Any labels or arrows that have been defined will be drawn for each plot according to the current size and
origin (unless their coordinates are defined in the screen system). Just about everything else that can be
set is applied to each plot, too. If you want something to appear only once on the page, for instance a
single time stamp, you’ll need to put a set time/unset time pair around one of the plot, splot or replot
commands within the set multiplot/unset multiplot block.
The multiplot title is separate from the individual plot titles, if any. Space is reserved for it at the top of
the page, spanning the full width of the canvas.
The commands set origin and set size must be used to correctly position each plot if no layout is specified
or if fine tuning is desired. See set origin (p. 133) and set size (p. 145) for details of their usage.
Example:
set multiplot
set size 0.4,0.4
set origin 0.1,0.1
plot sin(x)
set size 0.2,0.2
set origin 0.5,0.5
plot cos(x)
unset multiplot
This displays a plot of cos(x) stacked above a plot of sin(x).
set size and set origin refer to the entire plotting area used for each plot. Please also see set term size
(p. 21). If you want to have the axes themselves line up, you can guarantee that the margins are the same
size with the set margin commands. See set margin (p. 126) for their use. Note that the margin settings
are absolute, in character units, so the appearance of the graph in the remaining space will depend on the
screen size of the display device, e.g., perhaps quite different on a video display and a printer.
With the layout option you can generate simple multiplots without having to give the set size and set
origin commands before each plot: Those are generated automatically, but can be overridden at any time.
With layout the display will be divided by a grid with <rows> rows and <cols> columns. This grid is
filled rows first or columns first depending on whether the corresponding option is given in the multiplot
command. The stack of plots can grow downwards or upwards. Default is rowsfirst and downwards.
Each plot can be scaled by scale and shifted with offset; if the y-values for scale or offset are omitted, the
x-value will be used. unset multiplot will turn off the automatic layout and restore the values of set size
and set origin as they were before set multiplot layout.
Example:
set size 1,1
set origin 0,0
set multiplot layout 3,2 columnsfirst scale 1.1,0.9
[ up to 6 plot commands here ]
unset multiplot
The above example will produce 6 plots in 2 columns filled top to bottom, left to right. Each plot will have
a horizontal size of 1.1/2 and a vertical size of 0.9/3.
130
gnuplot 4.7
See also
multiplot demo (multiplt.dem)
Mx2tics
Minor tic marks along the x2 (top) axis are controlled by set mx2tics. Please see set mxtics (p. 130).
Mxtics
Minor tic marks along the x axis are controlled by set mxtics. They can be turned off with unset mxtics.
Similar commands control minor tics along the other axes.
Syntax:
set mxtics {<freq> | default}
unset mxtics
show mxtics
The same syntax applies to mytics, mztics, mx2tics, my2tics and mcbtics.
<freq> is the number of sub-intervals (NOT the number of minor tics) between major tics (the default for
a linear axis is either two or five depending on the major tics, so there are one or four minor tics between
major tics). Selecting default will return the number of minor ticks to its default value.
If the axis is logarithmic, the number of sub-intervals will be set to a reasonable number by default (based
upon the length of a decade). This will be overridden if <freq> is given. However the usual minor tics (2,
3, ..., 8, 9 between 1 and 10, for example) are obtained by setting <freq> to 10, even though there are but
nine sub-intervals.
To set minor tics at arbitrary positions, use the ("<label>" <pos> <level>, ...)
{x|x2|y|y2|z}tics with <label> empty and <level> set to 1.
form of set
The set m{x|x2|y|y2|z}tics commands work only when there are uniformly spaced major tics. If all major
tics were placed explicitly by set {x|x2|y|y2|z}tics, then minor tic commands are ignored. Implicit major
tics and explicit minor tics can be combined using set {x|x2|y|y2|z}tics and set {x|x2|y|y2|z}tics add.
Examples:
set xtics 0, 5, 10
set xtics add (7.5)
set mxtics 5
Major tics at 0,5,7.5,10, minor tics at 1,2,3,4,6,7,8,9
set
set
set
set
logscale y
ytics format ""
ytics 1e-6, 10, 1
ytics add ("1" 1, ".1" 0.1, ".01" 0.01, "10^-3" 0.001, \
"10^-4" 0.0001)
set mytics 10
Major tics with special formatting, minor tics at log positions
By default, minor tics are off for linear axes and on for logarithmic axes. They inherit the settings for
axis|border and {no}mirror specified for the major tics. Please see set xtics (p. 162) for information
about these.
My2tics
Minor tic marks along the y2 (right-hand) axis are controlled by set my2tics. Please see set mxtics
(p. 130).
gnuplot 4.7
131
Mytics
Minor tic marks along the y axis are controlled by set mytics. Please see set mxtics (p. 130).
Mztics
Minor tic marks along the z axis are controlled by set mztics. Please see set mxtics (p. 130).
Object
The set object command defines a single object which will appear in all subsequent 2D plots. You may
define as many objects as you like. Currently the supported object types are rectangle, circle, ellipse,
and polygon. Rectangles inherit a default set of style properties (fill, color, border) from those set by
the command set style rectangle, but each object can also be given individual style properties. Circles,
ellipses, and polygons inherit the fill style from set style fill.
Syntax:
set object <index>
<object-type> <object-properties>
{front|back|behind} {fc|fillcolor <colorspec>} {fs <fillstyle>}
{default} {lw|linewidth <width>}
<object-type> is either rectangle, ellipse, circle, or polygon. Each object type has its own set of
characteristic properties.
Setting front will draw the object in front of all plot elements, but behind any labels that are also marked
front. Setting back will place the object behind all plot curves and labels. Setting behind will place the
object behind everything including the axes and back rectangles, thus
set object rectangle from screen 0,0 to screen 1,1 behind
can be used to provide a colored background for the entire graph or page.
The fill color of the object is taken from the <colorspec>. fillcolor may be abbreviated fc. The fill style
is taken from <fillstyle>. See colorspec (p. 34) and fillstyle (p. 148). If the keyword default is given,
these properties are inherited from the default settings at the time a plot is drawn. See set style rectangle
(p. 151).
Rectangle
Syntax:
set object <index> rectangle
{from <position> {to|rto} <position> |
center <position> size <w>,<h> |
at <position> size <w>,<h>}
The position of the rectangle may be specified by giving the position of two diagonal corners (bottom left
and top right) or by giving the position of the center followed by the width and the height. In either case
the positions may be given in axis, graph, or screen coordinates. See coordinates (p. 22). The options at
and center are synonyms.
Examples:
# Force the entire area enclosed by the axes to have background color cyan
set object 1 rect from graph 0, graph 0 to graph 1, graph 1 back
set object 1 rect fc rgb "cyan" fillstyle solid 1.0
# Position a red square with lower left at 0,0 and upper right at 2,3
set object 2 rect from 0,0 to 2,3 fc lt 1
132
gnuplot 4.7
# Position an empty rectangle (no fill) with a blue border
set object 3 rect from 0,0 to 2,3 fs empty border rgb "blue"
# Return fill and color to the default style but leave vertices unchanged
set object 2 rect default
Rectangle corners specified in screen coordinates may extend beyond the edge of the current graph. Otherwise
the rectangle is clipped to fit in the graph.
Ellipse
Syntax:
set object <index> ellipse {at|center} <position> size <w>,<h>
{angle <orientation>} {units xy|xx|yy}
{<other-object-properties>}
The position of the ellipse is specified by giving the center followed by the width and the height (actually
the major and minor axes). The keywords at and center are synonyms. The center position may be given
in axis, graph, or screen coordinates. See coordinates (p. 22). The major and minor axis lengths must
be given in axis coordinates. The orientation of the ellipse is specified by the angle between the horizontal
axis and the major diameter of the ellipse. If no angle is given, the default ellipse orientation will be used
instead (see set style ellipse (p. 152)). The units keyword controls the scaling of the axes of the ellipse.
units xy means that the major axis is interpreted in terms of units along the x axis, while the minor axis in
that of the y axis. units xx means that both axes of the ellipses are scaled in the units of the x axis, while
units yy means that both axes are in units of the y axis. The default is xy or whatever set style ellipse
units was set to.
NB: If the x and y axis scales are not equal, (e.g. units xy is in effect) then the major/minor axis ratio will
no longer be correct after rotation.
Note that set object ellipse size <2r>,<2r> does not in general produce the same result as set object
circle <r>. The circle radius is always interpreted in terms of units along the x axis, and will always
produce a circle even if the x and y axis scales are different and even if the aspect ratio of your plot is not
1. If units is set to xy, then ’set object ellipse’ interprets the first <2r> in terms of x axis units and the
second <2r> in terms of y axis units. This will only produce a circle if the x and y axis scales are identical
and the plot aspect ratio is 1. On the other hand, if units is set to xx or yy, then the diameters specified
in the ’set object’ command will be interpreted in the same units, so the ellipse will have the correct aspect
ratio, and it will maintain its aspect ratio even if the plot is resized.
Circle
Syntax:
set object <index> circle {at|center} <position> size <radius>
{arc [<begin>:<end>]}
{<other-object-properties>}
The position of the circle is specified by giving the position of the center center followed by the radius. The
keywords at and center are synonyms. The position and radius may be given in x-axis, graph, or canvas
coordinates. See coordinates (p. 22). In all cases the radius is calculated relative to the horizontal scale
of the axis, graph, or canvas. Any disparity between the horizontal and vertical scaling will be corrected for
so that the result is always a circle.
By default a full circle is drawn. The optional qualifier arc specifies a starting angle and ending angle, in
degrees, for one arc of the circle. The arc is always drawn counterclockwise.
Polygon
Syntax:
gnuplot 4.7
133
set object <index> polygon
from <position> to <position> ... {to <position>}
or
from <position> rto <position> ... {rto <position>}
The position of the polygon may be specified by giving the position of a sequence of vertices. These may be
given in axis, graph, or screen coordinates. If relative coordinates are used (rto) then the coordinate type
must match that of the previous vertex. See coordinates (p. 22).
Example:
set object 1 polygon from 0,0 to 1,1 to 2,0
set object 1 fc rgb "cyan" fillstyle solid 1.0 border lt -1
Offsets
Offsets provide a mechanism to put an empty boundary around the data inside an autoscaled graph. The
offsets only affect the x1 and y1 axes, and only in 2D plot commands.
Syntax:
set offsets <left>, <right>, <top>, <bottom>
unset offsets
show offsets
Each offset may be a constant or an expression. Each defaults to 0. By default, the left and right offsets
are given in units of the first x axis, the top and bottom offsets in units of the first y axis. Alternatively,
you may specify the offsets as a fraction of the total axis range by using the keyword "graph". A positive
offset expands the axis range in the specified direction, e.g., a positive bottom offset makes ymin more
negative. Negative offsets, while permitted, can have unexpected interactions with autoscaling and clipping.
To prevent the auto-scaling from further adjusting your axis ranges, it is useful to also specify "set auto fix".
Example:
set auto fix
set offsets graph 0.05, 0, 2, 2
plot sin(x)
This graph of sin(x) will have a y range [-3:3] because the function will be autoscaled to [-1:1] and the vertical
offsets are each two. The x range will be [-11:10] because the default is [-10:10] and it has been expanded to
the left by 0.05 of that total range.
Origin
The set origin command is used to specify the origin of a plotting surface (i.e., the graph and its margins)
on the screen. The coordinates are given in the screen coordinate system (see coordinates (p. 22) for
information about this system).
Syntax:
set origin <x-origin>,<y-origin>
Output
By default, screens are displayed to the standard output. The set output command redirects the display
to the specified file or device.
Syntax:
set output {"<filename>"}
show output
134
gnuplot 4.7
The filename must be enclosed in quotes. If the filename is omitted, any output file opened by a previous
invocation of set output will be closed and new output will be sent to STDOUT. (If you give the command
set output "STDOUT", your output may be sent to a file named "STDOUT"! ["May be", not "will be",
because some terminals, like x11 or wxt, ignore set output.])
When both set terminal and set output are used together, it is safest to give set terminal first, because
some terminals set a flag which is needed in some operating systems. This would be the case, for example,
if the operating system needs to know whether or not a file is to be formatted in order to open it properly.
On machines with popen functions (Unix), output can be piped through a shell command if the first nonwhitespace character of the filename is ’|’. For instance,
set output "|lpr -Plaser filename"
set output "|lp -dlaser filename"
On MSDOS machines, set output "PRN" will direct the output to the default printer. On VMS, output
can be sent directly to any spooled device. It is also possible to send the output to DECnet transparent
tasks, which allows some flexibility.
Parametric
The set parametric command changes the meaning of plot (splot) from normal functions to parametric
functions. The command unset parametric restores the plotting style to normal, single-valued expression
plotting.
Syntax:
set parametric
unset parametric
show parametric
For 2D plotting, a parametric function is determined by a pair of parametric functions operating on a
parameter. An example of a 2D parametric function would be plot sin(t),cos(t), which draws a circle (if
the aspect ratio is set correctly — see set size (p. 145)). gnuplot will display an error message if both
functions are not provided for a parametric plot.
For 3D plotting, the surface is described as x=f(u,v), y=g(u,v), z=h(u,v). Therefore a triplet of functions is
required. An example of a 3D parametric function would be cos(u)*cos(v),cos(u)*sin(v),sin(u), which
draws a sphere. gnuplot will display an error message if all three functions are not provided for a parametric
splot.
The total set of possible plots is a superset of the simple f(x) style plots, since the two functions can describe
the x and y values to be computed separately. In fact, plots of the type t,f(t) are equivalent to those produced
with f(x) because the x values are computed using the identity function. Similarly, 3D plots of the type
u,v,f(u,v) are equivalent to f(x,y).
Note that the order the parametric functions are specified is xfunction, yfunction (and zfunction) and that
each operates over the common parametric domain.
Also, the set parametric function implies a new range of values. Whereas the normal f(x) and f(x,y) style
plotting assume an xrange and yrange (and zrange), the parametric mode additionally specifies a trange,
urange, and vrange. These ranges may be set directly with set trange, set urange, and set vrange, or
by specifying the range on the plot or splot commands. Currently the default range for these parametric
variables is [-5:5]. Setting the ranges to something more meaningful is expected.
Plot
The show plot command shows the current plotting command as it results from the last plot and/or splot
and possible subsequent replot commands.
In addition, the show plot add2history command adds this current plot command into the history. It
is useful if you have used replot to add more curves to the current plot and you want to edit the whole
command now.
gnuplot 4.7
135
Pm3d
pm3d is an splot style for drawing palette-mapped 3d and 4d data as color/gray maps and surfaces. It uses
an algorithm that allows plotting gridded as well as non-gridded data without preprocessing, even when the
data scans do not have the same number of points.
Syntax (the options can be given in any order):
set pm3d {
{ at <position> }
{ interpolate <steps/points in scan, between scans> }
{ scansautomatic | scansforward | scansbackward | depthorder }
{ flush { begin | center | end } }
{ ftriangles | noftriangles }
{ clip1in | clip4in }
{ corners2color { mean|geomean|median|min|max|c1|c2|c3|c4 } }
{ hidden3d {<linestyle>} | nohidden3d }
{ implicit | explicit }
{ map }
}
show pm3d
unset pm3d
A pm3d color surface is drawn if the splot command specifies with pm3d, if the data or function style is
set to pm3d globally, or if the pm3d mode is set pm3d implicit. In the latter two cases, the pm3d surface
is draw in addition to the mesh produced by the style specified in the plot command. E.g.
splot ’fred.dat’ with lines, ’lola.dat’ with lines
would draw both a mesh of lines and a pm3d surface for each data set. If the option explicit is on (or
implicit is off) only plots specified by the with pm3d attribute are plotted with a pm3d surface, e.g.:
splot ’fred.dat’ with lines, ’lola.dat’ with pm3d
would plot ’fred.dat’ with lines (only) and ’lola.dat’ with a pm3d surface.
On gnuplot start-up, the mode is explicit. For historical and compatibility reasons, the commands set
pm3d; (i.e. no options) and set pm3d at X ... (i.e. at is the first option) change the mode to implicit.
The command set pm3d; sets other options to their default state.
If you set the default data or function style to pm3d, e.g.:
set style data pm3d
then the options implicit and explicit have no effect.
Note that when plotting several plots, they are plotted in the order given on the command line. This can
be of interest especially for filled surfaces which can overwrite and therefore hide part of earlier plots.
The pm3d coloring can be drawn at any or all of three different positions, top, bottom, or surface. See
pm3d position (p. 136). The following command draws three color surfaces at different altitudes:
set border 4095
set pm3d at s
splot 10*x with pm3d at b, x*x-y*y, x*x+y*y with pm3d at t
See also help for set palette (p. 138), set cbrange (p. 168), set colorbox (p. 105), and definitely the
demo file demo/pm3d.dem.
Algorithm
Let us first describe how a map/surface is drawn. The input data come from an evaluated function or from
an splot data file. Each surface consists of a sequence of separate scans (isolines). The pm3d algorithm
fills the region between two neighbouring points in one scan with another two points in the next scan by
a gray (or color) according to z-values (or according to an additional ’color’ column, see help for using
136
gnuplot 4.7
(p. 84)) of these 4 corners; by default the 4 corner values are averaged, but this can be changed by the
option corners2color. In order to get a reasonable surface, the neighbouring scans should not cross and
the number of points in the neighbouring scans should not differ too much; of course, the best plot is with
scans having same number of points. There are no other requirements (e.g. the data need not be gridded).
Another advantage is that the pm3d algorithm does not draw anything outside of the input (measured or
calculated) region.
Surface coloring works with the following input data:
1. splot of function or of data file with one or three data columns: The gray/color scale is obtained by
mapping the averaged (or corners2color) z-coordinate of the four corners of the above-specified quadrangle
into the range [min color z,max color z] of zrange or cbrange providing a gray value in the range [0:1].
This value can be used directly as the gray for gray maps. The normalized gray value can be further mapped
into a color — see set palette (p. 138) for the complete description.
2. splot of data file with two or four data columns: The gray/color value is obtained by using the last-column
coordinate instead of the z-value, thus allowing the color and the z-coordinate be mutually independent. This
can be used for 4d data drawing.
Other notes:
1. The term ’scan’ referenced above is used more among physicists than the term ’iso curve’ referenced in
gnuplot documentation and sources. You measure maps recorded one scan after another scan, that’s why.
2. The ’gray’ or ’color’ scale is a linear mapping of a continuous variable onto a smoothly varying palette of
colors. The mapping is shown in a rectangle next to the main plot. This documentation refers to this as a
"colorbox", and refers to the indexing variable as lying on the colorbox axis. See set colorbox (p. 105),
set cbrange (p. 168).
3. To use pm3d coloring to generate a two-dimensional plot rather than a 3D surface, use set view map
or set pm3d map.
Position
Color surface can be drawn at the base or top (then it is a gray/color planar map) or at z-coordinates of
surface points (gray/color surface). This is defined by the at option with a string of up to 6 combinations
of b, t and s. For instance, at b plots at bottom only, at st plots firstly surface and then top map, while
at bstbst will never by seriously used.
Colored quadrangles are plotted one after another. When plotting surfaces (at s), the later quadrangles
overlap (overdraw) the previous ones. (Gnuplot is not virtual reality tool to calculate intersections of filled
polygon meshes.) You may try to switch between scansforward and scansbackward to force the first
scan of the data to be plotted first or last. The default is scansautomatic where gnuplot makes a guess
about scans order. On the other hand, the depthorder option completely reorders the quadrangles. The
rendering is performed after a depth sorting, which allows to visualize even complicated surfaces; see pm3d
depthorder (p. 136) for more details.
Scanorder
By default the quadrangles making up a pm3d solid surface are rendered in the order they
are encountered along the surface grid points.
This order may be controlled by the options
scansautomatic|scansforward|scansbackward. These scan options are not in general compatible with
hidden-surface removal.
If two successive scans do not have same number of points, then it has to be decided whether to start taking
points for quadrangles from the beginning of both scans (flush begin), from their ends (flush end) or to
center them (flush center). Note, that flush (center|end) are incompatible with scansautomatic: if you
specify flush center or flush end and scansautomatic is set, it is silently switched to scansforward.
If two subsequent scans do not have the same number of points, the option ftriangles specifies whether
color triangles are drawn at the scan tail(s) where there are not enough points in either of the scan. This
can be used to draw a smooth map boundary.
gnuplot 4.7
137
Gnuplot does not do true hidden surface removal for solid surfaces, but often it is sufficient to render the
component quadrangles in order from furthest to closest. This mode may be selected using the options
set pm3d depthorder hidden3d
The depthorder option orders the solid quadrangles; the hidden3d option similarly orders the bounding
lines (if drawn). Note that the global option set hidden3d does not affect pm3d surfaces.
Clipping
Clipping with respect to x, y coordinates of quadrangles can be done in two ways. clip1in: all 4 points
of each quadrangle must be defined and at least 1 point of the quadrangle must lie in the x and y ranges.
clip4in: all 4 points of each quadrangle must lie in the x and y ranges.
Color assignment
3 columns of data (x,y,z):
The coloring setup as well as the color box drawing are determined by set palette. There can be only one
palette for the current plot. Drawing of several surfaces with different palettes can be achieved by multiplot
with fixed origin and size; don’t forget to use set palette maxcolors when your terminal is running out
of available colors.
There is a single gray/color value associated to each drawn pm3d quadrangle (no smooth color change
among vertices). The value is calculated from z-coordinates from the surrounding corners according to
corners2color <option>. The options ’mean’ (default), ’geomean’ and ’median’ produce various kinds of
surface color smoothing, while options ’min’ and ’max’ choose minimal or maximal value, respectively. This
may not be desired for pixel images or for maps with sharp and intense peaks, in which case the options
’c1’, ’c2’, ’c3’ or ’c4’ can be used instead to assign the quadrangle color based on the z-coordinate of only
one corner. Some experimentation may be needed to determine which corner corresponds to ’c1’, as the
orientation depends on the drawing direction. Because the pm3d algorithm does not extend the colored
surface outside the range of the input data points, the ’c<j>’ coloring options will result in pixels along two
edges of the grid not contributing to the color of any quadrangle. For example, applying the pm3d algorithm
to the 4x4 grid of data points in script demo/pm3d.dem (please have a look) produces only (4-1)x(4-1)=9
colored rectangles.
4 columns of data (x,y,z,color):
If a fourth column of data is provided, it is normally interpreted as a separate palette-mapped gray value.
The coloring of individual quadrangles works as above, except that the color value is distinct from the z value.
As a separate coloring option, the fourth data column may provide instead an RGB color. See rgbcolor
variable (p. 35). In this case the plotting command must be
splot ... using 1:2:3:4 with pm3d lc rgb variable
Another drawing algorithm, which would draw quadrangles around a given node by taking corners from
averaged (x,y)-coordinates of its surrounding 4 nodes while using node’s color, could be implemented in the
future. This is already done for drawing images (2D grids) via image and rgbimage styles.
Notice that ranges of z-values and color-values for surfaces are adjustable independently by set zrange, set
cbrange, as well as set log for z or cb. Maps can be adjusted by the cb-axis only; see also set view map
(p. 157) and set colorbox (p. 105).
Hidden3d
The option set pm3d hidden3d draws the bounding lines of each quadrangle at the same time that the
quadrangle itself is drawn. Normally it is used in conjunction with the depthorder option to achieve an
approximation to true hidden line removal. This is far more efficient than using the command set hidden3d.
The command takes an optional linestyle controlling the appearance of the bounding lines. If the linestyle
parameter is negative, or omitted, then the line properties given in the plot command are used. Example of
recommended usage:
138
gnuplot 4.7
set pm3d at s hidden3d depthorder
unset hidden3d
unset surf
splot x*x+y*y linecolor rgb "black" linewidth 0.5
Interpolate
The option interpolate m,n will interpolate grid points into a finer mesh, and color each quadrangle
appropriately. For data files, this will smoothen the color surface, and enhance spikes in a color surface.
For functions, interpolation makes little sense, except to trade off precision for memory. It would usually
make more sense to use samples and isosamples when working with functions. For positive m and n,
each quadrangle or triangle is interpolated m-times and n-times in the respective direction. For negative
m and n, the interpolation frequency is chosen so that there will be at least |m| and |n| points drawn; you
can consider this as a special gridding function. Zeros, i.e. interpolate 0,0, will automatically choose an
optimal number of interpolated surface points.
Deprecated options
There used to be an option {transparent|solid} to this command. Now you get the same effect from set
grid {front|layerdefault}, respectively.
The command set pm3d map is equivalent to set pm3d at b; set view map; set style data pm3d;
set style func pm3d;. It is used for backwards compatibility, when set view map was not available.
Take care that you properly use zrange and cbrange for input data point filtering and color range scaling,
respectively; and also set (no)surface seems to have a (side?) effect.
Palette
Palette is a color storage for use by pm3d, filled color contours or polygons, color histograms, color gradient
background, and whatever it is or it will be implemented... Here it stands for a palette of smooth "continuous"
colors or grays, but let’s call it just a palette.
Color palettes require terminal entries for filled color polygons and palettes of smooth colors, are currently
available for terminals listed in help for set pm3d. The range of color values are adjustable independently
by set cbrange and set log cb. The whole color palette is visualized in the colorbox.
Syntax:
set palette
set palette {
{ gray | color }
{ gamma <gamma> }
{
rgbformulae <r>,<g>,<b>
| defined { ( <gray1> <color1> {, <grayN> <colorN>}... ) }
| file ’<filename>’ {datafile-modifiers}
| functions <R>,<G>,<B>
}
{ cubehelix {start <val>} {cycles <val>} {saturation <val>} }
{ model { RGB | HSV | CMY | YIQ | XYZ } }
{ positive | negative }
{ nops_allcF | ps_allcF }
{ maxcolors <maxcolors> }
}
show palette
show palette palette <n> {{float | int}}
show palette gradient
show palette fit2rgbformulae
show palette rgbformulae
gnuplot 4.7
139
show colornames
set palette (i.e. without options) sets up the default values. Otherwise, the options can be given in any
order. show palette shows the current palette properties.
show palette gradient displays the gradient defining the palette (if appropriate). show palette rgbformulae prints the available fixed gray –> color transformation formulae. show colornames prints the
known color names.
show palette palette <n> prints to the screen or to the file given by set print a table of RGB triplets
calculated for the current palette settings and a palette having <n> discrete colors. The default wide table
can be limited to 3 columns of r,g,b float values [0..1] or integer values [0..255] by options float or int,
respectively. This way, the current gnuplot color palette can be loaded into other imaging applications, for
example Octave. Additionally to this textual list of RGB table, you can use the test palette command to
plot the R,G,B profiles for the current palette.
The following options determine the coloring properties.
Figure using this palette can be gray or color. For instance, in pm3d color surfaces the gray of each small
spot is obtained by mapping the averaged z-coordinate of the 4 corners of surface quadrangles into the range
[min z,max z] providing range of grays [0:1]. This value can be used directly as the gray for gray maps. The
color map requires a transformation gray –> (R,G,B), i.e. a mapping [0:1] –> ([0:1],[0:1],[0:1]).
Basically two different types of mappings can be used: Analytic formulae to convert gray to color, or discrete
mapping tables which are interpolated. palette rgbformulae and palette functions use analytic formulae
whereas palette defined and palette file use interpolated tables. palette rgbformulae reduces the size
of postscript output to a minimum.
The command show palette fit2rgbformulae finds the best matching set palette rgbformulae for the
current set palette. Naturally, it makes sense to use it for non-rgbformulae palettes. This command can
be found useful mainly for external programs using the same rgbformulae definition of palettes as gnuplot,
like zimg (
http://zimg.sourceforge.net
).
set palette gray switches to a gray only palette. set palette rgbformulae, set palette defined, set
palette file and set palette functions switch to a color mapping. set palette color is an easy way to
switch back from the gray palette to the last color mapping.
Automatic gamma correction via set palette gamma <gamma> can be done for gray maps (set palette
gray) and for the cubehelix color palette schemes. Gamma = 1 produces a linear ramp of intensity. See
test palette (p. 174).
Many terminals support only discrete number of colors (e.g. 256 colors in gif). After the default gnuplot
linetype colors are allocated, the rest of the available colors are by default reserved for pm3d. Thus a
multiplot using multiple palettes could fail because the first palette has used all the available color positions.
You can mitigate this limitation by using set palette maxcolors <N> with a reasonably small value of
N. This option causes N discrete colors to be selected from a continuous palette sampled at equally spaced
intervals. If you want unequal spacing of N discrete colors, use set palette defined instead of a single
continuous palette.
RGB color space might not be the most useful color space to work in. For that reason you may change the
color space with model to one of RGB, HSV, CMY, YIQ and XYZ. Using color names for set palette
defined tables and a color space other than RGB will result in funny colors. All explanation have been
written for RGB color space, so please note, that R can be H, C, Y, or X, depending on the actual color
space (G and B accordingly).
All values for all color spaces are limited to [0,1].
RGB stands for Red, Green and Blue; CMY stands for Cyan, Magenta and Yellow; HSV stands for Hue,
Saturation, and Value; YIQ is the color model used by the U.S. Commercial Color Television Broadcasting,
it is basically an RGB recoding with downward compatibility for black and white television; XYZ are the
three primary colors of the color model defined by the ’Commission Internationale de l’Eclairage’ (CIE). For
more information on color models see:
140
gnuplot 4.7
http://en.wikipedia.org/wiki/Color space
Rgbformulae
For rgbformulae three suitable mapping functions have to be chosen. This is done via rgbformulae
<r>,<g>,<b>. The available mapping functions are listed by show palette rgbformulae. Default
is 7,5,15, some other examples are 3,11,6, 21,23,3 or 3,23,21. Negative numbers, like 3,-11,-6, mean
inverted color (i.e. 1-gray passed into the formula, see also positive (p. 140) and negative (p. 140)
options below).
Some nice schemes in RGB color space
7,5,15
... traditional pm3d (black-blue-red-yellow)
3,11,6
... green-red-violet
23,28,3 ... ocean (green-blue-white); try also all other permutations
21,22,23 ... hot (black-red-yellow-white)
30,31,32 ... color printable on gray (black-blue-violet-yellow-white)
33,13,10 ... rainbow (blue-green-yellow-red)
34,35,36 ... AFM hot (black-red-yellow-white)
A full color palette in HSV color space
3,2,2
... red-yellow-green-cyan-blue-magenta-red
Please note that even if called rgbformulae the formulas might actually determine the <H>,<S>,<V> or
<X>,<Y>,<Z> or ... color components as usual.
Use positive and negative to invert the figure colors.
Note that it is possible to find a set of the best matching rgbformulae for any other color scheme by the
command
show palette fit2rgbformulae
Defined
Gray-to-rgb mapping can be manually set by use of palette defined: A color gradient is defined and used
to give the rgb values. Such a gradient is a piecewise linear mapping from gray values in [0,1] to the RGB
space [0,1]x[0,1]x[0,1]. You must specify the gray values and the corresponding RGB values between which
linear interpolation will be done.
Syntax:
set palette
defined { ( <gray1> <color1> {, <grayN> <colorN>}... ) }
<grayX> are gray values which are mapped to [0,1] and <colorX> are the corresponding rgb colors. The
color can be specified in three different ways:
<color> :=
{ <r> <g> <b> | ’<color-name>’ | ’#rrggbb’ }
Either by three numbers (each in [0,1]) for red, green and blue, separated by whitespace, or the name of the
color in quotes or X style color specifiers also in quotes. You may freely mix the three types in a gradient
definition, but the named color "red" will be something strange if RGB is not selected as color space. Use
show colornames for a list of known color names.
Please note, that even if written as <r>, this might actually be the <H> component in HSV color space or
<X> in CIE-XYZ space, or ... depending on the selected color model.
The <gray> values have to form an ascending sequence of real numbers; the sequence will be automatically
rescaled to [0,1].
set palette defined (without a gradient definition in braces) switches to RGB color space and uses a preset
full-spectrum color gradient. Use show palette gradient to display the gradient.
Examples:
To produce a gray palette (useless but instructive) use:
gnuplot 4.7
141
set palette model RGB
set palette defined ( 0 "black", 1 "white" )
To produce a blue yellow red
set palette defined
set palette defined
set palette defined
palette use (all equivalent):
( 0 "blue", 1 "yellow", 2 "red" )
( 0 0 0 1, 1 1 1 0, 2 1 0 0 )
( 0 "#0000ff", 1 "#ffff00", 2 "#ff0000" )
To produce some rainbow-like palette use:
set palette defined ( 0 "blue", 3 "green", 6 "yellow", 10 "red" )
Full color spectrum
set palette
set palette
set palette
within HSV color space:
model HSV
defined ( 0 0 1 1, 1 1 1 1 )
defined ( 0 0 1 0, 1 0 1 1, 6 0.8333 1 1, 7 0.8333 0 1)
Approximate the default palette used by MATLAB:
set pal defined (1 ’#00008f’, 8 ’#0000ff’, 24 ’#00ffff’, \
40 ’#ffff00’, 56 ’#ff0000’, 64 ’#800000’)
To produce a palette with only a few, equally-spaced colors:
set palette model RGB maxcolors 4
set palette defined ( 0 "yellow", 1 "red" )
’Traffic light’ palette (non-smooth color jumps at
set palette model RGB
set palette defined (0 "dark-green",
1 "yellow",
2 "red",
gray = 1/3 and 2/3).
1 "green", \
2 "dark-yellow", \
3 "dark-red" )
Functions
Use set palette functions <Rexpr>, <Gexpr>, <Bexpr> to define three formulae for the R(gray),
G(gray) and B(gray) mapping. The three formulae may depend on the variable gray which will take values
in [0,1] and should also produce values in [0,1]. Please note that <Rexpr> might be a formula for the H-value
if HSV color space has been chosen (same for all other formulae and color spaces).
Examples:
To produce a full color palette use:
set palette model HSV functions gray, 1, 1
A nice black to gold palette:
set palette model XYZ functions gray**0.35, gray**0.5, gray**0.8
A gamma-corrected black and white palette
gamma = 2.2
color(gray) = gray**(1./gamma)
set palette model RGB functions color(gray), color(gray), color(gray)
Cubehelix
The "cubehelix" option defines a family of palettes in which color (hue) varies along the standard color wheel
while at the same time the net intensity increases monotonically as the gray value goes from 0 to 1.
D A Green (2011) http://arxiv.org/abs/1108.5083
start defines the starting point along the color wheel in radians. cycles defines how many color wheel cycles
span the palette range. Larger values of saturation produce more saturated color; saturation > 1 may lead
to clipping of the individual RGB components and to intensity becoming non-monotonic. The palette is also
affected by set palette gamma. The default values are
set palette cubehelix start 0.5 cycles -1.5 saturation 1
set palette gamma 1.5
142
gnuplot 4.7
File
set palette file is basically a set palette defined (<gradient>) where <gradient> is read from a datafile.
Either 4 columns (gray,R,G,B) or just three columns (R,G,B) have to be selected via the using data file
modifier. In the three column case, the line number will be used as gray. The gray range is automatically
rescaled to [0,1]. The file is read as a normal data file, so all datafile modifiers can be used. Please note,
that R might actually be e.g. H if HSV color space is selected.
As usual <filename> may be ’-’ which means that the data follow the command inline and are terminated
by a single e on a line of its own.
Use show palette gradient to display the gradient.
Examples:
Read in a palette of RGB triples each in range [0,255]:
set palette file ’some-palette’ using ($1/255):($2/255):($3/255)
Equidistant rainbow (blue-green-yellow-red) palette:
set palette model RGB file "-"
0 0 1
0 1 0
1 1 0
1 0 0
e
Binary palette files are supported as well, see binary general (p. 74). Example: put 64 triplets of R,G,B
doubles into file palette.bin and load it by
set palette file "palette.bin" binary record=64 using 1:2:3
Gamma correction
For gray mappings gamma correction can be turned on by set palette gamma <gamma>. <gamma>
defaults to 1.5 which is quite suitable for most terminals.
The gamma correction is applied to the cubehelix color palette family, but not to other palette coloring
schemes. However, you may easily implement gamma correction for explicit color functions.
Example:
set palette model RGB
set palette functions gray**0.64, gray**0.67, gray**0.70
To use gamma correction with interpolated gradients specify intermediate gray values with appropriate
colors. Instead of
set palette defined ( 0 0 0 0, 1 1 1 1 )
use e.g.
set palette defined ( 0 0 0 0, 0.5 .73 .73 .73, 1 1 1 1 )
or even more intermediate points until the linear interpolation fits the "gamma corrected" interpolation well
enough.
Postscript
In order to reduce the size of postscript files, the gray value and not all three calculated r,g,b values are
written to the file. Therefore the analytical formulae are coded directly in the postscript language as a
header just before the pm3d drawing, see /g and /cF definitions. Usually, it makes sense to write therein
definitions of only the 3 formulae used. But for multiplot or any other reason you may want to manually edit
the transformations directly in the postscript file. This is the default option nops allcF. Using the option
gnuplot 4.7
143
ps allcF writes postscript definitions of all formulae. This you may find interesting if you want to edit the
postscript file in order to have different palettes for different surfaces in one graph. Well, you can achieve
this functionality by multiplot with fixed origin and size.
If pm3d map has been plotted from gridded or almost regular data with an output to a postscript file,
then it is possible to reduce the size of this postscript file up to at about 50% by the enclosed awk script
pm3dCompress.awk. This you may find interesting if you intend to keep the file for including it into your
publication or before downloading a very large file into a slow printer. Usage:
awk -f pm3dCompress.awk thefile.ps >smallerfile.ps
If pm3d map has been plotted from rectangular gridded data with an output to a postscript file, then it is
possible to reduce the file size even more by the enclosed awk script pm3dConvertToImage.awk. Usage:
awk -f pm3dConvertToImage.awk <thefile.ps >smallerfile.ps
You may manually change the postscript output from gray to color and vice versa and change the definition
of <maxcolors>.
Pointintervalbox
The pointinterval property of line types is used in plot style linespoints. A negative value of pointinterval,
e.g. -N, means that point symbols are drawn only for every Nth point, and that a box (actually circle) behind
each point symbol is blanked out by filling with the background color. The command set pointintervalbox
controls the radius of this blanked-out region. It is a multiplier for the default radius, which is equal to the
point size.
Pointsize
The set pointsize command scales the size of the points used in plots.
Syntax:
set pointsize <multiplier>
show pointsize
The default is a multiplier of 1.0. Larger pointsizes may be useful to make points more visible in bitmapped
graphics.
The pointsize of a single plot may be changed on the plot command. See plot with (p. 91) for details.
Please note that the pointsize setting is not supported by all terminal types.
Polar
The set polar command changes the meaning of the plot from rectangular coordinates to polar coordinates.
Syntax:
set polar
unset polar
show polar
In polar coordinates, the dummy variable (t) is an angle. The default range of t is [0:2*pi], or, if degree
units have been selected, to [0:360] (see set angles (p. 96)).
The command unset polar changes the meaning of the plot back to the default rectangular coordinate
system.
The set polar command is not supported for splots. See the set mapping (p. 126) command for similar
functionality for splot (p. 169)s.
While in polar coordinates the meaning of an expression in t is really r = f(t), where t is an angle of rotation.
The trange controls the domain (the angle) of the function. The r, x and y ranges control the extent of
144
gnuplot 4.7
the graph in the x and y directions. Each of these ranges, as well as the rrange, may be autoscaled or set
explicitly. For details, see set rrange (p. 145) and set xrange (p. 160).
Example:
set polar
plot t*sin(t)
set trange [-2*pi:2*pi]
set rrange [0:3]
plot t*sin(t)
The first plot uses the default polar angular domain of 0 to 2*pi. The radius and the size of the graph are
scaled automatically. The second plot expands the domain, and restricts the size of the graph to the area
within 3 units of the origin. This has the effect of limiting x and y to [-3:3].
You may want to set size square to have gnuplot try to make the aspect ratio equal to unity, so that
circles look circular. See also
polar demos (polar.dem)
and
polar data plot (poldat.dem).
Print
The set print command redirects the output of the print command to a file.
Syntax:
set
set
set
set
set
print
print
print
print
print
"-"
"<filename>"
"<filename>" append
"|<shell_command>"
Without "<filename>", the output file is restored to <STDERR>. The <filename> "-" means
<STDOUT>. The append flag causes the file to be opened in append mode. A <filename> starting
with "|" is opened as a pipe to the <shell command> on platforms that support piping.
Psdir
The set psdir <directory> command controls the search path used by the postscript terminal to find
prologue.ps and character encoding files. You can use this mechanism to switch between different sets of
locally-customized prolog files. The search order is
1) The directory specified by ‘set psdir‘, if any
2) The directory specified by environmental variable GNUPLOT_PS_DIR
3) A built-in header or one from the default system directory
4) Directories set by ‘set loadpath‘
Raxis
The commands set raxis and unset raxis toggle whether the polar axis is drawn separately from grid lines
and the x axis. If the minimum of the current rrange is non-zero (and not autoscaled), then a white circle is
drawn at the center of the polar plot to indicate that the plot lines and axes do not reach 0. The axis line is
drawn using the same line type as the plot border. See polar (p. 143), rrange (p. 145), rtics (p. 145),
set grid (p. 116).
Rmargin
The command set rmargin sets the size of the right margin. Please see set margin (p. 126) for details.
gnuplot 4.7
145
Rrange
The set rrange command sets the range of the radial coordinate for a graph in polar mode. This has the
effect of setting both xrange and yrange as well. The resulting xrange and yrange are both [-(rmax-rmin) :
+(rmax-rmin)]. However if you later change the x or y range, for example by zooming, this does not change
rrange, so data points continue to be clipped against rrange. Autoscaling of rmin always results in rmin =
0.
Rtics
The set rtics command places tics along the polar axis. These will only be shown in polar plot mode. The
tics and labels are drawn to the right of the origin. The mirror keyword causes them to be drawn also to
the left of the origin. See polar (p. 143), and see set xtics (p. 162) for discussion of other keywords.
Samples
The sampling rate of functions, or for interpolating data, may be changed by the set samples command.
Syntax:
set samples <samples_1> {,<samples_2>}
show samples
By default, sampling is set to 100 points. A higher sampling rate will produce more accurate plots, but will
take longer. This parameter has no effect on data file plotting unless one of the interpolation/approximation
options is used. See plot smooth (p. 81) re 2D data and set cntrparam (p. 103) and set dgrid3d
(p. 109) re 3D data.
When a 2D graph is being done, only the value of <samples 1> is relevant.
When a surface plot is being done without the removal of hidden lines, the value of samples specifies the
number of samples that are to be evaluated for the isolines. Each iso-v line will have <sample 1> samples
and each iso-u line will have <sample 2> samples. If you only specify <samples 1>, <samples 2> will be
set to the same value as <samples 1>. See also set isosamples (p. 118).
Size
Syntax:
set size {{no}square | ratio <r> | noratio} {<xscale>,<yscale>}
show size
The <xscale> and <yscale> values are scale factors for the size of the plot, which includes the graph, labels,
and margins.
Important note:
In earlier versions of gnuplot, some terminal types used the values from
‘set size‘ to control also the size of the output canvas; others did not.
In version 4.4 almost all terminals now follow the following convention:
set term <terminal type> size <XX>, <YY> controls the size of the output file, or canvas. Please
see individual terminal documentation for allowed values of the size parameters. By default, the plot will fill
this canvas.
set size <XX>, <YY> scales the plot itself relative to the size of the canvas. Scale values less than 1 will
cause the plot to not fill the entire canvas. Scale values larger than 1 will cause only a portion of the plot
to fit on the canvas. Please be aware that setting scale values larger than 1 may cause problems on some
terminal types.
ratio causes gnuplot to try to create a graph with an aspect ratio of <r> (the ratio of the y-axis length to
the x-axis length) within the portion of the plot specified by <xscale> and <yscale>.
146
gnuplot 4.7
The meaning of a negative value for <r> is different. If <r>=-1, gnuplot tries to set the scales so that the
unit has the same length on both the x and y axes. This is equivalent to set view equal xy. See set view
equal (p. 157). If <r>=-2, the unit on y has twice the length of the unit on x, and so on.
The success of gnuplot in producing the requested aspect ratio depends on the terminal selected. The graph
area will be the largest rectangle of aspect ratio <r> that will fit into the specified portion of the output
(leaving adequate margins, of course).
set size square is a synonym for set size ratio 1.
Both noratio and nosquare return the graph to the default aspect ratio of the terminal, but do not return
<xscale> or <yscale> to their default values (1.0).
ratio and square have no effect on 3D plots, but do affect 3D projections created using set view map.
See also set view equal (p. 157), which forces the x and y axes of a 3D onto the same scale.
Examples:
To set the size so that the plot fills the available canvas:
set size 1,1
To make the graph half size and square use:
set size square 0.5,0.5
To make the graph twice as high as wide use:
set size ratio 2
Style
Default plotting styles are chosen with the set style data and set style function commands. See plot
with (p. 91) for information about how to override the default plotting style for individual functions and
data sets. See plotting styles (p. 43) for a complete list of styles.
Syntax:
set style function <style>
set style data <style>
show style function
show style data
Default styles for specific plotting elements may also be set.
Syntax:
set
set
set
set
style
style
style
style
arrow <n> <arrowstyle>
fill <fillstyle>
histogram <histogram style options>
line <n> <linestyle>
If gnuplot was built with the support of objects, then the following options are also available:
Syntax:
set style rectangle <object options> <linestyle> <fillstyle>
set style circle radius <size>
set style ellipse size <size> units {xy|xx|yy}
Set style arrow
Each terminal has a default set of arrow and point types, which can be seen by using the command test.
set style arrow defines a set of arrow types and widths and point types and sizes so that you can refer to
them later by an index instead of repeating all the information at each invocation.
Syntax:
gnuplot 4.7
147
set style arrow <index> default
set style arrow <index> {nohead | head | heads}
{size <length>,<angle>{,<backangle>}}
{filled | empty | nofilled}
{front | back}
{ {linestyle | ls <line_style>}
| {linetype | lt <line_type>}
{linewidth | lw <line_width} }
unset style arrow
show style arrow
<index> is an integer that identifies the arrowstyle.
If default is given all arrow style parameters are set to their default values.
If the linestyle <index> already exists, only the given parameters are changed while all others are preserved.
If not, all undefined values are set to the default values.
Specifying nohead produces arrows drawn without a head — a line segment. This gives you yet another
way to draw a line segment on the plot. By default, arrows have one head. Specifying heads draws arrow
heads on both ends of the line.
Head size can be controlled by size <length>,<angle> or size <length>,<angle>,<backangle>, where
<length> defines length of each branch of the arrow head and <angle> the angle (in degrees) they make
with the arrow. <Length> is in x-axis units; this can be changed by first, second, graph, screen, or
character before the <length>; see coordinates (p. 22) for details. <Backangle> only takes effect when
filled or empty is also used. Then, <backangle> is the angle (in degrees) the back branches make with the
arrow (in the same direction as <angle>). The fig terminal has a restricted backangle function. It supports
three different angles. There are two thresholds: Below 70 degrees, the arrow head gets an indented back
angle. Above 110 degrees, the arrow head has an acute back angle. Between these thresholds, the back line
is straight.
Specifying filled produces filled arrow heads (if heads are used). Filling is supported on filled-polygon
capable terminals, see help of pm3d (p. 135) for their list, otherwise the arrow heads are closed but not
filled. The same result (closed but not filled arrow head) is reached by specifying empty. Further, filling and
outline is obviously not supported on terminals drawing arrows by their own specific routines, like metafont,
metapost, latex or tgif.
The line style may be selected from a user-defined list of line styles (see set style line (p. 150)) or
may be defined here by providing values for <line type> (an index from the default list of styles) and/or
<line width> (which is a multiplier for the default width).
Note, however, that if a user-defined line style has been selected, its properties (type and width) cannot be
altered merely by issuing another set style arrow command with the appropriate index and lt or lw.
If front is given, the arrows are written on top of the graphed data. If back is given (the default), the arrow
is written underneath the graphed data. Using front will prevent a arrow from being obscured by dense
data.
Examples:
To draw an arrow without an arrow head and double width, use:
set style arrow 1 nohead lw 2
set arrow arrowstyle 1
See also set arrow (p. 97) for further examples.
Boxplot
The set style boxplot command allows you to change the layout of plots created using the boxplot plot
style.
Syntax:
set style boxplot {range <r> | fraction <f>}
148
gnuplot 4.7
{{no}outliers} {pointtype <p>}
{candlesticks | financebars}
{separation <x>}
{labels off | auto | x | x2}
{sorted | unsorted}
The box in the boxplot always spans the range of values from the first quartile to the third quartile of the
data points. The limit of the whiskers that extend from the box can be controlled in two different ways. By
default the whiskers extend from each end of the box for a range equal to 1.5 times the interquartile range
(i.e. the vertical height of the box proper). Each whisker is truncated back toward the median so that it
terminates at a y value belonging to some point in the data set. Since there may be no point whose value is
exactly 1.5 times the interquartile distance, the whisker may be shorter than its nominal range. This default
corresponds to
set style boxplot range 1.5
Alternatively, you can specify the fraction of the total number of points that the whiskers should span. In
this case the range is extended symmetrically from the median value until it encompasses the requested
fraction of the data set. Here again each whisker is constrained to end at a point in the data set. To span
95% of the points in the set
set style boxplot fraction 0.95
Any points that lie outside the range of the whiskers are considered outliers. By default these are drawn as
individual circles (pointtype 7). The option nooutliers disables this.
By default boxplots are drawn in a style similar to candlesticks, but you have the option of using instead a
style similar to finance bars.
If the using specification for a boxplot contains a fourth column, the values in that column will be interpreted
as the discrete leveles of a factor variable. In this case more than one boxplots may be drawn, as many as
the number of levels of the factor variable. These boxplots will be drawn next to each other, the distance
between them is 1.0 by default (in x-axis units). This distance can be changed by the option separation.
The labels option governs how and where these boxplots (each representing a part of the dataset) are
labeled. By default the value of the factor is put as a tick label on the horizontal axis – x or x2, depending
on which one is used for the plot itself. This setting corresponds to option labels auto. The labels can be
forced to use either of the x or x2 axes – options labels x and labels x2, respectively –, or they can be
turned off altogether with the option labels off.
By default the boxplots corresponding to different levels of the factor variable are not sorted; they will
be drawn in the same order the levels are encountered in the data file. This behavior corresponds to the
unsorted option. If the sorted option is active, the levels are first sorted alphabetically, and the boxplots
are drawn in the sorted order.
The separation, labels, sorted and unsorted option only have an effect if a fourth column is given the
plot specification.
See boxplot (p. 45), candlesticks (p. 46), financebars (p. 49).
Set style data
The set style data command changes the default plotting style for data plots.
Syntax:
set style data <plotting-style>
show style data
See plotting styles (p. 43) for the choices. If no choice is given, the choices are listed. show style data
shows the current default data plotting style.
Set style fill
The set style fill command is used to set the default style of the plot elements in plots with boxes,
histograms, candlesticks and filledcurves. This default can be superseded by fillstyles attached to individual
gnuplot 4.7
149
plots. See also ’set style rectangle’.
Syntax:
set style fill {empty
| {transparent} solid {<density>}
| {transparent} pattern {<n>}}
{border {lt} {lc <colorspec>} | noborder}
The default fillstyle is empty.
The solid option causes filling with a solid color, if the terminal supports that. The <density> parameter
specifies the intensity of the fill color. At a <density> of 0.0, the box is empty, at <density> of 1.0, the inner
area is of the same color as the current linetype. Some terminal types can vary the density continuously;
others implement only a few levels of partial fill. If no <density> parameter is given, it defaults to 1.
The pattern option causes filling to be done with a fill pattern supplied by the terminal driver. The kind
and number of available fill patterns depend on the terminal driver. If multiple datasets using filled boxes
are plotted, the pattern cycles through all available pattern types, starting from pattern <n>, much as the
line type cycles for multiple line plots.
The empty option causes filled boxes not to be filled. This is the default.
By default, border, the box is bounded by a solid line of the current linetype. border <colorspec> allows
you to change the color of the border. noborder specifies that no bounding lines are drawn.
Set style fill transparent Some terminals support the attribute transparent for filled areas. In the
case of transparent solid fill areas, the density parameter is interpreted as an alpha value; that is, density 0
is fully transparent, density 1 is fully opaque. In the case of transparent pattern fill, the background of the
pattern is either fully transparent or fully opaque.
Terminal
gif
jpeg
pdf
png
post
svg
win
wxt
x11
solid
no
yes
yes
TrueColor
no
yes
yes
yes
no
pattern
yes
no
yes
index
yes
no
yes
yes
yes
pm3d
no
yes
yes
yes
no
yes
yes
yes
no
Note that there may be additional limitations on the creation or viewing of graphs containing transparent
fill areas. For example, the png terminal can only use transparent fill if the "truecolor" option is set. Some
pdf viewers may not correctly display the fill areas even if they are correctly described in the pdf file.
Ghostscript/gv does not correctly display pattern-fill areas even though actual PostScript printers generally
have no problem.
Set style function
The set style function command changes the default plotting style for function plots (e.g. lines, points,
filledcurves). See plotting styles (p. 43).
Syntax:
set style function <plotting-style>
show style function
Set style increment
Note: This command has been deprecated. Instead please use the newer command set linetype, which
redefines the linetypes themselves rather than searching for a suitable temporary line style to substitute. See
set linetype (p. 124)
150
gnuplot 4.7
Syntax:
set style increment {default|userstyles}
show style increment
By default, successive plots within the same graph will use successive linetypes from the default set for
the current terminal type. However, choosing set style increment user allows you to step through the
user-defined line styles rather than through the default linetypes.
Example:
set
set
set
set
style
style
style
style
line 1 lw
line 2 lw
line 4 lw
increment
2 lc rgb "gold"
2 lc rgb "purple"
1 lc rgb "sea-green"
user
plot f1(x), f2(x), f3(x), f4(x)
should plot functions f1, f2, f4 in your 3 newly defined line styles. If a user-defined line style is not found
then the corresponding default linetype is used instead. E.g. in the example above, f3(x) will be plotted
using the default linetype 3.
Set style line
Each terminal has a default set of line and point types, which can be seen by using the command test. set
style line defines a set of line types and widths and point types and sizes so that you can refer to them
later by an index instead of repeating all the information at each invocation.
Syntax:
set style line <index> default
set style line <index> {{linetype | lt}
{{linecolor | lc}
{{linewidth | lw}
{{pointtype | pt}
{{pointsize | ps}
{{pointinterval |
{palette}
unset style line
show style line
<line_type> | <colorspec>}
<colorspec>}
<line_width>}
<point_type>}
<point_size>}
pi} <interval>}
default sets all line style parameters to those of the linetype with that same index.
If the linestyle <index> already exists, only the given parameters are changed while all others are preserved.
If not, all undefined values are set to the default values.
Line styles created by this mechanism do not replace the default linetype styles; both may be used. Line
styles are temporary. They are lost whenever you execute a reset command. To redefine the linetype itself,
please see set linetype (p. 124).
The line and point types default to the index value. The exact symbol that is drawn for that index value
may vary from one terminal type to another.
The line width and point size are multipliers for the current terminal’s default width and size (but note that
<point size> here is unaffected by the multiplier given by the commandset pointsize).
The pointinterval controls the spacing between points in a plot drawn with style linespoints. The default
is 0 (every point is drawn). For example, set style line N pi 3 defines a linestyle that uses pointtype N,
pointsize and linewidth equal to the current defaults for the terminal, and will draw every 3rd point in plots
using with linespoints. A negative value for the interval is treated the same as a positive value, except
that some terminals will try to interrupt the line where it passes through the point symbol.
Not all terminals support the linewidth and pointsize features; if not supported, the option will be ignored.
Terminal-independent colors may be assigned using either linecolor <colorspec> or linetype
<colorspec>, abbreviated lc or lt. This requires giving a RGB color triple, a known palette color name, a
gnuplot 4.7
151
fractional index into the current palette, or a constant value from the current mapping of the palette onto
cbrange. See colors (p. 33), colorspec (p. 34), set palette (p. 138), colornames (p. 105), cbrange
(p. 168).
set style line <n> linetype <lt> will set both a terminal-dependent dot/dash pattern and color. The
commandsset style line <n> linecolor <colorspec> or set style line <n> linetype <colorspec>
will set a new line color while leaving the existing dot-dash pattern unchanged.
In 3d mode (splot command), the special keyword palette is allowed as a shorthand for "linetype palette
z". The color value corresponds to the z-value (elevation) of the splot, and varies smoothly along a line or
surface.
Examples: Suppose that the default lines for indices 1, 2, and 3 are red, green, and blue, respectively, and
the default point shapes for the same indices are a square, a cross, and a triangle, respectively. Then
set style line 1 lt 2 lw 2 pt 3 ps 0.5
defines a new linestyle that is green and twice the default width and a new pointstyle that is a half-sized
triangle. The commands
set style function lines
plot f(x) lt 3, g(x) ls 1
will create a plot of f(x) using the default blue line and a plot of g(x) using the user-defined wide green line.
Similarly the commands
set style function linespoints
plot p(x) lt 1 pt 3, q(x) ls 1
will create a plot of p(x) using the default triangles connected by a red line and q(x) using small triangles
connected by a green line.
splot sin(sqrt(x*x+y*y))/sqrt(x*x+y*y) w l pal
creates a surface plot using smooth colors according to palette. Note, that this works only on some terminals.
See also set palette (p. 138), set pm3d (p. 135).
set style line 10 linetype 1 linecolor rgb "cyan"
will assign linestyle 10 to be a solid cyan line on any terminal that supports rgb colors.
Set style circle
Syntax:
set style circle {radius {graph|screen} <R>} {{no}wedge
This command sets the default radius used in plot style "with circles". It applies to data plots with only 2
columns of data (x,y) and to function plots. The default is "set style circle radius graph 0.02". Nowedge
disables drawing of the two radii that connect the ends of an arc to the center. The default is wedge. This
parameter has no effect on full circles.
Set style rectangle
Rectangles defined with the set object command can have individual styles. However, if the object is not
assigned a private style then it inherits a default that is taken from the set style rectangle command.
Syntax:
set style rectangle {front|back} {lw|linewidth <lw>}
{fillcolor <colorspec>} {fs <fillstyle>}
See colorspec (p. 34) and fillstyle (p. 148). fillcolor may be abbreviated as fc.
Examples:
set style rectangle back fc rgb "white" fs solid 1.0 border lt -1
set style rectangle fc linsestyle 3 fs pattern 2 noborder
The default values correspond to solid fill with the background color and a black border.
152
gnuplot 4.7
Set style ellipse
Syntax:
set style ellipse {units xx|xy|yy}
{size {graph|screen} <a>, {{graph|screen} <b>}}
{angle <angle>}
This command governs whether the diameters of ellipses are interpreted in the same units or not. Default is
xy, which means that the major diameter (first axis) of ellipses will be interpreted in the same units as the
x (or x2) axis, while the minor (second) diameter in those of the y (or y2) axis. In this mode the ratio of the
ellipse axes depends on the scales of the plot axes and aspect ratio of the plot. When set to xx or yy, both
axes of all ellipses will be interpreted in the same units. This means that the ratio of the axes of the plotted
ellipses will be correct even after rotation, but either their vertical or horizontal extent will not be correct.
This is a global setting that affects all ellipses, both those defined as objects and those generated with the
plot command, however, the value of units can also be redefined on a per-plot and per-object basis.
It is also possible to set a default size for ellipses with the size keyword. This default size applies to data
plots with only 2 columns of data (x,y) and to function plots. The two values are interpreted as the major
and minor diameters (as opposed to semi-major and semi-minor axes) of the ellipse.
The default is "set style ellipse size graph 0.05,0.03".
Last, but not least it is possible to set the default orientation with the angle keyword. The orientation,
which is defined as the angle between the major axis of the ellipse and the plot’s x axis, must be given in
degrees.
For defining ellipse objects, see set object ellipse (p. 132); for the 2D plot style, see ellipses (p. 47).
Surface
The command set surface controls the display of surfaces by splot.
Syntax:
set surface
unset surface
show surface
The surface is drawn with the style specified by with, or else the appropriate style, data or function.
unset surface will cause splot to not draw points or lines corresponding to any of the function or data file
points. If you want to turn off the surface for an individual function or data file while leaving the others
active, use the nosurface keyword in the splot command. Contours may still be drawn on the surface,
depending on the set contour option. The combination unset surface; set contour base is useful for
displaying contours on the grid base. See also set contour (p. 105).
Table
When table mode is enabled, plot and splot commands print out a multicolumn ASCII table of X Y {Z}
R values rather than creating an actual plot on the current terminal. The character R takes on one of
three values: "i" if the point is in the active range, "o" if it is out-of-range, or "u" if it is undefined. The
data format is determined by the format of the axis labels (see set format (p. 113)), and the columns
are separated by single spaces. This can be useful if you want to generate contours and then save them for
further use, perhaps for plotting with plot; see set contour (p. 105) for example. The same method can
be used to save interpolated data (see set samples (p. 145) and set dgrid3d (p. 109)).
Syntax:
set table {"outfile"}
plot <whatever>
unset table
Tabular output is written to the named file, if any, otherwise it is written to the current value of set output.
You must explicitly unset table in order to go back to normal plotting on the current terminal.
gnuplot 4.7
153
Terminal
gnuplot supports many different graphics devices. Use set terminal to tell gnuplot what kind of output
to generate. Use set output to redirect that output to a file or device.
Syntax:
set terminal {<terminal-type> | push | pop}
show terminal
If <terminal-type> is omitted, gnuplot will list the available terminal types. <terminal-type> may be
abbreviated.
If both set terminal and set output are used together, it is safest to give set terminal first, because
some terminals set a flag which is needed in some operating systems.
Some terminals have many additional options. The options used by a previous invocation set term <term>
<options> of a given <term> are remembered, thus subsequent set term <term> does not reset them.
This helps in printing, for instance, when switching among different terminals — previous options don’t have
to be repeated.
The command set term push remembers the current terminal including its settings while set term pop
restores it. This is equivalent to save term and load term, but without accessing the filesystem. Therefore
they can be used to achieve platform independent restoring of the terminal after printing, for instance. After
gnuplot’s startup, the default terminal or that from startup file is pushed automatically. Therefore portable
scripts can rely that set term pop restores the default terminal on a given platform unless another terminal
has been pushed explicitly.
For more information, see the complete list of terminals (p. 175).
Termoption
The set termoption command allows you to change the behaviour of the current terminal without requiring
a new set terminal command. Only one option can be changed per command, and only a small number of
options can be changed this way. Currently the only options accepted are
set
set
set
set
set
termoption
termoption
termoption
termoption
termoption
{no}enhanced
font "<fontname>{,<fontsize>}"
fontscale <scale>
{solid|dashed}
{linewidth <lw>}{lw <lw>}
Tics
Control of the major (labeled) tics on all axes at once is possible with the set tics command.
Fine control of the major (labeled) tics on all axes at once is possible with the set tics command. The tics
may be turned off with the unset tics command, and may be turned on (the default state) with set tics.
Similar commands (by preceding ’tics’ by the axis name) control the major tics on a single axis.
Syntax:
set tics {axis | border} {{no}mirror}
{in | out} {scale {default | <major> {,<minor>}}}
{{no}rotate {by <ang>}} {offset <offset> | nooffset}
{left | right | center | autojustify}
{ format "formatstring" } { font "name{,<size>}" }
{ textcolor <colorspec> }
set tics {front | back}
unset tics
show tics
The options can be applied to a single axis (x, y, z, x2, y2, cb), e.g.
154
gnuplot 4.7
set xtics rotate by -90
unset cbtics
Set tics front or back applies to all axes at once, but only for 2D plots (not splot). It controls whether the
tics are placed behind or in front of the plot elements, in the case that there is overlap.
axis or border tells gnuplot to put the tics (both the tics themselves and the accompanying labels) along
the axis or the border, respectively. If the axis is very close to the border, the axis option will move the tic
labels to outside the border in case the border is printed (see set border (p. 100)). The relevant margin
settings will usually be sized badly by the automatic layout algorithm in this case.
mirror tells gnuplot to put unlabeled tics at the same positions on the opposite border. nomirror does
what you think it does.
in and out change the tic marks to be drawn inwards or outwards.
With scale, the size of the tic marks can be adjusted. If <minor> is not specified, it is 0.5*<major>. The
default size 1.0 for major tics and 0.5 for minor tics is requested by scale default.
rotate asks gnuplot to rotate the text through 90 degrees, which will be done if the terminal driver in
use supports text rotation. norotate cancels this. rotate by <ang> asks for rotation by <ang> degrees,
supported by some terminal types.
The defaults are border mirror norotate for tics on the x and y axes, and border nomirror norotate
for tics on the x2 and y2 axes. For the z axis, the default is nomirror.
The <offset> is specified by either x,y or x,y,z, and may be preceded by first, second, graph, screen,
or character to select the coordinate system. <offset> is the offset of the tics texts from their default
positions, while the default coordinate system is character. See coordinates (p. 22) for details. nooffset
switches off the offset.
By default, tic labels are justified automatically depending on the axis and rotation angle to produce aesthetically pleasing results. If this is not desired, justification can be overridden with an explicit left, right
or center keyword. autojustify restores the default behavior.
set tics with no options restores to place tics inwards. Every other options are retained.
See also set xtics (p. 162) for more control of major (labeled) tic marks and set mxtics for control of
minor tic marks. These commands provide control at a axis by axis basis.
Ticslevel
Deprecated. See set xyplane (p. 165).
Ticscale
The set ticscale command is deprecated, use set tics scale instead.
Timestamp
The command set timestamp places the time and date of the plot in the left margin.
Syntax:
set timestamp {"<format>"} {top|bottom} {{no}rotate}
{offset <xoff>{,<yoff>}} {font "<fontspec>"}
unset timestamp
show timestamp
The format string allows you to choose the format used to write the date and time. Its default value is what
asctime() uses: "%a %b %d %H:%M:%S %Y" (weekday, month name, day of the month, hours, minutes,
seconds, four-digit year). With top or bottom you can place the timestamp at the top or bottom of the left
margin (default: bottom). rotate lets you write the timestamp vertically, if your terminal supports vertical
gnuplot 4.7
155
text. The constants <xoff> and <yoff> are offsets that let you adjust the position more finely. <font> is
used to specify the font with which the time is to be written.
The abbreviation time may be used in place of timestamp.
Example:
set timestamp "%d/%m/%y %H:%M" offset 80,-2 font "Helvetica"
See set timefmt (p. 155) for more information about time format strings.
Timefmt
This command applies to timeseries where data are composed of dates/times. It has no meaning unless the
command set xdata time is given also.
Syntax:
set timefmt "<format string>"
show timefmt
The string argument tells gnuplot how to read timedata from the datafile. The valid formats are:
Format
%d
%m
%y
%Y
%j
%H
%M
%s
%S
%b
%B
Time Series timedata Format Specifiers
Explanation
day of the month, 1–31
month of the year, 1–12
year, 0–99
year, 4-digit
day of the year, 1–365
hour, 0–24
minute, 0–60
seconds since the Unix epoch (1970-01-01 00:00 UTC)
second, integer 0–60 on output, (double) on input
three-character abbreviation of the name of the month
name of the month
Any character is allowed in the string, but must match exactly. \t (tab) is recognized. Backslash-octals
(\nnn) are converted to char. If there is no separating character between the time/date elements, then %d,
%m, %y, %H, %M and %S read two digits each. If a decimal point immediately follows the field read by
%S, the decimal and any following digits are interpreted as a fractional second. %Y reads four digits. %j
reads three digits. %b requires three characters, and %B requires as many as it needs.
Spaces are treated slightly differently. A space in the string stands for zero or more whitespace characters
in the file. That is, "%H %M" can be used to read "1220" and "12 20" as well as "12 20".
Each set of non-blank characters in the timedata counts as one column in the using n:n specification. Thus
11:11 25/12/76 21.0 consists of three columns. To avoid confusion, gnuplot requires that you provide a
complete using specification if your file contains timedata.
If the date format includes the day or month in words, the format string must exclude this text. But it can
still be printed with the "%a", "%A", "%b", or "%B" specifier. gnuplot will determine the proper month
and weekday from the numerical values. See set format (p. 113) for more details about these and other
options for printing time data.
When reading two-digit years with %y, values 69-99 refer to the 20th century, while values 00-68 refer to the
21st century. NB: This is in accordance with the UNIX98 spec, but conventions vary widely and two-digit
year values are inherently ambiguous.
See also set xdata (p. 158) and time/date (p. 42) for more information.
Example:
set timefmt "%d/%m/%Y\t%H:%M"
156
gnuplot 4.7
tells gnuplot to read date and time separated by tab. (But look closely at your data — what began as
a tab may have been converted to spaces somewhere along the line; the format string must match what is
actually in the file.) See also
time data demo.
Title
The set title command produces a plot title that is centered at the top of the plot. set title is a special
case of set label.
Syntax:
set title {"<title-text>"} {offset <offset>} {font "<font>{,<size>}"}
{{textcolor | tc} {<colorspec> | default}} {{no}enhanced}
show title
If <offset> is specified by either x,y or x,y,z the title is moved by the given offset. It may be preceded by
first, second, graph, screen, or character to select the coordinate system. See coordinates (p. 22) for
details. By default, the character coordinate system is used. For example, "set title offset 0,-1" will
change only the y offset of the title, moving the title down by roughly the height of one character. The size
of a character depends on both the font and the terminal.
<font> is used to specify the font with which the title is to be written; the units of the font <size> depend
upon which terminal is used.
textcolor <colorspec> changes the color of the text. <colorspec> can be a linetype, an rgb color, or a
palette mapping. See help for colorspec (p. 34) and palette (p. 138).
noenhanced requests that the title not be processed by the enhanced text mode parser, even if enhanced
text mode is currently active.
set title with no parameters clears the title.
See syntax (p. 41) for details about the processing of backslash sequences and the distinction between
single- and double-quotes.
Tmargin
The command set tmargin sets the size of the top margin. Please see set margin (p. 126) for details.
Trange
The set trange command sets the parametric range used to compute x and y values when in parametric or
polar modes. Please see set xrange (p. 160) for details.
Urange
The set urange and set vrange commands set the parametric ranges used to compute x, y, and z values
when in splot parametric mode. Please see set xrange (p. 160) for details.
Variables
The show variables command lists the current value of user-defined and internal variables. Gnuplot
internally defines variables whose names begin with GPVAL , MOUSE , FIT , and TERM .
Syntax:
show variables
# show variables that do not begin with GPVAL_
show variables all # show all variables including those beginning GPVAL_
show variables NAME # show only variables beginning with NAME
gnuplot 4.7
157
Version
The show version command lists the version of gnuplot being run, its last modification date, the copyright
holders, and email addresses for the FAQ, the gnuplot-info mailing list, and reporting bugs–in short, the
information listed on the screen when the program is invoked interactively.
Syntax:
show version {long}
When the long option is given, it also lists the operating system, the compilation options used when gnuplot
was installed, the location of the help file, and (again) the useful email addresses.
View
The set view command sets the viewing angle for splots. It controls how the 3D coordinates of the plot are
mapped into the 2D screen space. It provides controls for both rotation and scaling of the plotted data, but
supports orthographic projections only. It supports both 3D projection or orthogonal 2D projection into a
2D plot-like map.
Syntax:
set view <rot_x>{,{<rot_z>}{,{<scale>}{,<scale_z>}}}
set view map
set view {no}equal {xy|xyz}
show view
where <rot x> and <rot z> control the rotation angles (in degrees) in a virtual 3D coordinate system
aligned with the screen such that initially (that is, before the rotations are performed) the screen horizontal
axis is x, screen vertical axis is y, and the axis perpendicular to the screen is z. The first rotation applied is
<rot x> around the x axis. The second rotation applied is <rot z> around the new z axis.
Command set view map is used to represent the drawing as a map. It can be used for contour plots, or
for color pm3d maps. In the latter, take care that you properly use zrange and cbrange for input data
point filtering and color range scaling, respectively.
<rot x> is bounded to the [0:180] range with a default of 60 degrees, while <rot z> is bounded to the [0:360]
range with a default of 30 degrees. <scale> controls the scaling of the entire splot, while <scale z> scales
the z axis only. Both scales default to 1.0.
Examples:
set view 60, 30, 1, 1
set view ,,0.5
The first sets all the four default values. The second changes only scale, to 0.5.
Equal axes
The command set view equal xy forces the unit length of the x and y axes to be on the same scale, and
chooses that scale so that the plot will fit on the page. The command set view equal xyz additionally sets
the z axis scale to match the x and y axes; however there is no guarantee that the current z axis range will
fit within the plot boundary. By default all three axes are scaled independently to fill the available area.
See also set xyplane (p. 165).
Vrange
The set urange and set vrange commands set the parametric ranges used to compute x, y, and z values
when in splot parametric mode. Please see set xrange (p. 160) for details.
158
gnuplot 4.7
X2data
The set x2data command sets data on the x2 (top) axis to timeseries (dates/times). Please see set xdata
(p. 158).
X2dtics
The set x2dtics command changes tics on the x2 (top) axis to days of the week. Please see set xdtics
(p. 159) for details.
X2label
The set x2label command sets the label for the x2 (top) axis. Please see set xlabel (p. 159).
X2mtics
The set x2mtics command changes tics on the x2 (top) axis to months of the year. Please see set xmtics
(p. 160) for details.
X2range
The set x2range command sets the horizontal range that will be displayed on the x2 (top) axis. Please see
set xrange (p. 160) for details.
X2tics
The set x2tics command controls major (labeled) tics on the x2 (top) axis. Please see set xtics (p. 162)
for details.
X2zeroaxis
The set x2zeroaxis command draws a line at the origin of the x2 (top) axis (y2 = 0). For details, please
see set zeroaxis (p. 167).
Xdata
This command controls interpretation of data on the x axis. An analogous command acts on each of the
other axes.
Syntax:
set xdata {time | geographic}
show xdata
The same syntax applies to ydata, zdata, x2data, y2data and cbdata.
The time option signals that data represents a time/date in seconds. The current version of gnuplot stores
time to a millisecond precision.
The geographic option signals that data represents a geographical coordinate measured in degrees/minutes/seconds.
If no option is specified, the data interpretation reverts to normal.
gnuplot 4.7
159
Time
set xdata time indicates that the x coordinate is to be interpreted as a date or time to millisecond precision.
See set timefmt (p. 155) to tell gnuplot how to read date or time data from a file. The time/date is
converted to seconds from start of the century. There is currently only one timefmt, which implies that all
the time/date columns must conform to this format. Specification of ranges should be supplied as quoted
strings according to this format to avoid interpretation of the time/date as an expression.
By default the function ’strftime’ (type "man strftime" on unix to look it up) is used to label axis tickmarks.
gnuplot tries to figure out a reasonable format for this. You can customize the label format using set
format x. See time specifiers (p. 114) for a special set of time format specifiers. See also time/date
(p. 42) for more information.
Geographic
set xdata geographic indicates that the x coordinate is to be interpreted as a geographic coordinate
measured in degrees. Use set format x to establish how the coordinate appears as an axis tick label. The
format specifiers for geographic data are as follows:
%D
%<width.precision>d
%M
%<width.precision>m
%S
%<width.precision>s
%E
%N
=
=
=
=
=
=
=
=
integer degrees
floating point degrees
integer minutes
floating point minutes
integer seconds
floating point seconds
label with E/W instead of +/label with N/S instead of +/-
For example, the command set format x "%Ddeg %5.2mmin %E" will cause x coordinate -1.51 to be
labeled as " 1deg 30.60min W".
If no special format is provided, the coordinate will be reported as a decimal number of degrees.
Xdtics
The set xdtics commands converts the x-axis tic marks to days of the week where 0=Sun and 6=Sat.
Overflows are converted modulo 7 to dates. set noxdtics returns the labels to their default values. Similar
commands do the same things for the other axes.
Syntax:
set xdtics
unset xdtics
show xdtics
The same syntax applies to ydtics, zdtics, x2dtics, y2dtics and cbdtics.
See also the set format (p. 113) command.
Xlabel
The set xlabel command sets the x axis label. Similar commands set labels on the other axes.
Syntax:
set xlabel {"<label>"} {offset <offset>} {font "<font>{,<size>}"}
{textcolor <colorspec>} {{no}enhanced}
{rotate by <degrees> | rotate parallel | norotate}
show xlabel
The same syntax applies to x2label, ylabel, y2label, zlabel and cblabel.
160
gnuplot 4.7
If <offset> is specified by either x,y or x,y,z the label is moved by the given offset. It may be preceded by
first, second, graph, screen, or character to select the coordinate system. See coordinates (p. 22) for
details. By default, the character coordinate system is used. For example, "set xlabel offset -1,0" will
change only the x offset of the title, moving the label roughly one character width to the left. The size of a
character depends on both the font and the terminal.
<font> is used to specify the font in which the label is written; the units of the font <size> depend upon
which terminal is used.
noenhanced requests that the label text not be processed by the enhanced text mode parser, even if
enhanced text mode is currently active.
To clear a label, put no options on the command line, e.g., "set y2label".
The default positions of the axis labels are as follows:
xlabel: The x-axis label is centered below the bottom of the plot.
ylabel: The y-axis label is centered to the left of the plot, defaulting to either horizontal or vertical orientation
depending on the terminal type.
zlabel: The z-axis label is centered along the z axis and placed in the space above the grid level.
cblabel: The color box axis label is centered along the box and placed below or to the right according to
horizontal or vertical color box gradient.
y2label: The y2-axis label is placed to the right of the y2 axis. The position is terminal-dependent in the
same manner as is the y-axis label.
x2label: The x2-axis label is placed above the plot but below the title. It is also possible to create an x2-axis
label by using new-line characters to make a multi-line plot title, e.g.,
set title "This is the title\n\nThis is the x2label"
Note that double quotes must be used. The same font will be used for both lines, of course.
The orientation (rotation angle) of the x, x2, y and y2 axis labels in 2D plots can be changed by specifying
rotate by <degrees>. The orientation of the x and y axis labels in 3D plots defaults to horizontal but
can be changed to run parallel to the axis by specifying rotate parallel.
If you are not satisfied with the default position of an axis label, use set label instead–that command gives
you much more control over where text is placed.
Please see syntax (p. 41) for further information about backslash processing and the difference between
single- and double-quoted strings.
Xmtics
The set xmtics command converts the x-axis tic marks to months of the year where 1=Jan and 12=Dec.
Overflows are converted modulo 12 to months. The tics are returned to their default labels by unset xmtics.
Similar commands perform the same duties for the other axes.
Syntax:
set xmtics
unset xmtics
show xmtics
The same syntax applies to x2mtics, ymtics, y2mtics, zmtics and cbmtics.
See also the set format (p. 113) command.
Xrange
The set xrange command sets the horizontal range that will be displayed. A similar command exists for
each of the other axes, as well as for the polar radius r and the parametric variables t, u, and v.
Syntax:
gnuplot 4.7
161
set xrange { [{{<min>}:{<max>}}] {{no}reverse} {{no}writeback} }
| restore
show xrange
where <min> and <max> terms are constants, expressions or an asterisk to set autoscaling. See below for
full autoscaling syntax. If the data are time/date, you must give the range as a quoted string according to
the set timefmt format. Any value omitted will not be changed.
The same syntax applies to yrange, zrange, x2range, y2range, cbrange, rrange, trange, urange and
vrange.
The reverse option reverses the direction of an autoscaled axis. For example, if the data values range from
10 to 100, it will autoscale to the equivalent of set xrange [100:10]. The reverse flag has no effect if the axis
is not autoscaled. NB: This is a change introduced in version 4.7.
Autoscaling: If <min> (the same applies for correspondingly to <max>) is an asterisk "*" autoscaling is
turned on. The range in which autoscaling is being performed may be limited by a lower bound <lb> or an
upper bound <ub> or both. The syntax is
{ <lb> < } * { < <ub> }
For example,
0 < * < 200
sets <lb> = 0 and <ub> = 200. With such a setting <min> would be autoscaled, but its final value will
be between 0 and 200 (both inclusive despite the ’<’ sign). If no lower or upper bound is specified, the ’<’
to also be ommited. If <ub> is lower than <lb> the constraints will be turned off and full autoscaling will
happen. This feature is useful to plot measured data with autoscaling but providing a limit on the range, to
clip outliers, or to guarantee a minimum range that will be displayed even if the data would not need such
a big range.
The writeback option essentially saves the range found by autoscale in the buffers that would be filled
by set xrange. This is useful if you wish to plot several functions together but have the range determined
by only some of them. The writeback operation is performed during the plot execution, so it must be
specified before that command. To restore, the last saved horizontal range use set xrange restore. For
example,
set xrange [-10:10]
set yrange [] writeback
plot sin(x)
set yrange restore
replot x/2
results in a yrange of [-1:1] as found only from the range of sin(x); the [-5:5] range of x/2 is ignored. Executing
show yrange after each command in the above example should help you understand what is going on.
In 2D, xrange and yrange determine the extent of the axes, trange determines the range of the parametric
variable in parametric mode or the range of the angle in polar mode. Similarly in parametric 3D, xrange,
yrange, and zrange govern the axes and urange and vrange govern the parametric variables.
In polar mode, rrange determines the radial range plotted. <rmin> acts as an additive constant to the
radius, whereas <rmax> acts as a clip to the radius — no point with radius greater than <rmax> will be
plotted. xrange and yrange are affected — the ranges can be set as if the graph was of r(t)-rmin, with
rmin added to all the labels.
Any range may be partially or totally autoscaled, although it may not make sense to autoscale a parametric
variable unless it is plotted with data.
Ranges may also be specified on the plot command line. A range given on the plot line will be used for
that single plot command; a range given by a set command will be used for all subsequent plots that do
not specify their own ranges. The same holds true for splot.
Examples:
To set the xrange to the default:
set xrange [-10:10]
162
gnuplot 4.7
To set the yrange to increase downwards:
set yrange [10:-10]
To change zmax to 10 without affecting zmin (which may still be autoscaled):
set zrange [:10]
To autoscale xmin while leaving xmax unchanged:
set xrange [*:]
To autoscale xmin but keeping xmin positive:
set xrange [0<*:]
To autoscale x but keep minimum range of 10 to 50 (actual might be larger):
set xrange [*<10:50<*]
Autoscaling but limit maximum xrange to -1000 to 1000, i.e. autoscaling within [-1000:1000]
set xrange [-1000<*:*<1000]
Make sure xmin is somewhere between -200 and 100:
set xrange [-200<*<100:]
Xtics
Fine control of the major (labeled) tics on the x axis is possible with the set xtics command. The tics may
be turned off with the unset xtics command, and may be turned on (the default state) with set xtics.
Similar commands control the major tics on the y, z, x2 and y2 axes.
Syntax:
set xtics {axis | border} {{no}mirror}
{in | out} {scale {default | <major> {,<minor>}}}
{{no}rotate {by <ang>}} {offset <offset> | nooffset}
{left | right | center | autojustify}
{add}
{ autofreq
| <incr>
| <start>, <incr> {,<end>}
| ({"<label>"} <pos> {<level>} {,{"<label>"}...) }
{ format "formatstring" } { font "name{,<size>}" }
{ rangelimited }
{ textcolor <colorspec> }
unset xtics
show xtics
The same syntax applies to ytics, ztics, x2tics, y2tics and cbtics.
axis or border tells gnuplot to put the tics (both the tics themselves and the accompanying labels) along
the axis or the border, respectively. If the axis is very close to the border, the axis option will move the
tic labels to outside the border. The relevant margin settings will usually be sized badly by the automatic
layout algorithm in this case.
mirror tells gnuplot to put unlabeled tics at the same positions on the opposite border. nomirror does
what you think it does.
in and out change the tic marks to be drawn inwards or outwards.
With scale, the size of the tic marks can be adjusted. If <minor> is not specified, it is 0.5*<major>. The
default size 1.0 for major tics and 0.5 for minor tics is requested by scale default.
rotate asks gnuplot to rotate the text through 90 degrees, which will be done if the terminal driver in
use supports text rotation. norotate cancels this. rotate by <ang> asks for rotation by <ang> degrees,
supported by some terminal types.
gnuplot 4.7
163
The defaults are border mirror norotate for tics on the x and y axes, and border nomirror norotate
for tics on the x2 and y2 axes. For the z axis, the {axis | border} option is not available and the default
is nomirror. If you do want to mirror the z-axis tics, you might want to create a bit more room for them
with set border.
The <offset> is specified by either x,y or x,y,z, and may be preceded by first, second, graph, screen,
or character to select the coordinate system. <offset> is the offset of the tics texts from their default
positions, while the default coordinate system is character. See coordinates (p. 22) for details. nooffset
switches off the offset.
Example:
Move xtics more closely to the plot.
set xtics offset 0,graph 0.05
By default, tic labels are justified automatically depending on the axis and rotation angle to produce aesthetically pleasing results. If this is not desired, justification can be overridden with an explicit left, right
or center keyword. autojustify restores the default behavior.
set xtics with no options restores the default border or axis if xtics are being displayed; otherwise it has no
effect. Any previously specified tic frequency or position {and labels} are retained.
Positions of the tics are calculated automatically by default or if the autofreq option is given; otherwise
they may be specified in either of two forms:
The implicit <start>, <incr>, <end> form specifies that a series of tics will be plotted on the axis between
the values <start> and <end> with an increment of <incr>. If <end> is not given, it is assumed to be
infinity. The increment may be negative. If neither <start> nor <end> is given, <start> is assumed to be
negative infinity, <end> is assumed to be positive infinity, and the tics will be drawn at integral multiples
of <incr>. If the axis is logarithmic, the increment will be used as a multiplicative factor.
If you specify to a negative <start> or <incr> after a numerical value (e.g., rotate by <angle> or offset
<offset>), the parser fails because it subtracts <start> or <incr> from that value. As a workaround,
specify 0-<start> resp. 0-<incr> in that case.
Example:
set xtics border offset 0,0.5 -5,1,5
Fails with ’invalid expression’ at the last comma.
set xtics border offset 0,0.5 0-5,1,5
or
set xtics offset 0,0.5 border -5,1,5
Sets tics at the border, tics text with an offset of 0,0.5 characters, and sets the start, increment, and end to
-5, 1, and 5, as requested.
The set grid options ’front’, ’back’ and ’layerdefault’ affect the drawing order of the xtics, too.
Examples:
Make tics at 0, 0.5, 1, 1.5, ..., 9.5, 10.
set xtics 0,.5,10
Make tics at ..., -10, -5, 0, 5, 10, ...
set xtics 5
Make tics at 1, 100, 1e4, 1e6, 1e8.
set logscale x; set xtics 1,100,1e8
The explicit ("<label>" <pos> <level>, ...) form allows arbitrary tic positions or non-numeric tic labels.
In this form, the tics do not need to be listed in numerical order. Each tic has a position, optionally with a
label. Note that the label is a string enclosed by quotes. It may be a constant string, such as "hello", may
contain formatting information for converting the position into its label, such as "%3f clients", or may be
164
gnuplot 4.7
empty, "". See set format (p. 113) for more information. If no string is given, the default label (numerical)
is used.
An explicit tic mark has a third parameter, the "level". The default is level 0, a major tic. A level of 1
generates a minor tic. If the level is specified, then the label must also be supplied.
Examples:
set
set
set
set
xtics
xtics
ytics
ytics
("low" 0, "medium" 50, "high" 100)
(1,2,4,8,16,32,64,128,256,512,1024)
("bottom" 0, "" 10, "top" 20)
("bottom" 0, "" 10 1, "top" 20)
In the second example, all tics are labeled. In the third, only the end tics are labeled. In the fourth, the
unlabeled tic is a minor tic.
Normally if explicit tics are given, they are used instead of auto-generated tics. Conversely if you specify
set xtics auto or the like it will erase any previously specified explicit tics. You can mix explicit and autogenerated tics by using the keyword add, which must appear before the tic style being added.
Example:
set xtics 0,.5,10
set xtics add ("Pi" 3.14159)
This will automatically generate tic marks every 0.5 along x, but will also add an explicit labeled tic mark
at pi.
However they are specified, tics will only be plotted when in range.
Format (or omission) of the tic labels is controlled by set format, unless the explicit text of a label is
included in the set xtics ("<label>") form.
Minor (unlabeled) tics can be added automatically by the set mxtics command, or at explicit positions by
the set xtics ("" <pos> 1, ...) form.
Xtics time data
In case of timeseries data, axis tic position values must be given as quoted dates or times according to the
format timefmt. If the <start>, <incr>, <end> form is used, <start> and <end> must be given according
to timefmt, but <incr> must be in seconds. Times will be written out according to the format given on
set format, however.
Examples:
set
set
set
set
set
xdata time
timefmt "%d/%m"
xtics format "%b %d"
xrange ["01/12":"06/12"]
xtics "01/12", 172800, "05/12"
set
set
set
set
set
xdata time
timefmt "%d/%m"
xtics format "%b %d"
xrange ["01/12":"06/12"]
xtics ("01/12", "" "03/12", "05/12")
Both of these will produce tics "Dec 1", "Dec 3", and "Dec 5", but in the second example the tic at "Dec
3" will be unlabeled.
Xtics rangelimited
This option limits both the auto-generated axis tic labels and the corresponding plot border to the range of
values actually present in the data that has been plotted. Note that this is independent of the current range
gnuplot 4.7
165
limits for the plot. For example, suppose that the data in "file.dat" all lies in the range 2 < y < 4. Then
the following commands will create a plot for which the left-hand plot border (y axis) is drawn for only this
portion of the total y range, and only the axis tics in this region are generated. I.e., the plot will be scaled
to the full range on y, but there will be a gap between 0 and 2 on the left border and another gap between
4 and 10. This style is sometimes referred to as a range-frame graph.
set border 3
set yrange [0:10]
set ytics nomirror rangelimited
plot "file.dat"
Xyplane
The set xyplane command adjusts the position at which the xy plane is drawn in a 3D plot. The synonym
"set ticslevel" is accepted for backwards compatibility.
Syntax:
set xyplane at <zvalue>
set xyplane relative <frac>
set ticslevel <frac>
# equivalent to set xyplane relative
show xyplane
The form set xyplane relative <frac> places the xy plane below the range in Z, where the distance from
the xy plane to Zmin is given as a fraction of the total range in z. The default value is 0.5. Negative values
are permitted, but tic labels on the three axes may overlap. The older, deprecated, form set ticslevel is
retained for backwards compatibility.
To place the xy-plane at a position ’pos’ on the z-axis, ticslevel may be set equal to (pos - zmin) / (zmin zmax). However, this position will change if the z range is changed.
The alternative form set xyplane at <zvalue> fixes the placement of the xy plane at a specific Z value
regardless of the current z range. Thus to force the x, y, and z axes to meet at a common origin one would
specify set xyplane at 0.
See also set view (p. 157), and set zeroaxis (p. 167).
Xzeroaxis
The set xzeroaxis command draws a line at y = 0. For details, please see set zeroaxis (p. 167).
Y2data
The set y2data command sets y2 (right-hand) axis data to timeseries (dates/times). Please see set xdata
(p. 158).
Y2dtics
The set y2dtics command changes tics on the y2 (right-hand) axis to days of the week. Please see set
xdtics (p. 159) for details.
Y2label
The set y2label command sets the label for the y2 (right-hand) axis. Please see set xlabel (p. 159).
Y2mtics
The set y2mtics command changes tics on the y2 (right-hand) axis to months of the year. Please see set
xmtics (p. 160) for details.
166
gnuplot 4.7
Y2range
The set y2range command sets the vertical range that will be displayed on the y2 (right-hand) axis. Please
see set xrange (p. 160) for details.
Y2tics
The set y2tics command controls major (labeled) tics on the y2 (right-hand) axis. Please see set xtics
(p. 162) for details.
Y2zeroaxis
The set y2zeroaxis command draws a line at the origin of the y2 (right-hand) axis (x2 = 0). For details,
please see set zeroaxis (p. 167).
Ydata
The set ydata commands sets y-axis data to timeseries (dates/times). Please see set xdata (p. 158).
Ydtics
The set ydtics command changes tics on the y axis to days of the week. Please see set xdtics (p. 159)
for details.
Ylabel
This command sets the label for the y axis. Please see set xlabel (p. 159).
Ymtics
The set ymtics command changes tics on the y axis to months of the year. Please see set xmtics (p. 160)
for details.
Yrange
The set yrange command sets the vertical range that will be displayed on the y axis. Please see set xrange
(p. 160) for details.
Ytics
The set ytics command controls major (labeled) tics on the y axis. Please see set xtics (p. 162) for
details.
Yzeroaxis
The set yzeroaxis command draws a line at x = 0. For details, please see set zeroaxis (p. 167).
Zdata
The set zdata command sets zaxis data to timeseries (dates/times). Please see set xdata (p. 158).
gnuplot 4.7
167
Zdtics
The set zdtics command changes tics on the z axis to days of the week. Please see set xdtics (p. 159)
for details.
Zzeroaxis
The set zzeroaxis command draws a line through (x=0,y=0). This has no effect on 2D plots, including
splot with set view map. For details, please see set zeroaxis (p. 167) and set xyplane (p. 165).
Cbdata
Set color box axis data to timeseries (dates/times). Please see set xdata (p. 158).
Cbdtics
The set cbdtics command changes tics on the color box axis to days of the week. Please see set xdtics
(p. 159) for details.
Zero
The zero value is the default threshold for values approaching 0.0.
Syntax:
set zero <expression>
show zero
gnuplot will not plot a point if its imaginary part is greater in magnitude than the zero threshold. This
threshold is also used in various other parts of gnuplot as a (crude) numerical-error threshold. The default
zero value is 1e-8. zero values larger than 1e-3 (the reciprocal of the number of pixels in a typical bitmap
display) should probably be avoided, but it is not unreasonable to set zero to 0.0.
Zeroaxis
The x axis may be drawn by set xzeroaxis and removed by unset xzeroaxis. Similar commands behave
similarly for the y, x2, y2, and z axes.
Syntax:
set {x|x2|y|y2|z}zeroaxis { {linestyle | ls <line_style>}
| { linetype | lt <line_type>}
{ linewidth | lw <line_width>}}
unset {x|x2|y|y2|z}zeroaxis
show {x|y|z}zeroaxis
By default, these options are off. The selected zero axis is drawn with a line of type <line type> and width
<line width> (if supported by the terminal driver currently in use), or a user-defined style <line style>.
If no linetype is specified, any zero axes selected will be drawn using the axis linetype (linetype 0).
set zeroaxis is equivalent to set xzeroaxis; set yzeroaxis. Note that the z-axis must be set separately
using set zzeroaxis.
Examples:
To simply have the y=0 axis drawn visibly:
set xzeroaxis
If you want a thick line in a different color or pattern, instead:
set xzeroaxis linetype 3 linewidth 2.5
168
gnuplot 4.7
Zlabel
This command sets the label for the z axis. Please see set xlabel (p. 159).
Zmtics
The set zmtics command changes tics on the z axis to months of the year. Please see set xmtics (p. 160)
for details.
Zrange
The set zrange command sets the range that will be displayed on the z axis. The zrange is used only by
splot and is ignored by plot. Please see set xrange (p. 160) for details.
Ztics
The set ztics command controls major (labeled) tics on the z axis. Please see set xtics (p. 162) for details.
Cblabel
This command sets the label for the color box axis. Please see set xlabel (p. 159).
Cbmtics
The set cbmtics command changes tics on the color box axis to months of the year. Please see set xmtics
(p. 160) for details.
Cbrange
The set cbrange command sets the range of values which are colored using the current palette by styles
with pm3d, with image and with palette. Values outside of the color range use color of the nearest
extreme.
If the cb-axis is autoscaled in splot, then the colorbox range is taken from zrange. Points drawn in splot
... pm3d|palette can be filtered by using different zrange and cbrange.
Please see set xrange (p. 160) for details on set cbrange (p. 168) syntax. See also set palette (p. 138)
and set colorbox (p. 105).
Cbtics
The set cbtics command controls major (labeled) tics on the color box axis. Please see set xtics (p. 162)
for details.
Shell
The shell command spawns an interactive shell. To return to gnuplot, type logout if using VMS, exit or
the END-OF-FILE character if using Unix, or exit if using MS-DOS or OS/2.
There are two ways of spawning a shell command: using system command or via ! ($ if using VMS).
The former command takes a string as a parameter and thus it can be used anywhere among other gnuplot
commands, while the latter syntax requires to be the only command on the line. Control will return
immediately to gnuplot after this command is executed. For example, in MS-DOS or OS/2,
! dir
gnuplot 4.7
169
or
system "dir"
prints a directory listing and then returns to gnuplot.
Other examples of the former syntax:
system "date"; set time; plot "a.dat"
print=1; if (print) replot; set out; system "lpr x.ps"
Splot
splot is the command for drawing 3D plots (well, actually projections on a 2D surface, but you knew that).
It can create a plot from functions or data read from files in a manner very similar to the plot command.
splot provides only a single x, y, and z axis; there is no equivalent to the x2 and y2 secondary axes provided
by plot.
See the plot (p. 73) command for many options available in both 2D and 3D plots.
Syntax:
splot {<ranges>}
{<iteration>}
<function> | "<datafile>" {datafile-modifiers}}
{<title-spec>} {with <style>}
{, {definitions{,}} <function> ...}
where either a <function> or the name of a data file enclosed in quotes is supplied. The function can be a
mathematical expression, or a triple of mathematical expressions in parametric mode.
By default splot draws the xy plane completely below the plotted data. The offset between the lowest ztic
and the xy plane can be changed by set xyplane. The orientation of a splot projection is controlled by
set view. See set view (p. 157) and set xyplane (p. 165) for more information.
The syntax for setting ranges on the splot command is the same as for plot. In non-parametric mode, the
order in which ranges must be given is xrange, yrange, and zrange. In parametric mode, the order is
urange, vrange, xrange, yrange, and zrange.
The title option is the same as in plot. The operation of with is also the same as in plot, except that
the plotting styles available to splot are limited to lines, points, linespoints, dots, and impulses; the
error-bar capabilities of plot are not available for splot.
The datafile options have more differences.
See also show plot (p. 134).
Data-file
Splot, like plot, can display from a file.
Syntax:
splot ’<file_name>’ {binary <binary list>}
{{nonuniform} matrix}
{index <index list>}
{every <every list>}
{using <using list>}
The special filenames "" and "-" are permitted, as in plot. See special-filenames (p. 82).
In brief, binary and matrix indicate that the data are in a special form, index selects which data sets in
a multi-data-set file are to be plotted, every specifies which datalines (subsets) within a single data set are
to be plotted, and using determines how the columns within a single record are to be interpreted.
170
gnuplot 4.7
The options index and every behave the same way as with plot; using does so also, except that the using
list must provide three entries instead of two.
The plot options thru and smooth are not available for splot, but cntrparam and dgrid3d provide
limited smoothing capabilities.
Data file organization is essentially the same as for plot, except that each point is an (x,y,z) triple. If only
a single value is provided, it will be used for z, the datablock number will be used for y, and the index of
the data point in the datablock will be used for x. If two or four values are provided, gnuplot uses the last
value for calculating the color in pm3d plots. Three values are interpreted as an (x,y,z) triple. Additional
values are generally used as errors, which can be used by fit.
Single blank records separate datablocks in a splot datafile; splot treats datablocks as the equivalent of
function y-isolines. No line will join points separated by a blank record. If all datablocks contain the same
number of points, gnuplot will draw cross-isolines between datablocks, connecting corresponding points.
This is termed "grid data", and is required for drawing a surface, for contouring (set contour) and hiddenline removal (set hidden3d). See also splot grid data (p. 172).
It is no longer necessary to specify parametric mode for three-column splots.
Matrix
Gnuplot can interpret matrix input in two different ways. The first of these assumes a uniform grid of x and
y coordinates, and assigns each value in the input matrix to one element of this uniform grid. This is the
default for ascii data input, but not for binary input. Example commands for plotting uniform matrix data:
splot ’file’ matrix using 1:2:3
splot ’file’ binary general using 1:2:3
# ascii input
# binary input
In a uniform grid matrix the z-values are read in a row at a time, i. e.,
z11 z12 z13 z14 ...
z21 z22 z23 z24 ...
z31 z32 z33 z34 ...
and so forth.
For ascii input, a blank line or comment line ends the matrix, and starts a new surface mesh. You can
select among the meshes inside a file by the index option to the splot command, as usual. The second
interpretation assumes a non-uniform grid with explicit x and y coordinates. The first row of input data
contains the y coordinates; the first column of input data contains the x coordinates. For binary input data,
the first element of the first row must contain the number of data columns. (This number is ignored for ascii
input). Both the coordinates and the data values in a binary input are treated as single precision floats.
Example commands for plotting non-uniform matrix data:
splot ’file’ nonuniform matrix using 1:2:3
splot ’file’ binary matrix using 1:2:3
# ascii input
# binary input
Thus the data organization for non-uniform matrix input is
<N+1> <y0>
<y1>
<y2> ... <yN>
<x0> <z0,0> <z0,1> <z0,2> ... <z0,N>
<x1> <z1,0> <z1,1> <z1,2> ... <z1,N>
:
:
:
:
...
:
which is then converted into triplets:
<x0>
<x0>
<x0>
:
<x0>
<y0>
<y1>
<y2>
:
<yN>
<z0,0>
<z0,1>
<z0,2>
:
<z0,N>
gnuplot 4.7
171
<x1> <y0> <z1,0>
<x1> <y1> <z1,1>
:
:
:
These triplets are then converted into gnuplot iso-curves and then gnuplot proceeds in the usual manner
to do the rest of the plotting.
A collection of matrix and vector manipulation routines (in C) is provided in binary.c. The routine to write
binary data is
int fwrite_matrix(file,m,nrl,nrl,ncl,nch,row_title,column_title)
An example of using these routines is provided in the file bf test.c, which generates binary files for the demo
file demo/binary.dem.
Usage in plot:
plot ‘a.dat‘ matrix
plot ‘a.dat‘ matrix using 1:3
plot ’a.gpbin’ {matrix} binary using 1:3
will plot rows of the matrix, while using 2:3 will plot matrix columns, and using 1:2 the point coordinates
(rather useless). Applying the every option you can specify explicit rows and columns.
Example – rescale axes of a matrix in an ascii file:
splot ‘a.dat‘ matrix using (1+$1):(1+$2*10):3
Example – plot the 3rd row of a matrix in an ascii file:
plot ’a.dat’ matrix using 1:3 every 1:999:1:2
(rows are enumerated from 0, thus 2 instead of 3).
Gnuplot can read matrix binary files by use of the option binary appearing without keyword qualifications
unique to general binary, i.e., array, record, format, or filetype. Other general binary keywords for
translation should also apply to matrix binary. (See binary general (p. 74) for more details.)
Example datafile
A simple example of plotting a 3D data file is
splot ’datafile.dat’
where the file "datafile.dat" might contain:
# The valley of the Gnu.
0 0 10
0 1 10
0 2 10
1 0 10
1 1 5
1 2 10
2 0 10
2 1 1
2 2 10
3 0 10
3 1 0
3 2 10
172
gnuplot 4.7
Note that "datafile.dat" defines a 4 by 3 grid ( 4 rows of 3 points each ). Rows (datablocks) are separated
by blank records.
Note also that the x value is held constant within each dataline. If you instead keep y constant, and plot
with hidden-line removal enabled, you will find that the surface is drawn ’inside-out’.
Actually for grid data it is not necessary to keep the x values constant within a datablock, nor is it necessary
to keep the same sequence of y values. gnuplot requires only that the number of points be the same
for each datablock. However since the surface mesh, from which contours are derived, connects sequentially
corresponding points, the effect of an irregular grid on a surface plot is unpredictable and should be examined
on a case-by-case basis.
Grid data
The 3D routines are designed for points in a grid format, with one sample, datapoint, at each mesh intersection; the datapoints may originate from either evaluating a function, see set isosamples (p. 118), or
reading a datafile, see splot datafile (p. 169). The term "isoline" is applied to the mesh lines for both
functions and data. Note that the mesh need not be rectangular in x and y, as it may be parameterized in
u and v, see set isosamples (p. 118).
However, gnuplot does not require that format. In the case of functions, ’samples’ need not be equal to
’isosamples’, i.e., not every x-isoline sample need intersect a y-isoline. In the case of data files, if there
are an equal number of scattered data points in each datablock, then "isolines" will connect the points
in a datablock, and "cross-isolines" will connect the corresponding points in each datablock to generate a
"surface". In either case, contour and hidden3d modes may give different plots than if the points were in
the intended format. Scattered data can be converted to a {different} grid format with set dgrid3d.
The contour code tests for z intensity along a line between a point on a y-isoline and the corresponding point
in the next y-isoline. Thus a splot contour of a surface with samples on the x-isolines that do not coincide
with a y-isoline intersection will ignore such samples. Try:
set xrange [-pi/2:pi/2]; set yrange [-pi/2:pi/2]
set style function lp
set contour
set isosamples 10,10; set samples 10,10;
splot cos(x)*cos(y)
set samples 4,10; replot
set samples 10,4; replot
Splot surfaces
splot can display a surface as a collection of points, or by connecting those points. As with plot, the points
may be read from a data file or result from evaluation of a function at specified intervals, see set isosamples
(p. 118). The surface may be approximated by connecting the points with straight line segments, see set
surface (p. 152), in which case the surface can be made opaque with set hidden3d. The orientation from
which the 3d surface is viewed can be changed with set view.
Additionally, for points in a grid format, splot can interpolate points having a common amplitude (see set
contour (p. 105)) and can then connect those new points to display contour lines, either directly with
straight-line segments or smoothed lines (see set cntrparam (p. 103)). Functions are already evaluated
in a grid format, determined by set isosamples and set samples, while file data must either be in a grid
format, as described in data-file, or be used to generate a grid (see set dgrid3d (p. 109)).
Contour lines may be displayed either on the surface or projected onto the base. The base projections of
the contour lines may be written to a file, and then read with plot, to take advantage of plot’s additional
formatting capabilities.
gnuplot 4.7
173
Stats (Statistical Summary)
Syntax:
stats ’filename’ [using N[:M]] [name ’prefix’] [[no]output]]
This command prepares a statistical summary of the data in one or two columns of a file. The using specifier
is interpreted in the same way as for plot commands. See plot (p. 73) for details on the index (p. 80),
every (p. 79), and using (p. 84) directives. Data points are filtered against both xrange and yrange
before analysis. See set xrange (p. 160). The summary is printed to the screen by default. Output can
be redirected to a file by prior use of the command set print, or suppressed altogether using the nooutput
option.
In addition to printed output, the program stores the individual statistics into three sets of variables. The
first set of variables reports how the data is laid out in the file:
STATS_records
# total number of in-range data records
STATS_outofrange
# number of records filtered out by range limits
STATS_invalid
# number of invalid/incomplete/missing records
STATS_blank
# number of blank lines in the file
STATS_blocks
# number of indexable data blocks in the file
The second set reports properties of the in-range data from a single column. If the corresponding axis is
autoscaled (x-axis for the 1st column, y-axis for the optional second column) then no range limits are applied.
If two columns are being analysed in a single stats command, the the suffix " x" or " y" is appended to
each variable name. I.e. STATS min x is the minimum value found in the first column, while STATS min y
is the minimum value found in the second column.
STATS_min
# minimum value of in-range data points
STATS_max
# maximum value of in-range data points
STATS_index_min
# index i for which data[i] == STATS_min
STATS_index_max
# index i for which data[i] == STATS_max
STATS_lo_quartile
# value of the lower (1st) quartile boundary
STATS_median
# median value
STATS_up_quartile
# value of the upper (3rd) quartile boundary
STATS_mean
# mean value of in-range data points
STATS_stddev
# standard deviation of the in-range data points
STATS_sum
# sum
STATS_sumsq
# sum of squares
The third set of variables is only relevant to analysis of two data columns.
STATS_correlation
# correlation coefficient between x and y values
STATS_slope
# A corresponding to a linear fit y = Ax + B
STATS_intercept
# B corresponding to a linear fit y = Ax + B
STATS_sumxy
# sum of x*y
STATS_pos_min_y
# x coordinate of a point with minimum y value
STATS_pos_max_y
# x coordinate of a point with maximum y value
It may be convenient to track the statistics from more than one file at the same time. The name option
causes the default prefix "STATS" to be replaced by a user-specified string. For example, the mean value of
column 2 data from two different files could be compared by
stats "file1.dat" using 2 name "A"
stats "file2.dat" using 2 name "B"
if (A_mean < B_mean) {...}
The index reported in STATS index xxx corresponds to the value of pseudo-column 0 ($0) in plot commands.
I.e. the first point has index 0, the last point has index N-1.
Data values are sorted to find the median and quartile boundaries. If the total number of points N is odd,
then the median value is taken as the value of data point (N+1)/2. If N is even, then the median is reported
as the mean value of points N/2 and (N+2)/2. Equivalent treatment is used for the quartile boundaries.
174
gnuplot 4.7
For an example of using the stats command to help annotate a subsequent plot, see
stats.dem.
The current implementation does not allow analysis if either the X or Y axis is set to log-scaling. This
restriction may be removed in a later version.
System
system "command" executes "command" using the standard shell. See shell (p. 168). If called as
a function, system("command") returns the resulting character stream from stdout as a string. One
optional trailing newline is ignored.
This can be used to import external functions into gnuplot scripts:
f(x) = real(system(sprintf("somecommand %f", x)))
Test
This command graphically tests or presents terminal and palette capabilities.
Syntax:
test {terminal | palette [rgb|rbg|grb|gbr|brg|bgr]}
test or test terminal creates a display of line and point styles and other useful things appropriate for and
supported by the terminal you are just using.
test palette plots profiles of R(z),G(z),B(z), where 0<=z<=1. These are the RGB components of the
current color palette. It also plots the apparent net intensity as calculated using NTSC coefficients to map
RGB onto a grayscale. The optional parameter, a permutation of letters rgb, determines the sequence in
which the r,g,b profiles are drawn.
Undefine
Clear one or more previously defined user variables. This is useful in order to reset the state of a script
containing an initialization test.
A variable name can contain the wildcard character * as last character. If the wildcard character is found,
all variables with names that begin with the prefix preceding the wildcard will be removed. This is useful to
remove several variables sharing a common prefix. Note that the wildcard character is only allowed at the
end of the variable name! Specifying the wildcard character as sole argument to undefine has no effect.
Example:
undefine foo foo1 foo2
if (!exists("foo")) load "initialize.gp"
bar = 1; bar1 = 2; bar2 = 3
undefine bar*
# removes all three variables
Unset
Options set using the set command may be returned to their default state by the corresponding unset
command. The unset command may contain an optional iteration clause. See iteration (p. 71).
Examples:
set xtics mirror rotate by -45 0,10,100
...
unset xtics
gnuplot 4.7
175
# Unset labels numbered between 100 and 200
unset for [i=100:200] label i
Update
This command writes the current values of the fit parameters into the given file, formatted as an initial-value
file (as described in the fitsection). This is useful for saving the current values for later use or for restarting
a converged or stopped fit.
Syntax:
update <filename> {<filename>}
If a second filename is supplied, the updated values are written to this file, and the original parameter file is
left unmodified.
Otherwise, if the file already exists, gnuplot first renames it by appending .old and then opens a new file.
That is, "update ’fred’" behaves the same as "!rename fred fred.old; update ’fred.old’ ’fred’". [On
DOS and other systems that use the twelve-character "filename.ext" naming convention, "ext" will be "old"
and "filename" will be related (hopefully recognizably) to the initial name. Renaming is not done at all on
VMS systems, since they use file-versioning.]
Please see fit (p. 63) for more information.
While
Syntax:
while (<expr>) {
<commands>
}
Execute a block of commands repeatedly so long as <expr> evaluates to a non-zero value. This command
cannot be mixed with old-style (un-bracketed) if/else statements. See if (p. 70).
Part IV
Terminal types
Complete list of terminals
Gnuplot supports a large number of output formats. These are selected by choosing an appropriate terminal
type, possibly with additional modifying options. See set terminal (p. 153).
This document may describe terminal types that are not available to you because they were not configured
or installed on your system. To see a list of terminals available on a particular gnuplot installation, type ’set
terminal’ with no modifiers.
Aed767
The aed512 and aed767 terminal drivers support AED graphics terminals. The two drivers differ only in
their horizontal ranges, which are 512 and 768 pixels, respectively. Their vertical range is 575 pixels. There
are no options for these drivers.
176
gnuplot 4.7
Aifm
NOTE: Outdated terminal, originally written for Adobe Illustrator 3.0+. Since Adobe Illustrator understands PostScript level 1 commands directly, you should use set terminal post level1 instead.
Syntax:
set terminal aifm {color|monochrome} {"<fontname>"} {<fontsize>}
Aqua
This terminal relies on AquaTerm.app for display on Mac OS X.
Syntax:
set terminal aqua {<n>} {title "<wintitle>"} {size <x> <y>}
{font "<fontname>{,<fontsize>}"}
{{no}enhanced} {solid|dashed} {dl <dashlength>}}
where <n> is the number of the window to draw in (default is 0), <wintitle> is the name shown in the title
bar (default "Figure <n>"), <x> <y> is the size of the plot (default is 846x594 pt = 11.75x8.25 in).
Use <fontname> to specify the font (default is "Times-Roman"), and <fontsize> to specify the font size
(default is 14.0 pt).
The aqua terminal supports enhanced text mode (see enhanced (p. 24)), except for overprint. Font support
is limited to the fonts available on the system. Character encoding can be selected by set encoding and
currently supports iso latin 1, iso latin 2, cp1250, and UTF8 (default).
Lines can be drawn either solid or dashed, (default is solid) and the dash spacing can be modified by
<dashlength> which is a multiplier > 0.
Be
The be terminal type is present if gnuplot is built for the beos operating system and for use with X servers.
It is selected at program startup if the DISPLAY environment variable is set, if the TERM environment
variable is set to xterm, or if the -display command line option is used.
Syntax:
set terminal be {reset} {<n>}
Multiple plot windows are supported: set terminal be <n> directs the output to plot window number n.
If n>0, the terminal number will be appended to the window title and the icon will be labeled gplt <n>.
The active window may distinguished by a change in cursor (from default to crosshair.)
Plot windows remain open even when the gnuplot driver is changed to a different device. A plot window
can be closed by pressing the letter q while that window has input focus, or by choosing close from a
window manager menu. All plot windows can be closed by specifying reset, which actually terminates the
subprocess which maintains the windows (unless -persist was specified).
Plot windows will automatically be closed at the end of the session unless the -persist option was given.
The size or aspect ratio of a plot may be changed by resizing the gnuplot window.
Linewidths and pointsizes may be changed from within gnuplot with set linestyle.
For terminal type be, gnuplot accepts (when initialized) the standard X Toolkit options and resources such
as geometry, font, and name from the command line arguments or a configuration file. See the X(1) man
page (or its equivalent) for a description of such options.
A number of other gnuplot options are available for the be terminal. These may be specified either as
command-line options when gnuplot is invoked or as resources in the configuration file ".Xdefaults". They
are set upon initialization and cannot be altered during a gnuplot session.
gnuplot 4.7
177
Command-line options
In addition to the X Toolkit options, the following options may be specified on the command line when
starting gnuplot or as resources in your ".Xdefaults" file:
‘-mono‘
‘-gray‘
‘-clear‘
‘-raise‘
‘-noraise‘
‘-persist‘
forces monochrome rendering on color displays.
requests grayscale rendering on grayscale or color displays.
(Grayscale displays receive monochrome rendering by default.)
requests that the window be cleared momentarily before a
new plot is displayed.
raises plot window after each plot.
does not raise plot window after each plot.
plots windows survive after main gnuplot program exits.
The options are shown above in their command-line syntax. When entered as resources in ".Xdefaults",
they require a different syntax.
Example:
gnuplot*gray: on
gnuplot also provides a command line option (-pointsize <v>) and a resource, gnuplot*pointsize: <v>,
to control the size of points plotted with the points plotting style. The value v is a real number (greater
than 0 and less than or equal to ten) used as a scaling factor for point sizes. For example, -pointsize 2 uses
points twice the default size, and -pointsize 0.5 uses points half the normal size.
Monochrome options
For monochrome displays, gnuplot does not honor foreground or background colors. The default is blackon-white. -rv or gnuplot*reverseVideo: on requests white-on-black.
Color resources
For color displays, gnuplot honors the following resources (shown here with their default values) or the
greyscale resources. The values may be color names as listed in the BE rgb.txt file on your system, hexadecimal RGB color specifications (see BE documentation), or a color name followed by a comma and an
intensity value from 0 to 1. For example, blue, 0.5 means a half intensity blue.
gnuplot*background: white
gnuplot*textColor: black
gnuplot*borderColor: black
gnuplot*axisColor: black
gnuplot*line1Color: red
gnuplot*line2Color: green
gnuplot*line3Color: blue
gnuplot*line4Color: magenta
gnuplot*line5Color: cyan
gnuplot*line6Color: sienna
gnuplot*line7Color: orange
gnuplot*line8Color: coral
The command-line syntax for these is, for example,
Example:
gnuplot -background coral
178
gnuplot 4.7
Grayscale resources
When -gray is selected, gnuplot honors the following resources for grayscale or color displays (shown here
with their default values). Note that the default background is black.
gnuplot*background: black
gnuplot*textGray: white
gnuplot*borderGray: gray50
gnuplot*axisGray: gray50
gnuplot*line1Gray: gray100
gnuplot*line2Gray: gray60
gnuplot*line3Gray: gray80
gnuplot*line4Gray: gray40
gnuplot*line5Gray: gray90
gnuplot*line6Gray: gray50
gnuplot*line7Gray: gray70
gnuplot*line8Gray: gray30
Line resources
gnuplot honors the following resources for setting the width (in pixels) of plot lines (shown here with their
default values.) 0 or 1 means a minimal width line of 1 pixel width. A value of 2 or 3 may improve the
appearance of some plots.
gnuplot*borderWidth: 2
gnuplot*axisWidth: 0
gnuplot*line1Width: 0
gnuplot*line2Width: 0
gnuplot*line3Width: 0
gnuplot*line4Width: 0
gnuplot*line5Width: 0
gnuplot*line6Width: 0
gnuplot*line7Width: 0
gnuplot*line8Width: 0
gnuplot honors the following resources for setting the dash style used for plotting lines. 0 means a solid
line. A two-digit number jk (j and k are >= 1 and <= 9) means a dashed line with a repeated pattern of
j pixels on followed by k pixels off. For example, ’16’ is a "dotted" line with one pixel on followed by six
pixels off. More elaborate on/off patterns can be specified with a four-digit value. For example, ’4441’ is four
on, four off, four on, one off. The default values shown below are for monochrome displays or monochrome
rendering on color or grayscale displays. For color displays, the default for each is 0 (solid line) except for
axisDashes which defaults to a ’16’ dotted line.
gnuplot*borderDashes: 0
gnuplot*axisDashes: 16
gnuplot*line1Dashes: 0
gnuplot*line2Dashes: 42
gnuplot*line3Dashes: 13
gnuplot*line4Dashes: 44
gnuplot*line5Dashes: 15
gnuplot*line6Dashes: 4441
gnuplot*line7Dashes: 42
gnuplot*line8Dashes: 13
gnuplot 4.7
179
Cairolatex
The cairolatex terminal device generates encapsulated PostScript (*.eps) or PDF output using the cairo and
pango support libraries and uses LaTeX for text output using the same routines as the epslatex terminal.
Syntax:
set terminal cairolatex
{eps | pdf}
{standalone | input}
{blacktext | colortext | colourtext}
{header <header> | noheader}
{mono|color} {solid|dashed}
{{no}transparent} {{no}crop} {background <rgbcolor>}
{font <font>} {fontscale <scale>}
{linewidth <lw>} {rounded|butt} {dashlength <dl>}
{size <XX>{unit},<YY>{unit}}
The cairolatex terminal prints a plot like terminal epscairo or terminal pdfcairo but transfers the texts
to LaTeX instead of including them in the graph. For reference of options not explained here see pdfcairo
(p. 208).
eps and pdf select the type of grahics output. Use eps with latex/dvips and pdf for pdflatex.
blacktext forces all text to be written in black even in color mode;
The cairolatex driver offers a special way of controlling text positioning: (a) If any text string begins with
’{’, you also need to include a ’}’ at the end of the text, and the whole text will be centered both horizontally
and vertically by LaTeX. (b) If the text string begins with ’[’, you need to continue it with: a position
specification (up to two out of t,b,l,r,c), ’]{’, the text itself, and finally, ’}’. The text itself may be anything
LaTeX can typeset as an LR-box. \rule{}{}’s may help for best positioning. See also the documentation for
the pslatex (p. 215) terminal driver. To create multiline labels, use \shortstack, for example
set ylabel ’[r]{\shortstack{first line \\ second line}}’
The back option of set label commands is handled slightly different than in other terminals. Labels using
’back’ are printed behind all other elements of the plot while labels using ’front’ are printed above everything
else.
The driver produces two different files, one for the eps or pdf part of the figure and one for the LaTeX part.
The name of the LaTeX file is taken from the set output command. The name of the eps/pdf file is derived
by replacing the file extension (normally ’.tex’) with ’.eps’ or ’.pdf’ instead. There is no LaTeX output if no
output file is given! Remember to close the output file before next plot unless in multiplot mode.
In your LaTeX documents use ’\input{filename}’ to include the figure. The ’.eps’ or ’.pdf’ file is included by
the command \includegraphics{...}, so you must also include \usepackage{graphicx} in the LaTeX preamble.
If you want to use coloured text (option colourtext) you also have to include \usepackage{color} in the
LaTeX preamble.
The behaviour concerning font selection depends on the header mode. In all cases, the given font size is used
for the calculation of proper spacing. When not using the standalone mode the actual LaTeX font and font
size at the point of inclusion is taken, so use LaTeX commands for changing fonts. If you use e.g. 12pt as
font size for your LaTeX document, use ’", 12"’ as options. The font name is ignored. If using standalone
the given font and font size are used, see below for a detailed description.
If text is printed coloured is controlled by the TeX booleans \ifGPcolor and \ifGPblacktext. Only if
\ifGPcolor is true and \ifGPblacktext is false, text is printed coloured. You may either change them in
the generated TeX file or provide them globally in your TeX file, for example by using
\newif\ifGPblacktext
\GPblacktexttrue
in the preamble of your document. The local assignment is only done if no global value is given.
When using the cairolatex terminal give the name of the TeX file in the set output command including the
file extension (normally ".tex"). The graph filename is generated by replacing the extension.
180
gnuplot 4.7
If using the standalone mode a complete LaTeX header is added to the LaTeX file; and "-inc" is added
to the filename of the gaph file. The standalone mode generates a TeX file that produces output with the
correct size when using dvips, pdfTeX, or VTeX. The default, input, generates a file that has to be included
into a LaTeX document using the \input command.
If a font other than "" or "default" is given it is interpreted as LaTeX font name. It contains up to three parts,
separated by a comma: ’fontname,fontseries,fontshape’. If the default fontshape or fontseries are requested,
they can be omitted. Thus, the real syntax for the fontname is ’{fontname}{,fontseries}{,fontshape}’. The
naming convention for all parts is given by the LaTeX font scheme. The fontname is 3 to 4 characters
long and is built as follows: One character for the font vendor, two characters for the name of the font, and
optionally one additional character for special fonts, e.g., ’j’ for fonts with old-style numerals or ’x’ for expert
fonts. The names of many fonts is described in
http://www.tug.org/fontname/fontname.pdf
For example, ’cmr’ stands for Computer Modern Roman, ’ptm’ for Times-Roman, and ’phv’ for Helvetica.
The font series denotes the thickness of the glyphs, in most cases ’m’ for normal ("medium") and ’bx’ or
’b’ for bold fonts. The font shape is ’n’ for upright, ’it’ for italics, ’sl’ for slanted, or ’sc’ for small caps, in
general. Some fonts may provide different font series or shapes.
Examples:
Use Times-Roman boldface (with the same shape as in the surrounding text):
set terminal cairolatex font ’ptm,bx’
Use Helvetica, boldface, italics:
set terminal cairolatex font ’phv,bx,it’
Continue to use the surrounding font in slanted shape:
set terminal cairolatex font ’,,sl’
Use small capitals:
set terminal cairolatex font ’,,sc’
By this method, only text fonts are changed. If you also want to change the math fonts you have to use the
"gnuplot.cfg" file or the header option, described below.
In standalone mode, the font size is taken from the given font size in the set terminal command. To be
able to use a specified font size, a file "size<size>.clo" has to reside in the LaTeX search path. By default,
10pt, 11pt, and 12pt are supported. If the package "extsizes" is installed, 8pt, 9pt, 14pt, 17pt, and 20pt are
added.
The header option takes a string as argument. This string is written into the generated LaTeX file. If using
the standalone mode, it is written into the preamble, directly before the \begin{document} command. In
the input mode, it is placed directly after the \begingroup command to ensure that all settings are local to
the plot.
Examples:
Use T1 fontencoding, change the text and math font to Times-Roman as well as the sans-serif font to
Helvetica:
set terminal cairolatex standalone header \
"\\usepackage[T1]{fontenc}\n\\usepackage{mathptmx}\n\\usepackage{helvet}"
Use a boldface font in the plot, not influencing the text outside the plot:
set terminal cairolatex input header "\\bfseries"
If the file "gnuplot.cfg" is found by LaTeX it is input in the preamble the LaTeX document, when using
standalone mode. It can be used for further settings, e.g., changing the document font to Times-Roman,
Helvetica, and Courier, including math fonts (handled by "mathptmx.sty"):
\usepackage{mathptmx}
\usepackage[scaled=0.92]{helvet}
\usepackage{courier}
The file "gnuplot.cfg" is loaded before the header information given by the header command. Thus, you
can use header to overwrite some of settings performed using "gnuplot.cfg"
gnuplot 4.7
181
Canvas
The canvas terminal creates a set of javascript commands that draw onto the HTML5 canvas element.
Syntax:
set terminal canvas {size <xsize>, <ysize>} {background <rgb_color>}
{font {<fontname>}{,<fontsize>}} | {fsize <fontsize>}
{{no}enhanced} {linewidth <lw>}
{rounded | butt}
{solid | dashed {dashlength <dl>}}
{standalone {mousing} | name ’<funcname>’}
{jsdir ’URL/for/javascripts’}
{title ’<some string>’}
where <xsize> and <ysize> set the size of the plot area in pixels. The default size in standalone mode is
600 by 400 pixels. The default font size is 10.
NB: Only one font is available, the ascii portion of Hershey simplex Roman provided in the file canvastext.js.
You can replace this with the file canvasmath.js, which contains also UTF-8 encoded Hershey simplex Greek
and math symbols. For consistency with other terminals, it is also possible to use font "name,size".
Currently the font name is ignored, but browser support for named fonts is likely to arrive eventually.
The default standalone mode creates an html page containing javascript code that renders the plot using
the HTML 5 canvas element. The html page links to two required javascript files ’canvastext.js’ and ’gnuplot common.js’. An additional file ’gnuplot dashedlines.js’ is needed to support dashed lines. By default
these point to local files, on unix-like systems usually in directory /usr/local/share/gnuplot/<version>/js.
See installation notes for other platforms. You can change this by using the jsdir option to specify either
a different local directory or a general URL. The latter is usually appropriate if the plot is exported for
viewing on remote client machines.
All plots produced by the canvas terminal are mouseable. The additional keyword mousing causes the
standalone mode to add a mouse-tracking box underneath the plot. It also adds a link to a javascript
file ’gnuplot mouse.js’ and to a stylesheet for the mouse box ’gnuplot mouse.css’ in the same local or URL
directory as ’canvastext.js’.
The name option creates a file containing only javascript. Both the javascript function it contains and the
id of the canvas element that it draws onto are taken from the following string parameter. The commands
set term canvas name ’fishplot’
set output ’fishplot.js’
will create a file containing a javascript function fishplot() that will draw onto a canvas with id=fishplot. An
html page that invokes this javascript function must also load the canvastext.js function as described above.
A minimal html file to wrap the fishplot created above might be:
<html>
<head>
<script src="canvastext.js"></script>
<script src="gnuplot_common.js"></script>
</head>
<body onload="fishplot();">
<script src="fishplot.js"></script>
<canvas id="fishplot" width=600 height=400>
<div id="err_msg">No support for HTML 5 canvas element</div>
</canvas>
</body>
</html>
The individual plots drawn on this canvas will have names fishplot plot 1, fishplot plot 2, and so on. These
can be referenced by external javascript routines, for example gnuplot.toggle visibility("fishplot plot 2").
182
gnuplot 4.7
Cgi
The cgi and hcgi terminal drivers support SCO CGI drivers. hcgi is for printers; the environment variable
CGIPRNT must be set. cgi may be used for either a display or hardcopy; the environment variable CGIDISP
is checked, first, then CGIPRNT. These terminals have no options.
Cgm
The cgm terminal generates a Computer Graphics Metafile, Version 1. This file format is a subset of the
ANSI X3.122-1986 standard entitled "Computer Graphics - Metafile for the Storage and Transfer of Picture
Description Information".
Syntax:
set terminal cgm {color | monochrome} {solid | dashed} {{no}rotate}
{<mode>} {width <plot_width>} {linewidth <line_width>}
{font "<fontname>,<fontsize>"}
{background <rgb_color>}
[deprecated]
{<color0> <color1> <color2> ...}
solid draws all curves with solid lines, overriding any dashed patterns; <mode> is landscape, portrait, or
default; <plot width> is the assumed width of the plot in points; <line width> is the line width in points
(default 1); <fontname> is the name of a font (see list of fonts below) <fontsize> is the size of the font in
points (default 12).
The first six options can be in any order. Selecting default sets all options to their default values.
The mechanism of setting line colors in the set term command is deprecated. Instead you should set the
background using a separate keyword and set the line colors using set linetype. The deprecated mechanism
accepted colors of the form ’xrrggbb’, where x is the literal character ’x’ and ’rrggbb’ are the red, green and
blue components in hex. The first color was used for the background, subsequent colors are assigned to
successive line types.
Examples:
set terminal cgm landscape color rotate dashed width 432 \
linewidth 1 ’Helvetica Bold’ 12
# defaults
set terminal cgm linewidth 2 14 # wider lines & larger font
set terminal cgm portrait "Times Italic" 12
set terminal cgm color solid
# no pesky dashes!
Cgm font
The first part of a Computer Graphics Metafile, the metafile description, includes a font table. In the picture
body, a font is designated by an index into this table. By default, this terminal generates a table with the
following 35 fonts, plus six more with italic replaced by oblique, or vice-versa (since at least the Microsoft
Office and Corel Draw CGM import filters treat italic and oblique as equivalent):
gnuplot 4.7
183
CGM fonts
Helvetica
Hershey/Cartographic Roman
Helvetica Bold
Hershey/Cartographic Greek
Helvetica Oblique
Hershey/Simplex Roman
Helvetica Bold Oblique Hershey/Simplex Greek
Times Roman
Hershey/Simplex Script
Times Bold
Hershey/Complex Roman
Times Italic
Hershey/Complex Greek
Times Bold Italic
Hershey/Complex Italic
Courier
Hershey/Complex Cyrillic
Courier Bold
Hershey/Duplex Roman
Courier Oblique
Hershey/Triplex Roman
Courier Bold Oblique
Hershey/Triplex Italic
Symbol
Hershey/Gothic German
ZapfDingbats
Hershey/Gothic English
Script
Hershey/Gothic Italian
15
Hershey/Symbol Set 1
Hershey/Symbol Set 2
Hershey/Symbol Math
The first thirteen of these fonts are required for WebCGM. The Microsoft Office CGM import filter implements the 13 standard fonts listed above, and also ’ZapfDingbats’ and ’Script’. However, the script font may
only be accessed under the name ’15’. For more on Microsoft import filter font substitutions, check its help
file which you may find here:
C:\Program Files\Microsoft Office\Office\Cgmimp32.hlp
and/or its configuration file, which you may find here:
C:\Program Files\Common Files\Microsoft Shared\Grphflt\Cgmimp32.cfg
In the set term command, you may specify a font name which does not appear in the default font table.
In that case, a new font table is constructed with the specified font as its first entry. You must ensure that
the spelling, capitalization, and spacing of the name are appropriate for the application that will read the
CGM file. (Gnuplot and any MIL-D-28003A compliant application ignore case in font names.) If you need
to add several new fonts, use several set term commands.
Example:
set terminal cgm ’Old English’
set terminal cgm ’Tengwar’
set terminal cgm ’Arabic’
set output ’myfile.cgm’
plot ...
set output
You cannot introduce a new font in a set label command.
Cgm fontsize
Fonts are scaled assuming the page is 6 inches wide. If the size command is used to change the aspect ratio
of the page or the CGM file is converted to a different width, the resulting font sizes will be scaled up or
down accordingly. To change the assumed width, use the width option.
Cgm linewidth
The linewidth option sets the width of lines in pt. The default width is 1 pt. Scaling is affected by the
actual width of the page, as discussed under the fontsize and width options.
184
gnuplot 4.7
Cgm rotate
The norotate option may be used to disable text rotation. For example, the CGM input filter for Word
for Windows 6.0c can accept rotated text, but the DRAW editor within Word cannot. If you edit a graph
(for example, to label a curve), all rotated text is restored to horizontal. The Y axis label will then extend
beyond the clip boundary. With norotate, the Y axis label starts in a less attractive location, but the page
can be edited without damage. The rotate option confirms the default behavior.
Cgm solid
The solid option may be used to disable dashed line styles in the plots. This is useful when color is enabled
and the dashing of the lines detracts from the appearance of the plot. The dashed option confirms the
default behavior, which gives a different dash pattern to each line type.
Cgm size
Default size of a CGM plot is 32599 units wide and 23457 units high for landscape, or 23457 units wide by
32599 units high for portrait.
Cgm width
All distances in the CGM file are in abstract units. The application that reads the file determines the size
of the final plot. By default, the width of the final plot is assumed to be 6 inches (15.24 cm). This distance
is used to calculate the correct font size, and may be changed with the width option. The keyword should
be followed by the width in points. (Here, a point is 1/72 inch, as in PostScript. This unit is known as a
"big point" in TeX.) Gnuplot expressions can be used to convert from other units.
Example:
set terminal cgm width 432
set terminal cgm width 6*72
set terminal cgm width 10/2.54*72
# default
# same as above
# 10 cm wide
Cgm nofontlist
The default font table includes the fonts recommended for WebCGM, which are compatible with the Computer Graphics Metafile input filter for Microsoft Office and Corel Draw. Another application might use
different fonts and/or different font names, which may not be documented. The nofontlist (synonym winword6) option deletes the font table from the CGM file. In this case, the reading application should use a
default table. Gnuplot will still use its own default font table to select font indices. Thus, ’Helvetica’ will
give you an index of 1, which should get you the first entry in your application’s default font table. ’Helvetica
Bold’ will give you its second entry, etc.
Context
ConTeXt is a macro package for TeX, highly integrated with Metapost (for drawing figures) and intended
for creation of high-quality PDF documents. The terminal outputs Metafun source, which can be edited
manually, but you should be able to configure most things from outside.
For an average user of ConTeXt + gnuplot module it’s recommended to refer to Using ConTeXt rather
than reading this page or to read the manual of the gnuplot module for ConTeXt.
The context terminal supports the following options:
Syntax:
set term context {default}
{defaultsize | size <scale> | size <xsize>{in|cm}, <ysize>{in|cm}}
{input | standalone}
gnuplot 4.7
185
{timestamp | notimestamp}
{noheader | header "<header>"}
{color | colour | monochrome}
{rounded | mitered | beveled} {round | butt | squared}
{dashed | solid} {dashlength | dl <dl>}
{linewidth | lw <lw>}
{fontscale <fontscale>}
{mppoints | texpoints}
{inlineimages | externalimages}
{defaultfont | font "{<fontname>}{,<fontsize>}"}
In non-standalone (input) graphic only parameters size to select graphic size, fontscale to scale all the
labels for a factor <fontscale> and font size, make sense, the rest is silently ignored and should be configured
in the .tex file which inputs the graphic. It’s highly recommended to set the proper fontsize if document
font differs from 12pt, so that gnuplot will know how much space to reserve for labels.
default resets all the options to their default values.
defaultsize sets the plot size to 5in,3in. size <scale> sets the plot size to <scale> times <default value>.
If two arguments are given (separated with ’,’), the first one sets the horizontal size and the second one the
vertical size. Size may be given without units (in which case it means relative to the default value), with
inches (’in’) or centimeters (’cm’).
input (default) creates a graphic that can be included into another ConTeXt document. standalone adds
some lines, so that the document might be compiled as-is. You might also want to add header in that case.
Use header for any additional settings/definitions/macros that you might want to include in a standalone
graphic. noheader is the default.
notimestamp prevents printing creation time in comments (if version control is used, one may prefer not
to commit new version when only date changes).
color to make color plots is the default, but monochrome doesn’t do anything special yet. If you have
any good ideas how the behaviour should differ to suit the monochrome printers better, your suggestions are
welcome.
rounded (default), mitered and beveled control the shape of line joins. round (default), butt and
squared control the shape of line caps. See PostScript or PDF Reference Manual for explanation. For
wild-behaving functions and thick lines it is better to use rounded and round to prevent sharp corners in
line joins. (Some general support for this should be added to Gnuplot, so that the same options could be
set for each line (style) separately).
dashed (default) uses different dash patterns for different line types, solid draws all plots with solid lines.
dashlength or dl scales the length of the dashed-line segments by <dl>. linewidth or lw scales all
linewidths by <lw>. (lw 1 stands for 0.5bp, which is the default line width when drawing with Metapost.)
fontscale scales text labels for factor <fontscale> relative to default document font.
mppoints uses predefined point shapes, drawn in Metapost. texpoints uses easily configurable set of
symbols, defined with ConTeXt in the following way:
\defineconversion[my own points][+,{\ss x},\mathematics{\circ}]
\setupGNUPLOTterminal[context][points=tex,pointset=my own points]
inlineimages writes binary images to a string and only works in ConTeXt MKIV. externalimages writes
PNG files to disk and also works with ConTeXt MKII. Gnuplot needs to have support for PNG images built
in for this to work.
With font you can set font name and size in standalone graphics. In non-standalone (input) mode only the
font size is important to reserve enough space for text labels. The command
set term context font "myfont,ss,10"
will result in
\setupbodyfont[myfont,ss,10pt]
If you additionaly set fontscale to 0.8 for example, then the resulting font will be 8pt big and
186
gnuplot 4.7
set label ... font "myfont,12"
will come out as 9.6pt.
It is your own responsibility to provide proper typescripts (and header), otherwise switching the font will
have no effect. For a standard font in ConTeXt MKII (pdfTeX) you could use:
set terminal context standalone header ’\usetypescript[iwona][ec]’ \
font "iwona,ss,11"
Please take a look into ConTeXt documentation, wiki or mailing list (archives) for any up-to-date information
about font usage.
Examples:
set terminal context size 10cm, 5cm
set terminal context size 4in, 3in
# 10cm, 5cm
# 4in, 3in
For standalone (whole-page) plots with labels in UTF-8 encoding:
set terminal context standalone header ’\enableregime[utf-8]’
Requirements
You need gnuplot module for ConTeXt
http://ctan.org/pkg/context-gnuplot
and a recent version of ConTeXt. If you want to call gnuplot on-the-fly, you also need write18 enabled. In
most TeX distributions this can be set with shell escape=t in texmf.cnf.
See
http://wiki.contextgarden.net/Gnuplot
for details about this terminal and for more exhaustive help & examples.
Calling gnuplot from ConTeXt
The easiest way to make plots in ConTeXt documents is
\usemodule[gnuplot]
\starttext
\title{How to draw nice plots with {\sc gnuplot}?}
\startGNUPLOTscript[sin]
set format y "%.1f"
plot sin(x) t ’$\sin(x)$’
\stopGNUPLOTscript
\useGNUPLOTgraphic[sin]
\stoptext
This will run gnuplot automatically and include the resulting figure in the document.
Corel
The corel terminal driver supports CorelDraw.
Syntax:
set terminal corel { default
| {monochrome | color
{"<font>" {<fontsize>
{<xsize> <ysize> {<linewidth> }}}}}
where the fontsize and linewidth are specified in points and the sizes in inches. The defaults are monochrome,
"SwitzerlandLight", 22, 8.2, 10 and 1.2.
gnuplot 4.7
187
Debug
This terminal is provided to allow for the debugging of gnuplot. It is likely to be of use only for users who
are modifying the source code.
Dumb
The dumb terminal driver plots into a text block using ascii characters. It has an optional size specification
and a trailing linefeed flag.
Syntax:
set terminal dumb {size <xchars>,<ychars>} {[no]feed}
{[no]enhanced}
where <xchars> and <ychars> set the size of the text block. The default is 79 by 24. The last newline is
printed only if feed is enabled.
Example:
set term dumb size 60,15
plot [-5:6.5] sin(x) with impulse
1
0.8
0.6
0.4
0.2
0
-0.2
-0.4
-0.6
-0.8
-1
+-------------------------------------------------+
+|||++
++||||++
sin(x) +----+ |
+|||||+
++|||||||+
|
+||||||+
++|||||||||+
|
+|||||||+
++|||||||||||+
+|
++++++++++++++++++++++++++++++++++++++++++++++++++|
+
+|||||||||||+
+|||||||||||+ |
+
+|||||||||+
+|||||||||+ |
+
+|||||||+
+|||||||+
|
+
+
++||||+
+
+
++||||+ + |
+---+--------+--------+-------+--------+--------+-+
-4
-2
0
2
4
6
Dxf
The dxf terminal driver creates pictures that can be imported into AutoCad (Release 10.x). It has no
options of its own, but some features of its plots may be modified by other means. The default size is 120x80
AutoCad units, which can be changed by set size. dxf uses seven colors (white, red, yellow, green, cyan,
blue and magenta), which can be changed only by modifying the source file. If a black-and-white plotting
device is used, the colors are mapped to differing line thicknesses. See the description of the AutoCad
print/plot command.
Dxy800a
This terminal driver supports the Roland DXY800A plotter. It has no options.
Eepic
The eepic terminal driver supports the extended LaTeX picture environment. It is an alternative to the
latex driver.
The output of this terminal is intended for use with the "eepic.sty" macro package for LaTeX. To use it, you
need "eepic.sty", "epic.sty" and a printer driver that supports the "tpic" \specials. If your printer driver
doesn’t support those \specials, "eepicemu.sty" will enable you to use some of them. dvips and dvipdfm do
support the "tpic" \specials.
Syntax:
188
gnuplot 4.7
set terminal eepic {default} {color|dashed} {rotate} {size XX,YY}
{small|tiny|<fontsize>}
Options: You can give options in any order you wish. ’color’ causes gnuplot to produce \color{...} commands
so that the graphs are colored. Using this option, you must include \usepackage{color} in the preambel of
your latex document. ’dashed’ will allow dashed line types; without this option, only solid lines with varying
thickness will be used. ’dashed’ and ’color’ are mutually exclusive; if ’color’ is specified, then ’dashed’ will
be ignored. ’rotate’ will enable true rotated text (by 90 degrees). Otherwise, rotated text will be typeset
with letters stacked above each other. If you use this option you must include \usepackage{graphicx} in
the preamble. ’small’ will use \scriptsize symbols as point markers (Probably does not work with TeX, only
LaTeX2e). Default is to use the default math size. ’tiny’ uses \scriptscriptstyle symbols. ’default’ resets
all options to their defaults = no color, no dashed lines, pseudo-rotated (stacked) text, large point symbols.
<fontsize> is a number which specifies the font size inside the picture environment; the unit is pt (points),
i.e., 10 pt equals approx. 3.5 mm. If fontsize is not specified, then all text inside the picture will be set in
\footnotesize.
Notes: Remember to escape the # character (or other chars meaningful to (La-)TeX) by \\ (2 backslashes).
It seems that dashed lines become solid lines when the vertices of a plot are too close. (I do not know if
that is a general problem with the tpic specials, or if it is caused by a bug in eepic.sty or dvips/dvipdfm.)
The default size of an eepic plot is 5x3 inches. You can change this using the size terminal option. Points,
among other things, are drawn using the LaTeX commands "\Diamond", "\Box", etc. These commands
no longer belong to the LaTeX2e core; they are included in the latexsym package, which is part of the base
distribution and thus part of any LaTeX implementation. Please do not forget to use this package. Instead of
latexsym, you can also include the amssymb package. All drivers for LaTeX offer a special way of controlling
text positioning: If any text string begins with ’{’, you also need to include a ’}’ at the end of the text, and
the whole text will be centered both horizontally and vertically. If the text string begins with ’[’, you need
to follow this with a position specification (up to two out of t,b,l,r), ’]{’, the text itself, and finally ’}’. The
text itself may be anything LaTeX can typeset as an LR-box. ’\rule{}{}’s may help for best positioning.
Examples: set term eepic
output graphs as eepic macros inside a picture environment;
\input the resulting file in your LaTeX document.
set term eepic color tiny rotate 8
eepic macros with \color macros, \scripscriptsize point markers,
true rotated text, and all text set with 8pt.
About label positioning: Use gnuplot defaults (mostly sensible, but sometimes not really best):
set title ’\LaTeX\ -- $ \gamma $’
Force centering both horizontally and vertically:
set label ’{\LaTeX\ -- $ \gamma $}’ at 0,0
Specify own positioning (top here):
set xlabel ’[t]{\LaTeX\ -- $ \gamma $}’
The other label – account for long ticlabels:
set ylabel ’[r]{\LaTeX\ -- $ \gamma $\rule{7mm}{0pt}}’
Emf
The emf terminal generates an Enhanced Metafile Format file. This file format is recognized by many
Windows applications.
Syntax:
set terminal emf {color | monochrome} {solid | dashed}
{enhanced {noproportional}}
{rounded | butt}
gnuplot 4.7
189
{linewidth <LW>} {dashlength <DL>}
{size XX,YY} {background <rgb_color>}
{font "<fontname>{,<fontsize>}"}
{fontscale <scale>}
In monochrome mode successive line types cycle through dash patterns. In color mode successive line
types use successive colors, and only after all 8 default colors are exhausted is the dash pattern incremented.
solid draws all curves with solid lines, overriding any dashed patterns; linewidth <factor> multiplies all
line widths by this factor. dashlength <factor> is useful for thick lines. <fontname> is the name of a
font; and <fontsize> is the size of the font in points.
The nominal size of the output image defaults to 1024x768 in arbitrary units. You may specify a different
nominal size using the size option.
Enhanced text mode tries to approximate proportional character spacing. If you are using a monospaced
font, or don’t like the approximation, you can turn off this correction using the noproportional option.
The default settings are color dashed font "Arial,12" size 1024,768 Selecting default sets all options
to their default values.
Examples:
set terminal emf ’Times Roman Italic, 12’
set terminal emf color solid
# no pesky dashes!
Emxvga
The emxvga, emxvesa and vgal terminal drivers support PCs with SVGA, vesa SVGA and VGA graphics
boards, respectively. They are intended to be compiled with "emx-gcc" under either DOS or OS/2. They also
need VESA and SVGAKIT maintained by Johannes Martin ([email protected])
with additions by David J. Liu ([email protected]).
Syntax:
set terminal emxvga
set terminal emxvesa {vesa-mode}
set terminal vgal
The only option is the vesa mode for emxvesa, which defaults to G640x480x256.
Epscairo
The epscairo terminal device generates encapsulated PostScript (*.eps) using the cairo and pango support
libraries. cairo verion >= 1.6 is required.
Please read the help for the pdfcairo terminal.
Epslatex
The epslatex driver generates output for further processing by LaTeX.
Syntax:
set terminal epslatex
set terminal epslatex
{default}
{standalone | input}
{oldstyle | newstyle}
{level1 | leveldefault}
{color | colour | monochrome}
{background <rgbcolor> | nobackground}
{solid | dashed}
{dashlength | dl <DL>}
{linewidth | lw <LW>}
190
gnuplot 4.7
{rounded | butt}
{clip | noclip}
{palfuncparam <samples>{,<maxdeviation>}}
{size <XX>{unit},<YY>{unit}}
{header <header> | noheader}
{blacktext | colortext | colourtext}
{{font} "fontname{,fontsize}" {<fontsize>}}
{fontscale <scale>}
The epslatex terminal prints a plot as terminal postscript eps but transfers the texts to LaTeX instead
of including in the PostScript code. Thus, many options are the same as in the postscript terminal.
The appearance of the epslatex terminal changed between versions 4.0 and 4.2 to reach better consistency
with the postscript terminal: The plot size has been changed from 5 x 3 inches to 5 x 3.5 inches; the character
width is now estimated to be 60% of the font size while the old epslatex terminal used 50%; now, the larger
number of postscript linetypes and symbols are used. To reach an appearance that is nearly identical to the
old one specify the option oldstyle. (In fact some small differences remain: the symbol sizes are slightly
different, the tics are half as large as in the old terminal which can be changed using set tics scale, and the
arrows have all features as in the postscript terminal.)
If you see the error message
"Can’t find PostScript prologue file ... "
Please see and follow the instructions in postscript prologue (p. 215).
The option color enables color, while monochrome prefers black and white drawing elements. Further,
monochrome uses gray palette but it does not change color of objects specified with an explicit colorspec.
solid draws all plots with solid lines, overriding any dashed patterns. dashlength or dl scales the length of
the dashed-line segments by <DL>, which is a floating-point number greater than zero. linewidth or lw
scales all linewidths by <LW>.
By default the generated PostScript code uses language features that were introduced in PostScript Level 2,
notably filters and pattern-fill of irregular objects such as filledcurves. PostScript Level 2 features are conditionally protected so that PostScript Level 1 interpreters do not issue errors but, rather, display a message
or a PostScript Level 1 approximation. The level1 option substitutes PostScript Level 1 approximations
of these features and uses no PostScript Level 2 code. This may be required by some old printers and old
versions of Adobe Illustrator. The flag level1 can be toggled later by editing a single line in the PostScript
output file to force PostScript Level 1 interpretation. In the case of files containing level 2 code, the above
features will not appear or will be replaced by a note when this flag is set or when the interpreting program
does not indicate that it understands level 2 PostScript or higher.
rounded sets line caps and line joins to be rounded; butt is the default, butt caps and mitered joins.
clip tells PostScript to clip all output to the bounding box; noclip is the default.
palfuncparam controls how set palette functions are encoded as gradients in the output. Analytic
color component functions (set via set palette functions) are encoded as linear interpolated gradients
in the postscript output: The color component functions are sampled at <samples> points and all points
are removed from this gradient which can be removed without changing the resulting colors by more than
<maxdeviation>. For almost every useful palette you may safely leave the defaults of <samples>=2000 and
<maxdeviation>=0.003 untouched.
The default size for postscript output is 10 inches x 7 inches. The default for eps output is 5 x 3.5 inches.
The size option changes this to whatever the user requests. By default the X and Y sizes are taken to be in
inches, but other units are possibly (currently only cm). The BoundingBox of the plot is correctly adjusted
to contain the resized image. Screen coordinates always run from 0.0 to 1.0 along the full length of the
plot edges as specified by the size option. NB: this is a change from the previously recommended
method of using the set size command prior to setting the terminal type. The old method left
the BoundingBox unchanged and screen coordinates did not correspond to the actual limits of the plot.
blacktext forces all text to be written in black even in color mode;
The epslatex driver offers a special way of controlling text positioning: (a) If any text string begins with ’{’,
you also need to include a ’}’ at the end of the text, and the whole text will be centered both horizontally
gnuplot 4.7
191
and vertically by LaTeX. (b) If the text string begins with ’[’, you need to continue it with: a position
specification (up to two out of t,b,l,r,c), ’]{’, the text itself, and finally, ’}’. The text itself may be anything
LaTeX can typeset as an LR-box. \rule{}{}’s may help for best positioning. See also the documentation for
the pslatex (p. 215) terminal driver. To create multiline labels, use \shortstack, for example
set ylabel ’[r]{\shortstack{first line \\ second line}}’
The back option of set label commands is handled slightly different than in other terminals. Labels using
’back’ are printed behind all other elements of the plot while labels using ’front’ are printed above everything
else.
The driver produces two different files, one for the eps part of the figure and one for the LaTeX part. The
name of the LaTeX file is taken from the set output command. The name of the eps file is derived by
replacing the file extension (normally .tex) with .eps instead. There is no LaTeX output if no output file is
given! Remember to close the output file before next plot unless in multiplot mode.
In your LaTeX documents use ’\input{filename}’ to include the figure. The .eps file is included by the
command \includegraphics{...}, so you must also include \usepackage{graphicx} in the LaTeX preamble.
If you want to use coloured text (option textcolour) you also have to include \usepackage{color} in the
LaTeX preamble.
Pdf files can be made from the eps file using ’epstopdf’. If the graphics package is properly configured, the
LaTeX files can also be processed by pdflatex without changes, using the pdf files instead of the eps files.
The behaviour concerning font selection depends on the header mode. In all cases, the given font size is used
for the calculation of proper spacing. When not using the standalone mode the actual LaTeX font and font
size at the point of inclusion is taken, so use LaTeX commands for changing fonts. If you use e.g. 12pt as
font size for your LaTeX document, use ’"" 12’ as options. The font name is ignored. If using standalone
the given font and font size are used, see below for a detailed description.
If text is printed coloured is controlled by the TeX booleans \ifGPcolor and \ifGPblacktext. Only if
\ifGPcolor is true and \ifGPblacktext is false, text is printed coloured. You may either change them in
the generated TeX file or provide them globally in your TeX file, for example by using
\newif\ifGPblacktext
\GPblacktexttrue
in the preamble of your document. The local assignment is only done if no global value is given.
When using the epslatex terminal give the name of the TeX file in the set output command including the
file extension (normally ".tex"). The eps filename is generated by replacing the extension by ".eps".
If using the standalone mode a complete LaTeX header is added to the LaTeX file; and "-inc" is added
to the filename of the eps file. The standalone mode generates a TeX file that produces output with the
correct size when using dvips, pdfTeX, or VTeX. The default, input, generates a file that has to be included
into a LaTeX document using the \input command.
If a font other than "" or "default" is given it is interpreted as LaTeX font name. It contains up to three parts,
separated by a comma: ’fontname,fontseries,fontshape’. If the default fontshape or fontseries are requested,
they can be omitted. Thus, the real syntax for the fontname is ’[fontname][,fontseries][,fontshape]’. The
naming convention for all parts is given by the LaTeX font scheme. The fontname is 3 to 4 characters
long and is built as follows: One character for the font vendor, two characters for the name of the font, and
optionally one additional character for special fonts, e.g., ’j’ for fonts with old-style numerals or ’x’ for expert
fonts. The names of many fonts is described in
http://www.tug.org/fontname/fontname.pdf
For example, ’cmr’ stands for Computer Modern Roman, ’ptm’ for Times-Roman, and ’phv’ for Helvetica.
The font series denotes the thickness of the glyphs, in most cases ’m’ for normal ("medium") and ’bx’ or
’b’ for bold fonts. The font shape is ’n’ for upright, ’it’ for italics, ’sl’ for slanted, or ’sc’ for small caps, in
general. Some fonts may provide different font series or shapes.
Examples:
Use Times-Roman boldface (with the same shape as in the surrounding text):
set terminal epslatex ’ptm,bx’
Use Helvetica, boldface, italics:
192
gnuplot 4.7
set terminal epslatex ’phv,bx,it’
Continue to use the surrounding font in slanted shape:
set terminal epslatex ’,,sl’
Use small capitals:
set terminal epslatex ’,,sc’
By this method, only text fonts are changed. If you also want to change the math fonts you have to use the
"gnuplot.cfg" file or the header option, described below.
In standalone mode, the font size is taken from the given font size in the set terminal command. To be
able to use a specified font size, a file "size<size>.clo" has to reside in the LaTeX search path. By default,
10pt, 11pt, and 12pt are supported. If the package "extsizes" is installed, 8pt, 9pt, 14pt, 17pt, and 20pt are
added.
The header option takes a string as argument. This string is written into the generated LaTeX file. If using
the standalone mode, it is written into the preamble, directly before the \begin{document} command. In
the input mode, it is placed directly after the \begingroup command to ensure that all settings are local to
the plot.
Examples:
Use T1 fontencoding, change the text and math font to Times-Roman as well as the sans-serif font to
Helvetica:
set terminal epslatex standalone header \
"\\usepackage[T1]{fontenc}\n\\usepackage{mathptmx}\n\\usepackage{helvet}"
Use a boldface font in the plot, not influencing the text outside the plot:
set terminal epslatex input header "\\bfseries"
If the file "gnuplot.cfg" is found by LaTeX it is input in the preamble the LaTeX document, when using
standalone mode. It can be used for further settings, e.g., changing the document font to Times-Roman,
Helvetica, and Courier, including math fonts (handled by "mathptmx.sty"):
\usepackage{mathptmx}
\usepackage[scaled=0.92]{helvet}
\usepackage{courier}
The file "gnuplot.cfg" is loaded before the header information given by the header command. Thus, you
can use header to overwrite some of settings performed using "gnuplot.cfg"
Epson 180dpi
This driver supports a family of Epson printers and derivatives.
epson 180dpi and epson 60dpi are drivers for Epson LQ-style 24-pin printers with resolutions of 180 and
60 dots per inch, respectively.
epson lx800 is a generic 9-pin driver appropriate for printers like the Epson LX-800, the Star NL-10 and
NX-1000, the PROPRINTER, and so forth.
nec cp6 is generic 24-pin driver that can be used for printers like the NEC CP6 and the Epson LQ-800.
The okidata driver supports the 9-pin OKIDATA 320/321 Standard printers.
The starc driver is for the Star Color Printer.
The tandy 60dpi driver is for the Tandy DMP-130 series of 9-pin, 60-dpi printers.
The dpu414 driver is for the Seiko DPU-414 thermal printer.
nec cp6 has the options:
Syntax:
set terminal nec_cp6 {monochrome | colour | draft}
gnuplot 4.7
193
which defaults to monochrome.
dpu414 has the options:
Syntax:
set terminal dpu414 {small | medium | large} {normal | draft}
which defaults to medium (=font size) and normal. Preferred combinations are medium normal and small
draft.
Excl
The excl terminal driver supports Talaris printers such as the EXCL Laser printer and the 1590. It has no
options.
Fig
The fig terminal device generates output in the Fig graphics language.
Syntax:
set terminal fig {monochrome | color}
{landscape | portrait}
{small | big | size <xsize> <ysize>}
{metric | inches}
{pointsmax <max_points>}
{solid | dashed}
{font "<fontname>{,<fontsize>}"}
{textnormal | {textspecial texthidden textrigid}}
{{thickness|linewidth} <units>}
{depth <layer>}
{version <number>}
monochrome and color determine whether the picture is black-and-white or color. small and big produce
a 5x3 or 8x5 inch graph in the default landscape mode and 3x5 or 5x8 inches in portrait mode. size sets
(overrides) the size of the drawing area to <xsize>*<ysize> in units of inches or centimeters depending
on the inches or metric setting in effect. The latter settings is also used as default units for editing with
"xfig".
pointsmax <max points> sets the maximum number of points per polyline.
solid inhibits automatic usage of dashed lines when solid linestyles are used up, which otherwise occurs.
font sets the text font face to <fontname> and its size to <fontsize> points. textnormal resets the text
flags and selects postscript fonts, textspecial sets the text flags for LaTeX specials, texthidden sets the
hidden flag and textrigid the rigid flag.
depth sets the default depth layer for all lines and text. The default depth is 10 to leave room for adding
material with "xfig" on top of the plot.
version sets the format version of the generated fig output. Currently only versions 3.1 and 3.2 are supported.
thickness sets the default line thickness, which is 1 if not specified. Overriding the thickness can be achieved
by adding a multiple of 100 to the linetype value for a plot command. In a similar way the depth of plot
elements (with respect to the default depth) can be controlled by adding a multiple of 1000 to <linetype>.
The depth is then <layer> + <linetype>/1000 and the thickness is (<linetype>%1000)/100 or, if that is
zero, the default line thickness. linewidth is a synonym for thickness.
Additional point-plot symbols are also available with the fig driver. The symbols can be used through
pointtype values % 100 above 50, with different fill intensities controlled by <pointtype> % 5 and outlines
in black (for <pointtype> % 10 < 5) or in the current color. Available symbols are
50 - 59:
60 - 69:
circles
squares
194
gnuplot 4.7
70 - 79:
80 - 89:
90 - 99:
diamonds
upwards triangles
downwards triangles
The size of these symbols is linked to the font size. The depth of symbols is by default one less than
the depth for lines to achieve nice error bars. If <pointtype> is above 1000, the depth is <layer> +
<pointtype>/1000-1. If <pointtype>%1000 is above 100, the fill color is (<pointtype>%1000)/100-1.
Available fill colors are (from 1 to 9): black, blue, green, cyan, red, magenta, yellow, white and dark blue
(in monochrome mode: black for 1 to 6 and white for 7 to 9).
See plot with (p. 91) for details of <linetype> and <pointtype>.
The big option is a substitute for the bfig terminal in earlier versions, which is no longer supported.
Examples:
set terminal fig monochrome small pointsmax 1000
# defaults
plot ’file.dat’ with points linetype 102 pointtype 759
would produce circles with a blue outline of width 1 and yellow fill color.
plot ’file.dat’ using 1:2:3 with err linetype 1 pointtype 554
would produce errorbars with black lines and circles filled red. These circles are one layer above the lines
(at depth 9 by default).
To plot the error bars on top of the circles use
plot ’file.dat’ using 1:2:3 with err linetype 1 pointtype 2554
Ggi
The ggi driver can run on different targets as X or svgalib.
Syntax:
set terminal ggi [acceleration <integer>] [[mode] {mode}]
In X the window cannot be resized using window manager handles, but the mode can be given with the
mode option, e.g.:
-
V1024x768
V800x600
V640x480
V320x200
Please refer to the ggi documentation for other modes. The ’mode’ keyword is optional. It is recommended
to select the target by environment variables as explained in the libggi manual page. To get DGA on X, you
should for example
bash> export GGI_DISPLAY=DGA
csh> setenv GGI_DISPLAY DGA
’acceleration’ is only used for targets which report relative pointer motion events (e.g. DGA) and is a strictly
positive integer multiplication factor for the relative distances. The default for acceleration is 7.
Examples:
set term ggi acc 10
set term ggi acc 1 mode V1024x768
set term ggi V1024x768
gnuplot 4.7
195
Gif
Syntax:
set terminal gif
{{no}enhanced}
{{no}transparent} {rounded|butt}
{linewidth <lw>} {dashlength <dl>}
{tiny | small | medium | large | giant}
{font "<face> {,<pointsize>}"} {fontscale <scale>}
{size <x>,<y>} {{no}crop}
{animate {delay <d>} {loop <n>} {{no}optimize}}
{background <rgb_color>}
PNG, JPEG and GIF images are created using the external library libgd. GIF plots may be viewed interactively by piping the output to the ’display’ program from the ImageMagick package as follows:
set term gif
set output ’| display gif:-’
You can view the output from successive plot commands interactively by typing <space> in the display
window. To save the current plot to a file, left click in the display window and choose save.
transparent instructs the driver to make the background color transparent. Default is notransparent.
The linewidth and dashlength options are scaling factors that affect all lines drawn, i.e. they are multiplied
by values requested in various drawing commands.
butt instructs the driver to use a line drawing method that does not overshoot the desired end point of a
line. This setting is only applicable for line widths greater than 1. This setting is most useful when drawing
horizontal or vertical lines. Default is rounded.
The details of font selection are complicated. Two equivalent simple examples are given below:
set term gif font arial 11
set term gif font "arial,11"
For more information please see the separate section under fonts (p. 32).
The animate option is available only if your local gd library supports the creation of animated gifs. The
default delay between display of successive images may be specified in units of 1/100 second (default 5).
The actual delay may vary depending on the program used as a viewer. Number of animation loops can
be specified, default 0 means infinity. An animation sequence is terminated by the next set output or set
term command. The optimize option has two effects on the animation.
1) A single color map is used for the entire animation. This requires that all colors used in any frame of the
animation are already defined in the first frame.
2) If possible, only the portions of a frame that differ from the previous frame are stored in the animation
file. This space saving may not be possible if the animation uses transparency.
Both of these optimizations are intended to produce a smaller output file, but the decrease in size is probably
only significant for long animations or very small frame sizes. The nooptimize option turns off both of
the effects just described. Each frame is stored in its entirety along with a private color map. Note that it
is possible to post-process a non-optimized animation using external utilities, and this post-processing can
yield a smaller file than gnuplot’s internal optimization mode. The default is nooptimize.
The output plot size <x,y> is given in pixels — it defaults to 640x480. Please see additional information
under canvas (p. 21) and set size (p. 145). Blank space at the edges of the finished plot may be trimmed
using the crop option, resulting in a smaller final image size. Default is nocrop.
The background color must be given in the form ’xrrggbb’, where x is the literal character ’x’ and ’rrggbb’
are the red, green and blue components in hexadecimal. For example, ’x00ff00’ is green. The specification
of additional colors other than the background is deprecated.
Examples
set terminal gif medium size 640,480 xffffff
196
gnuplot 4.7
Use the medium size built-in non-scaleable, non-rotatable font. Use white (xffffff) for the non-transparent
background.
set terminal gif font arial 14 enhanced
Searches for a scalable font with face name ’arial’ and sets the font size to 14pt. Please see fonts (p. 32)
for details of how the font search is done. Because this is a scalable font, we can use enhanced text mode.
set term gif animate transparent opt delay 10 size 200,200 x000000
load "animate2.dem"
Open the gif terminal for creation of an animated gif file. The individual frames of the animation sequence
are created by the script file animate2.dem from the standard collection of demos.
Gpic
The gpic terminal driver generates GPIC graphs in the Free Software Foundations’s "groff" package. The
default size is 5 x 3 inches. The only option is the origin, which defaults to (0,0).
Syntax:
set terminal gpic {<x> <y>}
where x and y are in inches.
A simple graph can be formatted using
groff -p -mpic -Tps file.pic > file.ps.
The output from pic can be pipe-lined into eqn, so it is possible to put complex functions in a graph with
the set label and set {x/y}label commands. For instance,
set ylab ’@space 0 int from 0 to x alpha ( t ) roman d t@’
will label the y axis with a nice integral if formatted with the command:
gpic filename.pic | geqn -d@@ -Tps | groff -m[macro-package] -Tps
> filename.ps
Figures made this way can be scaled to fit into a document. The pic language is easy to understand, so the
graphs can be edited by hand if need be. All co-ordinates in the pic-file produced by gnuplot are given as
x+gnuplotx and y+gnuploty. By default x and y are given the value 0. If this line is removed with an editor
in a number of files, one can put several graphs in one figure like this (default size is 5.0x3.0 inches):
.PS 8.0
x=0;y=3
copy "figa.pic"
x=5;y=3
copy "figb.pic"
x=0;y=0
copy "figc.pic"
x=5;y=0
copy "figd.pic"
.PE
This will produce an 8-inch-wide figure with four graphs in two rows on top of each other.
One can also achieve the same thing by specifying x and y in the command
set terminal gpic x y
Grass
The grass terminal driver gives gnuplot capabilities to users of the GRASS geographic information system.
Contact [email protected] for more information. Pages are written to the current frame of
the GRASS Graphics Window. There are no options.
gnuplot 4.7
197
Hp2623a
The hp2623a terminal driver supports the Hewlett Packard HP2623A. It has no options.
Hp2648
The hp2648 terminal driver supports the Hewlett Packard HP2647 and HP2648. It has no options.
Hp500c
The hp500c terminal driver supports the Hewlett Packard HP DeskJet 500c. It has options for resolution
and compression.
Syntax:
set terminal hp500c {<res>} {<comp>}
where res can be 75, 100, 150 or 300 dots per inch and comp can be "rle", or "tiff". Any other inputs are
replaced by the defaults, which are 75 dpi and no compression. Rasterization at the higher resolutions may
require a large amount of memory.
Hpgl
The hpgl driver produces HPGL output for devices like the HP7475A plotter. There are two options which
can be set: the number of pens and eject, which tells the plotter to eject a page when done. The default is
to use 6 pens and not to eject the page when done.
The international character sets ISO-8859-1 and CP850 are recognized via set encoding iso 8859 1 or set
encoding cp850 (see set encoding (p. 111) for details).
Syntax:
set terminal hpgl {<number_of_pens>} {eject}
The selection
set terminal hpgl 8 eject
is equivalent to the previous hp7550 terminal, and the selection
set terminal hpgl 4
is equivalent to the previous hp7580b terminal.
The pcl5 driver supports plotters such as the Hewlett-Packard Designjet 750C, the Hewlett-Packard Laserjet
III, and the Hewlett-Packard Laserjet IV. It actually uses HPGL-2, but there is a name conflict among the
terminal devices. It has several options which must be specified in the order indicated below:
Syntax:
set terminal pcl5 {mode <mode>} {<plotsize>}
{{color {<number_of_pens>}} | monochrome} {solid | dashed}
{font <font>} {size <fontsize>} {pspoints | nopspoints}
<mode> is landscape or portrait. <plotsize> is the physical plotting size of the plot, which is one of
the following: letter for standard (8 1/2" X 11") displays, legal for (8 1/2" X 14") displays, noextended
for (36" X 48") displays (a letter size ratio) or, extended for (36" X 55") displays (almost a legal size
ratio). color is for multi-pen (i.e. color) plots, and <number of pens> is the number of pens (i.e. colors)
used in color plots. monochrome is for one (e.g. black) pen plots. solid draws all lines as solid lines, or
dashed will draw lines with different dashed and dotted line patterns. <font> is stick, univers, cg times,
zapf dingbats, antique olive, arial, courier, garamond antigua, letter gothic, cg omega, albertus,
times new roman, clarendon, coronet, marigold, truetype symbols, or wingdings. <fontsize> is
198
gnuplot 4.7
the font size in points. The point type selection can be the standard default set by specifying nopspoints,
or the same set of point types found in the postscript terminal by specifying pspoints.
Note that built-in support of some of these options is printer device dependent. For instance, all the fonts
are supposedly supported by the HP Laserjet IV, but only a few (e.g. univers, stick) may be supported by
the HP Laserjet III and the Designjet 750C. Also, color obviously won’t work on the the laserjets since they
are monochrome devices.
Defaults: landscape, noextended, color (6 pens), solid, univers, 12 point,
and nopspoints.
With pcl5 international characters are handled by the printer; you just put the appropriate 8-bit character
codes into the text strings. You don’t need to bother with set encoding.
HPGL graphics can be imported by many software packages.
Hpljii
The hpljii terminal driver supports the HP Laserjet Series II printer. The hpdj driver supports the HP
DeskJet 500 printer. These drivers allow a choice of resolutions.
Syntax:
set terminal hpljii | hpdj {<res>}
where res may be 75, 100, 150 or 300 dots per inch; the default is 75. Rasterization at the higher resolutions
may require a large amount of memory.
The hp500c terminal is similar to hpdj; hp500c additionally supports color and compression.
Hppj
The hppj terminal driver supports the HP PaintJet and HP3630 printers. The only option is the choice of
font.
Syntax:
set terminal hppj {FNT5X9 | FNT9X17 | FNT13X25}
with the middle-sized font (FNT9X17) being the default.
Imagen
The imagen terminal driver supports Imagen laser printers. It is capable of placing multiple graphs on a
single page.
Syntax:
set terminal imagen {<fontsize>} {portrait | landscape}
{[<horiz>,<vert>]}
where fontsize defaults to 12 points and the layout defaults to landscape. <horiz> and <vert> are the
number of graphs in the horizontal and vertical directions; these default to unity.
Example:
set terminal imagen portrait [2,3]
puts six graphs on the page in three rows of two in portrait orientation.
Jpeg
Syntax:
gnuplot 4.7
199
set terminal jpeg
{{no}enhanced}
{{no}interlace}
{linewidth <lw>} {dashlength <dl>} {rounded|butt}
{tiny | small | medium | large | giant}
{font "<face> {,<pointsize>}"} {fontscale <scale>}
{size <x>,<y>} {{no}crop}
{background <rgb_color>}
PNG, JPEG and GIF images are created using the external library libgd. In most cases, PNG is to be
preferred for single plots, and GIF for animations. Both are loss-less image formats, and produce better
image quality than the lossy JPEG format. This is in particular noticeable for solid color lines against a
solid background, i.e. exactly the sort of image typically created by gnuplot.
The interlace option creates a progressive JPEG image. Default is nointerlace.
The linewidth and dashlength options are scaling factors that affect all lines drawn, i.e. they are multiplied
by values requested in various drawing commands.
butt instructs the driver to use a line drawing method that does not overshoot the desired end point of a
line. This setting is only applicable for line widths greater than 1. This setting is most useful when drawing
horizontal or vertical lines. Default is rounded.
The details of font selection are complicated. Two equivalent simple examples are given below:
set term jpeg font arial 11
set term jpeg font "arial,11"
For more information please see the separate section under fonts (p. 32).
The output plot size <x,y> is given in pixels — it defaults to 640x480. Please see additional information
under canvas (p. 21) and set size (p. 145). Blank space at the edges of the finished plot may be trimmed
using the crop option, resulting in a smaller final image size. Default is nocrop.
The background color must be given in the form ’xrrggbb’, where x is the literal character ’x’ and ’rrggbb’
are the red, green and blue components in hexadecimal. For example, ’x00ff00’ is green. The specification
of additional colors other than the background is deprecated.
Kyo
The kyo and prescribe terminal drivers support the Kyocera laser printer. The only difference between
the two is that kyo uses "Helvetica" whereas prescribe uses "Courier". There are no options.
Latex
Syntax:
set terminal {latex | emtex} {default | {courier|roman} {<fontsize>}}
{size <XX>{unit}, <YY>{unit}} {rotate | norotate}
By default the plot will inherit font settings from the embedding document. You have the option of forcing
either Courier (cmtt) or Roman (cmr) fonts instead. In this case you may also specify a fontsize. Unless
your driver is capable of building fonts at any size (e.g. dvips), stick to the standard 10, 11 and 12 point
sizes.
METAFONT users beware: METAFONT does not like odd sizes.
All drivers for LaTeX offer a special way of controlling text positioning: If any text string begins with ’{’,
you also need to include a ’}’ at the end of the text, and the whole text will be centered both horizontally
and vertically. If the text string begins with ’[’, you need to follow this with a position specification (up to
two out of t,b,l,r), ’]{’, the text itself, and finally ’}’. The text itself may be anything LaTeX can typeset as
an LR-box. ’\rule{}{}’s may help for best positioning.
Points, among other things, are drawn using the LaTeX commands "\Diamond" and "\Box". These commands no longer belong to the LaTeX2e core; they are included in the latexsym package, which is part of
200
gnuplot 4.7
the base distribution and thus part of any LaTeX implementation. Please do not forget to use this package.
Other point types use symbols from the amssymb package.
The default size for the plot is 5 inches by 3 inches. The size option changes this to whatever the user
requests. By default the X and Y sizes are taken to be in inches, but other units are possible (currently only
cm).
If ’rotate’ is specified, rotated text, especially a rotated y-axis label, is possible (the packages graphics or
graphicx are needed). The ’stacked’ y-axis label mechanism is then deactivated.
Examples: About label positioning: Use gnuplot defaults (mostly sensible, but sometimes not really best):
set title ’\LaTeX\ -- $ \gamma $’
Force centering both horizontally and vertically:
set label ’{\LaTeX\ -- $ \gamma $}’ at 0,0
Specify own positioning (top here):
set xlabel ’[t]{\LaTeX\ -- $ \gamma $}’
The other label – account for long ticlabels:
set ylabel ’[r]{\LaTeX\ -- $ \gamma $\rule{7mm}{0pt}}’
Linux
The linux driver has no additional options to specify. It looks at the environment variable GSVGAMODE
for the default mode; if not set, it uses 1024x768x256 as default mode or, if that is not possible, 640x480x16
(standard VGA).
Lua
The lua generic terminal driver works in conjunction with an external Lua script to create a target-specific
plot file. Currently the only supported target is TikZ -> pdflatex.
Information about Lua is available at http://www.lua.org .
Syntax:
set terminal lua <target name> | "<file name>"
{<script_args> ...}
{help}
A ’target name’ or ’file name’ (in quotes) for a script is mandatory. If a ’target name’ for the script is
given, the terminal will look for "gnuplot-<target name>.lua" in the local directory and on failure in the
environmental variable GNUPLOT LUA DIR.
All arguments will be provided to the selected script for further evaluation. E.g. ’set term lua tikz help’ will
cause the script itself to print additional help on options and choices for the script.
Lua tikz
The TikZ driver is one output mode of the generic Lua terminal.
Syntax:
set terminal lua tikz
{latex | tex | context}
{color | monochrome}
{dashed | solid}
{nooriginreset | originreset}
{nogparrows | gparrows}
gnuplot 4.7
201
{nogppoints | gppoints}
{picenvironment | nopicenvironment}
{noclip | clip}
{notightboundingbox | tightboundingbox}
{background "<colorpec>"}
{size <x>{unit},<y>{unit}}
{scale <x>,<y>}
{plotsize <x>{unit},<y>{unit}}
{charsize <x>{unit},<y>{unit}}
{font "<fontdesc>"}
{{fontscale | textscale} <scale>}
{nofulldoc | nostandalone | fulldoc | standalone}
{{preamble | header} "<preamble_string>"}
{tikzplot <ltn>,...}
{notikzarrows | tikzarrows}
{rgbimages | cmykimages}
{noexternalimages|externalimages}
{bitmap | nobitmap}
{providevars <var name>,...}
{createstyle}
{help}
For all options that expect lengths as their arguments they will default to ’cm’ if no unit is specified. For all
lengths the following units may be used: ’cm’, ’mm’, ’in’ or ’inch’, ’pt’, ’pc’, ’bp’, ’dd’, ’cc’. Blanks between
numbers and units are not allowed.
’monochrome’ disables line coloring and switches to grayscaled fills.
’solid’ use only solid lines.
’originreset’ moves the origin of the TikZ picture to the lower left corner of the plot. It may be used to align
several plots within one tikzpicture environment. This is not tested with multiplots and pm3d plots!
’gparrows’ use gnuplot’s internal arrow drawing function instead of the ones provided by TikZ.
’gppoints’ use gnuplot’s internal plotmark drawing function instead of the ones provided by TikZ.
’nopicenvironment’ omits the declaration of the ’tikzpicture’ environment in order to set it manually. This
permits putting some PGF/TikZ code directly before or after the plot.
’clip’ crops the plot at the defined canvas size. Default is ’noclip’ by which only a minimum bounding box of
the canvas size is set. Neither a fixed bounding box nor a crop box is set if the ’plotsize’ or ’tightboundingbox’
option is used.
If ’tightboundingbox’ is set the ’clip’ option is ignored and the final bounding box is the natural bounding
box calculated by tikz.
’background’ sets the background color to the value specified in the <colorpec> argument. <colorspec>
must be a valid color name or a 3 byte RGB code as a hexadecimal number with a preceding number sign
(’#’). E.g. ’#ff0000’ specifies pure red. If omitted the background is transparent.
The ’size’ option expects two lenghts <x> and <y> as the canvas size. The default size of the canvas is
12.5cm x 8.75cm.
The ’scale’ option works similar to the ’size’ option but expects scaling factors <x> and <y> instead of
lengths.
The ’plotsize’ option permits setting the size of the plot area instead of the canvas size, which is the usual
gnuplot behaviour. Using this option may lead to slightly asymmetric tic lengths. Like ’originreset’ this
option may not lead to convenient results if used with multiplots or pm3d plots. An alternative approach is
to set all margins to zero and to use the ’noclip’ option. The plot area has then the dimensions of the given
canvas sizes.
The ’charsize’ option expects the average horizontal and vertical size of the used font. Look at the generated
style file for an example of how to use it from within your TeX document.
202
gnuplot 4.7
’fontscale’ or ’textscale’ expects a scaling factor as a parameter. All texts in the plot are scaled by this factor
then.
The options ’tex’, ’latex’ and ’context’ choose the TeX output format. LaTeX is the default. To load the
style file put the according line at the beginning of your document:
\input gnuplot-lua-tikz.tex
\usepackage{gnuplot-lua-tikz}
\usemodule[gnuplot-lua-tikz]
% (for plain TeX)
% (for LaTeX)
% (for ConTeXt)
’createstyle’ derives the TeX/LaTeX/ConTeXt styles from the script and writes them to the appropriate
files.
’fulldoc’ or ’standalone’ produces a full LaTeX document for direct compilation.
’preamble’ or ’header’ may be used to put any additional LaTeX code into the document preamble in
standalone mode.
With the ’tikzplot’ option the ’\path plot’ command will be used instead of only ’\path’. The following list
of numbers of linetypes (<ltn>,...) defines the affected plotlines. There exists a plotstyle for every linetype.
The default plotstyle is ’smooth’ for every linetype >= 1.
By using the ’tikzarrows’ option the gnuplot arrow styles defined by the user will be mapped to TikZ arrow
styles. This is done by ’misusing’ the angle value of the arrow definition. E.g. an arrow style with the angle
’7’ will be mapped to the TikZ style ’gp arrow 7’ ignoring all the other given values. By default the TikZ
terminal uses the stealth’ arrow tips for all arrows. To obtain the default gnuplot behaviour please use the
’gparrows’ option.
With ’cmykimages’ the CMYK color model will be used for inline image data instead of the RGB model.
All other colors (like line colors etc.) are not affected by this option, since they are handled e.g. by LaTeX’s
xcolor package. This option is ignored if images are externalized.
By using the ’externalimages’ option all bitmap images will be written as external PNG images and included
at compile time of the document. Generating DVI and later postscript files requires to convert the PNGs
into EPS files in a seperate step e.g. by using ImageMagick’s convert. Transparent bitmap images are
always generated as an external PNGs.
The ’nobitmap’ option let images be rendered as filled rectangles instead of the nativ PS or PDF inline image
format. This option is ignored if images are externalized.
The ’providevars’ options makes gnuplot’s internal and user variables available by using the ’\gpgetvar{<var
name>}’ commmand within the TeX script. Use gnuplot’s ’show variables all’ command to see the list of
valid variables.
The <fontdesc> string may contain any valid TeX/LaTeX/ConTeXt font commands like e.g. ’\small’. It
is passed directly as a node parameter in form of "font={<fontdesc>}". This can be ’misused’ to add
further code to a node, e.g. ’\small,yshift=1ex’ or ’,yshift=1ex’ are also valid while the latter does not
change the current font settings. One exception is the second argument of the list. If it is a number of
the form <number>{unit} it will be interpreted as a fontsize like in other terminals and will be appended
to the first argument. If the unit is omitted the value is interpreted as ’pt’. As an example the string
’\sffamily,12,fill=red’ sets the font to LaTeX’s sans serif font at a size of 12pt and red background color. The
same applies to ConTeXt, e.g. ’\switchtobodyfont[iwona],10’ changes the font to Iwona at a size of 10pt.
Plain TeX users have to change the font size explicitly within the first argument. The second should be set
to the same value to get proper scaling of text boxes.
Strings have to be put in single or double quotes. Double quoted strings may contain special characters like
newlines ’\n’ etc.
Mf
The mf terminal driver creates an input file to the METAFONT program. Thus a figure may be used in
the TeX document in the same way as is a character.
To use a picture in a document, the METAFONT program must be run with the output file from gnuplot
as input. Thus, the user needs a basic knowledge of the font creating process and the procedure for including
gnuplot 4.7
203
a new font in a document. However, if the METAFONT program is set up properly at the local site, an
unexperienced user could perform the operation without much trouble.
The text support is based on a METAFONT character set. Currently the Computer Modern Roman font
set is input, but the user is in principal free to choose whatever fonts he or she needs. The METAFONT
source files for the chosen font must be available. Each character is stored in a separate picture variable in
METAFONT. These variables may be manipulated (rotated, scaled etc.) when characters are needed. The
drawback is the interpretation time in the METAFONT program. On some machines (i.e. PC) the limited
amount of memory available may also cause problems if too many pictures are stored.
The mf terminal has no options.
METAFONT Instructions
- Set your terminal to METAFONT:
set terminal mf
- Select an output-file, e.g.:
set output "myfigures.mf"
- Create your pictures. Each picture will generate a separate character. Its default size will be 5*3 inches.
You can change the size by saying set size 0.5,0.5 or whatever fraction of the default size you want to have.
- Quit gnuplot.
- Generate a TFM and GF file by running METAFONT on the output of gnuplot. Since the picture is quite
large (5*3 in), you will have to use a version of METAFONT that has a value of at least 150000 for memmax.
On Unix systems these are conventionally installed under the name bigmf. For the following assume that
the command virmf stands for a big version of METAFONT. For example:
- Invoke METAFONT:
virmf ’&plain’
- Select the output device: At the METAFONT prompt (’*’) type:
\mode:=CanonCX;
% or whatever printer you use
- Optionally select a magnification:
mag:=1;
% or whatever you wish
- Input the gnuplot-file:
input myfigures.mf
On a typical Unix machine there will usually be a script called "mf" that executes virmf ’&plain’, so you
probably can substitute mf for virmf &plain. This will generate two files: mfput.tfm and mfput.$$$gf (where
$$$ indicates the resolution of your device). The above can be conveniently achieved by typing everything
on the command line, e.g.: virmf ’&plain’ ’\mode:=CanonCX; mag:=1; input myfigures.mf’ In this case the
output files will be named myfigures.tfm and myfigures.300gf.
- Generate a PK file from the GF file using gftopk:
gftopk myfigures.300gf myfigures.300pk
The name of the output file for gftopk depends on the DVI driver you use. Ask your local TeX administrator
about the naming conventions. Next, either install the TFM and PK files in the appropriate directories, or
set your environment variables properly. Usually this involves setting TEXFONTS to include the current
directory and doing the same thing for the environment variable that your DVI driver uses (no standard
name here...). This step is necessary so that TeX will find the font metric file and your DVI driver will find
the PK file.
- To include your pictures in your document you have to tell TeX the font:
\font\gnufigs=myfigures
204
gnuplot 4.7
Each picture you made is stored in a single character. The first picture is character 0, the second is character
1, and so on... After doing the above step, you can use the pictures just like any other characters. Therefore,
to place pictures 1 and 2 centered in your document, all you have to do is:
\centerline{\gnufigs\char0}
\centerline{\gnufigs\char1}
in plain TeX. For LaTeX you can, of course, use the picture environment and place the picture wherever you
wish by using the \makebox and \put macros.
This conversion saves you a lot of time once you have generated the font; TeX handles the pictures as
characters and uses minimal time to place them, and the documents you make change more often than the
pictures do. It also saves a lot of TeX memory. One last advantage of using the METAFONT driver is that
the DVI file really remains device independent, because no \special commands are used as in the eepic and
tpic drivers.
Mif
The mif terminal driver produces Frame Maker MIF format version 3.00. It plots in MIF Frames with the
size 15*10 cm, and plot primitives with the same pen will be grouped in the same MIF group. Plot primitives
in a gnuplot page will be plotted in a MIF Frame, and several MIF Frames are collected in one large MIF
Frame. The MIF font used for text is "Times".
Several options may be set in the MIF 3.00 driver.
Syntax:
set terminal mif {color | colour | monochrome} {polyline | vectors}
{help | ?}
colour plots lines with line types >= 0 in colour (MIF sep. 2–7) and monochrome plots all line types
in black (MIF sep. 0). polyline plots curves as continuous curves and vectors plots curves as collections
of vectors. help and ? print online help on standard error output — both print a short description of the
usage; help also lists the options.
Examples:
set
set
set
set
term
term
term
term
mif colour polylines
mif
mif vectors
mif help
# defaults
# defaults
Mp
The mp driver produces output intended to be input to the Metapost program. Running Metapost on the
file creates EPS files containing the plots. By default, Metapost passes all text through TeX. This has the
advantage of allowing essentially any TeX symbols in titles and labels.
Syntax:
set term mp {color | colour | monochrome}
{solid | dashed}
{notex | tex | latex}
{magnification <magsize>}
{psnfss | psnfss-version7 | nopsnfss}
{prologues <value>}
{a4paper}
{amstex}
{"<fontname> {,<fontsize>}"}
The option color causes lines to be drawn in color (on a printer or display that supports it), monochrome
(or nothing) selects black lines. The option solid draws solid lines, while dashed (or nothing) selects lines
gnuplot 4.7
205
with different patterns of dashes. If solid is selected but color is not, nearly all lines will be identical. This
may occasionally be useful, so it is allowed.
The option notex bypasses TeX entirely, therefore no TeX code can be used in labels under this option.
This is intended for use on old plot files or files that make frequent use of common characters like $ and %
that require special handling in TeX.
The option tex sets the terminal to output its text for TeX to process.
The option latex sets the terminal to output its text for processing by LaTeX. This allows things like
\frac for fractions which LaTeX knows about but TeX does not. Note that you must set the environment
variable TEX to the name of your LaTeX executable (normally latex) if you use this option or use mpost
–tex=<name of LaTeX executable> .... Otherwise metapost will try and use TeX to process the text
and it won’t work.
Changing font sizes in TeX has no effect on the size of mathematics, and there is no foolproof way to make
such a change, except by globally setting a magnification factor. This is the purpose of the magnification
option. It must be followed by a scaling factor. All text (NOT the graphs) will be scaled by this factor. Use
this if you have math that you want at some size other than the default 10pt. Unfortunately, all math will
be the same size, but see the discussion below on editing the MP output. mag will also work under notex
but there seems no point in using it as the font size option (below) works as well.
The option psnfss uses postscript fonts in combination with LaTeX. Since this option only makes sense, if
LaTeX is being used, the latex option is selected automatically. This option includes the following packages
for LaTeX: inputenc(latin1), fontenc(T1), mathptmx, helvet(scaled=09.2), courier, latexsym and textcomp.
The option psnfss-version7 uses also postscript fonts in LaTeX (option latex is also automatically selected),
but uses the following packages with LaTeX: inputenc(latin1), fontenc(T1), times, mathptmx, helvet and
courier.
The option nopsnfss is the default and uses the standard font (cmr10 if not otherwise specified).
The option prologues takes a value as an additional argument and adds the line prologues:=<value>
to the metapost file. If a value of 2 is specified metapost uses postscript fonts to generate the eps-file, so
that the result can be viewed using e.g. ghostscript. Normally the output of metapost uses TeX fonts and
therefore has to be included in a (La)TeX file before you can look at it.
The option noprologues is the default. No additional line specifying the prologue will be added.
The option a4paper adds a [a4paper] to the documentclass. Normally letter paper is used (default). Since
this option is only used in case of LaTeX, the latex option is selected automatically.
The option amstex automatically selects the latex option and includes the following LaTeX packages:
amsfonts, amsmath(intlimits). By default these packages are not included.
A name in quotes selects the font that will be used when no explicit font is given in a set label or set
title. A name recognized by TeX (a TFM file exists) must be used. The default is "cmr10" unless notex
is selected, then it is "pcrr8r" (Courier). Even under notex, a TFM file is needed by Metapost. The file
pcrr8r.tfm is the name given to Courier in LaTeX’s psnfss package. If you change the font from the notex
default, choose a font that matches the ASCII encoding at least in the range 32-126. cmtt10 almost works,
but it has a nonblank character in position 32 (space).
The size can be any number between 5.0 and 99.99. If it is omitted, 10.0 is used. It is advisable to use
magstep sizes: 10 times an integer or half-integer power of 1.2, rounded to two decimals, because those are
the most available sizes of fonts in TeX systems.
All the options are optional. If font information is given, it must be at the end, with size (if present) last.
The size is needed to select a size for the font, even if the font name includes size information. For example,
set term mp "cmtt12" selects cmtt12 shrunk to the default size 10. This is probably not what you want
or you would have used cmtt10.
The following common ascii characters need special treatment in TeX:
$, &, #, %, _; |, <, >; ^, ~, \, {, and }
The five characters $, #, &, , and % can simply be escaped, e.g., \$. The three characters <, >, and | can
be wrapped in math mode, e.g., $<$. The remainder require some TeX work-arounds. Any good book on
TeX will give some guidance.
206
gnuplot 4.7
If you type your labels inside double quotes, backslashes in TeX code need to be escaped (doubled). Using
single quotes will avoid having to do this, but then you cannot use \n for line breaks. As of this writing, version 3.7 of gnuplot processes titles given in a plot command differently than in other places, and backslashes
in TeX commands need to be doubled regardless of the style of quotes.
Metapost pictures are typically used in TeX documents. Metapost deals with fonts pretty much the same way
TeX does, which is different from most other document preparation programs. If the picture is included in
a LaTeX document using the graphics package, or in a plainTeX document via epsf.tex, and then converted
to PostScript with dvips (or other dvi-to-ps converter), the text in the plot will usually be handled correctly.
However, the text may not appear if you send the Metapost output as-is to a PostScript interpreter.
Metapost Instructions
- Set your terminal to Metapost, e.g.:
set terminal mp mono "cmtt12" 12
- Select an output-file, e.g.:
set output "figure.mp"
- Create your pictures. Each plot (or multiplot group) will generate a separate Metapost beginfig...endfig
group. Its default size will be 5 by 3 inches. You can change the size by saying set size 0.5,0.5 or whatever
fraction of the default size you want to have.
- Quit gnuplot.
- Generate EPS files by running Metapost on the output of gnuplot:
mpost figure.mp
OR
mp figure.mp
The name of the Metapost program depends on the system, typically mpost for a Unix machine and mp
on many others. Metapost will generate one EPS file for each picture.
- To include your pictures in your document you can use the graphics package in LaTeX or epsf.tex in
plainTeX:
\usepackage{graphics} % LaTeX
\input epsf.tex
% plainTeX
If you use a driver other than dvips for converting TeX DVI output to PS, you may need to add the following
line in your LaTeX document:
\DeclareGraphicsRule{*}{eps}{*}{}
Each picture you made is in a separate file. The first picture is in, e.g., figure.0, the second in figure.1, and
so on.... To place the third picture in your document, for example, all you have to do is:
\includegraphics{figure.2} % LaTeX
\epsfbox{figure.2}
% plainTeX
The advantage, if any, of the mp terminal over a postscript terminal is editable output. Considerable effort
went into making this output as clean as possible. For those knowledgeable in the Metapost language, the
default line types and colors can be changed by editing the arrays lt[] and col[]. The choice of solid vs dashed
lines, and color vs black lines can be change by changing the values assigned to the booleans dashedlines
and colorlines. If the default tex option was in effect, global changes to the text of labels can be achieved
by editing the vebatimtex...etex block. In particular, a LaTeX preamble can be added if desired, and then
LaTeX’s built-in size changing commands can be used for maximum flexibility. Be sure to set the appropriate
MP configuration variable to force Metapost to run LaTeX instead of plainTeX.
Next
Several options may be set in the next driver.
Syntax:
gnuplot 4.7
207
set terminal next {<mode>} {<type> } {<color>} {<dashed>}
{"<fontname>"} {<fontsize>} title {"<newtitle>"}
where <mode> is default, which sets all options to their defaults; <type> is either new or old, where
old invokes the old single window; <color> is either color or monochrome; <dashed> is either solid
or dashed; "<fontname>" is the name of a valid PostScript font; <fontsize> is the size of the font in
PostScript points; and <title> is the title for the GnuTerm window. Defaults are new, monochrome,
dashed, "Helvetica", 14pt.
Examples:
set
set
set
set
set
term
term
term
term
term
next
next
next
next
next
default
22
color "Times-Roman" 14
color "Helvetica" 12 title "MyPlot"
old
Pointsizes may be changed with set linestyle.
Openstep (next)
Several options may be set in the openstep (next) driver.
Syntax:
set terminal openstep {<mode>} {<type> } {<color>} {<dashed>}
{"<fontname>"} {<fontsize>} title {"<newtitle>"}
where <mode> is default, which sets all options to their defaults; <type> is either new or old, where
old invokes the old single window; <color> is either color or monochrome; <dashed> is either solid
or dashed; "<fontname>" is the name of a valid PostScript font; <fontsize> is the size of the font in
PostScript points; and <title> is the title for the GnuTerm window. Defaults are new, monochrome,
dashed, "Helvetica", 14pt.
Examples:
set
set
set
set
set
term
term
term
term
term
openstep
openstep
openstep
openstep
openstep
default
22
color "Times-Roman" 14
color "Helvetica" 12 title "MyPlot"
old
Pointsizes may be changed with set linestyle.
Pbm
Syntax:
set terminal pbm {<fontsize>} {<mode>} {size <x>,<y>}
where <fontsize> is small, medium, or large and <mode> is monochrome, gray or color. The default
plot size is 640 pixels wide and 480 pixels high. The output size is white-space padded to the nearest multiple
of 8 pixels on both x and y. This empty space may be cropped later if needed.
The output of the pbm driver depends upon <mode>: monochrome produces a portable bitmap (one bit
per pixel), gray a portable graymap (three bits per pixel) and color a portable pixmap (color, four bits per
pixel).
The output of this driver can be used with various image conversion and manipulation utilities provided by
NETPBM. Based on Jef Poskanzer’s PBMPLUS package, NETPBM provides programs to convert the above
PBM formats to GIF, TIFF, MacPaint, Macintosh PICT, PCX, X11 bitmap and many others. Complete
information is available at http://netpbm.sourceforge.net/.
Examples:
208
gnuplot 4.7
set terminal pbm small monochrome
# defaults
set terminal pbm color medium size 800,600
set output ’| pnmrotate 45 | pnmtopng > tilted.png’ # uses NETPBM
Pdf
This terminal produces files in the Adobe Portable Document Format (PDF), useable for printing or display
with tools like Acrobat Reader
Syntax:
set terminal pdf {monochrome|color|colour}
{{no}enhanced}
{fname "<font>"} {fsize <fontsize>}
{font "<fontname>{,<fontsize>}"} {fontscale <scale>}
{linewidth <lw>} {rounded|butt}
{solid|dashed} {dl <dashlength>}}
{size <XX>{unit},<YY>{unit}}
The default is to use a different color for each line type. Selecting monochome will use black for all
linetypes, in which case you probably want to select dashed to distinguish line types. Even in in mono
mode you can still use explicit colors for filled areas or linestyles.
where <font> is the name of the default font to use (default Helvetica) and <fontsize> is the font size
(in points, default 12). For help on which fonts are available or how to install new ones, please see the
documentation for your local installation of pdflib.
The enhanced option enables enhanced text processing features (subscripts, superscripts and mixed fonts).
See enhanced (p. 24).
The width of all lines in the plot can be increased by the factor <n> specified in linewidth. Similarly
dashlength is a multiplier for the default dash spacing.
rounded sets line caps and line joins to be rounded; butt is the default, butt caps and mitered joins.
The default size for PDF output is 5 inches by 3 inches. The size option changes this to whatever the user
requests. By default the X and Y sizes are taken to be in inches, but other units are possible (currently only
cm).
Pdfcairo
The pdfcairo terminal device generates output in pdf. The actual drawing is done via cairo, a 2D graphics
library, and pango, a library for laying out and rendering text.
Syntax:
set term pdfcairo
{{no}enhanced} {mono|color} {solid|dashed}
{font <font>} {fontscale <scale>}
{linewidth <lw>} {rounded|butt} {dashlength <dl>}
{size <XX>{unit},<YY>{unit}}
This terminal supports an enhanced text mode, which allows font and other formatting commands (subscripts, superscripts, etc.) to be embedded in labels and other text strings. The enhanced text mode syntax
is shared with other gnuplot terminal types. See enhanced (p. 24) for more details.
The width of all lines in the plot can be modified by the factor <lw> specified in linewidth. The default
linewidth is 0.25 points. (1 "PostScript" point = 1/72 inch = 0.353 mm)
rounded sets line caps and line joins to be rounded; butt is the default, butt caps and mitered joins.
The default size for the output is 5 inches x 3 inches. The size option changes this to whatever the user
requests. By default the X and Y sizes are taken to be in inches, but other units are possible (currently only
gnuplot 4.7
209
cm). Screen coordinates always run from 0.0 to 1.0 along the full length of the plot edges as specified by the
size option.
<font> is in the format "FontFace,FontSize", i.e. the face and the size comma-separated in a single string.
FontFace is a usual font face name, such as ’Arial’. If you do not provide FontFace, the pdfcairo terminal
will use ’Sans’. FontSize is the font size, in points. If you do not provide it, the pdfcairo terminal will use
a nominal font size of 12 points. However, the default fontscale parameter for this terminal is 0.5, so the
apparent font size is smaller than this if the pdf output is viewed at full size.
For example
set term
set term
set term
set term
:
pdfcairo
pdfcairo
pdfcairo
pdfcairo
font
font
font
font
"Arial,12"
"Arial" # to change the font face only
",12" # to change the font size only
"" # to reset the font name and size
The fonts are retrieved from the usual fonts subsystems. Under Windows, those fonts are to be found and
configured in the entry "Fonts" of the control panel. Under UNIX, they are handled by "fontconfig".
Pango, the library used to layout the text, is based on utf-8. Thus, the pdfcairo terminal has to convert from
your encoding to utf-8. The default input encoding is based on your ’locale’. If you want to use another
encoding, make sure gnuplot knows which one you are using. See encoding (p. 111) for more details.
Pango may give unexpected results with fonts that do not respect the unicode mapping. With the Symbol
font, for example, the pdfcairo terminal will use the map provided by http://www.unicode.org/ to translate character codes to unicode. Note that "the Symbol font" is to be understood as the Adobe Symbol
.PFB". Alternatively, the OpenSymbol font, distributed
font, distributed with Acrobat Reader as "SY
with OpenOffice.org as "opens .ttf", offers the same characters. Microsoft has distributed a Symbol font
("symbol.ttf"), but it has a different character set with several missing or moved mathematic characters. If
you experience problems with your default setup (if the demo enhancedtext.dem is not displayed properly
for example), you probably have to install one of the Adobe or OpenOffice Symbol fonts, and remove the
Microsoft one. Other non-conform fonts, such as "wingdings" have been observed working.
The rendering of the plot cannot be altered yet. To obtain the best output possible, the rendering involves two
mechanisms : antialiasing and oversampling. Antialiasing allows to display non-horizontal and non-vertical
lines smoother. Oversampling combined with antialiasing provides subpixel accuracy, so that gnuplot can
draw a line from non-integer coordinates. This avoids wobbling effects on diagonal lines (’plot x’ for example).
Pm
The pm terminal driver provides an OS/2 Presentation Manager window in which the graph is plotted. The
window is opened when the first graph is plotted. This window has its own online help as well as facilities
for printing, copying to the clipboard and some line type and color adjustments. The multiplot option is
supported.
Syntax:
set terminal pm {server {n}} {persist} {widelines} {enhanced} {"title"}
If persist is specified, each graph appears in its own window and all windows remain open after gnuplot
exits. If server is specified, all graphs appear in the same window, which remains open when gnuplot exits.
This option takes an optional numerical argument which specifies an instance of the server process. Thus
multiple server windows can be in use at the same time.
If widelines is specified, all plots will be drawn with wide lines. If enhanced is specified, sub- and
superscripts and multiple fonts are enabled (see enhanced text (p. 24) for details). Font names for the
core PostScript fonts may be abbreviated to a single letter (T/H/C/S for Times/Helvetica/Courier/Symbol).
If title is specified, it will be used as the title of the plot window. It will also be used as the name of the
server instance, and will override the optional numerical argument.
Linewidths may be changed with set linestyle.
210
gnuplot 4.7
Png
Syntax:
set terminal png
{{no}enhanced}
{{no}transparent} {{no}interlace}
{{no}truecolor} {rounded|butt}
{linewidth <lw>} {dashlength <dl>}
{tiny | small | medium | large | giant}
{font "<face> {,<pointsize>}"} {fontscale <scale>}
{size <x>,<y>} {{no}crop}
{background <rgb_color>}
PNG, JPEG and GIF images are created using the external library libgd. PNG plots may be viewed
interactively by piping the output to the ’display’ program from the ImageMagick package as follows:
set term png
set output ’| display png:-’
You can view the output from successive plot commands interactively by typing <space> in the display
window. To save the current plot to a file, left click in the display window and choose save.
transparent instructs the driver to make the background color transparent. Default is notransparent.
interlace instructs the driver to generate interlaced PNGs. Default is nointerlace.
The linewidth and dashlength options are scaling factors that affect all lines drawn, i.e. they are multiplied
by values requested in various drawing commands.
By default output png images use 256 indexed colors. The truecolor option instead creates TrueColor
images with 24 bits of color information per pixel. Transparent fill styles require the truecolor option. See
fillstyle (p. 148). A transparent background is possible in either indexed or TrueColor images.
butt instructs the driver to use a line drawing method that does not overshoot the desired end point of a
line. This setting is only applicable for line widths greater than 1. This setting is most useful when drawing
horizontal or vertical lines. Default is rounded.
The details of font selection are complicated. Two equivalent simple examples are given below:
set term png font arial 11
set term png font "arial,11"
For more information please see the separate section under fonts (p. 32).
The output plot size <x,y> is given in pixels — it defaults to 640x480. Please see additional information
under canvas (p. 21) and set size (p. 145). Blank space at the edges of the finished plot may be trimmed
using the crop option, resulting in a smaller final image size. Default is nocrop.
The background color must be given in the form ’xrrggbb’, where x is the literal character ’x’ and ’rrggbb’
are the red, green and blue components in hexadecimal. For example, ’x00ff00’ is green. The specification
of additional colors other than the background is deprecated.
Examples
set terminal png medium size 640,480 xffffff
Use the medium size built-in non-scaleable, non-rotatable font. Use white (xffffff) for the non-transparent
background.
set terminal png font arial 14 size 800,600
Searches for a scalable font with face name ’arial’ and sets the font size to 14pt. Please see fonts (p. 32)
for details of how the font search is done.
set terminal png transparent truecolor enhanced
Use 24 bits of color information per pixel, with a transparent background. Use the enhanced text mode
to control the layout of strings to be printed.
gnuplot 4.7
211
Pngcairo
The pngcairo terminal device generates output in png. The actual drawing is done via cairo, a 2D graphics
library, and pango, a library for laying out and rendering text.
Syntax:
set term pngcairo
{{no}enhanced} {mono|color} {solid|dashed}
{{no}transparent} {{no}crop} {background <rgbcolor>
{font <font>} {fontscale <scale>}
{linewidth <lw>} {rounded|butt} {dashlength <dl>}
{size <XX>{unit},<YY>{unit}}
This terminal supports an enhanced text mode, which allows font and other formatting commands (subscripts, superscripts, etc.) to be embedded in labels and other text strings. The enhanced text mode syntax
is shared with other gnuplot terminal types. See enhanced (p. 24) for more details.
The width of all lines in the plot can be modified by the factor <lw>.
rounded sets line caps and line joins to be rounded; butt is the default, butt caps and mitered joins.
The default size for the output is 640 x 480 pixels. The size option changes this to whatever the user
requests. By default the X and Y sizes are taken to be in pixels, but other units are possible (currently cm
and inch). A size given in centimeters or inches will be converted into pixels assuming a resolution of 72 dpi.
Screen coordinates always run from 0.0 to 1.0 along the full length of the plot edges as specified by the size
option.
<font> is in the format "FontFace,FontSize", i.e. the face and the size comma-separated in a single string.
FontFace is a usual font face name, such as ’Arial’. If you do not provide FontFace, the pngcairo terminal
will use ’Sans’. FontSize is the font size, in points. If you do not provide it, the pngcairo terminal will use a
size of 12 points.
For example :
set term pngcairo font "Arial,12"
set term pngcairo font "Arial" # to change the font face only
set term pngcairo font ",12" # to change the font size only
set term pngcairo font "" # to reset the font name and size
The fonts are retrieved from the usual fonts subsystems. Under Windows, those fonts are to be found and
configured in the entry "Fonts" of the control panel. Under UNIX, they are handled by "fontconfig".
Pango, the library used to layout the text, is based on utf-8. Thus, the pngcairo terminal has to convert
from your encoding to utf-8. The default input encoding is based on your ’locale’. If you want to use another
encoding, make sure gnuplot knows which one you are using. See encoding (p. 111) for more details.
Pango may give unexpected results with fonts that do not respect the unicode mapping. With the Symbol
font, for example, the pngcairo terminal will use the map provided by http://www.unicode.org/ to translate character codes to unicode. Note that "the Symbol font" is to be understood as the Adobe Symbol
.PFB". Alternatively, the OpenSymbol font, distributed
font, distributed with Acrobat Reader as "SY
with OpenOffice.org as "opens .ttf", offers the same characters. Microsoft has distributed a Symbol font
("symbol.ttf"), but it has a different character set with several missing or moved mathematic characters. If
you experience problems with your default setup (if the demo enhancedtext.dem is not displayed properly
for example), you probably have to install one of the Adobe or OpenOffice Symbol fonts, and remove the
Microsoft one. Other non-conform fonts, such as "wingdings" have been observed working.
The rendering of the plot cannot be altered yet. To obtain the best output possible, the rendering involves two
mechanisms : antialiasing and oversampling. Antialiasing allows to display non-horizontal and non-vertical
lines smoother. Oversampling combined with antialiasing provides subpixel accuracy, so that gnuplot can
draw a line from non-integer coordinates. This avoids wobbling effects on diagonal lines (’plot x’ for example).
Postscript
Several options may be set in the postscript driver.
212
gnuplot 4.7
Syntax:
set terminal postscript {default}
set terminal postscript {landscape | portrait | eps}
{enhanced | noenhanced}
{defaultplex | simplex | duplex}
{fontfile [add | delete] "<filename>"
| nofontfiles} {{no}adobeglyphnames}
{level1 | leveldefault}
{color | colour | monochrome}
{background <rgbcolor> | nobackground}
{solid | dashed}
{dashlength | dl <DL>}
{linewidth | lw <LW>}
{rounded | butt}
{clip | noclip}
{palfuncparam <samples>{,<maxdeviation>}}
{size <XX>{unit},<YY>{unit}}
{blacktext | colortext | colourtext}
{{font} "fontname{,fontsize}" {<fontsize>}}
{fontscale <scale>}
If you see the error message
"Can’t find PostScript prologue file ... "
Please see and follow the instructions in postscript prologue (p. 215).
landscape and portrait choose the plot orientation. eps mode generates EPS (Encapsulated PostScript)
output, which is just regular PostScript with some additional lines that allow the file to be imported into a
variety of other applications. (The added lines are PostScript comment lines, so the file may still be printed
by itself.) To get EPS output, use the eps mode and make only one plot per file. In eps mode the whole
plot, including the fonts, is reduced to half of the default size.
enhanced enables enhanced text mode features (subscripts, superscripts and mixed fonts). See enhanced
(p. 24) for more information. blacktext forces all text to be written in black even in color mode;
Duplexing in PostScript is the ability of the printer to print on both sides of the same sheet of paper. With
defaultplex, the default setting of the printer is used; with simplex only one side is printed; duplex prints
on both sides (ignored if your printer can’t do it).
"<fontname>" is the name of a valid PostScript font; and <fontsize> is the size of the font in PostScript
points. In addition to the standard postscript fonts, an oblique version of the Symbol font, useful for
mathematics, is defined. It is called "Symbol-Oblique".
default sets all options to their defaults: landscape, monochrome, dashed, dl 1.0, lw 1.0, defaultplex,
noenhanced, "Helvetica" and 14pt. Default size of a PostScript plot is 10 inches wide and 7 inches high.
The option color enables color, while monochrome prefers black and white drawing elements. Further,
monochrome uses gray palette but it does not change color of objects specified with an explicit colorspec.
solid draws all plots with solid lines, overriding any dashed patterns. dashlength or dl scales the length of
the dashed-line segments by <DL>, which is a floating-point number greater than zero. linewidth or lw
scales all linewidths by <LW>.
By default the generated PostScript code uses language features that were introduced in PostScript Level 2,
notably filters and pattern-fill of irregular objects such as filledcurves. PostScript Level 2 features are conditionally protected so that PostScript Level 1 interpreters do not issue errors but, rather, display a message
or a PostScript Level 1 approximation. The level1 option substitutes PostScript Level 1 approximations
of these features and uses no PostScript Level 2 code. This may be required by some old printers and old
versions of Adobe Illustrator. The flag level1 can be toggled later by editing a single line in the PostScript
output file to force PostScript Level 1 interpretation. In the case of files containing level 2 code, the above
features will not appear or will be replaced by a note when this flag is set or when the interpreting program
does not indicate that it understands level 2 PostScript or higher.
rounded sets line caps and line joins to be rounded; butt is the default, butt caps and mitered joins.
gnuplot 4.7
213
clip tells PostScript to clip all output to the bounding box; noclip is the default.
palfuncparam controls how set palette functions are encoded as gradients in the output. Analytic
color component functions (set via set palette functions) are encoded as linear interpolated gradients
in the postscript output: The color component functions are sampled at <samples> points and all points
are removed from this gradient which can be removed without changing the resulting colors by more than
<maxdeviation>. For almost every useful palette you may safely leave the defaults of <samples>=2000 and
<maxdeviation>=0.003 untouched.
The default size for postscript output is 10 inches x 7 inches. The default for eps output is 5 x 3.5 inches.
The size option changes this to whatever the user requests. By default the X and Y sizes are taken to be in
inches, but other units are possibly (currently only cm). The BoundingBox of the plot is correctly adjusted
to contain the resized image. Screen coordinates always run from 0.0 to 1.0 along the full length of the
plot edges as specified by the size option. NB: this is a change from the previously recommended
method of using the set size command prior to setting the terminal type. The old method left
the BoundingBox unchanged and screen coordinates did not correspond to the actual limits of the plot.
Fonts listed by fontfile or fontfile add encapsulate the font definitions of the listed font from a postscript
Type 1 or TrueType font file directly into the gnuplot output postscript file. Thus, the enclosed font can
be used in labels, titles, etc. See the section postscript fontfile (p. 214) for more details. With fontfile
delete, a fontfile is deleted from the list of embedded files. nofontfiles cleans the list of embedded fonts.
Examples:
set terminal postscript default
# old postscript
set terminal postscript enhanced
# old enhpost
set terminal postscript landscape 22 # old psbig
set terminal postscript eps 14
# old epsf1
set terminal postscript eps 22
# old epsf2
set size 0.7,1.4; set term post portrait color "Times-Roman" 14
set term post "VAGRoundedBT_Regular" 14 fontfile "bvrr8a.pfa"
Linewidths and pointsizes may be changed with set style line.
The postscript driver supports about 70 distinct pointtypes, selectable through the pointtype option on
plot and set style line.
Several possibly useful files about gnuplot’s PostScript are included in the /docs/psdoc subdirectory of the
gnuplot distribution and at the distribution sites. These are "ps symbols.gpi" (a gnuplot command file
that, when executed, creates the file "ps symbols.ps" which shows all the symbols available through the
postscript terminal), "ps guide.ps" (a PostScript file that contains a summary of the enhanced syntax and
a page showing what the octal codes produce with text and symbol fonts), "ps file.doc" (a text file that
contains a discussion of the organization of a PostScript file written by gnuplot), and "ps fontfile doc.tex"
(a LaTeX file which contains a short documentation concerning the encapsulation of LaTeX fonts with a
glyph table of the math fonts).
A PostScript file is editable, so once gnuplot has created one, you are free to modify it to your heart’s
desire. See the editing postscript (p. 213) section for some hints.
Editing postscript
The PostScript language is a very complex language — far too complex to describe in any detail in this
document. Nevertheless there are some things in a PostScript file written by gnuplot that can be changed
without risk of introducing fatal errors into the file.
For example, the PostScript statement "/Color true def" (written into the file in response to the command
set terminal postscript color), may be altered in an obvious way to generate a black-and-white version of
a plot. Similarly line colors, text colors, line weights and symbol sizes can also be altered in straight-forward
ways. Text (titles and labels) can be edited to correct misspellings or to change fonts. Anything can be
repositioned, and of course anything can be added or deleted, but modifications such as these may require
deeper knowledge of the PostScript language.
The organization of a PostScript file written by gnuplot is discussed in the text file "ps file.doc" in the
docs/ps subdirectory of the gnuplot source distribution.
214
gnuplot 4.7
Postscript fontfile
The fontfile or fontfile add option takes one file name as argument and encapsulates this file into the
postscript output in order to make this font available for text elements (labels, tic marks, titles, etc.). The
fontfile delete option also takes one file name as argument. It deletes this file name from the list of
encapsulated files.
The postscript terminal understands some font file formats: Type 1 fonts in ASCII file format (extension
".pfa"), Type 1 fonts in binary file format (extension ".pfb"), and TrueType fonts (extension ".ttf"). Pfa
files are understood directly, pfb and ttf files are converted on the fly if appropriate conversion tools are
installed (see below). You have to specify the full filename including the extension. Each fontfile option
takes exact one font file name. This option can be used multiple times in order to include more than one
font file.
The font file is searched in the working directory and in all directories listed in the fontpath which is
determined by set fontpath. In addition, the fontpath can be set using the environment variable GNUPLOT FONTPATH. If this is not set a system dependent default search list is used. See set fontpath
(p. 112) for more details.
For using the encapsulated font file you have to specify the font name (which normally is not the same as
the file name). When embedding a font file by using the fontfile option in interactive mode, the font name
is printed on the screen. E.g.
Font file ’p052004l.pfb’ contains the font ’URWPalladioL-Bold’. Location:
/usr/lib/X11/fonts/URW/p052004l.pfb
When using pfa or pfb fonts, you can also find it out by looking into the font file. There is a line similar
to "/FontName /URWPalladioL-Bold def". The middle string without the slash is the fontname, here
"URWPalladioL-Bold". For TrueType fonts, this is not so easy since the font name is stored in a binary
format. In addition, they often have spaces in the font names which is not supported by Type 1 fonts (in
which a TrueType is converted on the fly). The font names are changed in order to eliminate the spaces in
the fontnames. The easiest way to find out which font name is generated for use with gnuplot, start gnuplot
in interactive mode and type in "set terminal postscript fontfile ’<filename.ttf>’".
For converting font files (either ttf or pfb) to pfa format, the conversion tool has to read the font from a file
and write it to standard output. If the output cannot be written to standard output, on-the-fly conversion
is not possible.
For pfb files "pfbtops" is a tool which can do this. If this program is installed on your system the on
the fly conversion should work. Just try to encapsulate a pfb file. If the compiled in program call does
not work correctly you can specify how this program is called by defining the environment variable GNUPLOT PFBTOPFA e.g. to "pfbtops %s". The %s will be replaced by the font file name and thus has to
exist in the string.
If you don’t want to do the conversion on the fly but get a pfa file of the font you can use the tool "pfb2pfa"
which is written in simple c and should compile with any c compiler. It is available from many ftp servers,
e.g.
ftp://ftp.dante.de/tex-archive/fonts/utilities/ps2mf/
In fact, "pfbtopfa" and "pfb2ps" do the same job. "pfbtopfa" puts the resulting pfa code into a file, whereas
"pfbtops" writes it to standard output.
TrueType fonts are converted into Type 1 pfa format, e.g. by using the tool "ttf2pt1" which is available
from
http://ttf2pt1.sourceforge.net/
If the builtin conversion does not work, the conversion command can be changed by the environment variable
GNUPLOT TTFTOPFA. For usage with ttf2pt1 it may be set to "ttf2pt1 -a -e -W 0 %s - ". Here again,
%s stands for the file name.
For special purposes you also can use a pipe (if available for your operating system). Therefore you start
the file name definition with the character "<" and append a program call. This program has to write pfa
data to standard output. Thus, a pfa file may be accessed by set fontfile "< cat garamond.pfa".
For example, including Type 1 font files can be used for including the postscript output in LaTeX documents.
gnuplot 4.7
215
The "european computer modern" font (which is a variant of the "computer modern" font) is available in
pfb format from any CTAN server, e.g.
ftp://ftp.dante.de/tex-archive/fonts/ps-type1/cm-super/
For example, the file "sfrm1000.pfb" contains the normal upright fonts with serifs in the design size 10pt (font
name "SFRM1000"). The computer modern fonts, which are still necessary for mathematics, are available
from
ftp://ftp.dante.de/tex-archive/fonts/cm/ps-type1/bluesky
With these you can use any character available in TeX. However, the computer modern fonts have a strange
encoding. (This is why you should not use cmr10.pfb for text, but sfrm1000.pfb instead.) The usage of TeX
fonts is shown in one of the demos. The file "ps fontfile doc.tex" in the /docs/psdoc subdirectory of the
gnuplot source distribution contains a table with glyphs of the TeX mathfonts.
If the font "CMEX10" is embedded (file "cmex10.pfb") gnuplot defines the additional font "CMEX10Baseline". It is shifted vertically in order to fit better to the other glyphs (CMEX10 has its baseline at the
top of the symbols).
Postscript prologue
Each PostScript output file includes a %%Prolog section and possibly some additional user-defined sections
containing, for example, character encodings. These sections are copied from a set of PostScript prologue
files that are either compiled into the gnuplot executable or stored elsewhere on your computer. A default
directory where these files live is set at the time gnuplot is built. However, you can override this default
either by using the gnuplot command set psdir or by defining an environment variable GNUPLOT PS DIR.
See set psdir (p. 144).
Postscript adobeglyphnames
This setting is only relevant to PostScript output with UTF-8 encoding. It controls the names used to
describe characters with Unicode entry points higher than 0x00FF. That is, all characters outside of the
Latin1 set. In general unicode characters do not have a unique name; they have only a unicode identification
code. However, Adobe have a recommended scheme for assigning names to certain ranges of characters
(extended Latin, Greek, etc). Some fonts use this scheme, others do not. By default, gnuplot will use
the Adobe glyph names. E.g. the lower case Greek letter alpha will be called /alpha. If you specific
noadobeglyphnames then instead gnuplot will use /uni03B1 to describe this character. If you get this
setting wrong, the character may not be found even if it is present in the font. It is probably always correct
to use the default for Adobe fonts, but for other fonts you may have to try both settings. See also fontfile
(p. 214).
Pslatex and pstex
The pslatex driver generates output for further processing by LaTeX, while the pstex driver generates
output for further processing by TeX. pslatex uses \specials understandable by dvips and xdvi. Figures
generated by pstex can be included in any plain-based format (including LaTeX).
Syntax:
set terminal [pslatex | pstex] {default}
set terminal [pslatex | pstex]
{rotate | norotate}
{oldstyle | newstyle}
{auxfile | noauxfile}
{level1 | leveldefault}
{color | colour | monochrome}
{background <rgbcolor> | nobackground}
{solid | dashed}
{dashlength | dl <DL>}
216
gnuplot 4.7
{linewidth | lw <LW>}
{rounded | butt}
{clip | noclip}
{palfuncparam <samples>{,<maxdeviation>}}
{size <XX>{unit},<YY>{unit}}
{<font_size>}
If you see the error message
"Can’t find PostScript prologue file ... "
Please see and follow the instructions in postscript prologue (p. 215).
The option color enables color, while monochrome prefers black and white drawing elements. Further,
monochrome uses gray palette but it does not change color of objects specified with an explicit colorspec.
solid draws all plots with solid lines, overriding any dashed patterns. dashlength or dl scales the length of
the dashed-line segments by <DL>, which is a floating-point number greater than zero. linewidth or lw
scales all linewidths by <LW>.
By default the generated PostScript code uses language features that were introduced in PostScript Level 2,
notably filters and pattern-fill of irregular objects such as filledcurves. PostScript Level 2 features are conditionally protected so that PostScript Level 1 interpreters do not issue errors but, rather, display a message
or a PostScript Level 1 approximation. The level1 option substitutes PostScript Level 1 approximations
of these features and uses no PostScript Level 2 code. This may be required by some old printers and old
versions of Adobe Illustrator. The flag level1 can be toggled later by editing a single line in the PostScript
output file to force PostScript Level 1 interpretation. In the case of files containing level 2 code, the above
features will not appear or will be replaced by a note when this flag is set or when the interpreting program
does not indicate that it understands level 2 PostScript or higher.
rounded sets line caps and line joins to be rounded; butt is the default, butt caps and mitered joins.
clip tells PostScript to clip all output to the bounding box; noclip is the default.
palfuncparam controls how set palette functions are encoded as gradients in the output. Analytic
color component functions (set via set palette functions) are encoded as linear interpolated gradients
in the postscript output: The color component functions are sampled at <samples> points and all points
are removed from this gradient which can be removed without changing the resulting colors by more than
<maxdeviation>. For almost every useful palette you may safely leave the defaults of <samples>=2000 and
<maxdeviation>=0.003 untouched.
The default size for postscript output is 10 inches x 7 inches. The default for eps output is 5 x 3.5 inches.
The size option changes this to whatever the user requests. By default the X and Y sizes are taken to be in
inches, but other units are possibly (currently only cm). The BoundingBox of the plot is correctly adjusted
to contain the resized image. Screen coordinates always run from 0.0 to 1.0 along the full length of the
plot edges as specified by the size option. NB: this is a change from the previously recommended
method of using the set size command prior to setting the terminal type. The old method left
the BoundingBox unchanged and screen coordinates did not correspond to the actual limits of the plot.
if rotate is specified, the y-axis label is rotated. <font size> is the size (in pts) of the desired font.
If auxfile is specified, it directs the driver to put the PostScript commands into an auxiliary file instead of
directly into the LaTeX file. This is useful if your pictures are large enough that dvips cannot handle them.
The name of the auxiliary PostScript file is derived from the name of the TeX file given on the set output
command; it is determined by replacing the trailing .tex (actually just the final extent in the file name) with
.ps in the output file name, or, if the TeX file has no extension, .ps is appended. The .ps is included into
the .tex file by a \special{psfile=...} command. Remember to close the output file before next plot unless
in multiplot mode.
Gnuplot versions prior to version 4.2 generated plots of the size 5 x 3 inches using the ps(la)tex terminal
while the current version generates 5 x 3.5 inches to be consistent with the postscript eps terminal. In
addition, the character width is now estimated to be 60% of the font size while the old epslatex terminal
used 50%. To reach the old format specify the option oldstyle.
The pslatex driver offers a special way of controlling text positioning: (a) If any text string begins with ’{’,
you also need to include a ’}’ at the end of the text, and the whole text will be centered both horizontally
gnuplot 4.7
217
and vertically by LaTeX. (b) If the text string begins with ’[’, you need to continue it with: a position
specification (up to two out of t,b,l,r), ’]{’, the text itself, and finally, ’}’. The text itself may be anything
LaTeX can typeset as an LR-box. \rule{}{}’s may help for best positioning.
The options not described here are identical to the Postscript terminal. Look there if you want to know
what they do.
Examples:
set term pslatex monochrome dashed rotate
# set to defaults
To write the PostScript commands into the file "foo.ps":
set term pslatex auxfile
set output "foo.tex"; plot ...; set output
About label positioning: Use gnuplot defaults (mostly sensible, but sometimes not really best):
set title ’\LaTeX\ -- $ \gamma $’
Force centering both horizontally and vertically:
set label ’{\LaTeX\ -- $ \gamma $}’ at 0,0
Specify own positioning (top here):
set xlabel ’[t]{\LaTeX\ -- $ \gamma $}’
The other label – account for long ticlabels:
set ylabel ’[r]{\LaTeX\ -- $ \gamma $\rule{7mm}{0pt}}’
Linewidths and pointsizes may be changed with set style line.
Pstricks
The pstricks driver is intended for use with the "pstricks.sty" macro package for LaTeX. It is an alternative to the eepic and latex drivers. You need "pstricks.sty", and, of course, a printer that understands
PostScript, or a converter such as Ghostscript.
PSTricks is available via anonymous ftp from the /pub directory at Princeton.edu. This driver definitely
does not come close to using the full capability of the PSTricks package.
Syntax:
set terminal pstricks {hacktext | nohacktext} {unit | nounit}
The first option invokes an ugly hack that gives nicer numbers; the second has to do with plot scaling. The
defaults are hacktext and nounit.
Qms
The qms terminal driver supports the QMS/QUIC Laser printer, the Talaris 1200 and others. It has no
options.
Qt
The qt terminal device generates output in a separate window with the Qt library. Syntax:
set term qt {<n>}
{size <width>,<height>}
{{no}enhanced}
{font <font>}
{title "title"}
{{no}persist}
{{no}raise}
{{no}ctrl}
{close}
{widget <id>}
218
gnuplot 4.7
Multiple plot windows are supported: set terminal qt <n> directs the output to plot window number n.
The default window title is based on the window number. This title can also be specified with the keyword
"title".
Plot windows remain open even when the gnuplot driver is changed to a different device. A plot window
can be closed by pressing the letter ’q’ while that window has input focus, by choosing close from a window
manager menu, or with set term qt <n> close.
The size of the plot area is given in pixels, it defaults to 640x480. In addition to that, the actual size of
the window also includes the space reserved for the toolbar and the status bar. When you resize a window,
the plot is immediately scaled to fit in the new size of the window. The qt terminal scales the whole plot,
including fonts and linewidths, and keeps its global aspect ratio constant. If you type replot, click the
replot icon in the terminal toolbar or type a new plot command, the new plot will completely fit in the
window and the font size and the linewidths will be reset to their defaults.
The active plot window (the one selected by set term qt <n>) is interactive. Its behaviour is shared with
other terminal types. See mouse (p. 127) for details. It also has some extra icons, which are supposed to
be self-explanatory.
This terminal supports an enhanced text mode, which allows font and other formatting commands (subscripts, superscripts, etc.) to be embedded in labels and other text strings. The enhanced text mode syntax
is shared with other gnuplot terminal types. See enhanced (p. 24) for more details.
<font> is in the format "FontFace,FontSize", i.e. the face and the size comma-separated in a single string.
FontFace is a usual font face name, such as ’Arial’. If you do not provide FontFace, the qt terminal will use
’Sans’. FontSize is the font size, in points. If you do not provide it, the qt terminal will use a size of 9 points.
For example
set term
set term
set term
set term
:
qt
qt
qt
qt
font
font
font
font
"Arial,12"
"Arial" # to change the font face only
",12" # to change the font size only
"" # to reset the font name and size
The Qt rendering speed is affected strongly by the rendering mode used. In Qt version 4.7 or newer this can
be controlled by the environmental variable QT GRAPHICSSYSTEM. The options are "native", "raster", or
"opengl" in order of increasing rendering speed. For earlier versions of Qt the terminal defaults to "raster".
To obtain the best output possible, the rendering involves three mechanisms : antialiasing, oversampling
and hinting. Oversampling combined with antialiasing provides subpixel accuracy, so that gnuplot can draw
a line from non-integer coordinates. This avoids wobbling effects on diagonal lines (’plot x’ for example).
Hinting avoids the blur on horizontal and vertical lines caused by oversampling. The terminal will snap these
lines to integer coordinates so that a one-pixel-wide line will actually be drawn on one and only one pixel.
By default, the window is raised to the top of your desktop when a plot is drawn. This can be controlled
with the keyword "raise". The keyword "persist" will prevent gnuplot from exiting before you explicitely
close all the plot windows. Finally, by default the key <space> raises the gnuplot console window, and ’q’
closes the plot window. The keyword "ctrl" allows you to replace those bindings by <ctrl>+<space> and
<ctrl>+’q’, respectively.
The gnuplot outboard driver, gnuplot qt, is searched in a default place chosen when the program is compiled.
You can override that by defining the environment variable GNUPLOT DRIVER DIR to point to a different
location.
Regis
The regis terminal device generates output in the REGIS graphics language. It has the option of using 4
(the default) or 16 colors.
Syntax:
set terminal regis {4 | 16}
gnuplot 4.7
219
Sun
The sun terminal driver supports the SunView window system. It has no options.
Svg
This terminal produces files in the W3C Scalable Vector Graphics format.
Syntax:
set terminal svg {size <x>,<y> {|fixed|dynamic}}
{{no}enhanced}
{fname "<font>"} {fsize <fontsize>}
{mouse} {jsdir <dirname>} {name <plotname>}
{font "<fontname>{,<fontsize>}"}
{fontfile <filename>}
{rounded|butt} {solid|dashed} {linewidth <lw>}
{background <rgb_color>}
where <x> and <y> are the size of the SVG plot to generate, dynamic allows a svg-viewer to resize plot,
whereas the default setting, fixed, will request an absolute size.
linewidth <w> increases the width of all lines used in the figure by a factor of <w>.
<font> is the name of the default font to use (default Arial) and <fontsize> is the font size (in points,
default 12). SVG viewing programs may substitute other fonts when the file is displayed.
The svg terminal supports an enhanced text mode, which allows font and other formatting commands to
be embedded in labels and other text strings. The enhanced text mode syntax is shared with other gnuplot
terminal types. See enhanced (p. 24) for more details.
The mouse option tells gnuplot to include a link to a javascript module that supports toggling individual
plots on/off by clicking on the corresponding key entry. By default this script is taken from a local directory,
usually /usr/local/share/gnuplot/<version>/js. You can change this by using the jsdir option to specify
either a different local directory or a general URL. The latter is usually appropriate if you are embedding
the svg into a web page.
SVG allows you to embed fonts directly into an SVG document, or to provide a hypertext link to the desired
font. The fontfile option specifies a local file which is copied into the <defs> section of the resulting SVG
output file. This file may either itself contain a font, or may contain the records necessary to create a
hypertext reference to the desired font. Gnuplot will look for the requested file using the directory list in
the GNUPLOT FONTPATH environmental variable. NB: You must embed an svg font, not a TrueType or
PostScript font.
Svga
The svga terminal driver supports PCs with SVGA graphics. It can only be used if it is compiled with
DJGPP. Its only option is the font.
Syntax:
set terminal svga {"<fontname>"}
Tek40
This family of terminal drivers supports a variety of VT-like terminals. tek40xx supports Tektronix 4010
and others as well as most TEK emulators. vttek supports VT-like tek40xx terminal emulators. The following are present only if selected when gnuplot is built: kc-tek40xx supports MS-DOS Kermit Tek4010
terminal emulators in color; km-tek40xx supports them in monochrome. selanar supports Selanar graphics. bitgraph supports BBN Bitgraph terminals. None have any options.
220
gnuplot 4.7
Tek410x
The tek410x terminal driver supports the 410x and 420x family of Tektronix terminals. It has no options.
Texdraw
The texdraw terminal driver supports the LaTeX texdraw environment. It is intended for use with "texdraw.sty" and "texdraw.tex" in the texdraw package.
Points, among other things, are drawn using the LaTeX commands "\Diamond" and "\Box". These commands no longer belong to the LaTeX2e core; they are included in the latexsym package, which is part of
the base distribution and thus part of any LaTeX implementation. Please do not forget to use this package.
It has no options.
Tgif
Tgif is an X11-based drawing tool — it has nothing to do with GIF.
The tgif driver supports different pointsizes (with set pointsize), different label fonts and font sizes (e.g.
set label "Hallo" at x,y font "Helvetica,34") and multiple graphs on the page. The proportions of the
axes are not changed.
Syntax:
set terminal tgif {portrait | landscape | default} {<[x,y]>}
{monochrome | color}
{{linewidth | lw} <LW>}
{solid | dashed}
{font "<fontname>{,<fontsize>}"}
where <[x,y]> specifies the number of graphs in the x and y directions on the page, color enables color,
linewidth scales all linewidths by <LW>, "<fontname>" is the name of a valid PostScript font, and
<fontsize> specifies the size of the PostScript font. defaults sets all options to their defaults: portrait,
[1,1], color, linwidth 1.0, dashed, "Helvetica,18".
The solid option is usually prefered if lines are colored, as they often are in the editor. Hardcopy will be
black-and-white, so dashed should be chosen for that.
Multiplot is implemented in two different ways.
The first multiplot implementation is the standard gnuplot multiplot feature:
set terminal tgif
set output "file.obj"
set multiplot
set origin x01,y01
set size xs,ys
plot ...
...
set origin x02,y02
plot ...
unset multiplot
See set multiplot (p. 128) for further information.
The second version is the [x,y] option for the driver itself. The advantage of this implementation is that
everything is scaled and placed automatically without the need for setting origins and sizes; the graphs keep
their natural x/y proportions of 3/2 (or whatever is fixed by set size).
If both multiplot methods are selected, the standard method is chosen and a warning message is given.
Examples of single plots (or standard multiplot):
set terminal tgif
# defaults
gnuplot 4.7
221
set terminal tgif "Times-Roman,24"
set terminal tgif landscape
set terminal tgif landscape solid
Examples using the built-in multiplot mechanism:
set terminal tgif portrait [2,4]
#
#
set terminal tgif [1,2]
#
#
set terminal tgif landscape [3,3] #
#
portrait; 2 plots in the xand 4 in the y-direction
portrait; 1 plot in the xand 2 in the y-direction
landscape; 3 plots in both
directions
Tikz
This driver creates output for use with the TikZ package of graphics macros in TeX. It is currently implemented via an external lua script, and set term tikz is a short form of the command set term lua tikz.
See term lua (p. 200) for more information. Use the command set term tikz help to print terminal
options.
Tkcanvas
This terminal driver generates Tk canvas widget commands based on Tcl/Tk (default) or Perl. To use it,
rebuild gnuplot (after uncommenting or inserting the appropriate line in "term.h"), then
gnuplot> set term tkcanvas {perltk} {interactive}
gnuplot> set output ’plot.file’
After invoking "wish", execute the following sequence of Tcl/Tk commands:
%
%
%
%
source plot.file
canvas .c
pack .c
gnuplot .c
Or, for Perl/Tk use a program like this:
use Tk;
my $top = MainWindow->new;
my $c = $top->Canvas->pack;
my $gnuplot = do "plot.pl";
$gnuplot->($c);
MainLoop;
The code generated by gnuplot creates a procedure called "gnuplot" that takes the name of a canvas as its
argument. When the procedure is called, it clears the canvas, finds the size of the canvas and draws the plot
in it, scaled to fit.
For 2-dimensional plotting (plot) two additional procedures are defined: "gnuplot plotarea" will return a
list containing the borders of the plotting area "xleft, xright, ytop, ybot" in canvas screen coordinates, while
the ranges of the two axes "x1min, x1max, y1min, y1max, x2min, x2max, y2min, y2max" in plot coordinates
can be obtained calling "gnuplot axisranges". If the "interactive" option is specified, mouse clicking on a
line segment will print the coordinates of its midpoint to stdout. Advanced actions can happen instead if the
user supplies a procedure named "user gnuplot coordinates", which takes the following arguments: "win id
x1s y1s x2s y2s x1e y1e x2e y2e x1m y1m x2m y2m", the name of the canvas and the id of the line segment
followed by the coordinates of its start and end point in the two possible axis ranges; the coordinates of the
midpoint are only filled for logarithmic axes.
The current version of tkcanvas supports neither multiplot nor replot.
222
gnuplot 4.7
Tpic
The tpic terminal driver supports the LaTeX picture environment with tpic \specials. It is an alternative
to the latex and eepic terminal drivers. Options are the point size, line width, and dot-dash interval.
Syntax:
set terminal tpic <pointsize> <linewidth> <interval>
where pointsize and linewidth are integers in milli-inches and interval is a float in inches. If a non-positive
value is specified, the default is chosen: pointsize = 40, linewidth = 6, interval = 0.1.
All drivers for LaTeX offer a special way of controlling text positioning: If any text string begins with ’{’,
you also need to include a ’}’ at the end of the text, and the whole text will be centered both horizontally and
vertically by LaTeX. — If the text string begins with ’[’, you need to continue it with: a position specification
(up to two out of t,b,l,r), ’]{’, the text itself, and finally, ’}’. The text itself may be anything LaTeX can
typeset as an LR-box. \rule{}{}’s may help for best positioning.
Examples: About label positioning: Use gnuplot defaults (mostly sensible, but sometimes not really best):
set title ’\LaTeX\ -- $ \gamma $’
Force centering both horizontally and vertically:
set label ’{\LaTeX\ -- $ \gamma $}’ at 0,0
Specify own positioning (top here):
set xlabel ’[t]{\LaTeX\ -- $ \gamma $}’
The other label – account for long ticlabels:
set ylabel ’[r]{\LaTeX\ -- $ \gamma $\rule{7mm}{0pt}}’
Vgagl
The vgagl driver is a fast linux console driver with full mouse and pm3d support. It looks at the environment
variable SVGALIB DEFAULT MODE for the default mode; if not set, it uses a 256 color mode with the
highest available resolution.
Syntax:
set terminal vgagl \
background [red] [[green] [blue]] \
[uniform | interpolate] \
[mode]
The color mode can also be given with the mode option. Both Symbolic names as G1024x768x256 and
integers are allowed. The background option takes either one or three integers in the range [0, 255]. If
only one integers is supplied, it is taken as gray value for the background. If three integers are present,
the background gets the corresponding color. The (mutually exclusive) options interpolate and uniform
control if color interpolation is done while drawing triangles (on by default).
To get high resolution modes, you will probably have to modify the configuration file of libvga, usually
/etc/vga/libvga.conf. Using the VESA fb is a good choice, but this needs to be compiled in the kernel.
The vgagl driver uses the first *available* vga mode from the following list:
- the driver which was supplied when setting vgagl, e.g. ‘set term vgagl
G1024x768x256‘ would first check, if the G1024x768x256 mode is available.
- the environment variable SVGALIB_DEFAULT_MODE
- G1024x768x256
- G800x600x256
- G640x480x256
- G320x200x256
- G1280x1024x256
- G1152x864x256
- G1360x768x256
- G1600x1200x256
gnuplot 4.7
223
VWS
The VWS terminal driver supports the VAX Windowing System. It has no options. It will sense the display
type (monochrome, gray scale, or color.) All line styles are plotted as solid lines.
Vx384
The vx384 terminal driver supports the Vectrix 384 and Tandy color printers. It has no options.
Windows
The windows terminal is a fast interactive terminal driver that uses the Windows GDI to draw and write
text. The cross-platform terminal wxt is also supported on Windows.
Syntax:
set terminal windows {<n>}
{color | monochrome}
{solid | dashed}
{enhanced | noenhanced}
{font <fontspec>}
{fontscale <scale>}
{linewdith <scale>}
{background <rgb color>}
{title "Plot Window Title"}
{size <width>,<height>}
{position <x>,<y>}
{close}
Multiple plot windows are supported: set terminal win <n> directs the output to plot window number
n.
color and monochrome select colored or mono output, dashed and solid select dashed or solid lines. Note
that color defaults to solid, whereas monochrome defaults to dashed. enhanced enables enhanced text
mode features (subscripts, superscripts and mixed fonts, see enhanced text (p. 24) for more information).
<fontspec> is in the format "<fontface>,<fontsize>", where "<fontface>" is the name of a valid Windows
font, and <fontsize> is the size of the font in points and both components are optional. Note that in previous
versions of gnuplot the font statement could be left out and <fontsize> could be given as a number without
double quotes. This is no longer supported. linewidth and fontscale can be used to scale the width of
lines and the size of text. title changes the title of the graph window. size defines the width and height
of the window in pixel and position the origin of the window i.e. the position of the top left corner on the
screen (again in pixel). These options override any default settings from the wgnuplot.ini file.
Other options may be changed using the graph-menu or the initialization file wgnuplot.ini.
The Windows version normally terminates immediately as soon as the end of any files given as command
line arguments is reached (i.e. in non-interactive mode), unless you specify - as the last command line
option. It will also not show the text-window at all, in this mode, only the plot. By giving the optional
argument -persist (same as for gnuplot under x11; former Windows-only options /noend or -noend are
still accepted as well), will not close gnuplot. Contrary to gnuplot on other operating systems, gnuplot’s
interactive command line is accessible after the -persist option.
The plot window remains open when the gnuplot terminal is changed with a set term command. The plot
window can be closed with set term windows close.
gnuplot supports different methods to create printed output on Windows, see windows printing (p. 224).
The windows terminal supports data exchange with other programs via clipboard and EMF files, see graphmenu (p. 224). You can also use the terminal emf to create EMF files.
224
gnuplot 4.7
Graph-menu
The gnuplot graph window has the following options on a pop-up menu accessed by pressing the right
mouse button(*) or selecting Options from the system menu:
Copy to Clipboard copies a bitmap and an enhanced Metafile picture.
Save as EMF... allows the user to save the current graph window as enhanced metafile
Print... prints the graphics windows using a Windows printer driver and allows selection of the printer and
scaling of the output. The output produced by Print is not as good as that from gnuplot’s own printer
drivers. See also windows printing (p. 224).
Bring to Top when checked brings the graph window to the top after every plot.
Color when checked enables color linestyles. When unchecked it forces monochrome linestyles.
Double buffer activates drawing into a memory buffer before copying the graph to the screen. This avoids
flickering e.g. during animation and rotation of 3d graphs. See mouse (p. 127) and scrolling (p. 128).
Oversampling doubles the size of the virtual canvas. It is scaled down again for drawing to the screen.
This gives smoother graphics but requires more memory and computing time. It requires double buffer.
Antialiasing selects smoothing of lines and edges. Note that this slows down drawing.
Background... sets the window background color.
Choose Font... selects the font used in the graphics window.
Line Styles... allows customization of the line colors and styles.
Update wgnuplot.ini saves the current window locations, window sizes, text window font, text window
font size, graph window font, graph window font size, background color and linestyles to the initialization
file wgnuplot.ini.
(*) Note that this menu is only available by pressing the right mouse button with unset mouse.
Printing
In order of preference, graphs may be printed in the following ways:
1. Use the gnuplot command set terminal to select a printer and set output to redirect output to a file.
2. Select the Print... command from the gnuplot graph window. An extra command screendump does
this from the text window.
3. If set output "PRN" is used, output will go to a temporary file. When you exit from gnuplot or
when you change the output with another set output command, a dialog box will appear for you to select a
printer port. If you choose OK, the output will be printed on the selected port, passing unmodified through
the print manager. It is possible to accidentally (or deliberately) send printer output meant for one printer
to an incompatible printer.
Text-menu
The gnuplot text window has the following options on a pop-up menu accessed by pressing the right mouse
button or selecting Options from the system menu:
Copy to Clipboard copies marked text to the clipboard.
Paste copies text from the clipboard as if typed by the user.
Choose Font... selects the font used in the text window.
System Colors when selected makes the text window honor the System Colors set using the Control Panel.
When unselected, text is black or blue on a white background.
Wrap long lines when selected lines longer than the current window width are wrapped.
Update wgnuplot.ini saves the current settings to the initialisation file wgnuplot.ini, which is located in
the user’s application data directory.
gnuplot 4.7
225
Wgnuplot.mnu
If the menu file wgnuplot.mnu is found in the same directory as gnuplot, then the menu specified in
wgnuplot.mnu will be loaded. Menu commands:
[Menu]
[EndMenu]
[--]
[|]
[Button]
starts a new menu with the name on the following line.
ends the current menu.
inserts a horizontal menu separator.
inserts a vertical menu separator.
puts the next macro on a push button instead of a menu.
Macros take two lines with the macro name (menu entry) on the first line and the macro on the second line.
Leading spaces are ignored. Macro commands:
[INPUT]
[EOS]
[OPEN]
Input string with prompt terminated by [EOS] or {ENTER}
End Of String terminator. Generates no output.
Get name of a file to open, with the title of the dialog
terminated by [EOS], followed by a default filename terminated
by [EOS] or {ENTER}.
[SAVE]
Get name of a file to save. Parameters like [OPEN]
[DIRECTORY] Get name of a directory, with the title of the dialog
terminated by [EOS] or {ENTER}
Macro character substitutions:
{ENTER}
{TAB}
{ESC}
{^A}
...
{^_}
Carriage Return ’\r’
Tab ’\011’
Escape ’\033’
’\001’
’\031’
Macros are limited to 256 characters after expansion.
Wgnuplot.ini
The Windows text window and the windows terminal will read some of their options from the [WGNUPLOT] section of wgnuplot.ini. This file is located in the user’s application data directory. Here’s a
sample wgnuplot.ini file:
[WGNUPLOT]
TextOrigin=0 0
TextSize=640 150
TextFont=Terminal,9
TextWrap=1
TextLines=400
SysColors=0
GraphOrigin=0 150
GraphSize=640 330
GraphFont=Arial,10
GraphColor=1
GraphToTop=1
GraphDoublebuffer=1
GraphOversampling=0
GraphAntialiasing=1
GraphBackground=255 255 255
Border=0 0 0 0 0
Axis=192 192 192 2 2
Line1=0 0 255 0 0
Line2=0 255 0 0 1
226
gnuplot 4.7
Line3=255 0 0 0 2
Line4=255 0 255 0 3
Line5=0 0 128 0 4
These settings apply to the wgnuplot text-window only. The TextOrigin and TextSize entries specify the
location and size of the text window.
The TextFont entry specifies the text window font and size.
The TextWrap entry selects wrapping of long text lines.
The TextLines entry specifies the number of (unwrapped) lines the internal buffer of the text window can
hold. This value currently cannot be changed from within wgnuplot.
See text-menu (p. 224).
The GraphFont entry specifies the font name and size in points.
The five numbers given in the Border, Axis and Line entries are the Red intensity (0–255), Green
intensity, Blue intensity, Color Linestyle and Mono Linestyle. Linestyles are 0=SOLID, 1=DASH,
2=DOT, 3=DASHDOT, 4=DASHDOTDOT. In the sample wgnuplot.ini file above, Line 2 is a green solid
line in color mode, or a dashed line in monochrome mode. The default line width is 1 pixel. If Linestyle is
negative, it specifies the width of a SOLID line in pixels. Line1 and any linestyle used with the points style
must be SOLID with unit width.
See graph-menu (p. 224).
Wxt
The wxt terminal device generates output in a separate window. The window is created by the wxWidgets
library, where the ’wxt’ comes from. The actual drawing is done via cairo, a 2D graphics library, and pango,
a library for laying out and rendering text.
Syntax:
set term wxt {<n>}
{size <width>,<height>} {background <rgb_color>}
{{no}enhanced}
{font <font>} {fontscale <scale>}
{title "title"}
{dashed|solid} {dashlength <dl>}
{{no}persist}
{{no}raise}
{{no}ctrl}
{close}
Multiple plot windows are supported: set terminal wxt <n> directs the output to plot window number
n.
The default window title is based on the window number. This title can also be specified with the keyword
"title".
Plot windows remain open even when the gnuplot driver is changed to a different device. A plot window
can be closed by pressing the letter ’q’ while that window has input focus, by choosing close from a window
manager menu, or with set term wxt <n> close.
The size of the plot area is given in pixels, it defaults to 640x384. In addition to that, the actual size of the
window also includes the space reserved for the toolbar and the status bar. When you resize a window, the
plot is immediately scaled to fit in the new size of the window. Unlike other interactive terminals, the wxt
terminal scales the whole plot, including fonts and linewidths, and keeps its global aspect ratio constant,
leaving an empty space painted in gray. If you type replot, click the replot icon in the terminal toolbar
or type a new plot command, the new plot will completely fit in the window and the font size and the
linewidths will be reset to their defaults.
The active plot window (the one selected by set term wxt <n>) is interactive. Its behaviour is shared
gnuplot 4.7
227
with other terminal types. See mouse (p. 127) for details. It also has some extra icons, which are supposed
to be self-explanatory.
This terminal supports an enhanced text mode, which allows font and other formatting commands (subscripts, superscripts, etc.) to be embedded in labels and other text strings. The enhanced text mode syntax
is shared with other gnuplot terminal types. See enhanced (p. 24) for more details.
<font> is in the format "FontFace,FontSize", i.e. the face and the size comma-separated in a single string.
FontFace is a usual font face name, such as ’Arial’. If you do not provide FontFace, the wxt terminal will
use ’Sans’. FontSize is the font size, in points. If you do not provide it, the wxt terminal will use a size of
10 points.
For example
set term
set term
set term
set term
:
wxt
wxt
wxt
wxt
font
font
font
font
"Arial,12"
"Arial" # to change the font face only
",12" # to change the font size only
"" # to reset the font name and size
The fonts are retrieved from the usual fonts subsystems. Under Windows, those fonts are to be found and
configured in the entry "Fonts" of the control panel. Under UNIX, they are handled by "fontconfig".
Pango, the library used to layout the text, is based on utf-8. Thus, the wxt terminal has to convert from
your encoding to utf-8. The default input encoding is based on your ’locale’. If you want to use another
encoding, make sure gnuplot knows which one you are using. See encoding (p. 111) for more details.
Pango may give unexpected results with fonts that do not respect the unicode mapping. With the Symbol
font, for example, the wxt terminal will use the map provided by http://www.unicode.org/ to translate
character codes to unicode. Pango will do its best to find a font containing this character, looking for your
Symbol font, or other fonts with a broad unicode coverage, like the DejaVu fonts. Note that "the Symbol
font" is to be understood as the Adobe Symbol font, distributed with Acrobat Reader as "SY
.PFB".
Alternatively, the OpenSymbol font, distributed with OpenOffice.org as "opens .ttf", offers the same characters. Microsoft has distributed a Symbol font ("symbol.ttf"), but it has a different character set with
several missing or moved mathematic characters. If you experience problems with your default setup (if
the demo enhancedtext.dem is not displayed properly for example), you probably have to install one of
the Adobe or OpenOffice Symbol fonts, and remove the Microsoft one. Other non-conform fonts, such as
"wingdings" have been observed working.
The rendering of the plot can be altered with a dialog available from the toolbar. To obtain the best output
possible, the rendering involves three mechanisms : antialiasing, oversampling and hinting. Antialiasing
allows to display non-horizontal and non-vertical lines smoother. Oversampling combined with antialiasing
provides subpixel accuracy, so that gnuplot can draw a line from non-integer coordinates. This avoids
wobbling effects on diagonal lines (’plot x’ for example). Hinting avoids the blur on horizontal and vertical
lines caused by oversampling. The terminal will snap these lines to integer coordinates so that a one-pixelwide line will actually be drawn on one and only one pixel.
By default, the window is raised to the top of your desktop when a plot is drawn. This can be controlled
with the keyword "raise". The keyword "persist" will prevent gnuplot from exiting before you explicitely
close all the plot windows. Finally, by default the key <space> raises the gnuplot console window, and ’q’
closes the plot window. The keyword "ctrl" allows you to replace those bindings by <ctrl>+<space> and
<ctrl>+’q’, respectively. These three keywords (raise, persist and ctrl) can also be set and remembered
between sessions through the configuration dialog.
X11
Syntax:
set terminal x11 {<n> | window "<string>"}
{title "<string>"}
{{no}enhanced} {font <fontspec>}
{linewidth LW} {solid|dashed}
{{no}persist} {{no}raise} {{no}ctrlq}
{close}
228
gnuplot 4.7
{size XX,YY} {position XX,YY}
set terminal x11 {reset}
Multiple plot windows are supported: set terminal x11 <n> directs the output to plot window number
n. If n is not 0, the terminal number will be appended to the window title (unless a title has been supplied
manually) and the icon will be labeled Gnuplot <n>. The active window may be distinguished by a change
in cursor (from default to crosshair).
The x11 terminal can connect to X windows previously created by an outside application via the option
window followed by a string containing the X ID for the window in hexadecimal format. Gnuplot uses that
external X window as a container since X does not allow for multiple clients selecting the ButtonPress event.
In this way, gnuplot’s mouse features work within the contained plot window.
set term x11 window "220001e"
The x11 terminal supports enhanced text mode (see enhanced (p. 24)), subject to the available fonts. In
order for font size commands embedded in text to have any effect, the default x11 font must be scalable.
Thus the first example below will work as expected, but the second will not.
set term x11 enhanced font "arial,15"
set title ’{/=20 Big} Medium {/=5 Small}’
set term x11 enhanced font "terminal-14"
set title ’{/=20 Big} Medium {/=5 Small}’
Plot windows remain open even when the gnuplot driver is changed to a different device. A plot window
can be closed by pressing the letter q while that window has input focus, or by choosing close from a
window manager menu. All plot windows can be closed by specifying reset, which actually terminates the
subprocess which maintains the windows (unless -persist was specified). The close command can be used
to close individual plot windows by number. However, after a reset, those plot windows left due to persist
cannot be closed with the command close. A close without a number closes the current active plot window.
The gnuplot outboard driver, gnuplot x11, is searched in a default place chosen when the program is compiled.
You can override that by defining the environment variable GNUPLOT DRIVER DIR to point to a different
location.
Plot windows will automatically be closed at the end of the session unless the -persist option was given.
The options persist and raise are unset by default, which means that the defaults (persist == no and raise
== yes) or the command line options -persist / -raise or the Xresources are taken. If [no]persist or [no]raise
are specified, they will override command line options and Xresources. Setting one of these options takes
place immediately, so the behaviour of an already running driver can be modified. If the window does not
get raised, see discussion in raise (p. 94).
The option title "<title name>" will supply the title name of the window for the current plot window or
plot window <n> if a number is given. Where (or if) this title is shown depends on your X window manager.
The size option can be used to set the size of the plot window. The size option will only apply to newly
created windows.
The position option can be used to set the position of the plot window. The position option will only apply
to newly created windows.
The size or aspect ratio of a plot may be changed by resizing the gnuplot window.
Linewidths and pointsizes may be changed from within gnuplot with set linestyle.
For terminal type x11, gnuplot accepts (when initialized) the standard X Toolkit options and resources
such as geometry, font, and name from the command line arguments or a configuration file. See the X(1)
man page (or its equivalent) for a description of such options.
A number of other gnuplot options are available for the x11 terminal. These may be specified either as
command-line options when gnuplot is invoked or as resources in the configuration file ".Xdefaults". They
are set upon initialization and cannot be altered during a gnuplot session. (except persist and raise)
gnuplot 4.7
229
X11 fonts
Upon initial startup, the default font is taken from the X11 resources as set in the system or user .Xdefaults
file or on the command line.
Example:
gnuplot*font: lucidasans-bold-12
A new default font may be specified to the x11 driver from inside gnuplot using
‘set term x11 font "<fontspec>"‘
The driver first queries the X-server for a font of the exact name given. If this query fails, then it tries to
interpret <fontspec> as "<font>,<size>,<slant>,<weight>" and to construct a full X11 font name of the
form
-*-<font>-<weight>-<s>-*-*-<size>-*-*-*-*-*-<encoding>
<font> is the base name of the font (e.g. Times or Symbol)
<size> is the point size (defaults to 12 if not specified)
<s> is ‘i‘ if <slant>=="italic" ‘o‘ if <slant>=="oblique" ‘r‘ otherwise
<weight> is ‘medium‘ or ‘bold‘ if explicitly requested, otherwise ‘*‘
<encoding> is set based on the current character set (see ‘set encoding‘).
So set term x11 font "arial,15,italic" will be translated to -*-arial-*-i-*-*-15-*-*-*-*-*-iso8859-1 (assuming default encoding). The <size>, <slant>, and <weight> specifications are all optional. If you do not
specify <slant> or <weight> then you will get whatever font variant the font server offers first. You may
set a default enconding via the corresponding X11 resource. E.g.
gnuplot*encoding: iso8859-15
The driver also recognizes some common PostScript font names and replaces them with possible X11 or
TrueType equivalents. This same sequence is used to process font requests from set label.
If your gnuplot was built with configuration option –enable-x11-mbfonts, you can specify multi-byte fonts
by using the prefix "mbfont:" on the font name. An additional font may be given, separated by a semicolon.
Since multi-byte font encodings are interpreted according to the locale setting, you must make sure that the
environmental variable LC CTYPE is set to some appropriate locale value such as ja JP.eucJP, ko KR.EUC,
or zh CN.EUC.
Example:
set term x11 font ’mbfont:kana14;k14’
# ’kana14’ and ’k14’ are Japanese X11 font aliases, and ’;’
# is the separator of font names.
set term x11 font ’mbfont:fixed,16,r,medium’
# <font>,<size>,<slant>,<weight> form is also usable.
set title ’(mb strings)’ font ’mbfont:*-fixed-medium-r-normal--14-*’
The same syntax applies to the default font in Xresources settings, for example,
gnuplot*font: \
mbfont:-misc-fixed-medium-r-normal--14-*-*-*-c-*-jisx0208.1983-0
If gnuplot is built with –enable-x11-mbfonts, you can use two special PostScript font names ’Ryumin-Light-*’
and ’GothicBBB-Medium-*’ (standard Japanese PS fonts) without the prefix "mbfont:".
Command-line options
In addition to the X Toolkit options, the following options may be specified on the command line when
starting gnuplot or as resources in your ".Xdefaults" file (note that raise and persist can be overridden
later by set term x11 [no]raise [no]persist):
230
gnuplot 4.7
‘-mono‘
‘-gray‘
‘-clear‘
‘-tvtwm‘
‘-raise‘
‘-noraise‘
‘-noevents‘
‘-persist‘
forces monochrome rendering on color displays.
requests grayscale rendering on grayscale or color displays.
(Grayscale displays receive monochrome rendering by default.)
requests that the window be cleared momentarily before a
new plot is displayed.
requests that geometry specifications for position of the
window be made relative to the currently displayed portion
of the virtual root.
raises plot window after each plot.
does not raise plot window after each plot.
does not process mouse and key events.
plot windows survive after main gnuplot program exits.
The options are shown above in their command-line syntax. When entered as resources in ".Xdefaults",
they require a different syntax.
Example:
gnuplot*gray: on
gnuplot*ctrlq: on
gnuplot also provides a command line option (-pointsize <v>) and a resource, gnuplot*pointsize: <v>,
to control the size of points plotted with the points plotting style. The value v is a real number (greater
than 0 and less than or equal to ten) used as a scaling factor for point sizes. For example, -pointsize 2 uses
points twice the default size, and -pointsize 0.5 uses points half the normal size.
The -noevents switch disables all mouse and key event processing (except for q and <space> for closing
the window). This is useful for programs which use the x11 driver independent of the gnuplot main program.
The -ctrlq switch changes the hot-key that closes a plot window from q to <ctrl>q. This is useful is you are
using the keystroke-capture feature pause mouse keystroke, since it allows the character q to be captured
just as all other alphanumeric characters. The -ctrlq switch similarly replaces the <space> hot-key with
<ctrl><space> for the same reason.
Monochrome options
For monochrome displays, gnuplot does not honor foreground or background colors. The default is blackon-white. -rv or gnuplot*reverseVideo: on requests white-on-black.
Color resources
The X11 terminal honors the following resources (shown here with their default values) or the greyscale
resources. The values may be color names as listed in the X11 rgb.txt file on your system, hexadecimal RGB
color specifications (see X11 documentation), or a color name followed by a comma and an intensity value
from 0 to 1. For example, blue, 0.5 means a half intensity blue.
gnuplot*background: white
gnuplot*textColor: black
gnuplot*borderColor: black
gnuplot*axisColor: black
gnuplot*line1Color: red
gnuplot*line2Color: green
gnuplot*line3Color: blue
gnuplot*line4Color: magenta
gnuplot*line5Color: cyan
gnuplot*line6Color: sienna
gnuplot*line7Color: orange
gnuplot*line8Color: coral
gnuplot 4.7
231
The command-line syntax for these is simple only for background, which maps directly to the usual X11
toolkit option "-bg". All others can only be set on the command line by use of the generic "-xrm" resource
override option
Examples:
gnuplot -background coral
to change the background color.
gnuplot -xrm ’gnuplot*line1Color:blue’
to override the first linetype color.
Grayscale resources
When -gray is selected, gnuplot honors the following resources for grayscale or color displays (shown here
with their default values). Note that the default background is black.
gnuplot*background: black
gnuplot*textGray: white
gnuplot*borderGray: gray50
gnuplot*axisGray: gray50
gnuplot*line1Gray: gray100
gnuplot*line2Gray: gray60
gnuplot*line3Gray: gray80
gnuplot*line4Gray: gray40
gnuplot*line5Gray: gray90
gnuplot*line6Gray: gray50
gnuplot*line7Gray: gray70
gnuplot*line8Gray: gray30
Line resources
gnuplot honors the following resources for setting the width (in pixels) of plot lines (shown here with their
default values.) 0 or 1 means a minimal width line of 1 pixel width. A value of 2 or 3 may improve the
appearance of some plots.
gnuplot*borderWidth: 2
gnuplot*axisWidth: 0
gnuplot*line1Width: 0
gnuplot*line2Width: 0
gnuplot*line3Width: 0
gnuplot*line4Width: 0
gnuplot*line5Width: 0
gnuplot*line6Width: 0
gnuplot*line7Width: 0
gnuplot*line8Width: 0
gnuplot honors the following resources for setting the dash style used for plotting lines. 0 means a solid line.
A two-digit number jk (j and k are >= 1 and <= 9) means a dashed line with a repeated pattern of j pixels
on followed by k pixels off. For example, ’16’ is a dotted line with one pixel on followed by six pixels off.
More elaborate on/off patterns can be specified with a four-digit value. For example, ’4441’ is four on, four
off, four on, one off. The default values shown below are for monochrome displays or monochrome rendering
on color or grayscale displays. Color displays default to dashed:off
232
gnuplot 4.7
gnuplot*dashed: off
gnuplot*borderDashes: 0
gnuplot*axisDashes: 16
gnuplot*line1Dashes: 0
gnuplot*line2Dashes: 42
gnuplot*line3Dashes: 13
gnuplot*line4Dashes: 44
gnuplot*line5Dashes: 15
gnuplot*line6Dashes: 4441
gnuplot*line7Dashes: 42
gnuplot*line8Dashes: 13
X11 pm3d resources
Choosing the appropriate visual class and number of colors is a crucial point in X11 applications and a bit
awkward, since X11 supports six visual types in different depths.
By default gnuplot uses the default visual of the screen. The number of colors which can be allocated
depends on the visual class chosen. On a visual class with a depth > 12bit, gnuplot starts with a maximal
number of 0x200 colors. On a visual class with a depth > 8bit (but <= 12 bit) the maximal number of
colors is 0x100, on <= 8bit displays the maximum number of colors is 240 (16 are left for line colors).
Gnuplot first starts to allocate the maximal number of colors as stated above. If this fails, the number of
colors is reduced by the factor 2 until gnuplot gets all colors which are requested. If dividing maxcolors by 2
repeatedly results in a number which is smaller than mincolors gnuplot tries to install a private colormap.
In this case the window manager is responsible for swapping colormaps when the pointer is moved in and
out the x11 driver’s window.
The default for mincolors is maxcolors / (num colormaps > 1 ? 2 : 8), where num colormaps is the number
of colormaps which are currently used by gnuplot (usually 1, if only one x11 window is open).
Some systems support multiple (different) visual classes together on one screen. On these systems it might
be necessary to force gnuplot to use a specific visual class, e.g. the default visual might be 8bit PseudoColor
but the screen would also support 24bit TrueColor which would be the preferred choice.
The information about an Xserver’s capabilities can be obtained with the program xdpyinfo. For the
visual names below you can choose one of StaticGray, GrayScale, StaticColor, PseudoColor, TrueColor,
DirectColor. If an Xserver supports a requested visual type at different depths, gnuplot chooses the visual
class with the highest depth (deepest). If the requested visual class matches the default visual and multiple
classes of this type are supported, the default visual is preferred.
Example: on an 8bit PseudoColor visual you can force a private color map by specifying gnuplot*maxcolors: 240 and gnuplot*mincolors: 240.
gnuplot*maxcolors: integer
gnuplot*mincolors: integer
gnuplot*visual: visual name
X11 other resources
By default the contents of the current plot window are exported to the X11 clipboard in response to X events
in the window. Setting the resource ’gnuplot*exportselection’ to ’off’ or ’false’ will disable this.
By default text rotation is done using a method that is fast, but can corrupt nearby colors depending on the
background. If this is a problem, you can set the resource ’gnuplot.fastrotate’ to ’off’
gnuplot*exportselection: off
gnuplot*fastrotate: on
gnuplot*ctrlq: off
gnuplot 4.7
233
Xlib
The xlib terminal driver supports the X11 Windows System. It generates gnuplot x11 commands, but sends
them to the output file specified by set output ’<filename>’. set term x11 is equivalent to set output
"|gnuplot x11 -noevents"; set term xlib. xlib takes the same set of options as x11.
Part V
Bugs
Please e-mail bug reports to the gnuplot-bugs mailing list or upload the report to the gnuplot web site on
SourceForge. Please give complete information on the version of gnuplot you are using and, if possible, a
test script that demonstrates the bug. See seeking-assistance (p. 17).
Known limitations
Floating point exceptions (floating point number too large/small, divide by zero, etc.) may occasionally
be generated by user defined functions. Some of the demos in particular may cause numbers to exceed
the floating point range. Whether the system ignores such exceptions (in which case gnuplot labels the
corresponding point as undefined) or aborts gnuplot depends on the compiler/runtime environment.
The gamma, bessel, and erf functions do not work for complex arguments.
Coordinates specified as "time" wrap at 24 hours.
The ’nohidden3d’ option that is supposed to exempt individual plots from the global property ’set hidden3d’
does not work for parametric curves.
X11 terminal: It is difficult to select UTF-8 fonts. The program does not track the true aspect ratio of the
x11 terminal window. In order for commands such as "set size ratio" to work, the x11 window must itself
have equal height and width. Only one color palette at a time is active for any given x11 plot window. This
means that multiplots whose constituent plots use different palettes will not display correctly in x11.
Qt terminal: If the local qt environment does not support "opengl" as a rendering mode then display of
polygons and surfaces can be very slow.
External libraries
External library GD (used by PNG/JPEG/GIF drivers): Versions of libgd through 2.0.33 contain various
bugs in mapping the characters of Adobe’s Symbol font. Also it is possible to trigger a library segfault if an
anti-aliased line crosses an upper corner of the canvas.
External library PDFlib (used by PDF driver): Gnuplot can be linked against libpdf versions 4, 5, or 6.
However, these versions differ in their handling of piped I/O. Therefore gnuplot scripts using piped output
to PDF may work only for some versions of PDFlib.
External library svgalib (used by linux and vgagl driver): Requires gnuplot to be suid root (bad!) and has
many bugs that are specific to the video card or graphics driver used in X11.
Internationalization (locale settings): Gnuplot uses the C runtime library routine setlocale() to control localespecific formatting of input and output number, times, and date strings. The locales available, and the level
of support for locale features such as "thousands’ grouping separator", depend on the internationalization
support provided by your individual machine.
234
Part VI
Index
gnuplot 4.7
Index
.gnuplot, 39
3D, 60
abs, 26
acos, 26
acosh, 26
acsplines, 81
adobeglyphnames, 215
aed512, 175
aed767, 175
aifm, 176
airy, 26
all, 93
angles, 96, 143
Aqua, 176
aqua, 176
arg, 26
arrow, 97, 147
arrowstyle, 58, 98, 146
asin, 26
asinh, 26
atan, 26
atan2, 26
atanh, 26
automated, 53
autoscale, 89, 98
avs, 76
axes, 22, 33, 38, 73
background, 35
backquotes, 40
bars, 45–47, 50, 58–60, 87, 88, 100
batch/interactive, 17, 21, 63, 72, 96
BE, 176
be, 176
besj0, 26
besj1, 26
bessel, 233
besy0, 26
besy1, 26
bezier, 82
bgnd, 19, 35
binary, 74, 76
bind, 36, 95, 100, 127
bitwise operators, 29
bmargin, 100
border, 100, 116, 154
boxerrorbars, 43, 102
boxes, 44, 46, 102
boxplot, 19, 45, 47, 148
boxwidth, 45, 47, 102
boxxyerrorbars, 45
branch, 68
bugs, 233
cairolatex, 179
call, 61, 71
candlesticks, 45, 46, 50, 148
canvas, 21, 195, 199, 210
cbdata, 167
cbdtics, 167
cblabel, 168
cbmtics, 168
cbrange, 34, 35, 135, 136, 151, 168
cbtics, 168
cd, 61
ceil, 26
center, 54
cgi, 182
cgm, 182
circle, 47, 132
circles, 19, 47
clabel, 102, 104, 106, 120
clear, 62
clip, 58, 103
cnormal, 82
cntrparam, 38, 103, 106, 145, 172
color resources, 230
colorbox, 35, 105, 135–137, 168
colornames, 34, 35, 105, 151
colors, 33, 34, 92, 140, 151
colorspec, 34, 48, 122, 131, 151, 156
column, 27, 84
columnhead, 18, 27, 84
columnheader, 23, 90, 120
command line editing, 22
command line options, 229
command-line-editing, 94
command-line-options, 37
commands, 61
comments, 17, 22, 71
commentschars, 22, 108
compatibility, 20
context, 184
contour, 38, 60, 102, 104, 105, 117, 152, 172
coordinates, 22, 97, 121–123, 131–133, 147, 154, 156,
160, 163
copyright, 16
corel, 186
cos, 26
cosh, 26
csplines, 82
cubehelix, 141
cumulative, 19, 20, 82
cycle, 124
data, 55, 73, 78, 106
data file, 78
datafile, 38, 63, 78, 98, 106, 117, 172
236
gnuplot 4.7
datastrings, 23, 55, 90
date specifiers, 114
debug, 187
decimalsign, 109, 112, 113, 125
defined, 27
degrees, 96
depthorder, 60, 136
dgrid3d, 19, 20, 109, 145, 152, 172
division, 25
do, 18, 62, 71
dots, 48
dpu414, 192
dumb, 187
dummy, 99, 111
dx, 54, 77
dxf, 187
dxy800a, 187
dy, 54, 77
edf, 76
editing, 22
editing postscript, 213
eepic, 187
ehf, 76
ellipse, 48, 132, 152
ellipses, 19, 47, 152
elliptic integrals, 28
emf, 188
emtex, 199
emxvesa, 189
emxvga, 189
encoding, 24, 111, 125, 197, 209, 211, 227
encodings, 111
enhanced, 24, 176, 208, 211, 212, 218, 219, 227, 228
environment, 25
eps, 32
epscairo, 189
epslatex, 189
epson 180dpi, 192
epson 60dpi, 192
epson lx800, 192
equal, 146
equal axes, 157
erf, 26
erfc, 26
error estimates, 65, 66
error state, 30, 95
errorbars, 78, 87
errorlines, 78, 87
errors, 30, 31
evaluate, 63
every, 79, 173
example, 80
examples, 85
excl, 193
exists, 27, 40
exit, 63
exp, 26
expint, 26
exponentiation, 29
expressions, 25, 93, 115
factorial, 28
failsafe, 55
FAQ, 17
faq, 17
fig, 193
file, 78
fill, 44, 46, 47, 51
filledcurves, 48
fillsteps, 19, 50
fillstyle, 45–48, 91, 131, 148, 151, 210
financebars, 46, 49, 148
fit, 25, 31, 63, 65, 85, 175
fit parameters, 65
fitting, 65
flipx, 54
floating point exceptions, 106, 233
floor, 26
flush, 136
fontfile, 33, 213–215
fontpath, 112, 214
fonts, 32, 195, 196, 199, 210, 229
format, 113, 152, 155, 159, 160, 164
format specifiers, 113
fortran, 106
fpe trap, 106
frequency, 82
fsteps, 50
function, 88, 115
functions, 31, 73, 88
gamma, 26, 233
gamma correction, 142
gd, 32
general, 74, 108, 142, 171
geographic, 159
geomean, 137
ggi, 194
gif, 32, 195
glossary, 33, 79
gnuplot, 16
gpic, 196
gprintf, 39, 113, 122
GPVAL, 30
graph menu, 224
graph-menu, 223, 226
grass, 196
grayscale resources, 231
grid, 116, 144
grid data, 105, 109, 170, 172
guidelines, 67
hcgi, 182
heatmap, 54
INDEX
INDEX
help, 70
help desk, 17
hidden3d, 60, 116, 118
histeps, 50
histograms, 51
history, 70, 94
historysize, 118
hotkey, 36
hotkeys, 36
hp2623a, 197
hp2648, 197
hp500c, 197
hpdj, 198
hpgl, 197
hpljii, 198
hppj, 198
ibeta, 26
if, 18, 62, 70, 175
if old, 71
if-old, 70
igamma, 27
imag, 27
image, 54, 57
imagen, 198
impulses, 55
index, 79, 80, 173
initialization, 19, 39
int, 27
internationalization, 233
interval, 150
introduction, 16
inverf, 26
invnorm, 27
isosamples, 38, 88, 117, 118, 145, 172
iterate, 71
iteration, 18, 52, 53, 62, 71, 89, 96, 174
jpeg, 32, 198
kdensity, 19, 20, 82
kdensity2d, 109
key, 91, 119
kyo, 199
label, 55, 122, 127
labels, 23, 55, 79, 123, 127
lambertw, 27
latex, 199
lc, 34
least squares, 63
legend, 119
lgamma, 27
libgd, 233
license, 16
line, 105, 147
line editing, 22
line resources, 231
gnuplot 4.7
linecolor, 34, 44, 46, 49, 57
lines, 55, 56
linespoints, 56, 150
linestyle, 56, 150
linetype, 19, 34, 56, 92, 124, 149, 150
linetypes, 33
linewidth, 56, 150
linux, 200
lmargin, 124
load, 71
loadpath, 124
locale, 109, 112, 125, 233
log, 27, 102
log10, 27
logscale, 125
lower, 72
lp, 56
lua, 200, 221
macros, 31, 40, 63
map, 61, 137
mapping, 126, 143
margin, 100, 124, 126, 129, 144, 156
Marquardt, 63
matrix, 74, 80, 108
max, 137
mean, 137
median, 137
metafont, 202
metapost, 204
mf, 202
mif, 204
min, 137
missing, 107
mixing macros backquotes, 41
modulo, 29
monochrome options, 230
mouse, 36, 37, 127, 218, 224, 227
mouseformat, 128
mousewheel, 128
mousing, 127
mp, 204
multi branch, 68
multi-branch, 64, 68
multiplot, 62, 128, 220
mx2tics, 130
mxtics, 130, 131
my2tics, 130
mytics, 131
mztics, 131
NaN, 26, 31, 85
nec cp6, 192
negation, 28
negative, 140
new features, 18
newhistogram, 53
237
238
NeXT, 206
next, 206
noarrow, 97
noautoscale, 98
noborder, 100
nocbdtics, 167
nocbmtics, 168
nocbtics, 168
noclip, 103
nocontour, 105
nodgrid3d, 109
nofpe trap, 106
nogrid, 116
nohidden3d, 116, 233
nohistorysize, 118
nokey, 119
nolabel, 122
nologscale, 125
nomouse, 127
nomultiplot, 128
nomx2tics, 130
nomxtics, 130
nomy2tics, 130
nomytics, 131
nomztics, 131
nonuniform, 170
nooffsets, 133
noparametric, 134
nopolar, 143
norm, 27
nosurface, 152
notimestamp, 154
nox2dtics, 158
nox2mtics, 158
nox2tics, 158
nox2zeroaxis, 158
noxdtics, 159
noxmtics, 160
noxtics, 162
noxzeroaxis, 165
noy2dtics, 165
noy2mtics, 165
noy2tics, 166
noy2zeroaxis, 166
noydtics, 166
noymtics, 166
noytics, 166
noyzeroaxis, 166
nozdtics, 167
nozmtics, 168
noztics, 168
nozzeroaxis, 167
object, 131
offsets, 126, 133
okidata, 192
one’s complement, 28
gnuplot 4.7
INDEX
OpenStep, 207
Openstep, 207
openstep, 207
operator precedence, 28
operators, 28
options, 17
origin, 62, 129, 133
output, 133
palette, 34, 92, 105, 122, 135, 136, 138, 139, 151, 156,
168
parametric, 99, 134
pause, 72
pbm, 207
pcl5, 197
pdf, 32, 208, 233
pdfcairo, 179, 208
pi, 31
placement, 119
plot, 73, 94, 169, 173
plotting, 38
pm, 209
pm3d, 60, 105, 135, 147, 151
pm3d resources, 232
png, 32, 210
pngcairo, 211
pointinterval, 56, 150
pointintervalbox, 143
points, 56
pointsize, 92, 143
polar, 19, 38, 57, 143–145
polygon, 132
pop, 153
position, 135
positive, 140
postscript, 32, 211, 213
practical guidelines, 67
prescribe, 199
print, 93
printing, 223, 224
projection, 60
prologue, 25, 190, 212, 215, 216
psdir, 144, 215
pseudocolumns, 81, 85, 86
pslatex, 179, 191, 215
pstex, 215
pstricks, 217
punctuation, 41
push, 153
pwd, 93
qms, 217
qt, 217
quit, 93
quotes, 17, 42
raise, 94, 228
rand, 27, 28
INDEX
random, 28
range frame, 164
rangelimited, 164
ranges, 63, 88
ratio, 145
raxis, 144
real, 27
rectangle, 131
refresh, 84, 87, 94
regis, 218
replot, 84, 94
reread, 71, 95
reset, 95, 96
restore, 160
rgbalpha, 54
rgbcolor, 34, 35
rgbformulae, 140
rgbimage, 54
rmargin, 144
rotate, 54
rrange, 19, 57, 100, 144, 145
rtics, 144, 145
samples, 81, 88, 117, 118, 145, 152
save, 96
sbezier, 82
scansautomatic, 136
scansbackward, 136
scansforward, 136
screendump, 224
scrolling, 128, 224
seeking assistance, 17
seeking-assistance, 233
separator, 84, 108
set, 96
sgn, 27
shell, 168, 174
show, 96
sin, 27
sinh, 27
size, 62, 129, 134, 145, 195, 199, 210
SJIS, 111
skip, 80
smooth, 19, 20, 81, 145
space, 36
special filenames, 82
special-filenames, 40, 169
specifiers, 113
specify, 41
splot, 73, 94, 116, 143, 169
sprintf, 27, 39, 122
sqrt, 27
square, 57, 145, 146
starc, 192
start, 39
start up, 39
starting values, 69
gnuplot 4.7
startup, 25, 39
statistical overview, 66
statistics, 173
stats, 19, 20, 173
steps, 50, 57
strcol, 27
strftime, 27
string operators, 29
stringcolumn, 27
strings, 39, 122
strlen, 27
strptime, 27
strstrt, 27
style, 85, 87, 88, 91, 122
styles, 91, 146, 148, 149
substitution, 39, 42, 125
substr, 27
substring, 27, 39
summation, 18, 30
sun, 219
surface, 60, 106, 152, 172
svg, 219
svga, 219
svgalib, 233
syntax, 17, 41, 113, 120, 156, 160
system, 27, 174
table, 152
tan, 27
tandy 60dpi, 192
tanh, 27
tc, 34
tek40, 219
tek410x, 220
term, 96, 175
terminal, 175
terminals, 153
termoption, 153
ternary, 29
test, 35, 92, 174
texdraw, 220
text, 42, 122, 209, 223
text menu, 224
text-menu, 226
textcolor, 34
tgif, 220
thru, 84
tics, 153
ticscale, 154
ticslevel, 154
tikz, 221
time, 19, 20, 27
time specifiers, 43, 114, 159
time/date, 42, 155, 159
timecolumn, 27
timefmt, 23, 89, 114, 123, 155, 159, 233
timestamp, 154
239
240
tips, 69
title, 23, 119, 156
tkcanvas, 221
tm hour, 27
tm mday, 27
tm min, 27
tm mon, 27
tm sec, 27
tm wday, 27
tm yday, 27
tm year, 27
tmargin, 156
tpic, 222
trange, 156
transparency, 54
transparent, 149
unary, 28
undefine, 174
unique, 81, 82
unset, 174
update, 65, 175
urange, 156
user defined, 31
user-defined, 88
using, 23, 26, 30, 43, 64, 84, 87, 88, 136, 173
UTF 8, 111, 215
valid, 27
value, 28, 31
variable, 44, 46, 49, 55–57, 81, 137
variables, 28, 30, 31, 36, 38, 65, 72
vectors, 57
vgagl, 222
vgal, 189
view, 157, 165, 169
voigt, 27
vrange, 157
vttek, 219
VWS, 223
vx384, 223
wgnuplot.ini, 225
wgnuplot.mnu, 225
while, 18, 175
windows, 223
with, 87, 88, 91, 119, 143, 146, 194
word, 27
words, 27
writeback, 160
wxt, 32, 226
X resources, 228, 230–232
X11, 227
x11, 17, 227
x11 fonts, 229
x11 mouse, 128
x2data, 158
gnuplot 4.7
INDEX
x2dtics, 158
x2label, 158
x2mtics, 158
x2range, 158
x2tics, 158
x2zeroaxis, 158
xdata, 23, 123, 155, 158, 165–167
xdtics, 158, 159, 165–167
xerrorbars, 58
xerrorlines, 59
xfig, 193
xlabel, 158, 159, 165, 166, 168
xlib, 233
xmtics, 158, 160, 165, 166, 168
xrange, 99, 144, 156–158, 160, 166, 168, 173
xterm, 219
xticlabels, 23, 86, 87
xtics, 101, 113, 116, 130, 145, 154, 158, 162, 166, 168
xyerrorbars, 58
xyerrorlines, 59
xyplane, 23, 154, 157, 165, 167, 169
xzeroaxis, 165
y2data, 165
y2dtics, 165
y2label, 165
y2mtics, 165
y2range, 166
y2tics, 166
y2zeroaxis, 166
ydata, 166
ydtics, 166
yerrorbars, 58
yerrorlines, 60
ylabel, 166
ymtics, 166
yrange, 166
ytics, 166
yzeroaxis, 166
zdata, 166
zdtics, 167
zero, 167
zeroaxis, 158, 165–167
zlabel, 168
zmtics, 168
zoom, 128
zrange, 168
ztics, 168
zzeroaxis, 167