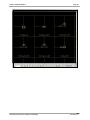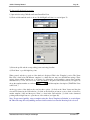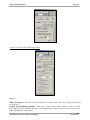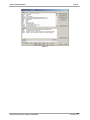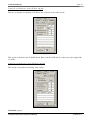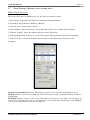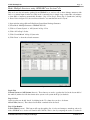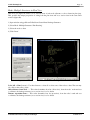
1
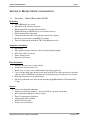
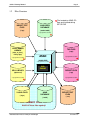
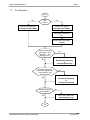
ASAD© Training Manual
Page 1
TRAINING OUTLINE
SECTION A: PROJECT SETUP (OTS MODULE 1)
1.1
Overview – General Facts about ASAD
module 1
1.2
Files Structure
1.3
User Flowchart
1.4
Create a New Project Database
(Lab)
1.5
Secondary Files Location
(Lab)
1.6
Program Options
(Lab)
1.7
Project ID
(Lab)
1.8
Create a New Storm Sewer System
(Lab)
1.9
Baseline Geometry
(Lab)
1.10
Profile Geometry
(Lab)
1.11
Cross Slope Geometry
(Lab)
SECTION B: DESIGN (OTS MODULES 2 & 3)
2.1
Structure Definitions (inlets, manholes, etc)
(Lab)
2.2
Pipe Definitions
(Lab)
2.3
Rainfall Intensity Tables
(Lab)
2.4
Outfall Definition & Storm Event
(Lab)
2.5
Create Nodes & Reaches
(Lab)
2.6
Edit Nodes
(Lab)
2.7
Edit Reaches
(Lab)
2.8
Compute Storm Sewer Geometry (north/east coords, reach lengths,
inlet/top/grate elevations, etc)
(Lab)
2.9
Draw Storm Sewer in Plan (basic)
(Lab)
2.10
Locate Nodes by Datapoint
(Lab)
3.1
Compute Pipe Sizes
(Lab)
3.2
Compute Flow Line (invert) Elevations
(Lab)
3.3
Compute Hydraulics (Storm Tabs)
(Lab)
3.4
Compute Roadway Spread & Inlet Intercept
(Lab)
3.5
Compute Storm Sewer Cost
(Lab)
3.6
Renumber Nodes & Reaches
(Lab)
3.7
Profile Elevation Inquiry
(Lab)
3.8
Divide & Combine Storm Sewer Systems
Automated Storm Sewer Analysis and Design
module 2
module 3
Version 3.x.x
ASAD© Training Manual
Page 2
SECTION C: PLANS PREPARATION (OTS MODULE 4 & 5)
4.1
CAD Window Layout
4.2
Reference Files
4.3
Levels & ASAD Master Level List
4.4
Draw Cells into Grid
(Lab)
4.5
Drawing in Plan View
(Lab)
4.6
Drawing in Profile View
(Lab)
4.7
Draw Drainage Structures (cross section view):
5.1
module 4
•
Single Structure
(Lab)
•
Multiple Structures using GEOPAK Cross Section Cells
(Lab)
•
Multiple Structures in Plan View
(Lab)
•
Multiple Structures in Grid
(Lab)
Summary of Drainage Structures
Automated Storm Sewer Analysis and Design
module 5
Version 3.x.x
ASAD© Training Manual
Page 3
SECTION A: PROJECT SETUP (OTS MODULE 1)
1.1
Overview – General Facts about ASAD
Hydraulics
•
•
•
•
•
•
•
•
Up to 1000 nodes per system
Maximum of 50 systems per project
Runoff computed using the rational method
Rainfall Intensity using IDF curves or user defined curves
Full and partial flows supported
Computes backwater curve with junction and exit loss options
Roadway spread analysis using HEC-22 method
Time of concentration worksheet, TR-55 and Kinematic wave.
Automatic Calculations
•
•
•
•
•
Pipe sizing
Pipe lengths (structure center-to-center & actual quantity lengths)
Inlet / Top / Grate elevations
Onsite drainage areas
Pipe invert elevations
Plans Production
•
•
•
•
•
•
Drainage structure cross-sections drawn
Storm sewer drawn in plan view
Profile view of storm sewer with hydraulic and energy grade lines
Cross section pattern lines drawn at each node location. These lines may be used by other
software such as GEOPAK to generate the existing and proposed roadway cross sections.
Drawings annotated to user specifications
All plans production tools draw directly into Intergraph/MicroStation CAD format files
(*.dgn)
Reports
•
•
•
•
•
•
•
Storm sewer hydraulic tabulation
Summary of drainage structures - draw into CAD or export to spreadsheet
Inlet spread/intercept/bypass analysis report
Time of concentration worksheet
Underground utility conflicts
Profile elevation report
Storm sewer cost analysis
Automated Storm Sewer Analysis and Design
Version 3.x.x
ASAD© Training Manual
1.2
Page 4
Files Structure
IMPORT TEXT
FILES
ASAD SEED
DATABASE
(*.inp)
(seedv3.mdb)
Files located on ASAD CD–
Rom and installed during
SETUP.EXE
c:\programfiles\asadv3\
LEVEL NAMES
LIBRARY
TOP FILES
(*.top)
(fdot_v8_level_
library.dgn)
ASAD
c:\programfiles\asadv3\
c:\programfiles\asadv3\
(ASAD3.EXE)
c:\programfiles\asadv3\
CAD
ENGINE
CELL LIBRARY
REPORT FILES
(drplan.cel)
(*.rpt)
c:\programfiles\asadv3\
c:\programfiles\asadv3\
V8 CAD FILES
(*.dgn)
ASAD
DATABASE
EXPORT TEXT
FILES
(*.mdb)
(*.txt)
PRIMARY FILES
BACK-UP these files regularly!
Automated Storm Sewer Analysis and Design
Version 3.x.x
ASAD© Training Manual
1.2
Page 5
User Flowchart
Start
No
New
Project?
Yes
Open an existing project:
Create a new project:
File>Open Project (MDB)
File>New Project (MDB)
Verify path to secondary
files:
Setup Project Information:
Project
Need to compute
pipe lengths, inlet
elevations, and
drainage areas?
No
Yes
Enter Baseline data:
Edit>Baseline Geometry
or
File>Import>Geometry
Need to compute low
point station adjustments,
inlet elevations, and
drainage areas?
Yes
Enter Profile data:
No
Edit>Profile Geometry
or
File>Import>Geometry
Need to compute
inlet elevations?
Yes
Enter Cross Slope data:
No
Edit>Roadway Cross
10
Automated Storm Sewer Analysis and Design
Version 3.x.x
ASAD© Training Manual
Page 6
10
Yes
Need to compute
drainage areas?
Enter Cross Width data:
No
Edit>Roadway Cross
Create a new drainage system:
Edit>Storm Sewer System
Define the outfall and storm event:
Edit>SS System Outfall and Header Details
No
Yes
Create multiple
nodes and reaches?
Create and edit individual
Create multiple nodes & reaches:
nodes:
Edit>Node/Reach Automatic
Create and edit individual
reaches:
Compute low point station adjustment, north & east
coordinates, reach lengths, inlet elevation, and drainage
areas:
Compute pipes sizes:
Compute/Reports>Step 2 – Compute Pipe Sizes
Compute pipe flow line elevations:
Compute/Reports>Step 3 – Set Flow Lines
Compute hydraulics and print storm tabulations report:
Compute/Reports>Step 4 – Compute/Print FDOT Storm
20
Automated Storm Sewer Analysis and Design
Version 3.x.x
ASAD© Training Manual
Page 7
20
Draw plan view – Drainage system, drainage areas, and
cross section pattern lines:
CAD>Storm Sewer>Draw Plan View
Draw profile view – Drainage system:
CAD>Storm Sewer>Draw Profile
Draw drainage structures in cross section view:
CAD>Storm Sewer>Draw Drainage Structures
Compute and draw Summary of Drainage Structures
sheets:
Don
Automated Storm Sewer Analysis and Design
Version 3.x.x
ASAD© Training Manual
1.4
Page 8
Create a New Project Database
1) Create the new project database (OTS.MDB) from the ASAD seed database (SEEDv3.MDB) using
pulldown File>New Project
Figure 1
2) Enter the ‘New Database Name’
3) Select the ‘Seed File Name’
Figure 2
4) Open the new project database (OTS.MDB). Use pulldown File>Open Project and select the file.
Figure 3
Automated Storm Sewer Analysis and Design
Version 3.x.x
ASAD© Training Manual
Page 9
Figure 4
1.5
Secondary Files Location
1) Verify the path to secondary ASAD files. Use pulldown File>Top Files/Report Files/Cell Libraries/Level
Name Library
Figure 5
1.6
Program Options
1) Set program options. Use pulldown Options
Figure 6
2) Set the number of monitors using the ‘Monitor’ tab.
Automated Storm Sewer Analysis and Design
Version 3.x.x
ASAD© Training Manual
Page 10
Figure 7
Automated Storm Sewer Analysis and Design
Version 3.x.x
ASAD© Training Manual
Page 11
3) Turn off the automatic ASAD Master Level List update function. Set the number seconds to 0.
Figure 8
4) Compress CAD file: Turn On (check) both options. ‘Cross Section Cell Coordinate Source’ set to
‘Vertices’.
Figure 9
Automated Storm Sewer Analysis and Design
Version 3.x.x
ASAD© Training Manual
1.7
Page 12
Project ID
1) Set the Project information using pulldown Project. Use pulldown File>Top Files/Report Files/Cell
Libraries/Level Name Library
Figure 10
1.8
Figure 11
Create a New Storm Sewer System
1) Use pulldown Edit>Storm Sewer System Add/Delete/Rename to create a new pipe network.
Figure 12
2) Key in the storm sewer system name in the ‘New System’ field and press the ‘Add’ button.
Automated Storm Sewer Analysis and Design
Version 3.x.x
ASAD© Training Manual
Page 13
Figure 13
Automated Storm Sewer Analysis and Design
Version 3.x.x
ASAD© Training Manual
Page 14
3) Select the new system name as the Active System using the listbox as seen in Figure 15.
Figure 15
1.9
Baseline Geometry
Enter Baseline by Key In
1) Use the Edit/Baseline Geometry pulldown to Key-in baseline data.
Figure 16
Automated Storm Sewer Analysis and Design
Version 3.x.x
ASAD© Training Manual
Page 15
2) In the ‘Header’ section, press the ‘Add’ button to enter the name of the baseline.
3) In the ‘Header’ section, enter the ‘Begin Station’ which equates to the station of the first P.I. (first
in the ‘Segment’ list).
4) In the ‘Segment’ section, click the ‘Add’ button to create a new P.I. in the segment list.
5) In the ‘Segment’ section, click on the row (from the table) of the segment to be entered. Key in
data into North, East and Arc Radius text boxes.
Figure 17
Enter Baseline by Importing
1) Use the File>Import>Geometry from GEOPAK Input Text File pulldown to import baseline data
from an ASCII text file.
Figure 18
Automated Storm Sewer Analysis and Design
Version 3.x.x
ASAD© Training Manual
Page 16
2) Select the ‘GEOPAK Chains’ tab.
3) ‘Browse’ to select the file to be imported.
4) Highlight the baseline(s), from the ‘Selection’ listbox, to be imported.
5) Click ‘OK’ to execute the import process.
Note: If importing a baseline that already exist in the ASAD database then check (ON) the
‘Overwrite existing’ checkbox.
Figure 19
1.10 Profile Geometry
Enter Profile by Key In
1) Use the Edit/Profile Geometry pulldown to Key In profile data.
Figure 20
Automated Storm Sewer Analysis and Design
Version 3.x.x
ASAD© Training Manual
Page 17
2) In the ‘Header’ section, press the ‘Add’ button to enter the name of the profile.
3) In the ‘Segment’ section, click the ‘Add’ button to create a new VPI in the segment list.
4) In the ‘Segment’ section, click on the row (from the table) of the segment to be entered. Key in
data into Station, Elevation, and Vertical Curve text boxes.
Figure 21
Enter Profile by Importing
1) Use the File/Import pulldown to import profile data from an ASCII text file.
Figure 22
Automated Storm Sewer Analysis and Design
Version 3.x.x
ASAD© Training Manual
Page 18
2) Select the ‘GEOPAK Profiles’ tab.
3) ‘Browse’ to select the file to be imported.
4) Highlight the profile(s), from the ‘Selection’ listbox, to be imported.
5) Click ‘OK’ to execute the import process.
Note: If importing a profile that already exist in the ASAD database then check (ON) the ‘Overwrite
existing’ checkbox.
Figure 23
1.11 Cross Slope Geometry
Figures 24 and 25 illustrate a typical roadway section.
Figure 24
Automated Storm Sewer Analysis and Design
Version 3.x.x
ASAD© Training Manual
Page 19
Figure 25
1) Use the Edit>Roadway Cross Slopes to edit pavement cross slopes of the typical sections.
2) Click on the ‘Add’ button and key in the new cross slope name.
3) Enter the distance between the baseline and its adjacent PGL location into the ‘PGL/Baseline
Tie’.
4) Enter up to 3 cross slopes moving away from the PGL.
Figure 26
Automated Storm Sewer Analysis and Design
Version 3.x.x
ASAD© Training Manual
Page 20
SECTION B: DESIGN (OTS MODULES 2 & 3)
2.1
Structure Definitions (inlets, manholes, etc)
1) Open the Structure Definitions window using pulldown Edit>Structure Definitions
Figure 27
Automated Storm Sewer Analysis and Design
Version 3.x.x
ASAD© Training Manual
Figure 28
Figure 30
Automated Storm Sewer Analysis and Design
Page 21
Figure 29
Figure 31
Version 3.x.x
ASAD© Training Manual
Page 22
Figure 32
Automated Storm Sewer Analysis and Design
Version 3.x.x
ASAD© Training Manual
2.2
Page 23
Pipe Definitions
1) Open the Pipe Definitions window using pulldown Edit>Pipe Definitions
Figure 33
Automated Storm Sewer Analysis and Design
Version 3.x.x
ASAD© Training Manual
2.3
Page 24
Rainfall Intensity Tables
1) Open the IDF Rainfall Intensity Table using pulldown Edit>IDF Coefficients
Figure 34
2) Open the Storm Time-Intensity Tables (user defined) using Edit>Storm Time-Intensity Tables (user
defined)
3) Click on the ‘Add’ button to create a user defined time-intensity table.
4) Enter the Time (in minutes) and the Intensity (inches per hour) the table.
Figure 35
Automated Storm Sewer Analysis and Design
Figure 36
Version 3.x.x
ASAD© Training Manual
2.4
Page 25
Outfall Definition & Storm Event
Figure 37
1) Use pulldown Edit> SS System Outfall and Header Details to open the window.
2) Enter information about the Outfall Node and Tailwater conditions (figure 38).
3) Select the Storm Event (IDF curves or User –Defined) and the default runoff coefficients (figure 39).
Figure 38
Automated Storm Sewer Analysis and Design
Figure 39
Version 3.x.x
ASAD© Training Manual
Page 26
4) Enter the Designed By and Checked By information in the ‘Designer’ tab (figure 40).
Figure 40
Automated Storm Sewer Analysis and Design
Version 3.x.x
ASAD© Training Manual
2.5
Page 27
Create Nodes & Reaches
1) Use Edit> Node/Reach Automatic Creation to open the Automatic Node creation window.
2) Select the Node and Reach settings for the nodes and reaches to be created.
3) Enter the beginning number and the total number of nodes/reaches to create.
4) Click ‘Add Nodes & Reaches’ to execute the process.
Figure 41
Figure 42
Automated Storm Sewer Analysis and Design
Version 3.x.x
ASAD© Training Manual
2.6
Page 28
Edit Nodes
1) Use Edit> Nodes to open the Node Edit window.
2) Click on a node in the listed.
3) Enter Station, Offset and Areas into each node. See figure 42 for this data.
4) Clicking on another node (in the list) automatically writes the previous nodes data to the database.
Clicking on the ‘Update’ button will also write the data.
Figure 43
Figure 44
Figure 45
Figure 46
Automated Storm Sewer Analysis and Design
Version 3.x.x
ASAD© Training Manual
2.7
Page 29
Edit Reaches
1) Use Edit> Reaches to open the Reach Edit window
2) Review the ‘From’ and ‘To Node’ for each reach.
3) Clicking on another reach (in the list) automatically writes the previous reachess data to the database.
Clicking on the ‘Update’ button will also write the data. See figure 42 for system layout.
Figure 48
2.8
Compute Storm Sewer Geometry (north/east coords, reach lengths,
1) Open this window using pulldown Compute/Reports> Step 1 - S.S. Geometry & Drainage Areas
2) Select options and click ‘Compute’ to execute the process.
Figure 49
Automated Storm Sewer Analysis and Design
Version 3.x.x
ASAD© Training Manual
2.9
Page 30
Draw Storm Sewer in Plan (basic)
1) Open a CAD file using pulldown File>Open Drawing
2) Browse and select C:\Program Files\ASADv3\DRAINSS.DGN
3) Use pulldown CAD>View>Fit Current System to set the CAD window position to location of the storm
sewer system. Note: no inlets or pipes will appear yet; they still need to be drawn into the CAD window.
4) Use pulldown CAD>Storm Sewer>Draw Plan View (see figures 50 & 51)
5) Press the ‘Draw’ button to draw the storm sewer into the CAD window.
Figure 50
Figure 51
2.10 Locate Nodes by Datapoint
> Nodes to open the Node Edit window.
2) Click on a node in the listed.
3) In the ‘Locations’ tab of the Node Edit window click on the ‘Options’ button (see figure 52) and set
Locate Node options.
Automated Storm Sewer Analysis and Design
Version 3.x.x
ASAD© Training Manual
Page 31
Figure 52
Automated Storm Sewer Analysis and Design
Version 3.x.x
ASAD© Training Manual
Page 32
4) Returning to the Node Edit window, click on the ‘Locate’ button. This CAD window is now waiting on a
point to be selected.
5) DP (data point) on the CAD window and the nodes’ Station and Offset fields will be updated with the
point chosen.
Figure 53
Automated Storm Sewer Analysis and Design
Version 3.x.x
ASAD© Training Manual
3.1
Page 33
Compute Pipe Sizes
1) Open this window using pulldown Compute/Reports> Step 2 - Compute Pipe Sizes
2) Select ‘1” in the ‘Use Pipes from Group’ pulldown box.
Figure 54
3) Compute the ‘Maximum HGL Slope %’ using the below process.
Farthest Inlet from
Outfall
Inlet Elevation: 11.88
Outfall
Tailwater Elevation: 9.75
Total Distance = 600ft
Figure 55
Farthest Inlet (from Outfall) Inlet Elevation:
11.88
Less 1.00’ of freeboard:
-1.00
Maximum HGL Elevation Allowed at Farthest Inlet:
10.88
Less Tailwater Elevation:
-9.75
Vertical Loss Available (Lv):
1.13
Divided by Total Distance (D):
600.00
Maximum Desired HGL Slope (ft/ft):
0.00188
or Maximum HGL Slope (%):
0.188%
4) Click ‘Compute’ to calculate pipe sizes.
Automated Storm Sewer Analysis and Design
Version 3.x.x
ASAD© Training Manual
3.2
Page 34
Compute Flow Line (invert) Elevations
1) Use pulldown Compute/Reports> Step 3 - Set Flow Lines
2) Select 2.5 ft/s as the ‘Minimum Velocity’
3) Click on Match: Flow Lines
4) Click on ‘Compute’ to set invert elevations for all pipes in the current system.
Figure 56
Inlet Elevation
(Node Edit window)
Flow Line (Invert) Elevation =
Inlet Elevation - Minimum Cover –
Thickness - Height
Minimum Cover
(Edit Structure Definitions>Other tab)
Thickness
(Edit>Pipe Definitions)
Height
(Edit>Pipe Definitions)
Automated Storm Sewer Analysis and Design
Version 3.x.x
ASAD© Training Manual
3.3
Page 35
Compute Hydraulics (Storm Tabs)
1) Use pulldown Compute/Reports> Step 4 - Compute\Print FDOT Storm Tabs
2) Select ‘FDOT Setup: No Minor Losses’ or ‘Setup: Include Minor Losses’
3) Click ‘Verify Data’ to check data validity (see figure 58)
4) Select the storm event ‘Frequency’ (not shown in figure 57)
5) Set the print order by clicking on the ‘Print Order’ button (see figure 59)
6) Click ‘Compute’ to calculate storm tab data.
7) Click ‘FDOT Tabs’ to view/print storm tab report
8) Review results graphically using the ‘Profile’ tab (see figure 60)
Figure 57
Figure 58
Compute/Reports> Step 4 – Print Order (button)
Automated Storm Sewer Analysis and Design
Version 3.x.x
ASAD© Training Manual
Page 36
Figure 59
Figure 60
Automated Storm Sewer Analysis and Design
Version 3.x.x
ASAD© Training Manual
3.4
Page 37
Compute Roadway Spread & Inlet Intercept
* * * Documentation not available
3.5
Compute Storm Sewer Cost
1) Open this window using pulldown Compute/Reports> Storm Sewer Cost Analysis
2) Click ‘Compute’ to calculate cost
Figure 61
Automated Storm Sewer Analysis and Design
Version 3.x.x
ASAD© Training Manual
3.6
Page 38
Renumber Nodes & Reaches
1) Open this window using pulldown Edit>Renumber Nodes & Reaches
Figure 62
2) Click ‘Step 1: Sort Nodes’ button.
3) Select sort options and click ‘OK’ (see figure 63)
Figure 63
4) Click ‘Step 2: Fill Columns…’ button.
5) Select fill options and click ‘OK’ (see figure 64)
Figure 64
5) Click on the ‘Step 4: Renumber’ button to execute the process (see figure 62)
Automated Storm Sewer Analysis and Design
Version 3.x.x
ASAD© Training Manual
3.7
Page 39
Profile Elevation Inquiry
1) Open window using pulldown Compute/Reports> Profile Elevation Inquiry
Figure 65
3.8
Divide & Combine Storm Sewer Systems
1) Open window using pulldown Edit>Divide/Combine Systems
Figure 66
Automated Storm Sewer Analysis and Design
Figure 67
Version 3.x.x
ASAD© Training Manual
Page 40
SECTION C: PLANS PREPARATION (OTS MODULES 4 & 5)
4.1
CAD Window Layout
1) Open a CAD file using pulldown File>Open Drawing
2) Browse and select C:\Program Files\ASADv3\DRAINSS.DGN
3) Use pulldown CAD>View>Fit Current System to set the CAD window position to location of the storm
sewer system.
Figure 68
View Controls
The ASAD CAD view controls behave much like the view controls of most all CAD packages in use today.
The view controls are located in two different parts of the screen. The first is the floating/dockable toolbar
(see figure 69)The second set of view controls is at the bottom of the CAD drawing window (see figure 70).
Figure 69
Automated Storm Sewer Analysis and Design
Figure 70
Version 3.x.x
ASAD© Training Manual
Page 41
Of the controls, the left-most control is ‘Update Window’. This option refreshes the current view of the
Drawing Window. Next, the ‘Window Area’ function allows the designer to magnify a portion of the
current view in the Drawing Window. After the command is initiated, the designer must select the area to be
magnified. This is accomplished by clicking on the Drawing Window and windowing the region for
magnification.
The ‘Zoom In’ and ‘Zoom Out’ commands magnify and reduce the area selected on the Drawing Window
respectively. The ‘Window Center’ function is similar to the ‘Window Area’ command in that the designer
selects the desired region of the view to magnify, but it will center the region within the limits of the screen.
The ‘Fit Current System’ is a valuable command and is unique to ASAD. It centers the Drawing Window
view on the current drainage system. The ‘Fit All’ function sets the view window around every element in
the CAD file.
The ‘Dynamic Pan’ and ‘Dynamic Zoom’ (available on the CAD window only) are new for ASADv3. Click
and hold the left mouse button to pan or zoom.
‘Previous View’ and ‘Next View’ (available on the CAD window only) are also new for ASADv3. They
allow the user to step backwards to previous views and step forward again.
Model Space
The current model name is displayed in the dropdown list at the bottom-left of the CAD drawing window.
Selecting a different model will automatically update the CAD drawing window with the model. Models
cannot be created or removed in ASAD. Those functions should be done in MicroStation.
4.2
Reference Files
1) Open window using pulldown CAD>Reference Files
2) Click on the ‘File Assist’ button.
3) Browse and select ‘C:\Program Files\ASADv3\Profrd01.dgn’
4) Click the ‘Attach’ button. The profile is now attached.
5) Zoom Out several times to notice the reference file (to the northeast of the project location)
6) Close window.
Automated Storm Sewer Analysis and Design
Version 3.x.x
ASAD© Training Manual
Page 42
Figure 71
Like MicroStation, ASAD CAD utilizes files loaded into the current design file called reference files. As
long as the reference files possess the same global origin and working units as the current file, they can be
overlaid into the current design file. The elements in a reference file may be viewed, measured, and copied
into the current design file, but they cannot be moved or deleted.
Certain attributes of a reference file may be manipulated by using the ‘Reference Files’ dialog (see figure
71). This dialog contains three main parts: attached file list, the display control, and the file attachment
controls.
The attached file list contains a listing of attached files. The display controls determine how the reference
files are viewed. Individual levels may be shown or hidden. The ‘Display’ check box determines whether
the highlighted reference file is to be displayed or not. Similarly, the ‘Reference Files On’ check box
toggles all the attached reference files on and off.
The ‘Attach Reference File’ section of the dialog is used to control the files attached as references. Files are
attached by selecting the file to be attached. The filename must be entered into the '
FileName'key-in. The
filename can be selected from a dialog by using the '
FileAssist'tool. The designer may enter a logical name
for the attached file. This is required when the same file is attached multiple times. A description may also
be entered.
Once the necessary file information is entered, the designer must push the ‘Attach’ button to attach the file.
If the designer wishes to attach the reference file only until they close the Drawing Window or exit ASAD,
then the ‘AttachSessionOnly’ option should be selected instead of the ‘Attach’ button. Files can be
detached by highlighting the desired file from the Reference Files list and pushing the ‘Detach’ button.
The displayed levels for the Reference Files are controlled by highlighting the desired reference file from
the ‘Reference Files’ list and then selecting the desired level to turn off or on. When the levels are selected,
the ‘Apply’ button must be pressed to accept the display changes.
Automated Storm Sewer Analysis and Design
Version 3.x.x
ASAD© Training Manual
4.3
Page 43
Levels & ASAD Master Level List
1) Open window using pulldown CAD>Levels>ASAD Master Level List
Previous versions of MicroStation used only numerical (1-63) values to designate levels. V8 introduced
alphanumeric (letters and numbers) level names that can be created by the user. This results in more
flexibility when dealing with levels in general but also creates a few problems. For instance, if a CAD file
has too many levels (some may have hundreds), they become hard to manage and cumbersome to find the
level you are looking for. Another nuisance occurs when a CAD file doesn’t have the level you wish to draw
to. In this case, you must create it.
Even though FDOT currently has over 1,300 levels defined for their projects, ASAD uses only fraction of
these to draw the drainage portions of a project. Because of this, ASAD maintains a ‘Master Level List’ in
each project database (*.mdb). This master list of level names is updated from the Level Names Library file
(see user manual section 1.2.2 on setting the path/filename) every time a project database (*.mdb) is opened.
If there is an updated levels library, simply replace the file and the next time ASAD opens it will retrieve the
latest level data. The ASAD master list has two primary functions. (1) it serves as an instant resource for
creating new levels in CAD files and (2) it allows you to limit the levels which populate the Level Names
pulldown boxes throughout ASAD. Setting the ‘Active’ field to ‘Yes’ will allow the level to be loaded into
the pull downs while ‘No’ will exclude the level.
Figure 72
If you try to draw to a level that does not exist in the currently opened CAD file, the ‘Missing CAD Level
Names’ window will popup (see figure 5.4). This window will display the missing level(s) and provide you
with solutions to the problem. The quickest of these is the ‘Auto’ option. This will retrieve the missing
level’s Name, Description, Number, Color, Weight, and Style and create the new level in the CAD file.
Results are displayed in the green list box at the bottom of the window. After the levels are created, close
this window and return to the original drawing function to continue.
Automated Storm Sewer Analysis and Design
Version 3.x.x
ASAD© Training Manual
Page 44
Figure 73
Print: Prints the list of missing level names to the default printer.
Auto: Automatically creates the missing level names into the currently open CAD file.
Manual: Use the Level/Layer Manager window to manually enter missing Level Names.
Close ASAD: Terminates the ASAD program thereby releasing the current CAD file for MicroStation to
manipulate (ie. create the missing levels).
Automated Storm Sewer Analysis and Design
Version 3.x.x
ASAD© Training Manual
4.4
Page 45
Draw Cells into Grid
1) Open window using pulldown CAD>Cells>Draw Cells in Grid
2) Select cell(s) to draw.
3) Click on ‘DP Grid’ and the left-click mouse in the CAD window to set the starting x and y coordinates.
4) Click on ‘Draw’.
The Draw Cells window (see figure 74) is used to draw cells in grid layout (see figure 75). This is typically
used to review cells as they are drawn by ASAD.
Figure 74
Library Used to Draw in (dropdown box): Drawing plan view, profile view and cross section view have
cell libraries associated with them (see section 1.2.2). Select the cell library to draw from.
DP Grid (button): Datapoint on the screen to set the top-left corner of the first grid.
Width & Height: Height and width of each grid.
Columns & Rows: The number of columns and rows in each grid.
Next Grid Distance: The distance from the bottom-left corner of one grid to the top-left corner of the next
grid.
Levels: Grid, Cell, and Origin Pointer (dropdown boxes): Select the levels to draw to.
Scale: Select the scale of the cells to be drawn.
Angle: Set the angle of the cells to be drawn.
Mirror: Mirror (flip) the cells either about the x axis (Mirror Horizontal) or about the y axis (Mirror
Vertical) or no mirroring.
Automated Storm Sewer Analysis and Design
Version 3.x.x
ASAD© Training Manual
Page 46
Figure 75
Automated Storm Sewer Analysis and Design
Version 3.x.x
ASAD© Training Manual
4.5
Page 47
Drawing in Plan View
To draw the storm sewer:
1) Open window using pulldown CAD>Storm Sewer>Draw Plan View
2) Click on slider until the text box shows ‘FDOT Plan View at 40’ Scale’ as seen in figure 76.
3) Click ‘Draw’
Figure 76
To draw the cross section pattern lines:
1) Open window using CAD>Storm Sewer>Draw Plan View
2) Click on slider until the text box shows ‘XS Pattern Lines’ as seen in figure 77.
Figure 77
2) Select the locations of pattern lines (see figure 78)
4) Click ‘Draw’ to draw pattern lines.
Automated Storm Sewer Analysis and Design
Figure 77
Version 3.x.x
ASAD© Training Manual
Page 48
To draw profile high and low points.
1) Open window using CAD>Storm Sewer>Draw Plan View
2) Click on slider until the text box shows ‘Profile High/Low Points’ as seen in figure 78.
Figure 78
Figure 79
3) Select the profile and the corresponding (same stationing) baseline.
4) Click ‘Draw’ to profile high/low points.
When opened, only the top portion of the window is displayed. This is the ‘Template’ portion. The ‘Draw
Plan View’ window has 20 different ‘templates’ to which the user may store 20 different settings. These
settings dictate which elements are to be drawn (i.e. inlets/pipe, area boundaries, pattern lines) and the
characteristics (i.e. font, size, level, etc) of the text labels to be placed. The window below (see figure 76)
shows the template number as seen here
, and the templates description (‘FDOT Plan View
at 40’ Scale’).
At the top portion of the window, the user has three options. (1) click on the ‘Draw’ button and the plan
view will be drawn in the CAD window. (2) click on the black arrow buttons to move back or forward to
another template (1-20) and then press ‘Draw’ to draw in the CAD window. (3) click on the downward
pointing white triangle button to open the rest of the window (see figure 80).
Note: To get started quickly, setup a template using the ‘Reset Template to Defaults’ as seen in figure
80. This will setup all level/symbology and text characteristics based on the Drawing Scale selected.
Automated Storm Sewer Analysis and Design
Version 3.x.x
ASAD© Training Manual
Page 49
Figure 80
Selecting elements to draw (Elements sub-tab):
Figure 80
Figure 5.7
Status (checkboxes): Select the nodes and reaches to be drawn by their status. For most projects this will
be ‘Proposed’
General Level/Symbology (button): This button opens another window which is used to set the
level/symbology and text characteristics for each element and text label to be drawn. See section 5.x.x for
further explanations of this window.
Automated Storm Sewer Analysis and Design
Version 3.x.x
ASAD© Training Manual
Page 50
All On/Off (buttons): Turns on or off all of the checkboxes on the ‘Elements’ sub-tab.
The following checkboxes indicate the elements to be drawn.
Nodes (Structures): Inlets, manholes, endwalls.
Nodes (Ditches): Cells at ditch node locations.
Pipes (Solid): Standard solid wall pipes.
Pipes (Perforated): Perforated pipes in French drains.
F.D. Trench – Top: Top of French drain trench.
F.D. Trench –Bottom/Slopes: French drain trench bottom and side slopes.
Ditches – Top: Top of ditch.
Ditches – Bottom: Bottom of ditch
Cell: Name of the cell to be drawn at Ditch node locations.
Scale: The scale used when the ‘Cell’ is drawn.
determine Nodes (Structures) (checkbox): This option
Note: The fields ‘Use ……. Specific Level’ are inactive in this version.
Setting the text labeling at the outfall node (Tx OutFl sub-tab)
Figure 80
Node Name (w/Oval) (checkbox): This option places the node name inside an oval.
Oval Width and Height: Sets the width and height of the oval.
Node Name (no Oval) (checkbox): Places the node without an oval.
HGL to Inlet El. Clear. (checkbox):
Places the distance from the hydraulic grade line (HGL) to the
inlet/top elevation. This is useful when reviewing HGL clearances.
User Defined: The user may define up to 6 lines of labels to be placed adjacent to the outfall node. Doubleclicking on any textbox will invoke the ‘User Define Text Variable’ window (see figure 81).
X and Y (for all labels): To prevent the text from being on top of the node, define the distance in the X and
Y directions from the node’s North and East coordinates.
Decimal Places: Sets the default number of decimal places for the outfall labels. This setting may be
overridden when using ‘User Defined’ labels.
Automated Storm Sewer Analysis and Design
Version 3.x.x
ASAD© Training Manual
Page 51
Figure 81
Automated Storm Sewer Analysis and Design
Version 3.x.x
ASAD Training Labs
Page 52
Setting the text labeling for nodes (Tx Node sub-tab)
This tab sets the plan view labeling of all other nodes (collection nodes) in the system.
Figure 82
This sub-tab is identical to the Tx OutFl sub-tab. Refer to the Tx OutFl sub-tab of this same section (figure 80)
for details.
Setting the text labeling for reaches (Tx Reach sub-tab)
This sub-tab sets the plan view labeling of the reaches.
Figure 83
Orientation (option):
Automated Storm Sewer Analysis and Design
Version 3.x.x
ASAD Training Labs
Page 53
Reach Bearing: The reach labeling will be rotated to the same bearing as the reach.
Set by Symbology: The reach labeling is rotated to the angle set by the ‘General Level/Symbology (button)’
window. See section 5.x.x.
Pipe Name (Solid & Perf): Labels the pipe name.
Reach Length (checkbox): Labels the length of the reach.
Flow Line Elevations (checkbox): Places the flow line elevations at the end of each pipe.
User Defined (check & text boxes): : The user may define up to 5 lines of labels to be placed adjacent to the
center of the reach. Double-clicking on any textbox will invoke the ‘User Define Text Variable’ window (see
figure 5.9).
X and Y (for all labels): To prevent the text from being on top of the reach, define the distance in the X and Y
directions from the reaches center point. When the option ‘Reach Bearing’ is selected, only an ‘Offset’ field
will be displayed. This offset is the distance above the reach (positive offset) or below the reach (negative).
Decimal Places: Sets the default number of decimal places for the reach labels. This setting may be overridden
when using ‘User Defined’ labels.
Settings (sub-tab):
Note: Each drawing window (Plan, Profile and Drain Structures) has a ‘Reset Template to Defaults’
function. This function is very helpful when starting a new project. It sets many variables and options
that could be overlooked, especially by a new user.
Using the ‘Reset Template to Defaults’ as seen in figure 84. This will setup all level/symbology and text
characteristics based on the Drawing Scale selected.
Figure 84
Drawing Scale: Scale of the drawing. In the case above, the scale is 1”=40’, hence the 40.
Reset (button): Set the elements and labels to be drawn, the level/symbology, text fonts and size, and decimal
rounding values to FDOT specifications
Automated Storm Sewer Analysis and Design
Version 3.x.x
ASAD Training Labs
4.6
Page 54
Draw in Profile View
1) Open window using pulldown CAD>Storm Sewer>Draw Profile
2) Click on the white triangle to open the bottom portion of the window.
3) Select the nodes to draw
4) Click on the ‘DP Relative’ button and left-click the mouse on the CAD window. The selected x & y
coordinates will be displayed.
5) Key in the ‘Station Reference’ and the ‘Elevation Reference’ of the coordinate selected.
6) Click draw.
Figure 85
Automated Storm Sewer Analysis and Design
Version 3.x.x
ASAD Training Labs
4.7
Page 55
Draw Drainage Structures (cross section view):
Mode: Single Structure
This mode is the same as in ASAD version 2. It will draw one structure at a time.
1) Open window using pulldown CAD>Storm Sewer>Draw Drainage Structures
2) Select Mode ‘Single Structure: DP Exact or Relative’
3) Select the node to draw from the node list.
4) Click ‘DP Exact’ and left-click mouse on the CAD window. The x & y coordinate will be displayed.
5) Click the ‘Structure’ button, the structure will draw on the CAD window.
6) Click paragraph and move the cursor over the CAD window and left-click mouse the place the paragraph.
7) Click ‘Oval’. The oval, with node number, will be drawn onto the CAD window directly above the
paragraph.
Figure 86
Previous, Current and Next (buttons): These buttons are used to move up and down though the node list.
DP Exact (button): Select the exact datapoint, in the CAD window, where you want the drainage structure to
begin drawing.
DP Relative (button): Select a point, in the CAD window, that equates to the ‘Offset’ and ‘Elevation’ as
entered below. Typically, this point is at the intersection of the vertical and horizontal lines of the GEOPAK
cross section cell as pointed to by the arrow in figure 87.
Automated Storm Sewer Analysis and Design
Version 3.x.x
ASAD Training Labs
Page 56
Figure 87
Offset: This value defines the offset of the point selected in the DP Relative button.
Elevation: This value defines the elevation of the point selected in the DP Relative button.
Structure (button): Draw the structure in the CAD window based on the point click (exact or relative)
Paragraph (button): Click this button and write-up paragraph will be attached to the cursor. Move the cursor
in the CAD window and click the left mouse button to place it.
Oval (button): After the paragraph has been placed, click on this button to draw the oval (with the node name
inside) above the paragraph.
Station Text (button): Use this button to drag the station onto the CAD window, click the left mouse button to
place it. You can then place an oval (with the node name inside) above.
Pipes Intersecting the XSection (button): Scan the all drainage systems and draw any pipes that pass through
the current cross section. This only works if DP Relative has been selected.
Automated Storm Sewer Analysis and Design
Version 3.x.x
ASAD Training Labs
Page 57
Mode: Multiple Structures using GEOPAK Cross Section Cells
This mode uses the information gathered from GEOPAK cross sections cells to draw drainage structures with
little or no manual input from the user. This mode is extremely fast. A simple 4-step routine takes only minutes
to draw 100’s of structures automatically. Routines - Step 1: List, Step 2: Select, Step 3: Synchronize, and Step
4: Draw. Notice in figure 5.33, the screen has widened to accommodate this mode’s layout.
1) Open window using pulldown CAD>Storm Sewer>Draw Drainage Structures
2) Select Mode ‘Multiple Structures: GEOPAK XS Cells’
3) Click on ‘Current System’ or ‘All Systems’ in Step 1: List
4) Click ‘All’ in Step 2: Select
5) Click ‘Scan & Match’ in Step 3: Syncronize
6) Click ‘Draw’ to draw the selected structures.
Figure 88
Step1: List
Current System and All Systems (buttons): These buttons are used to populate the list (in the bottom half of
the window) with nodes from the current active system or all systems in the project database.
Step 2: Select
At this step the user should ‘check’, by clicking in the ‘X’ column, those nodes to be drawn.
All and None (buttons): These buttons will check or uncheck all nodes listed.
Step 3: Synchronize
Scan & Match (button): This button will step through the list of nodes and attempt to match-up each node
with a GEOPAK cross section cell found in the CAD file. This is done by comparing the station of each node
Automated Storm Sewer Analysis and Design
Version 3.x.x
ASAD Training Labs
Page 58
with the station of each cross section cell (from the CAD window). If the two are within the ‘Station
Tolerance’ (+/- 5 feet in this case), then the xsStation, xsElev, xsCoord (X), and xsCoord (Y) columns in the
list will be updated with values gathered from the cross section cell.
With steps 1-3 completed, take notice of the results window (green background with white text) at the bottom
of the window. This section notifies the user of any nodes that were not matched-up or any other problems that
may need attention.
Step 4: Draw
Draw (button): Press this button and sit back and relax. For the next 60 seconds or so, ASAD will read through
the list and draw those structures that are (1) checked (‘X’ in the far left column) and (2) have a non-zero
xsCoord (X) OR xsCoord (Y) value. The CAD window will move from cross section to cross section as ASAD
draws and labels the structures.
Automated Storm Sewer Analysis and Design
Version 3.x.x
ASAD Training Labs
Page 59
Mode: Multiple Structures in Plan View
This mode (see figure 89) draws a cross sectional view of each node adjacent to node as drawn in plan view.
This provides the unique perspective of seeing both the plan view and cross section view in the same CAD
window (figure 90).
1) Open window using pulldown CAD>Storm Sewer>Draw Drainage Structures
2) Select Mode ‘Multiple Structures: Plan Drawing’
3) Select the nodes to draw
4) Click ‘Draw’
Figure 89
Figure 90
Select All or None (buttons): Use these buttons to select all or select none of the nodes to draw. The user may
also click on the nodes to draw.
Offset distance from Node …: This value determines how far (offset wise), from the nodes’ north and east
coordinates, the drainage structure (cross section view) is to be drawn.
Distance up-station from…: This value determines how far (up-station), from the nodes’ north and east
coordinates, the drainage structure (cross section view) is to be drawn.
Automated Storm Sewer Analysis and Design
Version 3.x.x
ASAD Training Labs
Page 60
Mode: Multiple Structures in Grid
This mode (see figure 91) will draw the drainage structures into a user-defined grid (see figures 92 and 93) that
can be reviewed in CAD or plotted to paper and reviewed for quality control purposes.
1) Open window using pulldown CAD>Storm Sewer>Draw Drainage Structures
2) Select Mode ‘Multiple Structures: Grid Layout’
3) Select the nodes to draw
4) Click ‘DP Grid’ and left-click mouse on the CAD window. The x & y coordinate will be displayed.
5) Click ‘Draw’
Figure 91
Automated Storm Sewer Analysis and Design
Figure 92
Version 3.x.x
ASAD Training Labs
Page 61
Figure 93
Select All or None (buttons): Use these buttons to select all or select none of the nodes to draw. The user may
also click on the nodes to draw.
DP Grid: Click (or snap) on the top-left point of the first grid to be plotted.
Width and Height: Define the height and width of each grid.
Columns and Rows: Set the number of columns and rows in the grid. In this case, 12 (4 columns x 3 rows)
structures will be drawn in each grid. Each cell in the grid is 75 units wide (width 300 / 4 columns) and 66.67
units high (height 200 / 3 rows).
Next Grid Distance: When multiple grids are needed, this value sets the distance between bottom of one grid
and the top of the next. In this case (see figure 5.37) there are 40 nodes to be drawn. Since each grid holds 12
structures, it will take 4 grids to hold all of them.
Grid Level: The grid is drawn on this level name.
Draw Grid (checkbox): The grid lines can be turned off. Use this checkbox to turn on (checked) or off
(unchecked) the grid lines.
Automated Storm Sewer Analysis and Design
Version 3.x.x
ASAD Training Labs
5.1
Page 62
Summary of Drainage Structures
The ‘Summary of Drainage Structure’ (SDS) window is used to tabulate the quantities of structures and pipes in
the FDOT standard format. As seen in figure 94, this screen employs a Step 1, Step 2, etc. approach to
computing and drawing/exporting the summary of drainage structures data.
1) Open window using pulldown Compute/Reports>Summary of Drainage Structures
2) On Step 1 tab, click ‘Clear Column Setup’ (figure 94)
3) On Step 2 tab, click ‘Scan & Build>Sort>Re-Scan’ (figure 95)
4) On Step 3 tab, click ‘Reset Levels’ (figure 96)
5) On Step 4 tab, click ‘Worksheet’ (figure 97) and click ‘Apply’ on the SDS Sheet Dimensioning Tool (figure
98)
6) On Step 5 tab, click ‘DP’ and left-click mouse on the CAD window. The x & y coordinate will be displayed.
(figure 99)
7) Click ‘Draw’.
Figure 94
Clear Column Setup (button): Start creating a new SDS table by clearing the table and the column headers.
Column headers contain the column #, the column identifier (<Station>, P-1, 18RCP, etc), and the column order
number which is used to set the order in which the columns appear in the table. This step gives you a clean slate
to work with.
Automated Storm Sewer Analysis and Design
Version 3.x.x
ASAD Training Labs
Page 63
Figure 95
Scan & Build>Sort>Re-Scan (button): This button has a long title, but it deserves it; it does a lot of work.
First, it scans all nodes and reaches in every system and builds the SDS table. Next, it sorts the column headers
based on their Column Order Number (see sections 3.6.5 and 3.7 for more on column data as defined in the
Structure and Pipe definitions, respectively). Finally, it scans the node and reach data again and places the data
into the correct columns. All of this with a push of a button.
Scan & Build Only (button): This button is similar to the above button except it assumes that you have the
columns already in order. It scans the data and places it into the appropriate column without any sorting.
Include Columns (checkboxes): This section determines which of the ‘Standard’ FDOT columns should be
included in the SDS table.
Decimal Places (dropdown list): Sets the number of decimal places the quantities will be rounded to.
Use Double Quotes for Inches (checkbox): Turns, on or off, the option of displaying double quotes (“) after
the pipe size value in the <Pipe Size> column. The double quote (“) indicates the measurement is in inches.
Pipe Length (option): This option selects the source of the pipe length quantities. Select ‘Quantity’ or
‘Hydraulic’ (center-to-center) length.
Column Headers from Structure & Pipe Definitions (checkbox): This option tells ASAD to get the column
headers and column order number from the structure and pipe definitions. The alternative is for the user to
manually create the column identifiers for each column.
Figure 96
Reset Levels (button): This button will automatically reset ALL levels for ALL the elements (text and lines) to
be drawn into CAD. The levels will be set to FDOT standards.
Automated Storm Sewer Analysis and Design
Version 3.x.x
ASAD Training Labs
Page 64
Figure 97
Worksheet (button): This button invokes SDS Sheet Dimensioning Tool (see figure 5.55) that is used to
compute the size of the text (headers, details, sub-totals, and totals) as well as row heights and column widths.
Figure 98
SDS Sheet Dimensioning Tool (window): The Summary of Drainage Structure (SDS) sheets are usually
drawn, into CAD, to fit inside a border. The task of computing line spacing, font sizes, and columns widths, to
fit into a border, can be quite time consuming. The ‘SDS Sheet Dimensioning Tool’ (see figure 5.55) window
was created to automate this process. Enter in the fields (below) and let ASAD do the number crunching.
Max Height: The maximum height from the top-left corner, of the draw able portion of the border, to the
lower-left corner.
Head Rows 1-4: The percentage of the MaxHeight allocated for the four rows of column Header labels. These
values are typically 2% for rows 1-3 and 1.5% for row 4.
Sub-Total & Grand Total Rows: The percentage of the MaxHeight allocated for the Sub-Total and Grand
Total Rows. These values are typically 1.5%.
# of Main Body Rows: The number of rows on each sheet filled with data. Thirty-five (35) strikes a nice
balance of quantity of data per sheet verses readability of the sheet.
TH % of Row HT: The text height relative to the distance between row lines. Default is 60%.
TW % of TH: The text width relative to the text height. Default is 75%.
Sheet Width: The width from the top-left corner, of the draw able portion of the border, to the top-right
corner.
Automated Storm Sewer Analysis and Design
Version 3.x.x
ASAD Training Labs
Page 65
Columns: The number of columns in the SDS. When the ‘SDS Sheet Dimensioning Tool’ window opens, it
will have the number of columns as per the SDS table. If other columns (such as ‘Sod’, ‘Steel’, ‘Class I,
Concrete’, etc) are needed, simply add to this number to ensure enough space for all columns.
Column Reserve: This is used to reserve extra space at the right side of the table for columns that may be
added at the end of the process. The ‘Remarks’ column is a good example of this. The default is 15% of ‘Sheet
Width’
Text Justification: This is used to set the text justification for the Header, Detail, and Totals text. This should
bet set to ‘7’ for Center-Center.
Sheet Spacing: Set the distance from the top left corner of the first sheet to the top left corner of the next sheet
below.
Automatically set column widths for identifier columns: The first eight columns (identifier columns such as
Station, Barrels, Structure Number, etc.) do not all have to be set to the default column width. They are usually
some percentage of the default width. For instance the Qty column (noted by <P/F>) is usually about 35% of
the default column width while the Station (noted by <Station>) is typically 140% of the default widths. Turn
on (Checked) this check box to compute the column width using this method. If this checkbox is off
(Unchecked) then each of these columns will be assigned the default column width. Compute (button):
Computes the text heights and widths, the line spacing, and column widths as seen in the ‘Results’
Print (button): Prints the results to a default printer.
Apply (button): Writes the ‘Results’ to the appropriate fields in other tabs of the ‘Summary of Drainage
Structures’ window.
Figure 99
Include (section): Sets which elements of the drawing to draw.
DP (button): Select the top-left corner of the border. All elements will be drawn relative to this point. Draw
(button): Draw in to CAD.
Export (button): Export is another way to manipulate the SDS data. You will prompt for a file name to export
to. This routine creates a tab-delimited ASCII file which can be easily opened with Excel.
Automated Storm Sewer Analysis and Design
Version 3.x.x