1
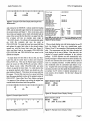
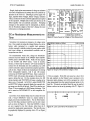
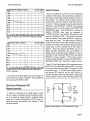
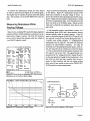
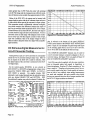
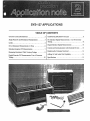
SYS-127 APPLICATIONS
TABLE OF CONTENTS
Overview of SLEXE Software
2
COMPUTE LINEARITY Function
Single Point DC and Resistance Measurements
3
Limits
4
DC Stimulus-Digital Measurements: A-to-D Converter
Testing
12
DC or Resistance Measurements vs Time
6
Stimulus-Response DC Measurements
7
Measuring Resistance While Varying Voltage
9
Digital Stimulus-DC Measurements: D-to-A Converter
Testing
10
Digital Stimulus-Digital Measurements
11
13
Control and Communications with External Devices . . . 13
Replacing the Computer Keyboard
14
Adding AC and Audio Test Capability
14
Specifications
15
SYS-127 Applications
Audio Precision, Inc.
SYS-127 APPLICATIONS
This applications note deals with dc, resistance, and digital
tests and control which can b e done automatically (and
graphically) with the SYS-127. It is not intended to be a
comprehensive treatment of all the types of tests which
could be done with this instrument. Instead, the purpose of
this note is to stimulate the reader's ideas in his or her own
applications area by discussing a number of specific examples.
The SYS-127 consists of the Audio Precision DCX-127
multi-function dc and digital input-output instrument plus
the interface card, cable, and comprehensive software package necessary to operate it from an I B M P C , XT, A T , or
386-compatible computer. T h e software requires 640k
memory and a CGA, E G A , VGA, or Hercules monochrome
graphics display system. It may be used with one or more
diskette and/or hard disk drives. A math co-processor is
highly recommended for fastest operating speeds, but is not
required.
The DCX-127 includes a 4 1/2 digit autoranging dc
voltmeter-ohmmeter, two independently
controllable
precision voltage sources variable across a ±10.5 Volt dc
range with 2 0 microvolt resolution, 21-bit plus sign parallel
digital input and output words, and 24 bits of control logic
outputs plus several other features. Digital I/O and control
logic outputs are LSTTL-compatible. For specifications,
see the last two pages of this note.
A comprehensive software package named S l . E X E
(S1H.EXE for the Hercules version) is included as part of
the SYS-127. This software (referred to as S l in the
remainder of this note) is menu-panel-graph oriented. N o
knowledge of any computer programming language is required, nor is prior experience in programming.
The software permits real-time measurements to be
viewed in either analog bargraph or numeric display forms.
It also permits real-time graphs of one or two simultaneous
measurements to b e plotted against a swept dc or digital
stimulus or against time in chart recorder fashion. Any test
setup can b e saved to disk for later use. Data can be saved
to disk and later retrieved for display in color graphic,
monochrome graphic, or tabular formats. Multiple tests can
be linked together into complete test procedures by a
keystroke "learn mode" which requires no programming experience. Limits can b e created and attached to any test for
go/no-go results comparison. Graphic or hard copy printout
can b e made to economical dot-matrix printers at the touch
Page 2
of a key, or automatically during a procedure. The DCX127 additionally has features which permit replacing the
computer keyboard with a simple keypad or a few switches
in those applications where a full computer keyboard may
be intimidating to unskilled operators.
This applications note will discuss many of the capabilities
of the SYS-127 and will show examples of each class of applications. Many other applications will b e similar to those
discussed here, and the test setups and procedures can be
patterned on those shown in this note.
Overview of S1.EXE Software
The software furnished with an SYS-127 was developed to
control Audio Precision's comprehensive System One audio
test system, of which the DCX-127 is o n e optional component. There are therefore many features of the software
which are not relevant to DCX-127 applications. They will
not impede DCX-127 operation, however.
S LEXE software control capability includes a single-line
menu at the bottom of the screen plus eight panels. Only
three of those panels are used in DCX-127 operation. A
companion diskette to this applications note contains a number of tests, procedures, and batch files. T h e batch files
DCX.BAT or DCXH.BAT may b e used for maximum convenience in loading and using the SYS-127. If the software
is started from the DOS prompt with the command DCX (or
DCXH, for Hercules monochrome version software), the
corresponding batch file on the diskette loads S l software
and runs a procedure which selects the three relevant panels.
This process also loads a test file named STD.TST (standard
test) which has pre-selected the DCX-127 as the stimulus
source and measurement to b e displayed for graphic testing.
The menu structure has two levels for most activities. The
top level (CMD, for C O M M A N D ) is reached from any
screen via the <Esc> key (see Figure 1). Selecting most
items in the C M D menu causes a second-level menu to be
displayed for that particular action. See Figure 2 for an il-
p ; H FiIL im SiE APPEHD EMI HElP XiS DOS NAMES IF UTIL WIICOHPUIE
Bun procedure, test, or gratis
AOiIJ PSECISIi SYSTEM OiE, vUK
Figure 1 Command Menu
Audio Precision, Inc.
U t t : § | LIMIT i I E f COfIIM FlCECiI HAGiO DATA R IHAGI OVElLAY
Load entire test f r a .TST file
AOiIO PICISION SYSTIM 0 1 , vl.UC
Figure 2 Load Menu
lustration of the LOAD menu, obtained by selecting LOAD
from the CMD menu. Some CMD menu selections such as
PANEL are single level. The menu is used primarily for
computer-intensive actions such as loading a test setup from
disk into memory, saving test setups or data to disk, linking
together multiple tests into procedures, attaching limit files
to tests, making temporary exits to the computer operating
system to run other programs during a procedure, etc.
Selection of menu items is done in either of two fashions.
" ne is by using the space bar to move the inverse-video cursor onto the desired item, then pressing the <Enter> key.
The second method is simply to press the key corresponding
to the first character of the menu item-<L> for Load, <T>
for Test, etc.
While the menu is used for computer-oriented actions,
PANEL mode is used to actually control the DCX-127 instrument and to display "spot" measurements. If the
software was loaded with the DCX or DCXH batch file
process described above, or if the procedure DCX.PRO was
run after software startup, the panels displayed when
PANEL is selected will be as shown in Figure 3. If other
panels have accidentally or deliberately been displayed,
load and run the procedure DCX.PRO to restore these three
panels to the screen.
SYS-127 Applications
The DCX-127 control and display panel is displayed at the
left of the screen. The SWEEP TEST DEFINITIONS panel
is displayed at the screen center, and the SWEEP SETTLING panel at screen right.
For simple real-time setting of the DCX-127 dc or digital
stimulus and simple observation of the dc, resistance, or
digital measurements, only the DCX-127 panel is necessary.
The SWEEP TEST DEFINITIONS panel permits setup of
sweeps of dc or digital stimulus and selection of which
measurements will display as lines on a graph when the F9
function key is pressed to start a test. This panel also permits flexible selection of units and graphic coordinates.
Real-time bargraphs (see Figure 5) may be displayed by
pressing the F2 function key. The SWEEP TEST DEFINITIONS panel also controls the bargraph calibrations.
The SWEEP SETTLING panel controls how Sl software
determines whether measurement results are sufficiently
steady-state to retain and plot a measurement point. The
settling concept involves continually examining the stream
of measurements furnished by the DCX-127 hardware.
Only when the several most-recent measurements agree
with one another within a tolerance "window" specified by
the user on the SWEEP SETTLING panel will the software
retain and plot the most recent point and move on to the
next measurement. Settling may be turned off when it is
desired to plot every measurement, regardless of data variations.
Additional capabilities and features of Sl software will be
discussed as they apply to specific applications described
below. A comprehensive treatment of Sl software may be
found in the User's Manual, furnished with the SYS-127
system.
Single Point DC and Resistance
Measurements
Figures DCX-127, Sweep Test Definitions, and Sweep
Settling Panels
Dc voltage up to 500 Volts can be measured with the
DCX-127. Resolution of the voltmeter varies from 10
microvolts on the 200 mV range to 0.1 Volt on the 500 Volt
range. Resistances up to 2.5 Megohms can also be
measured, with resolution varying from 10 milliohms (200
Ohm range) to 200 Ohms (2 Megohm range). Four-wire
(Kelvin) connections may be made to the unknown device
to reduce the influence of lead resistance when measuring
low values of resistance.
Page3
SYS-127 Applications
Audio Precision, Inc.
Dc or resistance measurement mode is selected in the top
line of the DCX-127 panel; see Figure 3. Dc voltage may
be directly displayed in Volts and millivolts, or f(V) may be
selected. With f(V) as units, the actual dc measurement will
be scaled and offset by the "scale" and "offset" values
entered on the DCX-127 panel before display. Similarly,
resistance may be displayed as Ohms or may be scaled and
offset with f(fl). Offset and scaling are commonly required
when the device being measured is a transducer such as a
temperature or pressure sensor. Appropriate selection of
offset and scaling factors can then often produce a display
directly in engineering units such as degrees or pounds per
square inch.
If it is desired to do more than simply observe readings on
the DCX-127 panel, the SWEEP TEST DEFINITIONS
panel and certain function keys come into play. For singlepoint measurements of dc or resistance which can be compared to limits, saved to disk, or printed, select DCX NONE
as SOURCE-I at the bottom of the panel This mode
automatically selects tabular display even if MONOGRAPH or COLOR-GRAPH is selected, and creates a
single-point measurement. At DATA-I, select DCX, then
the desired dc or resistance mode. To obtain resistance
modes on the SWEEP TEST DEFINITIONS panel, OHMS
or f(0) must have been selected on the DCX-127 panel.
Similarly, Vdc or f(V) must be selected on the DCX-127
panel if DATA-I is to be selected as dc voltage. Example
single-point test files for measuring voltage and resistance
are stored on the diskette under the names SING-VDCTST
andSING-OHM.TST.
Figure 5 Bargraph Display of DCX-127 Measurements
function key, the display would be identical to Figure 4 except for the new test name which you supplied.
CELL19.TST is stored on the diskette as an example.
The measurement may also be displayed on the computer
screen in analog bargraph fashion by pressing the F2 function key. The end points of the bargraph and the logarithmic or linear relationship of the bargraph to the data are
selected at the DATA-I area near the top of the SWEEP
TEST DEFINITIONS panel. See Figure 5 for an example
bargraph display. The rate of updating of the bargraph is
controlled by the 6/second vs 25/second rate selection for
the DCX-127 panel numeric display, selected on the DCX127 panel. The faster rate provides more rapid feedback for
making adjustments, but the slower rate provides better
resolution for critical tests.
When the selections are made, press F9 for a measurement. The name of the test, date and time, and the measurement will be displayed on the screen (see Figure 4). To Limits
save the setup or data, <Esc> to the menu, use the Save Test
command, and supply an appropriate file name to avoid
In automated testing, it is often desired to have the comover-writing the STD.TST file automatically loaded by the puter compare a measurement to allowable performance
DCX.PRO procedure. If we were setting up a battery cell limits and make a decision as to whether to accept the
test for a model 19 cell, for example, we might select a result. Limit files are easily created in Sl software in the
name such as CELL19. Sl software will automatically Edit Data mode. The following discussion is an overview
supply the .TST file extension when <Enter> is pressed. If of limits file creation and use; see the User's Manual for
you were now to re-display the test result by pressing the F7 more details.
Figure 4 Screen Display of Single-Point Measurement
Page 4
Load the test file to which limits will be attached and press
<Esc> Edit Data. Figure 6 shows a typical result, with the
column heads plus data if the F9 key has been pressed.
Move the cursor into the second line, below the column
heads. Use the delete key or block delete capability (F6
<Ctrl><PgDn> F6) to erase any data there. Type in a zero
SYS-127 Applications
Audio Precision, Inc.
Figure 6 Example of Edit Data Display After Single-Point
Measurement
and comma for the SOURCE-I column (under the heading
OFF), and the allowable upper limit for the measurement in
the second column; see Figure 7. <Esc> to the menu, select
Save Limit, and supply a name which will identify both the
name of the test and the fact that this is an upper limit file.
For a battery cell test, an example name might be
HLL19UP <Enter>. Sl software will automatically supply
the XIM file extension and save the result as
CELL19UP.LIM. To create the lower limit, press Edit Data
and replace the upper limit value in the second column,
second row with the lower limit value (see Figure 8).
<Esc> and Save Limit as, for example, CELL19L0.LIM.
CELL19UP.LIM and CELL19L0.LIM are stored on the
diskette as examples.
Figure 9 Names Display
When a tabular display test with limits attached is run (F9
key), the display will show any outside-limits result.
Figures 10 and 11 are examples of both passing and failing
tests. The measurement and the limit value exceeded are
both displayed in the case of failure. Note that this is the
simplest of several pass/fail techniques in the software
package. SLEXE software can also automatically write
To attach these two limit files to the test file, use <Esc> passing messages or failure data into an error summary file,
Load Test and the cursor keys to select and re-load the and one error summary file can be used for any number of
CELL19.TST test. Then use the Names Upper command, tests in a complete procedure. S LEXE software can also
place the cursor on CELL19UP.LIM, and press <Enter>. take conditional action in a procedure upon failure or sucUse Names Lower, select CELL19L0.LIM, and press cess. Coupled with screen and logic output capabilities, an
<Enter> to specify the lower limit. To verify that the files automatic procedure can thus signal the pass/fail decision to
are properly attached, select Names; you should see a dis- an operator via PC screen or separate annunciator or can
play similar to Figure 9. This shows the test name and limit even control a device handler. See the User's Manual for
file names. The test file must now be re-saved with these more details.
limit file names attached, in place of the original version of
CELL19.TST. Press <Esc> Save Test, <Enter>, and press
Y to approve of the software over-writing the original test
version which did not have limit files specified.
Figure 10 Example Screen Display, Passing
Figure 7 Example Upper Limit File
Figure 8 Example Lower Limit File
Figure 11 Example Screen Display, Failing
Page5
SYS-127 Applications
Audio Precision, Inc.
Simple, single-point measurements of voltage or resistance
with limits comparisons are perhaps the most common application of the SYS-127. Checking dc power supply voltages, amplifier offset voltages, battery voltages, resistance
values, and dozens of other common applications are typical
of this operation. Multiple tests on the same device can be
linked together into an automatic procedure. Prompting
messages to the operator may be interspersed as desired.
See the Procedures chapter of the User's Manual for more
information on creating procedures.
DC or Resistance Measurements vs
Time
Figure 12 Setup Panels for Voltage vs Time Measurement
Sometimes it is necessary to measure a dc voltage versus
time. One example is testing the charge lifetime of a cell or
battery while connected to a specific load resistance.
Another example is stability testing of power supplies while
load, input voltage, or environmental conditions such as
temperature are varied.
For measurements versus time, change the SOURCE-I
selections near the bottom of the SWEEP TEST DEFINITIONS panel to EXTERN TIME. Fields will then appear
for the START and STOP values. Units of seconds,
minutes, or hours may be selected. LIN would normally be
selected for the horizontal axis time calibration, but LOG
could be selected to space measurement samples logarithmically in time. Figure 12 shows an example panel for testing
NiCd rechargeable batteries, with O and 180 minutes
selected as the START and STOP times. Enter a value for #
STEPS which will produce data samples of the desired frequency during the test. For the example shown, the 180
minute duration and 720 STEPS will cause a reading to be
taken every 15 seconds. At DATA-I, select GRAPH TOP
and BOTTOM values to properly display the expected voltage range over the life of the test. Press F9 to start the test.
Figure 13 is an example of a NiCd battery discharge. This
test is stored as DCVSTIME.TST on the companion diskette.
Limit files of any desired shape may be created for tests
with a "swept" SOURCE-I value in a manner similar to
single point limits described above. For the NiCd battery
test, the Edit Data command could be used to enter values
such as shown in Figure 14. Note that SOURCE-I values
are now required in the first column, rather than the 0
entered for single-point measurements. The limit file may
be graphically displayed by pressing <Esc> F7; see Figure
Page 6
Figure 13 Graph of Ni-Cd Battery Voltage vs Time
15 for an example. If this file were saved as a lower limit
file and attached via the Names Lower command, every
data point taken during a test will be compared to a limit
value interpolated from the nearest horizontal points in the
limit file. If desired, an attached limit file may be graphed
before or after a test is run by pressing <Alt>F7. Figure 16
Figure 14 Lower Limit File for Nl-Cd Battery Test
Audio Precision, Inc.
SYS-127 Applications
Nested Sweeps
Figure 15 Graph of Limit File for Ni-Cd Battery Discharge
Test
The two dc outputs of the DCX-127 can be particularly
valuable in such testing, with one driving one junction or
port while a second controls another junction or serves as a
power supply. Sl software permits a feature known as
nested sweeps, which can create an entire family of curves
in one test. Stimulus parameters may be selected both at
SOURCE-I and at SOURCE-2. SOURCE-2 is an alternate
selection to DATA-2, near the center of the SWEEP TEST
DEFINITIONS panel When SOURCE-2 is selected, the
GRAPH BOTTOM value must be interpreted as
"SOURCE-2 START" and GRAPH TOP must be interpreted as "SOURCE-2 STOP". The # STEPS value determines the number of steps which SOURCE-2 will take between those end values. The span between SOURCE-2
GRAPH BOTTOM and TOP will be divided into equal increments for the steps if LIN is selected, and into equal percentage steps if LOG is selected (and if both values are
positive). When F9 is pressed, SOURCE-2 is set to the
starting (GRAPH BOTTOM) value and SOURCE-I is
stepped through its specified range. SOURCE-2 is then incremented one step towards its GRAPH TOP value and the
SOURCE-I sweep is repeated. This process continues
through the final SOURCE-I sweep at the SOURCE-2 ending (GRAPH TOP) value. The result is a family of curves.
Figure 16 Battery Life Test with Limit File Displayed via
<Aft>F7 Keystroke
Figure 17 is the block diagram of the connections between
the DCX-127 and a field-effect transistor (FET). DC output
#1 is used to control the gate voltage. DC output # 2 is used
as the drain supply. A 10 Ohm current-sensing resistor is
used between DC output #2 and the drain, with the dc
voltmeter measuring current by measuring the voltage drop
across the resistor. Figure 18 shows the setup panels, where
is an example of the NiCd battery life test from Figure 13
with the limit file of Figure 14 attached. This example limit
file is storedd as DCTIMELO.LIM.
Stimulus-Response DC
Measurements
In addition to measuring dc at a single instant or versus
time, dc voltage (or resistance) may be measured as a function of a stepped dc voltage stimulus. Examples include
testing the dc transfer characteristics of FETs, linear ic's,
bipolar transistors, opto-isolators, and varistors or other
non-linear resistors.
Figure 17 Block Diagram, FET Characteristic Testing
Page?
SYS-127 Applications
Audio Precision, Inc.
Figure 20 Tabular Display of Data at a Transition Point in a
Nested Sweep Series
fCx) = SCALE » Cx + OFFSET)
To c&ange setting, use digit keys.
To return to ®emt, press the Esc hen.
Figure 18 Setup Panels for FET Characteristic Testing
Expected eaximufa for graph
Figure 19 Family of Curves of FET Characteristics
To change setting, use digit Jseys.
To return to menu, press the Esc key.
Figure 21 Setup Panels for Measuring FET Characteristics
Around Zero Volts
the gate voltage is swept between 0 and -3 as SOURCE-2
while the source supply is stepped from 0 to 5V by
SOURCE-!. This example test is stored on the companion
diskette as FET-CHARTST. Figure 19 shows the result.
This data could be saved to disk for a number of different
FETs, with the Append Test command or graphic overlay
capability (<Alt>F8/F8) then used to compare devices for
matching.
When it is desired to know exactly which SOURCE-2
values correspond to the various curves, change to DISPLAY TABLE and press F7. Use FlO (pause key) to
suspend the data scrolling as desired. Figure 20 shows a
section of the resulting display, at the transition between
two SOURCE-2 values.
Figure 22 Graph of FET Characteristics Around Zero Volts
Page 8
Audio Precision, Inc.
To examine the characteristics around zero volts, Figure
21 shows a panel setup and Figure 22 the resulting graph.
The display may be expanded for greater detail after taking
data. This example is saved as FET-ZERO.TST on the diskette.
Measuring Resistance While
Varying Voltage
Many devices, including FETs and LDRs (light-dependent
resistors) exhibit a variable resistance as a function of an applied control voltage or current. The DCX-127 ohmmeter
can be used to measure the resistance while the voltage of
mo of the DC outputs is varied.
SYS-127 Applications
Figure 23 shows the setup panels, saved as LDR-RES.TST
on the diskette. Figure 24 a representative graph of FET
drain-source resistance as the gate voltage is varied. To
prevent the ohmmeter from autoranging and thereby changing the voltage used for resistance measurements, it should
be fixed on an appropriate range. In the example shown the
meter was fixed on the 20 kilohm range. Results are then
valid only at relatively low resistances where the test voltage is small.
A light-dependent resistor (opto-isolator) consists of a
light-emitting diode (LED) and a photo-sensitive resistor,
coupled optically inside an opaque package. Figure 25
shows a connection diagram for the DCX-127 and an LDR.
DC output #1 is swept to vary current through the LED. A
1 kilohm series resistor produces a 1 milliampere/Volt
relationship to the dc output #1. The DCX-127 ohmmeter
measures the photo-sensitive resistance. To make the
horizontal axis of the graph aproximately equal to LED current, DC output #2 was set to barely turn on the LED (about
1.4 Volts, as determined by monitoring the resistance) while
DC output #1 was at zero volts. This approximately compensates for the "on" voltage of the LED. Figures 26 and 27
are the setup panels and a graph of this measurement. Note
that LDRs can have long time constants (one second or
greater) at high resistances and thus can require settling
delay values of one second or more on the SWEEP SETTLING panel for accurate measurements.
Figure 23 Setup Panels for Measuring FET Drain-Source
Resistance as a Function of Gate Voltage
Figure 24 FET Resistance vs Gate Voltage
Figure 25 Connection Diagram, LDR Testing
Page 9
SYS-127 Applications
Figure 26 Setup Panels, LDR Tests
Audio Precision, Inc.
Figure 28 Setup Panels, D-A Converter Linearity Test
Static (dc) linearity testing of D-to-A converters is a principal application for digital stimulus and dc measurements.
Note that dynamic testing is beyond the DCX capabilities,
since the digital output update rate is limited to about 30
changes/second and the maximum dc meter reading rate is
25 readings/second (6/second for maximum resolution).
Dynamic testing of converters is possible with the new DSP
capability of System One; contact Audio Precision for more
details. Figure 28 shows the control panel setup for a digital
"sweep" around zero for a 16-bit D-to-A converter (fullscale range -32768 to 32768). Figure 29 is a graph from
such a test. This setup is stored as D-TO-A.TST on the
companion diskette.
Figure 27 LDR Resistance vs LED Current
Digital Stimulus-PC Measurements:
P-to-A Converter Testing
The value of the digital output word of the DCX-127 can
also be varied during a test. Select DCX DIGOUT as
SOURCE-I. Units may be selected as DEC (decimal),
HEX (hexadecimal), or h(x) where the decimal value is
scaled by the h-scale factor entered in the DIGITALOUT
section of the DCX-127 control panel. START, STOP, and
# STEPS values may be entered as desired to control the
range and step size.
Data presented to the connector can be formatted in one of
two formats; 8-4-2-1 BCD or two's complement (2sC),
which is binary plus sign.
Page 10
Figure 29 D-A Converter Linearity
Audio Precision, Inc.
SYS-127 Applications
The software then performs an interpolation between those
two limit file points in order to obtain a single value to
which to compare the data point. If the SOURCE-I
(horizontal) values of both limit file points are positive, Sl
software performs a logarithmic horizontal interpolation. If
either point is zero or negative, logarithmic interpolation is
not possible and a linear interpolation is performed.
Similarly, the vertical (DATA-I or DATA-2) interpolation
is performed logarithmically if both points have positive
vertical values and linearly if either is zero or negative.
["
1,B8
*-2,Bk -1.5!t ' -Ok"""""' - 5 J
BJ'
508,8
l.B8k
1.59k
t,Wk\
Figure 30 Deviation from Perfect Linearity (Data from
Figure 29, Re-Graphed After Use of COMPUTE LiNEARITY
'unction
COMPUTE LINEARITY Function
Linearity is difficult to accurately determine from a graph
such as Figure 29 since it covers such a wide dynamic
range. The limited pixel resolution of the PC display, in
fact, obscures any small deviation from linearity which may
exist.
Sl software contains a powerful COMPUTE LINEARITY
menu command created expressly for such applications. Invoking this command causes a straight line to be created
which is the best fit to the data or any specified sub-section
of the data. Each data point is then subtracted from this
straight line. Since this computation replaces the original
data, the raw data should be saved via the Save Test command before COMPUTE LINEARITY is invoked if you
wish to have further access to the original data. After using
the COMPUTE LINEARITY command, the graph senitivity may be greatly magnified by changing the GRAPH
TOP and BOTTOM values at DATA-L Figure 30 shows
the data from Figure 29 after using the COMPUTE
LINEARITY command and selecting new graphic coordinates to display the deviation from perfect linearity. Display system resolution is now not a limitation.
Limit files can be attached to D-to-A converter tests for
use either before or after a COMPUTE LINEARITY calculation. Proper application of Sl software's limits
capability for multiple-point tests requires an understanding
of how it interpolates between points in a limit file in order
to compare a data reading. At each data point, Sl software
looks in the limit file for the nearest point with a higher
SOURCE-I value (to the right, in graphic terms) and the
nearest point with a lower SOURCE-I value (to the left).
In the case of D-to-A (and A-to-D) converters, logarithmic
interpolation is rarely appropriate. If the converter is tested
over a range which includes zero, linear interpolation is
automatically forced by creating a limit file with only two
points, one at the negative and one at the positive extreme.
If the converter is tested across a range which is only positive on either the digital or dc axis, limit files must be
created with sufficient intermediate points that the difference between logarithmic and linear interpolation is negligible. With tight limits, this may lead to a very high point
density. It may also be possible to create a two-point limit
file with one end below zero in order to force linear interpolation, even when all data will be at positive values.
Limit testing after use of COMPUTE LINEARITY is
probably a better solution in most cases.
For use before COMPUTE LINEARITY, upper and lower
linearity limits must be diagonal lines. After COMPUTE
LINEARITY, the data represents deviation from perfect
linearity and the appropriate limit files may be simply
horizontal lines. Depending upon the application, it may
also be appropriate to have. limits after COMPUTE
LINEARITY which are tightest near zero and increase in
both directions away from zero, in a "bow tie" or "butterfly"
shape.
DC Meter Resolution Limitations
The resolution of the DCX-127 digital voltmeter depends
upon which range is in use. Resolution on the 200 mV
range is 10 microvolts, for example, while on the 20 Volt
range it is one millivolt. A 16-bit D-to-A converter with a
±5 Volt dc output range, for example, has a theoretical
transfer characteristic of 10 V/65536 states or about 152
microvolts output change for a one LSB change in input. At
output values within ±200 mV of zero, the dc voltmeter
resolution of 10 microvolts is thus more than adequate. At
Page 11
SYS-127 Applications
Audio Precision, Inc.
values greater than ±L999 Volts, the meter will autorange
to its 20 Volt range and the consequent one millivolt resolution will obscure errors smaller than approximately 6 LSBs.
Either of the DCX-127's dc outputs can be inserted with
jumper leads in series with the dc voltmeter input and set to
a value which offsets part of the converter's output voltage.
This connection creates a differential voltmeter configuration which measures the difference between the output of
the D-to-A converter under test and the DCX-127 dc output.
If that difference is less than 200 mV, the meter can range to
its most sensitive range and use its full resolution. To test a
converter across its full range with adequate meter resolu. tion in every case will thus require a series of test sweeps,
each with a different value of dc output voltage for meter
offset in order to keep the meter on a range with acceptablyhigh resolution.
DC Stimulus-Digital Measurements:
A-to-D Converter Testing
Testing devices such as A-to-D converters is conceptually
similar to D-to-A converter testing in many ways. Either of
the dc outputs of the DCX-127 is used for stimulus, while
the digital output of the converter is connected to the DCX127 digital input.
Figure 32 A-D Converter Linearity Test
play is selected at the bottom of the panel (DISPLAY
TABLE at the bottom of the SWEEP TEST DEFINITIONS
panel). Figure 31 is an example of a panel setup and Figure
32 the resulting graph from a test of an A-to-D converter.
See A-TO-D.TST on the diskette for this test setup.
The COMPUTE LINEARITY function may be used for
A-to-D converter testing in a manner analagous to D-to-A
converter testing. See Figure 33 for a re-graph of Figure 32
after the COMPUTE LINEARITY operation.
On the control panels, SOURCE-I is now selected as
DCX DCOUTl or DCOUT2 and appropriate voltage values
entered for START, STOP, and # STEPS. At DATA-I,
DCX DIGIN is selected. For graphic display, DEC
(decimal) or g(x) (scaled decimal) may be selected as units,
with any desired GRAPH TOP and BOTTOM. HEX
(hexadecimal) notation may also be selected if tabular dis-
Limit files may also be applied, with the same considerations as discussed earlier with regard to logarithmic vs
linear interpolation. Note that STs limit comparison is "less
than or equal to". Therefore, a device passes a test if its output is exactly equal to the limit. Exact equality of measurement to limit is very unlikely when analog measurements
are made and compared, but quite possible when digital
devices are measured since the device output resolution and
the DCX-127 input resolution are identical.
Figure 31 Setup Panels, A-D Converter Linearity Tests
Figure 33 A-D Converter Deviation from Perfect Linearity
Page 12
Audio Precision, Inc.
There is no analagous factor to different dc voltmeter
resolution on different ranges when testing A-to-D converters with the DCX-127. The dc outputs have a constant
resolution of 20 microvolts or better across their full range,
and the digital input has a constant one LSB resolution.
Digital Stimulus-Digital
Measurements
A digital device may be tested on a static (dc) stimulusresponse basis with the DCX-127. Since it is unlikely that
such devices will have a linear "digital transfer characteristic" across a range of contiguous digital states, most such
*ests are likely to be "spot" measurements. Thus, logic circuitry can be tested one state at a time by applying a
specific digital stimulus while measuring and comparing to
limits the digital output. Since a digital input-digital output
device is likely to have only one correct output state for a
given input, the upper limit and lower limit will typically be
equal to one another and equal to the expected digital output
word. A single limit file may thus be saved and named both
as upper and lower limit.
The format flexibility of Sl software can simplify testing
of certain digital interface circuits. Circuitry designed to
drive BCD indicators can be easily tested by stimulating it
with the DIGOUT signal in 2sC (two's complement, or binary) format while measuring the device's output with the
DIGIN capability in BCD format.
Control and Communications with
External Devices
The DCX-127 and Sl software provide capability for control of external devices via logic or by driving external
relays.
Additional control of external devices and
synchronization of procedures with external devices is possible by S1 software features using ports of the PC.
Three 8-bit latched output ports are located on the rear
panel of the DCX-127. Each is a 9-pin D subminiature connector. The bit pattern at each port is set in one of two
fashions; by an entry on the DCX-127 panel, or by use of
the UTIL OUT command of the menu.
SYS-127 Applications
the words specified at all three ports, and loading a test restores all the conditions specified in that test. The word may
be entered in the DCX-127 panel in either decimal (DEC),
hexadecimal (HEX), or octal (OCT) format.
The UTIL OUT method of setting port values may be used
when output conditions must be changed before a test is
loaded or changed during an automatic procedure without
loading another test. Only the decimal format may be used
with UTDL OUT.
It is important to understand the priorities between the
DCX-127 panel and the UTIL OUT command in controlling
ports A, B, and C. When a test is loaded, the settings in the
test (including a zero setting) take priority over the previous
condition of the ports, whether that condition was established by a previous test file or by the UTDL OUT command. After a test has been loaded, exiting to the menu and
using the UTIL OUT command will override the settings on
the DCX-127 panel. Those changes will be visible on the
DCX-127 panel after using UTDL OUT and returning to the
panel. If the test file were saved at that stage, it would have
the new settings stored in it.
The UTIL OUT command may also be used in connection
with any port of the computer, such as its parallel printer
port, serial (COMl or COM2) port, or ports added by plugin accessory cards. In this case, the port address (in
decimal) is used rather than the A, B, or C designations for
the connectors on the DCX-127.
The UTEL WAIT command can be used to synchronize an
automatic procedure with a condition of an external device.
The UTEL WAIT command is invoked with a computer port
address, data word, and optional data mask. When a UTIL
WAIT statement of a procedure is reached, the procedure
will pause until the specified data word (logic condition) as
qualified by the optional data word mask appears. In a typical application, UTIL OUT is used to command an external
device to go to a certain condition. To obtain verification
that the device has truly assumed the necessary condition,
UTIL WAIT may then be used to sense some "ready" indication line of the device. When the device signifies that it
is ready, the procedure moves on to its next line. See the
User's Manual for more information and examples.
The DCX-127 panel is normally used to set the digital
word at a port when the application calls for the word to be
different for each different test. Saving a test setup saves
Page 13
SYS-127 Applications
Audio Precision, Inc.
Overlays
If it is necessary to set the ports at some point in an
automatic procedure and have those port conditions maintained during a succession of tests, Sl software's Overlay
capability must be used. An overlay (.OVL) file is identical
to a test (.TST) file except that one or more of thefieldson
the panel have been rendered inoperative by "punching
them out". To ppnch out a field, such as the PORT OUT A
field, place the cursor on that field and press <Alt>P. The
video characteristics used to display that field will change,
depending on the type of display system and monitor you
have. When one or more fields have been punched out, the
file may only be saved as an Overlay file by the Save Overlay command. When loaded, an overlay file functions identically to a test file except for the punched-out fields.
Punched-out fields simply maintain the previous condition
of that field. See the Overlay section of the Procedures
chapter of the User's Manual for more details.
Replacing the Computer Keyboard
In Quality Assurance and production test applications, the
operators of a test system are frequently not trained technicians or engineers. A PC keyboard may be unnecessarily
complex for such operators, possibly intimidating them and
producing error opportunities.
The computer keyboard may be hidden or entirely disconnected and replaced with a simple, user-furnished set of
switches. The DCX-127 Program Control Input connector
permits connection of up to eight normally-open switches.
A momentary connection of any of these switches to ground
causes a previously-recorded series of keystrokes to be executed. These keystrokes are stored as macro files (.MAC);
different macro files may be created and loaded to give different functional definitions to the switches.
A macro may, for example, load and run a procedure
which fully tests a given device and makes a go/no-go
decision on its acceptability. With this type of usage, the
computer monitor could even be eliminated and Pass/Fail
could be indicated by lighted annunciators driven off DCX127 ports A, B, or C. The operator's choices may be limited
to "RUN TEST A", "RUN TEST B*\ and "HALT".
Switches could also be defined as equivalent to the four
cursor control arrows, spacebar, <Enter> key, <Esc> key,
and Fl (procedure abort) key. In this case, the operator
would have full ability to load and ran any procedure shown
in the procedure directory, but without the error (or editing)
possibilities of a full keyboard. See the Custom Keyboard
section of the DCX-127 chapter of the User's Manual for
more details.
Adding AC and Audio Test
Capability
The DCX-127 provides only dc and digital stimulus and
measurement capability. For applications which additionally require measurement of ac voltage, frequency, phase, harmonic and intermodulation distortion, wow andflutter,and
generation of sinewaves up to 200 kHz, squarewaves, sine
bursts, and white or pink noise, contact Audio Precision for
additional information on the complete System One test system which is controlled from the same digital interface and
software. The new DSP capability of System One will also
permit dynamic testing of A-D and D-A converters.
AUDIO PRECISION, INC.
P.O. Box 2209
Beaverton, OR 97075
(503) 627-0832 1-800-231-7350
FAX (503) 641-8906 TELEX 283957 AUDIO UR
Page 14