1
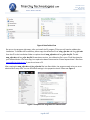
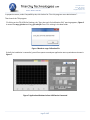
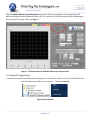
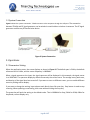
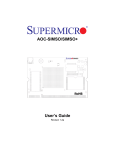
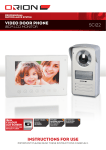
67-15233 34th Ave.
Surrey, BC V3S 2T7
604-637-2167
[email protected]
USB Mini Spectrum Analyzer User Manual
PC program TSA
For TSA5G35
TSA4G1
TSA6G1
TSA8G1
TSA12G5
Triarchy Technologies, Corp.
Page 1 of 17
67-15233 34th Ave.
Surrey, BC V3S 2T7
604-637-2167
[email protected]
USB Mini Spectrum Analyzer User Manual
Copyright Notice
Copyright © 2013 Triarchy Technologies, Corp. All rights reserved.
Initial Version July 2013
Documentation version 1.4
No part of this publication may be reproduced, transmitted, transcribed, stored in a retrieval system, or translated into
any language or computer language, in any form or by any means, electronic, mechanical, magnetic, optical, chemical,
manual, or otherwise, without the prior written permission of Triarchy Technologies, Corp.
Technical Support
For technical support, please call 1-604-637-2167, send email to [email protected], or visit our website at
http://www.triarchytech.com
Page 2 of 17
67-15233 34th Ave.
Surrey, BC V3S 2T7
604-637-2167
[email protected]
Table of Contents
1 GETTING STARTED...................................................................................................4
1.1 INSTALL PC APPLICATION.........................................................................................................................................4
1.2 UNINSTALL PC APPLICATION:...................................................................................................................................8
1.3 SYSTEM CONNECTION.............................................................................................................................................9
2. OPERATIONS...........................................................................................................9
2.1 PARAMETERS SETTING.............................................................................................................................................9
2.2 FREQUENCY SETTING............................................................................................................................................10
2.3 SPAN SETTING...................................................................................................................................................10
2.4 AMPLITUDE SETTING.............................................................................................................................................11
2.5 SWEEP TIME SETTING...........................................................................................................................................11
2.6 TRACE SELECTION................................................................................................................................................11
2.7 CURRENT TRACE..................................................................................................................................................12
2.8 AVERAGE TRACE..................................................................................................................................................12
2.9 MAX TRACE.......................................................................................................................................................12
2.10 DENSITY MEASUREMENT.....................................................................................................................................13
2.11 MANUAL CALIBRATION........................................................................................................................................13
3. MEASUREMENT SUPPORT FEATURES...................................................................13
3.1 SELECT MEASUREMENT CURVE...............................................................................................................................13
3.2 MARKER............................................................................................................................................................13
3.3 DELTA MARKER....................................................................................................................................................14
3.4 CHANNEL POWER.................................................................................................................................................15
3.5 LIMIT LINE..........................................................................................................................................................15
3.6 REFERENCE.........................................................................................................................................................15
3.7 HARDCOPY.........................................................................................................................................................16
3.8 RECORDING........................................................................................................................................................16
3.9 DISPLAY MOVING.................................................................................................................................................17
3.10 LOCAL AND REMOTE FUNCTION..............................................................................................................................17
4. DECLARATION OF CONFORMITY...........................................................................17
4.1 FOR MODLE TSA8G1,TSA6G1,TSA5G35, TSA4G1..............................................................................................17
Page 3 of 17
67-15233 34th Ave.
Surrey, BC V3S 2T7
604-637-2167
[email protected]
1 Getting Started
1.1 Install PC Application
System Requirements:
To use this USB mini spectrum analyzer, your system must meet the following minimum requirements:
Windows XP, Windows 7, or Windows Vista and Window 8:
-- 1 Gigahertz (GHz) or faster 32-bit (x86) or 64-bit (x64) processor
-- 1 Gigabyte (GB) RAM (32-bit) or 2 GB RAM (64-bit)
-- 100 MB hard disk space (Buffered data may need extra space)
-- Display resolution shall be better than 1024x768
Insert CD into the computer, open the SW_ file/TSA/ folder from CD, and click the setup_1.4.exe to install
software. When you see the installation window, click “Next”. Please see Figure 1
Figure 1 Installation View
Page 4 of 17
67-15233 34th Ave.
Surrey, BC V3S 2T7
604-637-2167
[email protected]
Follow the installation instruction to install the PC program.
Figure 2 Successfully Installed
After the program is successfully installed, you will get the message “Finish the Installation Completely”,
please see Figure 2,
TSA program will install at C:\Program Files (x86)\Triarchy Tech\TSA Spectrum Analyzer
TSA data folder will be located at Documents, all the log data and Calibration file will put into data folder, the
data folder path is C:\Users\UserName\Documents\Triarchy Tech\TSA Spectrum Analyzer.
Please see Figure 4.
Page 5 of 17
67-15233 34th Ave.
Surrey, BC V3S 2T7
604-637-2167
[email protected]
Figure 4 Data Folder View
Do not run the program right away, after you install the PC program TSA as you still need to validate the
installation. To validate the installation, please copy the calibration file of amp_ofst.dat and freq_ofst .dat
from the CD to the installation folder to replace the old amp_ofst.dat and freq_ofst .dat file. The old
amp_ofst.dat and freq_ofst .dat file file was demo version, the calibration file in your CD will be related to
your ordered device. You must copy it to replace the demo Demo version. Please request these 2 files from
[email protected] if you do not have a CD.
After copying the amp_ofst.dat and freq_ofst.dat files into Data folder, the program needs to be run as an
administrator every time. You can find these settings in the properties menu. Please see Figure 5.
Figure 5 setup Run this Program as an administrator
Page 6 of 17
67-15233 34th Ave.
Surrey, BC V3S 2T7
604-637-2167
[email protected]
In properties menu, under Compatibility tab, tick the box for “Run this program as an administrator”.
Then launch the TSA program.
*If clicking on the TSA ICON for Desktop, the “Sorry but can’t find calibration file!” warning appears, Figure 6.
It means the amp_ofst.dat and freq_ofst .dat file from CD is missing in the data folder.
Figure 6 Needs to copy Calibration file
If the If the installation is successful, you will see spectrum analyzer application start-up window as shown in
Figure 7.
Figure 7 Application Windows before USB Device Connected
Page 7 of 17
67-15233 34th Ave.
Surrey, BC V3S 2T7
604-637-2167
[email protected]
Plug the TSAxGx USB mini spectrum analyzer into the PC USB port, the program will recognize the USB
device and displays Device model and Device S/N. If PC connects to USB device properly, the USB Message is
shown Device Connected. Please see Figure 7
Figure 7 TSA Connected with USB Mini Spectrum Analyzer Device
1.2 Uninstall PC Application:
If you want to uninstall the TSA program, please go to the Start menu, look for the Triarchy Tech folder, then
click Uninstall item and follow the instruction. Please see Figure 8.
Figure 8 Uninstall View
Page 8 of 17
67-15233 34th Ave.
Surrey, BC V3S 2T7
604-637-2167
[email protected]
1.3 System Connection
Figure 9 shows the system connection. TSAxGx connects to the computer through the USB port. The connection
between TSAxGx and RF signal generator can be wired via coaxial cable or wireless via antenna. The RF signal
generator could be any RF transmission device.
Figure 9 System Connection
2. Operations
2.1 Parameters Setting
When the application starts, the screen displays as shown in Figure 10. The default span is 5 MHz, the default
reference level is 0 dBm, and the center frequency is 1000MHz.
When a signal presents at the input, the signal spectrum will be displayed. In this example, the signal center
is at 1000 MHz. The spectrum display by default shows only the current trace. The average trace, peak trace,
and density of the signal level are turned off. If you want to turn on different traces, you can enable different
traces by clicking tabs to display.
If you want to change the setting, input value at each block, then click enter key. Stop button is used to stop
scanning. When updating a new setting, click enter without clicking the Stop key.
The preset key will push the setting to the default value. That is 1000MHz for freq, 5MHz for SPAN, 0dBm for
Amplitude, current display only.
Page 9 of 17
67-15233 34th Ave.
Surrey, BC V3S 2T7
604-637-2167
[email protected]
Figure 10 Spectrum Display with Signal Default value
2.2 Frequency Setting
The center frequency is entered into Center-freq(MHz) input. Then the TSAxGx will scan from center_freq span/2 to center_freq + span/2. The display window will show the signal spectrum after clicking the ENTER
button. The valid center frequency range is from 1 MHz to 5350 MHz for TSA5G35 model. If TSA program is
connected to another model such as TSA12G5, the frequency range will be 4.9GHz to 13.5GHz, please check
each model datasheet for detail.
Frequency setting also has step setting function, setup step value, click + or – to implement next
measurement, and it didn’t need to click the ENTER key.
2.3 SPAN Setting
The SPAN value can be input by user. SPAN values range will be 1~1000MHz, with MHz as unit and only
integer value. The normal speed scanning will have 501 point for one frame scanning; the fast scan will only
have 101 point. The SPAN value for fast scan will be 0.2MHz to 200MHz. The speed of scanning will 5 times
faster.
The RBW can be manually setup if you select in RBW block. The Auto setting is still available if you select
AUTO at RBW block.
Page 10 of 17
67-15233 34th Ave.
Surrey, BC V3S 2T7
604-637-2167
[email protected]
The single scan can be selected by tick on the Single Scan on TSA v1.4 front panel.
The TSA5G35 has two bands; low band is from 1 to 850 MHz and high band from 850 MHz to 5350 MHz. The
850 MHz frequency is the band edge. When SPAN is set at 101 MHz to 1000 MHz, SPAN range cannot cross
over the band edge, so that, 1000 MHz SPAN cannot work at low band.
When SPAN setting is from 0.2 MHz to 100 MHz, the span range can cross over the 850 MHz band edge.
For example, if SPAN is set to 500 MHz, the frequency is set at 600 MHz; the SPAN range will be from 350
MHz to 850 MHz. If the frequency is set to 700 MHz, the SPAN range is still keep at 350MHz, the TSA will pop
up the warning message to remind the user to enter a proper value for the span.
TSA6G1, TSA8G1 and TSA12G5 has band 1 and band 2, Band1 of TSA6G1 and TSA8G1 has same function of
TSA5G35, it still need to take care of 850MHz band edge issue.
The SPAN setting cannot cross over the band1 and band2 in the TSA6G1, TSA8G1 and TSA12G5.
2.4 Amplitude Setting
The amplitude setting will depend on the signal level to be measured. If the signal is small, the 30 dB
attenuator dones’t need to be added, the reference level will be from -60 dBm to 0 dBm at 10 dB step. If the
large signal is to be measured, the 30 dB attenuator will need to be added, and to mark external ATT (30 dB)
at TSA panel. The reference level will be from -30 dBm to 30dBm at 10 dB step.
The reference level in the band 2 in TSA6G1 and TSA8G1 will shift 20dB, please check the datasheet.
The reference level in the TSA12G5 without external ATT will be 40dB range, please check the datasheet for
detail.
The amplitude the unit can be set to dBm, dBuv, dBm, dBuv/m, dBm/m2.
When you select dBuv/m, and dbm/m2, it means to use USB spectrum analyzer to measure the field
strength, it will be related to the antenna parameter: antenna factor or antenna gain. You shall input antenna
parameter. These parameters are related to the frequency, you shall choice proper parameter at your
application band.
2.5 Sweep Time Setting
When the sweep time is slow, the TSA5G35 will do oversampling. The oversampling time interval will be 3us.
The sweep time needs to be selected based on what kind of signal will be measured.
If the signal to be measured is continuous wave (CW), select x1 (CW Mode).
If the signal to be measured is continuous modulation signal, select x1.5 (Burst Mode)
If the signal to be measured is packet data signal, select x2(Burst Mode) or x4(Burst Mode), or larger.
Page 11 of 17
67-15233 34th Ave.
Surrey, BC V3S 2T7
604-637-2167
[email protected]
2.6 Trace Selection
The current trace, average trace, max trace, and density of the measured signal can be turned on or off
individually by clicking on the corresponding button on the screen as shown in Figure 11, which shows that
current trace and density are turned on. Average trace, and max trace are turn off
Figure 11 Current Trace and Density Trace are Turned on
2.7 Current Trace
The current trace is to display the real time signal spectrum, and the default display will be current trace. The
current trace will be updated with each scan over the frequency range. When the input signal is changed, the
current trace will change immediately. When the device is used to measure the modulated signal and packet
signal, you need to increase the sweep time to get a better spectrum waveform.
2.8 Average Trace
The average trace is adopted 16 points of moving average algorithm. It can reduce the signal noise when
measuring CW signal. It will conjecture the signal repeat rate for modulated or packet signal measurement, if
the average trace is very low comparing to the max trace, it means the signal repeat rate is very low.
Page 12 of 17
67-15233 34th Ave.
Surrey, BC V3S 2T7
604-637-2167
[email protected]
2.9 Max Trace
The max trace will hold the maximum signal level with each scan. Max trace can be used to measure the
modulated signals, and random signals. The max trace will show envelop of modulated signals. When you do
an EMC test, you can use the max trace to pick up the max signal.
2.10 Density Measurement
The density image will show the modulated signal with the detailed signal energy distribution, even when
two signals are overlapped, you can still watch and find the two signals from the density image. It is very
useful to analyze the modulated signal.
Since density measurement will use up a lot PC computing resource, the default option for density
measurement is off. For a low performance PC, turning on this option may cause PC to respond slowly.
2.11 Manual Calibration
Input one value, the waveform will be up and down to follow the input value.
If external attenuator is used (not 30dB), Manual calibration will be compensated the attenuation value.
If connection cable have large insertion loss, Manual calibration will be compensated the attenuation value.
Manual calibration is temporarily solution for customer to adjust signal level. It shall put into “0” when you
don’t use this feature.
3. Measurement Support Features
There are measurement support features, including Marker, Delta marker, Channel power, Limit line,
Reference trace, Recording, and Image Hardcopy.
3.1 Select Measurement Curve
When selecting Measurement functions, you shall choose which curve to be measured. There are Current,
Average and Max curves, please select one in Select Curves window. The Select Curve windows are located
last item of each function in the waveform measure.
3.2 Marker
Three are total three marker can be used:
ON/OFF, turn on and turn off the marker
MKR>PEAK, force the marker to max signal point after marker is turn on.
Manual/Auto, setting will continue to trace the marker to peak point, and Manual one time searches the
peak point after click the MKR>PRAK.
Page 13 of 17
67-15233 34th Ave.
Surrey, BC V3S 2T7
604-637-2167
[email protected]
Mouser On/Off, if mouse on is selected, marker will be moving by mouse cursor, mouse cursor must be
located at curve, and click it, then the marker can be moved, it is easy way to move the marker. There are
total three Mouse On/Off keys; only one key can be turn on.
< left moving key, click it, marker will left moving.
> Right moving key, click it, marker will right moving.
MRK>CF, click it, the marker will be used as center frequency to do new measurement.
Figure 12 shows the marker function.
Figure 12 Marker, Delta Marker, Channel power
3.3 Delta maker
First, it needs to turn on more than two markers. Moving the marker to the proper the location.
Select two markers to do Delta marker function.
A lot parameter can be measured by properly setting the maker position such as BW, dBc,
Page 14 of 17
67-15233 34th Ave.
Surrey, BC V3S 2T7
604-637-2167
[email protected]
3.4 Channel power
Select two points of markers to do channel power calculation, it is more useful to measure the modulation
signal.
You can measure the main channel power; also can measure the adjacent channel power by setting different
marker location. Then you can calculate the ACPR (adjacent channel power ratio)
3.5 Limit line
The limit line will be used in the production line, if the signal larger than limit line, it will show PASS, if the
signal is smaller than limit line, it will show FAIL.
The limit line will load from Excel file which will define the limit line template, it will be total 501 point data at
first column of excel file; customer can define any kind of template by writing the Excel data. The file will
save at C:\Users\Username\Documents\Triarchy Tech\TSA Spectrum Analyzer\REF
3.6 Reference
The reference function will capture any waveform as reference image to shown on the display. The reference
also can be saved as file. The limit line function can load this file and show up. The reference can be used for
comparing the measurement. Please see Figure 13. The reference curve is Zigbee signal with continually
modulation, and current is shown the burst modulation of Zigbee signal.
Page 15 of 17
67-15233 34th Ave.
Surrey, BC V3S 2T7
604-637-2167
[email protected]
Figure 13 Reference on Display
3.7 Hardcopy
Xlick the hardcopy key, the waveform image and data will be hardcopy into HARDCOPY folder
C:\Users\UserName\Documents\Triarchy Tech\TSA Spectrum Analyzer\HARDCOPY. There are total four
files generated, one is JPG image file, and three Excel data file which related to the current, Average and
MAX.
3.8 Recording
Click the REC key the waveform can be recording, the record information will be saved as file at
C:\Users\UserName\Documents\Triarchy Tech\TSA Spectrum Analyzer\HARDCOPY
Click stop to save the record file and stop the recording.
The record can be reviewed by loading file.
The record has two modes to review: Manual and Auto.
Manual: click < or > to move one frame to view. Click << or >> to move block of frame to view.
Auto: -> is normal play, <- is back play.
Page 16 of 17
67-15233 34th Ave.
Surrey, BC V3S 2T7
604-637-2167
[email protected]
3.9 Display moving
Right click the mouse key when mouse cursor in the display area, then moving the roll on the mouse, the
waveform of display can be scrolled up and down.
3.10 Local and Remote function
The TSA v1.4 support remote function. If you tick the local box, it will change to remote. The TSA v1.4 will
work in remote mode. The TSAxGxx hardware dongle do not have to be connected to PC USB port. Hardware
dongle may work from remote locations, such as a different city or a different country via internet. Please
check the application note for TSA USB Adapter USB2RJ45, USB2WIFI and USB2RS232 for detailed setup.
4. Declaration of Conformity
4.1 For model TSA8G1, TSA6G1, TSA5G35 and TSA4G1
We
Triarchy Technologies Corp
67-15233 34th AVE Surrey BC V3S 2T7 Canada
declare that
TSA8G1, TSA6G1, TSA5G35, TSA4G1 USB mini Spectrum Analyzer
In accordance with the following directives:
2004/108/EC
The Electromagnetic Compatibility Directives
has been designed and manufactured to the following specifications:
Emissions:
EN 61326-1:2006/CISPR11:2009
Radiated Emissions
Class B
Immunity:
EN 61326-1:2006/EN61000-4-2
Electrostatic Discharge
EN 61326-1:2006/EN61000-4-3
Radiated Immunity
EN 61326-1:2006/EN61000-4-4
Electrical Fast Transients
EN 61326-1:2006/EN61000-4-6
Conducted Immunity
Page 17 of 17