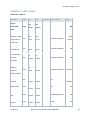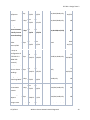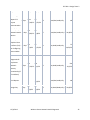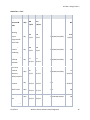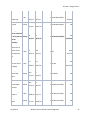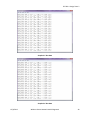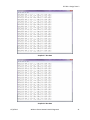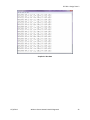
1
VERSION 1.0 DECEMBER 4, 2013 WIRELESS SENSOR NETWORK HEALTH DIAGNOSTIC FINAL REPORT PRESENTED BY: DAVID ROGERS, KELLY DESMOND, STU ANDRZEJEWSKI, BRAD GARROD MICHIGAN STATE UNIVERSITY COLLEGE OF ENGINEERING ECE 480 – DESIGN TEAM 2 ECE 480 – Design Team 2 EXECUTIVE SUMMARY The Air Force Research Laboratory has proposed a project of developing a diagnostic tool to best determine the health of a wireless sensor network. The main objective of the project was to scientifically determine the best set of metrics that indicate that a node was about to malfunction, was malfunctioning, or has malfunctioned. In order to accomplish this objective a wireless sensor network was configured to collect external metrics about the environment being monitored and internal metrics about the sensor nodes themselves. External metrics included temperature, relative humidity, and light; internal metrics included received signal strength and current draw. Over the course of the project, the design team configured a wireless sensor network, developed software to process the sensor network data in real time, display the data in a user friendly manner, and alert operators of problems in the network. A graphical user interface was written from scratch in Python with the help of external libraries wxPython and matplotlib. The software architecture leveraged the model-view-controller design pattern. Additionally, a number of algorithms were implemented in order to detect failing nodes. These algorithms include short term, long term, and zero value analysis of real time sensor data. The software was designed for use in real-time and demonstration modes in order to rigorously test and verify proper detection of failing nodes. Ultimately, the design team successfully met requirements and developed a robust application extensible for further development. 12/4/2013 Wireless Sensor Network Health Diagnostic 1 ECE 480 – Design Team 2 ACKNOWLEDGEMENTS AIR FORCE RESEARCH LAB A special thanks to Mr. Joseph Natarian, Mr. Kenneth Littlejohn and the entire student challenge team at the Air Force Research Lab located at Wright-Patterson Air Force Base. DR. TONGTONG LI A special thanks to Dr. Tongtong Li, the faculty facilitator, for assisting in the design process and all of encouragement along the way. DR. TIMOTHY GROTJOHN AND DR. LALITA UDPA Thanks to Dr. Grotjohn and Dr. Udpa, the professors for the ECE 480 course this semester. Both of you were very helpful and reliable. STEPHEN A. ZAJAC AND DR. GREGORY M. WIERZBA Thanks to Mr. Zajac and Dr. Wierzba for all the hard work they put into the ECE 480 Lab which truly challenged design team 2 and helped us become true electrical engineers. ELECTRICAL AND COMPUTER ENGINEERING SHOP Thanks to Gregg Mulder and Brian Wright of the ECE shop for providing all the necessary hardware for the design process and being there for help with certain tasks. 12/4/2013 Wireless Sensor Network Health Diagnostic 2 ECE 480 – Design Team 2 TABLE OF CONTENTS Executive Summary ....................................................................................................................................... 1 Acknowledgements ....................................................................................................................................... 2 1 | Introduction and Background .................................................................................................................. 5 Introduction .............................................................................................................................................. 5 Background ............................................................................................................................................... 5 2 | Exploring the solution space and selecting a specific approach ............................................................. 6 Design specifications ................................................................................................................................. 6 A. Must be satisfied ............................................................................................................................... 6 i. Fully configured wireless sensor network ...................................................................................... 6 II. Low power sensor nodes .............................................................................................................. 6 III. Reliable communication within the network ............................................................................... 7 IV. Accurate sensor node measurements .......................................................................................... 7 B. Increases design desirability ............................................................................................................. 7 V. Simple network configuration ....................................................................................................... 7 VI. Development of a graphical user interface .................................................................................. 7 FAST Diagram ............................................................................................................................................ 7 Conceptual designs ................................................................................................................................... 8 A. Build Entire Sensor Network ............................................................................................................. 8 B. Zigbee Network Kit............................................................................................................................ 8 C. Sensor Network development Kit ..................................................................................................... 9 Chosen Design Solution ............................................................................................................................ 9 Budget ..................................................................................................................................................... 10 Project timeline (Gantt Chart) ................................................................................................................. 11 12/4/2013 Wireless Sensor Network Health Diagnostic 3 ECE 480 – Design Team 2 3 | Technical description of work performed ............................................................................................. 11 Hardware Design ..................................................................................................................................... 11 A. Power and Data Transmitter (TX91501-3W-ID) .............................................................................. 13 B. Microchip 16-bit XLP Development Board (DM240311) ................................................................ 13 C. Microchip MRF24J40 PICtail/PICtail Plus Daughter Board (AC164134-1)....................................... 14 D. P2110 Evaluation Board (P2110-EVB) ............................................................................................. 14 Patch and Dipole Antennas ................................................................................................................. 14 E. Wireless Sensor Board (WSN-EVAL-01) ........................................................................................... 14 F. PICkit 3 Programmer / Debugger (PG164130) ................................................................................. 15 Hardware Implementation ...................................................................................................................... 15 Wireless Sensor Network Flow Chart...................................................................................................... 18 Software design requirements ................................................................................................................ 19 Software implementation ....................................................................................................................... 19 4 | Test data with proof of functional design .............................................................................................. 22 Hardware Functionality ........................................................................................................................... 22 Hardware Tests ........................................................................................................................................ 22 5 | Final cost, schedule, summary and conclusions .................................................................................... 26 Final Costs ............................................................................................................................................... 26 Schedule .................................................................................................................................................. 26 Conclusion ............................................................................................................................................... 26 Appendix 1 – Technical roles, responsibilities and work accomplished...................................................... 28 Appendix 2 – Literature and website references ........................................................................................ 32 Appendix 3 – Gantt Charts .......................................................................................................................... 33 Appendix 4 – Test Data & Screen Captures ................................................................................................. 39 12/4/2013 Wireless Sensor Network Health Diagnostic 4 ECE 480 – Design Team 2 1 | INTRODUCTION AND BACKGROUND INTRODUCTION Wireless sensor networks are commonly used to monitor important environmental information such as temperature or light level which may alert users of hazardous conditions for themselves or machinery. However, wireless sensors typically have very limited power and memory and consequently node malfunction or failure was common. A network of largely malfunctioning nodes can mislead users analyzing the data of the network and may lead to dire consequences. Thus, it is very important to monitor the health of the nodes in the network in order to ensure they are functioning properly. The number of properly functioning nodes has a direct impact on the health of the wireless sensor network. This project consists of configuring a wireless sensor network and monitoring a few external parameters such as environmental metrics like light, temperature, and humidity as well as internal network parameters such as sensor node current, voltage, received signal strength, RF transmission power and channel availability. Developing a diagnostic tool to monitor the health of a wireless sensor network is an application of particular interest to the United States Air Force. BACKGROUND The Air Force has used wireless sensor networks for many years, but has just recently been examining ways to better monitor the health of their networks. Their work on developing a health diagnostic for wireless sensor networks did not lead to a definitive solution which led them to create an open design project for senior capstone teams. They worked with multiple sensor networks of Sun SPOT and Crossbow sensor nodes organized in a mesh network topology as shown in Figure 1. In a mesh network topology each node must be able to collect and distribute its own data and serve as a relay for other nodes in order to propagate the data throughout the network. The main advantage of this topology includes its robustness to failing nodes, but a drawback was that the nodes consume large amounts of power in order to propagate data around the network. Once the network was implemented the Air Force needed to detect anomalies tracked by collecting metrics about the network. In order to detect anomalies and identify FIGURE 1. WIRELESS MESH NETWORK failing nodes, the Air Force used a number of algorithms including side-channel analysis and thresholding. Side-channel analysis consists of using information obtained from the status of the sensors themselves to correlate parameters and determine the interconnected metrics that contribute to sensor failure. Training-based and thresholding algorithms 12/4/2013 Wireless Sensor Network Health Diagnostic 5 ECE 480 – Design Team 2 work by aggregating sensor data over time to make projections based on past data and comparing those projections against incoming data. While the Air Force was not able to come to any major conclusions there has also been a lot of work done with sensor network health in industry and other branches of government. Upon further research, NASA’s Ames Research Center also addressed the creation of intelligent wireless sensor networks. “Intelligence was defined as the capability for supporting dynamic ad-hoc selfconfiguring real-time sensor networks able to adapt to faults while maintaining measurement accuracy and temporal integrity.” They developed an ad-hoc sensor network that integrated additional sensors for specific health monitoring functions. They also created a custom software application that was able to easily display node status as well as the environmental conditions being tracked. They periodically polled the sensor network for the data in order to dynamically display the data collected from the network in real-time. The proposed design solution will utilize some of this background knowledge to aid in the rapid deployment of a wireless sensor network diagnostic tool and in designing new analysis algorithms. 2 | EXPLORING THE SOLUTION SPACE AND SELECTING A SPECIFIC APPROACH DESIGN SPECIFICATIONS In order to create a successful design, design specifications for the project needed to be defined. Upon close examination the project description and discussions with the Air Force Research Lab sponsor, a successful project requires (i) the configuration of a wireless sensor network, (ii) low power sensor nodes, (iii) reliable communication within the network, and (iv) accurate sensor node measurements . Additional desirable requirements include (v) simple network configurability, and (Vi) development of a graphical user interface. A. MUST BE SATISFIED I. FULLY CONFIGURED WIRELESS SENSOR NETWORK To begin on the project, a wireless sensor network must be established. This includes sensor nodes that monitor external and internal measurements, a cluster head, and working communication between the nodes over an established protocol. The external measurements that will be monitored must include but not limited to temperature, humidity and light. Also a network topology must be decided. This parameter of the project was absolutely necessary. II. LOW POWER SENSOR NODES A node must be able last sufficiently long while deployed which includes tasks such as collecting accurate data and transmitting a high fidelity signal to the cluster head. In order to accomplish these tasks for a 12/4/2013 Wireless Sensor Network Health Diagnostic 6 ECE 480 – Design Team 2 long period of time the node must be low powered. Sensor nodes with long lifetime will decrease collection errors and ultimately allow for greater accuracy in nodal failure detection. This parameter was very important. III. RELIABLE COMMUNICATION WITHIN THE NETWORK To assist in determining if a node or sensor is failing, the data that is retrieved by the cluster head and analyzed in the mainframe computer must be accurate. Signal accuracy is a combination of signal transmission power, received signal strength, and communication protocol. Data fidelity is highly important in order to develop reliable metrics that diagnose the health of the network. This parameter was also very important to the customer. IV. ACCURATE SENSOR NODE MEASUREMENTS The sensor node must be able to communicate not only reliable, but also with accurate data. This includes external metrics such as temperature, light, humidity, etc., but also internal metrics about the nodes, such as current, and received signal strength. These metrics will monitor the environment the network was deployed in and also track relevant data about the health of each sensor node itself. These metrics are the crux of the project goal and are a crucial design parameter. B. INCREASES DESIGN DESIRABILITY V. SIMPLE NETWORK CONFIGURATION It was particularly desirable to choose a network design that was easy to setup and configure. A network that can scale up to handle more sensor nodes was another desirable feature. This will allow the customer to customize the sensor network at any point during its lifetime. Easy set up and customization of the network was an important part of the project and very desirable to the customer. VI. DEVELOPMENT OF A GRAPHICAL USER INTERFACE A visually appealing graphical user interface that displays the data obtained from the sensor network should be developed to allow an operator to quickly solve problems when they arise. A graphical user interface will make it easier to pin point what is going on in the network at all times. This will help when failing nodes are identified. This part of the project isn’t necessarily required, but a user-friendly visual would significantly increase the desirability. A diagnostic tool is only useful if it is easy to us and with a handy graphical user interface it will allow an operator to easily diagnose problems within a network. FAST DIAGRAM The Function Analysis System Technique (FAST) Diagram is a method to determine the essential functions of a design. The FAST Diagram in Figure 2 shows from left to right the primary and secondary functions 12/4/2013 Wireless Sensor Network Health Diagnostic 7 ECE 480 – Design Team 2 of a great design for this project. Reading from left to right, the diagram explains how. For example, “How do you monitor network health?”, one must configure the network and communicate the data being collected by the network. The FAST Diagram made creating conceptual designs and determining essential functions much simpler. FIGURE 2. FAST DIAGRAM CONCEPTUAL DESIGNS The primary focus of this project was developing a diagnostic tool to monitor the health of a network, but first network hardware must be selected. A number of hardware options were considered for the design including (a) building an entire sensor network from scratch, (b) obtaining a zigbee sensor network kit, and (c) buying a full sensor network development kit . A. BUILD ENTIRE SENSOR NETWORK The first design under consideration was to build a sensor network from scratch. This included a PCB design, attached sensors, and a system-on-chip with a built in ZigBee communication protocol. In addition to this, other components would be needed to measure current draw and voltage drop in the internal circuit at each individual node. B. ZIGBEE NETWORK KIT The next group of considerations was buying ZigBee communication network kit. This would require adding additional circuits for the sensors that are fed into the analog input/output port on each network node. Similarly, this group would need additional circuitry to determine internal metrics of the sensor node. 12/4/2013 Wireless Sensor Network Health Diagnostic 8 ECE 480 – Design Team 2 C. SENSOR NETWORK DEVELOPMENT KIT The last group of considerations was a full sensor development kit with multiple sensor nodes and a cluster head. These kits had full configured sensors as well as analog input/output ports for adding additional sensors. In addition, the kits that were considered measured internal node metrics. CHOSEN DESIGN SOLUTION The team created a feasibility matrix to help identify the best hardware design. The feasibility matrix compares multiple designs to different vital parameters such as functionality, cost and time. Each design was ranked from 1-10 for each parameter then totaled for a complete score out of 30. See Table 1 below. TABLE 1. HARDWARE FEASIBILITY MATRIX As seen from the feasibility matrix on the previous page, using the full sensor development kit would provide the most accuracy and functionality, with quick turnaround time in order to start developing a diagnostic tool. The decision was made to do further research on full sensor network development kits 12/4/2013 Wireless Sensor Network Health Diagnostic 9 ECE 480 – Design Team 2 since there is a wide range available and they vary in components, ease of use, and price. Another way to choose designs was a selection matrix. The selection matrix is similar to the feasibility matrix except the basic design is already known and instead actual parts are compared. Table2 shows the comparison of multiple development kits. Each development kit was ranked on a 1, 3 or 9 basis per feature then summed and multiplied by a weighted value. TABLE 2. SENSOR NETWORK DEVELOPMENT KIT SELECTION MATRIX BUDGET At the beginning of the semester, the team was given a $500 budget. This budget was for all essential hardware and software components for the design project. Luckily the team had the Air Force Research 12/4/2013 Wireless Sensor Network Health Diagnostic 10 ECE 480 – Design Team 2 Lab as a sponsor and was able to request a larger budget within the proposal. As you can see below in Table 3 the team requested a $2,000 budget. After receiving the project proposal, the Air Force Research Lab accepted it as well as the increased budget. Hardware/Components Price ($) Powercast P2110-EVAL-01 Development Kit1 1,250 Additional Sensors (Temperature, Light, Humidity) 100 Additional Node 400 Engineering Shop Services Fees 250 Total 2,000 TABLE 3. ESTIMATED BUDGET PROJECT TIMELINE (GANTT CHART) Attached at the end of the report in Appendix 3 is the original Gantt Chart for the project and an updated Gantt Chart for the actual tasks accomplished. The major difference between the two different timetables was the available time spent on different portions of the project. These time changes aside, a great deal of the project followed the original timeline with little to no issues. 3 | TECHNICAL DESCRIPTION OF WORK PERFORMED HARDWARE DESIGN With regards to reliability, time, and scope of the project the hardware design of the sensors used in the project were bought rather than designed and built. This allowed for more time to focus on developing a diagnostic tool for determining when a sensor node was malfunctioning. However, this did not make things simple, since there were plenty of options when purchasing the sensor network and many hardware considerations had to be made. These included: choice of power, cost, getting the correct data input, accuracy of sensors, and ease of use. When looking upon the choice of power, there were three main types that were found to be common: power adapter plugged into a source, battery powered, and RF powered. The first option of having a sensor that was plugged into a source of power was immediately abandoned since this would eliminate 12/4/2013 Wireless Sensor Network Health Diagnostic 11 ECE 480 – Design Team 2 the wireless factor in our project. Although the reliability of the sensor nodes would increase without the need of monitoring voltage levels, their usability would greatly decrease, and therefore not desirable. Battery powered sensors are very common amongst wireless sensors and provide a reliable form of power source, however this adds additional complexity in detecting failed nodes. As the battery decays over time, it may not provide enough voltage to give accurate readings, and all batteries are guaranteed to die at some point in time, thus the need to pay constant attention to the battery level. The third form of power, RF energy harvesting, allows for the sensors to be powered for the lifetime of the actual sensor node hardware. Energy harvesting is growing rapidly in popularity throughout low-power electronics and working on the cutting edge of technology allows the opportunity to produce new and exciting results. A downfall with of RF energy harvesting was the need to have the provided RF transmitter with a semi-clear pathway to the sensors in order to function properly. The cost of the project is another important factor in deciding which product to purchase. In general, as price increased so did the number features included in the sensor network and with a project geared towards the initial stages of research, a reasonably priced but reliable sensor network would fulfill specifications. The sensors were required to measure both internal and external metrics, including (but not limited to) light, humidity, temperature, and either voltage or current. The sensor network that was chosen provided that, plus measuring received signal strength. These metrics worked very well with analyzing data and determining when a particular node was malfunctioning. The received signal strength in combination with voltage could help determine when a sensor was not getting the appropriate amount of power, and monitoring activity of the external sensors also helped in error analysis. Accuracy of the sensors was also a very important in the design decision. Flawed or inaccurate data can impact failure analysis algorithms. This could result in false positives, when a node is deemed to have failed but is actual functioning properly, or false negatives, when a failed node is not detected. Ease of use was a big factor in selecting a sensor network. The ability to set up the network and get it running quickly was a top priority. This allowed for minimal wasted time in designing and building the network itself, and maximizing the time in researching the metrics and developing a diagnostic tool. As show previously in Table 2, the Powercast P2210-Eval-01 development kit was chosen as the best option for the AFRL network health monitoring purposes. Included in the kit were components developed and built by Powercast Co. and Microchip. The items included are shown in Figure 3 on the next page. 12/4/2013 Wireless Sensor Network Health Diagnostic 12 ECE 480 – Design Team 2 FIGURE 3. POWERCAST P2110-EVAL-01 DEVELOPMENT KIT Power and Data Transmitter (TX91501-3W-ID) P2110 Evaluation Board (92110-EVB) Patch Antennas (2) Dipole Antennas (2) Wireless Sensor Board (WSN-EVAL-01) Microchip 16-bit XLP Development Board (DM240311) Microchip MRF24J40 PICtail/PICtail Plus Daughter Board (AC164132-1) PICkit Programmer/Debugger (PG164130) A. POWER AND DATA TRANSMITTER (TX91501-3W-ID) The transmitter was manufactured by Powercast Co. It is powered at 3-watts, and uses a data integrated 8dBi antenna at a center frequency of 915 MHz6. The device sends a pre-programmed transmitter ID that was received by the Powercast chip (P2110) and decoded by the microcontroller unit (MCU) on the Wireless FIGURE 4. POWER AND DATA TRANSMITTER 6 Sensor Board . The transmitter provides a 60 degree beam pattern for width and height8, meaning that as long as the sensor nodes are placed within the angles defined by the transmitter, the RF signal will be able to power the nodes efficiently. B. MICROCHIP 16-BIT XLP DEVELOPMENT BOARD (DM240311) This board, included in the Powercast P2110-Eval-01 kit, was a development platform featuring Microchip’s PIC24F MCU that was pre-programmed to operate as an access point for receiving 12/4/2013 FIGURE 5. 16-BIT XLP DEVELOPMENT BOARD Wireless Sensor Network Health Diagnostic 13 ECE 480 – Design Team 2 data from the included Wireless Sensor Boards6. This board was connected directly to the computer via a USB cable and acts as the cluster head for all sensor nodes. C. MICROCHIP MRF24J40 PICTAIL/PICTAIL PLUS DAUGHTER BOARD (AC164134-1) A radio (2.4GHz, IEEE 802.15.4) that plugs into the 16-bit XLP Development Board for receiving data from the Wireless Sensor Boards6. FIGURE 6. MRF24J40 PICTAIL D. P2110 EVALUATION BOARD (P2110-EVB) This component was an evaluation board (Rev. B) for the P2110 Powerharvester Receiver6. Located on the evaluation board there was an SMA connector in order to connect antennas for data transmission and a 10-pin connector for the included Wireless Sensor Boards6. Two evaluation boards are available within the kit. As mentioned above, this WSN utilizes RF energy thus; the FIGURE 7. P2110 EVALUATION BOARD evaluation boards are battery-free. The RF energy captured was converted to DC power, via the P2110 Powerharvester Receiver, and the DC power was stored in a 50mF capacitor. Upon reaching a voltage of 3.3V, the capacitor discharges the energy and transmits the data to the host7. PATCH AND DIPOLE ANTENNAS Both antenna types are 915 MHz directional antennas6. The patch antenna has a 120-degree reception pattern whereas the dipole antenna has a 360-degree reception pattern6. Two of each type of FIGURE 8. PATCH AND DIPOLE ANTENNA antenna are included in the kit; one for each evaluation board (P2110-EVB). E. WIRELESS SENSOR BOARD (WSN-EVAL-01) This board comes fixed with 3 different sensor types: temperature, humidity and light6. It also offers an external input as well for additional sensors6. The wireless sensor board connects into the 10pin connector on the P2110 Evaluation Board which then sends FIGURE 9. WIRELESS SENSOR BOARD information from the sensors to the Microchip Development Board6. Two wireless sensor boards are 12/4/2013 Wireless Sensor Network Health Diagnostic 14 ECE 480 – Design Team 2 included in the development kit. These are the most important pieces of the kit. Analyzing the informative sent from the sensor boards to determine network health was the key objective of the project and will be discussed further throughout the report. F. PICKIT 3 PROGRAMMER / DEBUGGER (PG164130) This was a programming tool included in the kit for updating code on the Wireless Sensor Boards and the 16-bit XLP Development Board6. This was not utilized due to time constraints of the project. HARDWARE IMPLEMENTATION After gaining familiarity with all of the hardware, it was time to configure the wireless sensor network development kit. Configuring the wireless network was a vital part of the design process. The team undertook many steps to setup the wireless sensor network. The first step of configuring the network was to download and install a terminal emulator program on the PC being used. There were many options to choose from but the team decided to utilize the terminal emulator recommended by Powercast. This terminal emulator was called HyperTerminal and was available to download on Powercast’s website. The second step was to power and configure the Microchip 16-bit XLP Development Board (DM240311) as well as the Microchip MRF24J40 PICtail/PICtail Plus Daughter Board (AC164134-1). As you can see in Figure 10, The Microchip MRF24J40 was connected to the 16-Bit XLP development board via connection J7. Once both were connected, the development board settings were set. To make sure the development board was operating properly, the team had to set switch four to PIC24FK which allowed the team to configure K-series flash devices. The K-series was used for the development kit but if the 16-Bit XLP development board was bought by itself then the J-series could be used as well. FIGURE 10. MRF24J40 CONNECTED TO DEVELOPMENT BOARD Next switch seven, the component power switch, had to be set to the ON position which allowed the component power to be selected only by the corresponding component select jumper. After switch seven was set to ON, jumper 12 had to be set to EXT PS/USB. Setting jumper 12 to EXT PS/USB allows the 16-Bit XLP development 12/4/2013 Wireless Sensor Network Health Diagnostic 15 ECE 480 – Design Team 2 board to be powered via USB. The USB connection provides a nominal 5V power source but by using a Schottky diode and a Low Dropout regulator circuit, the voltage was dropped down to 3.3 volts for the microcontroller and board components. After this power source was selected, the green LED on the development board was illuminated which showed the team the board was being set up correctly. Other power sources could have been used such as two AAA batteries, a CR2032 coin cell battery, or an external, regulated DC power supply. Once the power was set up a few jumpers had to be connected. Jumpers six, nine, and ten all had to be connected. Jumper six enables the modular expansion header. Jumper nine allows the team to measure current consumed by the PIC24F microcontroller but jumper nine interrupts the microcontroller's VDD path so when the team was not measuring the current, jumper nine must be connected. Jumper ten acts the same way but was used to measure the current consumed by the various board components which does not include the microcontroller, ICSP header and the USB interface. After all of those jumpers were connected, the 16-Bit XLP development board was configured. Once the development board was configured, it was time to make sure the team’s PC could read the data being sent to the development board from the sensor nodes. For the team’s PC to successfully read in data from the Microchip 16-Bit XLP development board, a USB-to-Serial driver file had to be downloaded and installed. Powercast’s website had an available USB-to-Serial driver file on their website to download. After the file was downloaded, the team connected the development board to the PC and installed the hardware. The team now could use the port COM3 to communicate with the wireless sensor network via USB. After the COM3 port was enabled and the development board was configured and connected to the PC, HyperTerminal was opened and configured to read in the data. HyperTerminal had a simple set up with just a few things needed to finish configuring the network. First the team had to setup the connection which included naming the connection and how the team was connecting. For this project as mentioned above, the team connected to the network via USB port COM3. Next the team had to choose the parameters of the COM3 port. With some advice from Powercast, the team chose the following settings in Table 4. 12/4/2013 Wireless Sensor Network Health Diagnostic 16 ECE 480 – Design Team 2 Parameter Setting Bits per second (Baud Rate) 19200 Data Bits 8 Parity None Stop Bits 1 Flow Control Hardware TABLE 4. COM3 PORT SETTINGS Once the COM3 port was set, it was time to plug in the power transmitter and build the wireless sensor nodes. The power transmitter did not need any configuration. It was simple as plugging it into a normal power outlet. Next, it was time to build the wireless sensor nodes which consisted of the P2110 Evaluation Board (P2110-EVB), a dipole or patch antenna, and the Wireless Sensor Board (WSNEVAL-01). For the team’s wireless sensor network, two nodes were built using the dipole antenna. The dipole antenna was used due to it being omni- directional. Each node also has a unique node ID which was set using DIP switches FIGURE 11. WIRELESS SENSOR BOARD COMPONENTS AND BUILT located on each sensor board. Figure 11 shows the wireless sensor node parts as well as a completely built wireless sensor node. The last thing that needed to be done to successfully build the nodes was to make sure C5 was connected using jumper 1. C5 was a 50mF capacitor that was ideal for the development kit. Once both nodes were built and configured and the power transmitter was plugged in, it was time to go back to the PC and make sure the development board and PC were working correctly reading the data being sent from the wireless sensor nodes. HyperTerminal was opened and the team witnessed all the data being sent from each sensor on each node to the PC via the development board successfully. See Figure 12 to view the HyperTerminal reading in data from the wireless sensor nodes. 12/4/2013 Wireless Sensor Network Health Diagnostic 17 ECE 480 – Design Team 2 FIGURE 12. HYPERTERMINAL SESSION WITH STREAMING SENSOR NETWORK DATA WIRELESS SENSOR NETWORK FLOW CHART FIGURE 13. WIRELESS SENSOR NETWORK FLOWCHART 12/4/2013 Wireless Sensor Network Health Diagnostic 18 ECE 480 – Design Team 2 SOFTWARE DESIGN REQUIREMENTS The node sensor network that was purchased for this project came with the necessary software to simply run and gather data from each of the sensors in a simple manner, making setting up the sensor network less time consuming. After the network was set up to collect sensor data packets, the data had to run through processing, manipulation, and display programs. This was set up into a model-viewcontroller software pattern to accomplish this. The model portion does the backend data analysis , list concatenation of data, and set up all parameters to run into the view portion, which is a graphical user interface (GUI) to view the sensor data in real time. The main software requirement embedded into the scope of the project was data representation in combination with analysis and failure detection. This visual data representation that is shown in the GUI is essential in viewing nodal failures or misrepresentation of data, as well as monitoring the health and status of the nodes themselves. This method of data representation especially assists in ease of use in the sensor nodes and also decreases the difficulty in understanding the information. The data analysis to create the failure detection is also essential in the determination of failure of nodes in the system. This software implemented into the model portion of the controller will allow users to not have to continuously monitor the system, but can look at if a failure warning is filed into the view and thus allowing less time to be consumed in graph analysis. SOFTWARE IMPLEMENTATION The software portion of the project grew to be the main part of the work associated with correctly analyzing the data input. First, the data is read from the USB port byte by byte into the controller module. Next, the data is formatted into packets and sent to the model for storage and data analysis. The model implements an application programming interface (API) which allows the view to access the stored data. The view polls the model for new data every few seconds and updates its view. This design FIGURE 14. THE GRAPHICAL USER INTERFACE pattern allows the data to be graphed in real time. The software was written in Python 2.7 [9] and required a few additional libraries including pySerial [10], matplotlib [11] and wxPython [12]. Links to more information on each of these libraries can be found in Appendix 2. 12/4/2013 Wireless Sensor Network Health Diagnostic 19 ECE 480 – Design Team 2 Additional algorithms were implemented for data analysis. This was done in both Python and Matlab, where the packets were read into Python which then converted the data into a comma separated value (csv) file(s) to be read from Matlab. When inputted into Matlab, correlations in the data could be viewed and graphs were easily made. Doing this allowed for easier determination of what metrics could help determine a failing sensor, assisted in looking at the data easily, and also made calculations easier to compute. An example of this data analysis from Matlab was shown below in Figure 14. FIGURE 15. MATLAB ANALYSIS The final part of the software that was implemented into this project was the failure analysis portion, also done in Python. The failures were based off of three separate functions, all determined from studying the different data types and how they react to failure. These included a short term analysis, a long term analysis, and a zero data analysis. The short term analysis was used for the external sensors (measurement of light, humidity, and temperature) which took a number of the last packets and FIGURE 16. SHORT TERM ANALYSIS determined if the very last one seemed out of normal. To determine what “normal” was, a calculated threshold was based off of 20% of the average of the frame except for the last packet. This formula was 12/4/2013 Wireless Sensor Network Health Diagnostic 20 ECE 480 – Design Team 2 calculated under the assumption that if one of these packets fluctuated that largely that fast, when an external factor such as that would typically not do so and generally have slow changing values, then something was not operating correctly. FIGURE 177. LONG TERM ANALYSIS The long term analysis was particularly designed for the internal sensors, which could fluctuate a good amount, however it would generally stay around the same value that it initially was. Therefore, the average of the entire data set was taken, and if a packet came in that was a certain threshold away from the calculated mean, then something occurred to make this irregularity occur. FIGURE 18. ZERO VALUE ANALYSIS Finally, a zero data analysis was a simple analysis that was implemented to see if data came in at a zero value where it was not near zero before. This was very similar to the short term analysis in terms of determining when a packet might actually read a zero value, however if it was unusual an assumption could be made of malfunction. Upon further research into sensor failure, an open circuit in the nodes resulted in no data being transferred, but rather a string of “-”, which will then be switched to a “0” value, and look like an open circuit failure. 12/4/2013 Wireless Sensor Network Health Diagnostic 21 ECE 480 – Design Team 2 4 | TEST DATA WITH PROOF OF FUNCTIONAL DESIGN After the successful configuration of the wireless sensor network, metric analysis of the network was necessary to determine the health. Testing was split into 2 different categories, hardware functionality and software testing. HARDWARE FUNCTIONALITY The tests carried out for the hardware concern the receiving of correct data packet information. The HyperTerminal, shown in Hardware Implementation, displays the readings of the sensors located on the Wireless Sensor Board. If there are issues with a particular sensor or sensors, those readings will fluctuate or become unreadable. Because of the limitations of RF energy, short distance testing was done when confirming hardware functionality. Additionally, line of sight for the transmitter and the nodes was a large factor in data retrieval for the nodes. Many sample tests FIGURE 18. SENSOR BOARDS WITH THREE SENSORS were run under various conditions in order to observe and examine the behavior of the network. The first of the tests run focused primarily on the jumper pins located on the Wireless Sensor Boards shown in Figure 19. Detailed descriptions of the tests run provide support to show “failed” sensors within the network which affect the health of the network. HARDWARE TESTS All tests used both of the configured sensor nodes. Multiple parameters were changed and modified during each test such as, length of the test, removal of jumper pins from specific sensors, and angle at which the sensors were positioned in relation to the RF power transmitter. All were completed within a short distance as discussed above, in ideal environmental conditions and with the dipole antennas. 12/4/2013 Wireless Sensor Network Health Diagnostic 22 ECE 480 – Design Team 2 The data for all tests can be found in Appendix 4. Test Name Transmitter (Height & Distance from Sensor Nodes) Sensor Status (Jumper Pins Pulled On Certain Sensors) Sample2-3 Sample2-4 Sensor Node Position (Angle in Relation to Transmitter) Height Width 3.97° 0° 3.97° 0° Distance Height 3ft 2.5 inches 3ft 2.5 inches Sample2-5 Sample2-6 3.97° 3.97° 3ft 3ft 2.5 inches 2.5 inches Sample2-7 Sample2-8 Sample2-9 15.25° 0° 0° 0° 0° 48.5° 8ft 2ft 2.67ft 4ft 0ft 0ft Temperature Light Not Active Active Active Not Active Not Active Active Not Active Not Active Active Active Active Active Active Active 0° 0° Test Time Humidity Active Active 30 mins 30 mins Not Active Not Active 30 mins 30 mins Active Active Active 45 mins 2 hr 30 mins TABLE 5. SUMMARY OF TEST PROCEDURES Tests sample 2-3 through 2-6 all displayed similar results. Figure 18 below gives a nice visual representation of the transmitter and sensor positions. The only difference that occurred between each test was that the data for sensors that were not active could not be displayed via the HyperTerminal. This unreadable data was displayed as such, “--“and can be seen in the test data supplied in Appendix 4. The Received Signal Strength (RSSI) varied between 0.5mW-3.5mW and time between packets (dT) averaged around 2 seconds. In order to determine the current draw of the sensors from the evaluation board, the voltage across JP2 on the Wireless Sensor Board was measured and divided by a 10Ω resistor that was in parallel for current measuring purposes4. An oscilloscope (Infiniium DSO9064A) was used to collect screen captures that show the voltage across the pin. These screen captures can be found in Appendix 4. It was found that regardless of active or non-active sensors on the Wireless Sensor Board, the current draw was constant and unchanging. The average voltage of 3.5V for the capacitor can be seen for all tests which gives a calculated average current draw of 350mA. These results were very consistent during all the tests and even with certain sensors not active, no significant change could be observed. 12/4/2013 Wireless Sensor Network Health Diagnostic 23 ECE 480 – Design Team 2 FIGURE 20. NETWORK TEST SETUP: SAMPLE2-3 THRU SAMPLE2-6 Test sample 2-7 increased the distance and height that the sensor nodes were from the transmitter and by doing so RSSI greatly decreased and dT greatly increased. These factors were expected, considering the limitations of RF energy, but the information obtained from the sensors was very consistent and matched the current conditions in the testing lab. Even though the time to receive the data had been increased, the network health was still in good despite the strength decrease. FIGURE 19. NETWORK TEST SETUP: SAMPLE2-7 12/4/2013 Wireless Sensor Network Health Diagnostic 24 ECE 480 – Design Team 2 Test sample 2-8 was completed specifically for the software that had not been implemented yet. It was the longest test so it could provide a large sample of data that could be displayed by the GUI interface that was being developed for it. No irregularities were found during testing and all nodes functioned properly throughout the testing period. FIGURE 202. NETWORK TEST SETUP: SAMPLE2-8 The last test to be completed was sample 2-9. This test focused on the maximum width angle that was allowable from the Powercast transmitter. If the sensor nodes were place outside of the maximum allowable angle, the capacitor would not charge and no data transmission would take place. This situation would result in a complete node failure in the network and the fact that no new data would be obtained was the clear indicator of that. This issue could easily be seen as a power issue, similar to battery life of currently FIGURE 21. NETWORK TEST SETUP: SAMPLE2-9 used sensor nodes in the industry. Again, along with all other tests, no strange data was obtained via the HyperTerminal. All sensors were operating correctly reaffirming a good health for the network. 12/4/2013 Wireless Sensor Network Health Diagnostic 25 ECE 480 – Design Team 2 5 | FINAL COST, SCHEDULE, SUMMARY AND CONCLUSIONS FINAL COSTS As discussed before, Team 2 was granted an increase budget of $2000 for this project. Although the budget was $2000 the team was able to successfully complete the project with less than two-thirds of that amount. As you can see in Table 6 below, only $1,250 of the $2000 the team received was necessary. Luckily, the team was able to acquire everything they needed in one development kit. This helped the team keep within their budget. Product Cost Powercast P2110-EVAL-01 Development Kit1 $1,250 Total $1,250 TABLE 6. FINAL COSTS SCHEDULE The schedule consisted of the initial project acceptance phase, research and design choices, and lastly network implementation. At the beginning of the semester the team had to decide what direction to take the project in regards to the design choices. This was due to the fact that the Air Force Research Laboratory required an additional proposal, separate from that of the ECE 480 course, which needed to be accepted before the team could start the design process. After acceptance, the team was able to obtain the necessary budget which allowed them to enter the research and design choices phase of the project. During this phase, the team obtained a suitable wireless sensor network development kit for network health monitoring purposes. Once the network was configured, the team was able to test the network, implement their software and introduce a graphical user interface. This allowed them to monitor the health of the wireless sensor network in real time. The team was pleased that that they were able to stick to the schedule and meet all deadlines. The phases described above can be seen in more detail in the Final Gantt Chart in Appendix 3. CONCLUSION Overall, the project was a success. Various design issues were identified earlier in the process and properly addressed. These design issues included selecting network hardware, choosing a flexible programming language, identifying a proper software design pattern, and pinpointing reliable metric analysis algorithms. Other project obstacles involved writing an extra proposal for the United States Air Force Research Laboratory, and being unable to contact and speak with sponsor due to job related 12/4/2013 Wireless Sensor Network Health Diagnostic 26 ECE 480 – Design Team 2 activities and the US government shutdown. Due to the shutdown, the team was unable to receive any design components previously used by the Air Force Research Laboratory. Starting delays aside, the team was still able to proficiently analyze multiple design choices. The team decided to purchase a full wireless sensor network development kit in order to strengthen its focus on analyzing metrics within the wireless sensor network that would best determine its health. Furthermore, using a development kit allowed for quick setup and configuration. In choosing this option, the team made a great decision and was able to create a full working prototype on time and on budget. Along with fulfilling all of the design requirements, the team was able to design and develop a project with a solid foundation for future improvements. Since the wireless sensor network is easily configurable, a future team can easily pick up where this design team left off. The software is written in Python, a simple and flexible programming language, and is well documented and engineered for future expansion. More features on graphical user interface can be added by fully leveraging the capabilities of the wxPython and matplolib libraries. Additionally, new algorithms for network health analysis can be implemented in the model module. Overall, the project is readily suitable for future development. The project that was chosen by the team resulted in an outstanding learning experience for each member. The team was fully immersed in the design process and each member will take with them a new set of skills to industry. Some of these soft skills include learning how to work in a team setting, outstanding written and oral communication, overcoming and learning from failures, and technical skills such as programming and configuring hardware. Ultimately, this design class taught each member how to become a professional and skills to utilize in their future careers. 12/4/2013 Wireless Sensor Network Health Diagnostic 27 ECE 480 – Design Team 2 APPENDIX 1 – TECHNICAL ROLES, RESPONSIBILITIES AND WORK ACCOMPLISHED KELLY DESMOND – SENSOR NETWORK CONFIGURATION AND MAINTENANCE Kelly’s technical role this semester was Sensor Network Configuration and Maintenance. With this role Kelly had to make sure the team was ordering the correct wireless sensor network development kit as well as be in charge of all the hardware of that network throughout the entire semester. His first role was to make sure that the development kit that was being purchased by the team had could successfully fulfill all the requirements from the Air Force Research Laboratory. These requirements included low power, must include but not limited to temperature, humidity and light sensors, and the team must be able to monitor internal and external parameters. Kelly was able to find the P2110-EVAL-01 Lifetime Power Energy Harvesting Development Kit for Wireless Sensors manufactured by Powercast and Microchip. Once the development kit arrived, Kelly had to learn everything about it. He had to know what each part was and how each part connected so that the group could easily construct and deconstruct the network quick and efficiently for tests. Before the team could start the tests, Kelly had to configure the network. He had to ensure proper construction of the network and make sure it could communicate correctly with the PC. A terminal emulator needed to be downloaded, installed and setup for this purpose. HyperTerminal, a terminal emulator from Powercast, was recommended and after some research deemed to be the best option. Kelly used HyperTerminal to set up the COM3 port on the PC so that the network would be able to send its data to the PC to be recorded. Once the network was configured, the team needed to know how to interact with the hardware to help create different tests and read different information such as current being used by the microcontroller, the current used by the sensors, or knowing what jumpers to pull for each sensor. There were a multitude of switches and jumpers on the development and evaluation boards which Kelly was able to learn and effectively teach to the team. 12/4/2013 Wireless Sensor Network Health Diagnostic 28 ECE 480 – Design Team 2 STU ANDRZEJEWSKI – FAULT DETERMINATION AND SYSTEMATIC FAILURE OF NODES Stu’s technical role comprised of network testing and fault determination. He created multiple test procedures and implemented node failures in order to analyze the network health. These test procedures included but were not limited to, targeted sensor failures, sensor distance testing and RF signal strength in relation to network health. The forced failures of specific sensors on the Wireless Sensor Boards were done with the express interest to effects it would have on the network. During each test, Stu recorded many different parameters important to the testing procedure. These different parameters included the number of active nodes, the number and type (Light, Temperature and Humidity) of active and failed sensors, the RF power transmitter angle in relation to the sensor nodes, the distance of the sensors from the RF power transmitter and the antenna type that were attached to each sensor node. Due to the limits of the project budget, a total of 2 sensor nodes were available and Stu utilized both of these sensor nodes for a vast majority of his tests. During his testing, he was able to successfully determine the current draw for the Wireless Sensor Boards attached to each node and collected multiple screenshots to confirm this. The most challenging part for Stu during testing was the fault determination. Because of the RF energy source, testing had to be done as close distances. If nodes were not within range of the RF power transmitter, complete failure of the node would occur and no data would be received. Stu did look at the possibility of physically damaging the sensor nodes because this would likely give data irregularities, but it was decided after a team discussion to not approach any testing in this fashion. Stu also assisted Kelly with some of the minor elements of the network configuration during the project. 12/4/2013 Wireless Sensor Network Health Diagnostic 29 ECE 480 – Design Team 2 DAVID ROGERS – SOFTWARE ARCHITECT AND GRAPHICAL USER INTERFACE DEVELOPER David's technical role was designing and implementing the software associated with the diagnostic tool. This role required a solid foundation of object oriented programming knowledge. David's decision to use a modelview-controller architecture provided a foundation for rapid development of the application. He was able to successfully find and integrate the necessary libraries in order to deliver a high quality software product with the proper documentation for further development. His controller implementation can be run in both real time mode and demo mode. In real time mode, data from the sensors is read from the cluster head over USB as it streams in. This required understanding and using the pySerial library to read bytes from a serial connection. In demo mode, previously recorded sample data can be read in from a file and simulated as if the data is streamed in real time. He also successfully created a model API for which any view can interface to in order to display the data. The model is also extensible to be called for data analysis purposes. Most importantly, the model processes the data from the controller quickly and efficiently so that many calls to the model can be made without crashing the application. David also created a graphical user interface, the view, so that an operator can see network data and the status of each node in real-time. The view required using matplotlib to plot the data, and using wxPython to create the rest of the user interface. The plots can be saved at any time and the time range and metric data shown can all be configured at run time. This view is very extensible and there is room left for further development. Ultimately, David fulfilled his role with flying colors. He also set up a git repository in order to facilitate the software engineering process and track changes over the course of the project. Additionally, he implemented a logger within the software for documentation and debugging purposes. Finally, David multithreaded the design in order to have responsive view and the application can continue to run if the view crashes or is exited on accident. 12/4/2013 Wireless Sensor Network Health Diagnostic 30 ECE 480 – Design Team 2 BRAD GARROD - FAILURE ANALYSIS ALGORITHM IMPLEMENTATION Brad’s technical role consisted of determining the associated metric data correlations to a nodal failure, then writing functions that can assist in failure detection. This role consisted of work in both Matlab for data analysis and python for the failure detection functions. To analyze the data in Matlab, failure data produced by Stu was separated and put into a comma separated value file (csv) to be imported into Matlab. Once in Matlab, the data was organized into relevant sets which could then be plotted along with averages. This data analysis assisted in easier calculations of thresholds in regards to the failures. This analysis helped break the failure detections into two groups: external and internal sensors. These two groups had separate relationships to failure in themselves, but also grew in a confidence level when determining a failure. Once the thresholds and correlations to failure were analyzed and determined, Python functions were constructed to determine when a nodal failure occurred. This in combination with the Graphical User Interface constructed by David can make failure detection much easier. In python, three simple functions were created: short term, long term, and zero analysis. These functions were all applied to separate data sets, which was determined from the Matlab analysis. Overall, because of limitations in time and prioritizing tasks in relationship to these algorithms, the algorithms were not as robust as they could have been. These algorithms, however, gave a good basic detection of failure of the nodes and in combination with a user analysis using the interface can assure that nodal failure can be determined. In conclusion, the research into the metrics associated with nodal failure was accomplished which was the main scope of this project. 12/4/2013 Wireless Sensor Network Health Diagnostic 31 ECE 480 – Design Team 2 APPENDIX 2 – LITERATURE AND WEBSITE REFERENCES 1. Wireless Sensor Networks in Space, NASA Ames Research Center, March 2011 http://cenic2011.cenic.org/program/slides/cenic-2011-ZigBee-sensor-net_foster.pdf 2. Sun SPOT (Rev8), Sun SPOT World, 2013 http://www.sunspotworld.com/products/index.html 3. Crossbow MTS 400, Crossbow Technology, 2007 http://www.eol.ucar.edu/isf/facilities/isa/internal/CrossBow/DataSheets/MTS400-420.pdf 4. Powercast P2110-Eval-01 User Manual, Powercast, 2013 http://www.Powercastco.com/PDF/P2110-EVAL-01-manual.pdf 5. Wireless Sensor Network (WSN) Starter Kit, National Instruments, 2013 http://sine.ni.com/nips/cds/print/p/lang/en/nid/206916 6. Powercast P2110-Eval-01 User Manual, Powercast, 2013 http://www.powercastco.com/PDF/P2110-EVAL-01-manual.pdf 7. Powercast P2110 – 915 MHz RF Powerharvester Receiver Datasheet, Powercast, 2013 http://www.powercastco.com/PDF/P2110-datasheet.pdf 8. Powercast P2110 – TX91501 – 915 MHz Powercast Transmitter User Manual, Powercast, 2013 http://www.powercastco.com/PDF/TX91501-manual.pdf 9. Python Programming Language, Python Software Foundation, 1990-2013 http://www.Python.org/ 10. pySerial Documentation, Chris Liechti, 2001-2013 http://pyserial.sourceforge.net/ 11. wxPython Documentation, 2013 http://www.wxPython.org 12. matplotlib Introduction, John Hunter, Darren Dale, Eric Firing, Michael Droettboom, 2012-2013 http://matplotlib.org/ 12/4/2013 Wireless Sensor Network Health Diagnostic 32 ECE 480 – Design Team 2 APPENDIX 3 – GANTT CHARTS Gantt Chart – Week 4 Task Name Duration Start Finish Wed Mon 9/4/13 9/16/13 Wed Wed 9/4/13 9/4/13 Wed Wed 9/4/13 9/4/13 Tue Tue 9/10/13 9/10/13 Thu Fri 9/5/13 9/13/13 Mon Mon 9/16/13 9/16/13 Mon Tue 9/16/13 9/17/13 Mon Fri 9/16/13 9/20/13 Mon Sun 9/16/13 9/22/13 Project Overview & 9 days Tasks Predecessors Resource Names Deadline NA First Group Meeting, Project Assignment & 1 day Brad,Stu,David,Kelly Wed 9/4/13 Initial Tasks Meeting Times & Scheduling 1 day First Meeting w/Group 1 day Facilitator Brad,Stu,David,Kelly NA Brad,Stu,David,Kelly NA Air Force Research Labortory 7 days 2 Brad,Stu,David,Kelly Fri 9/13/13 5 Stu (AFRL) Proposal Submit AFRL Proposal GANTT Chart Pre-Proposal Due Team Webpage Started 12/4/2013 1 day 2 days 5 days 6 days Mon 9/16/13 Stu NA Stu,David,Brad,Kelly NA David NA Wireless Sensor Network Health Diagnostic 33 ECE 480 – Design Team 2 First Contact w/Sponsor Propsal 1 day 15 days Wed Wed 10/2/13 10/2/13 Mon Fri 9/23/13 10/11/13 Fri Fri Wed 6 Stu,David,Brad,Kelly 8 Stu,David,Brad,Kelly NA 6 Stu,David,Brad,Kelly NA 10/2/13 Configure Sensor Network & Verify Correct 16 days 10/4/13 10/25/13 Sensor Readings Research & Order 2 days Sensors/SOC Fri Mon 10/4/13 10/7/13 Thu Fri Brad Mon 10/7/13 Study & Configuration of IEEE 802.15.4 7 days (MiWi P2P 10/10/13 10/18/13 David,Stu,Brad,Kelly Fri 10/18/13 Protocol) Verification of Correct Sensor 6 days Readings Design Day Team Page Work 10 days Oral Proposal Presentation 10 days Practice Team Progress Report 1 Design Issues 12/4/2013 5 days Sat Fri 10/19/13 10/25/13 Mon Fri 9/23/13 10/4/13 Mon Fri 9/23/13 10/4/13 Mon Fri 10/28/13 11/1/13 24 days Tue Fri Kelly Fri 10/25/13 David,Kelly NA Brad,Stu,David,Kelly NA Brad,Stu,David,Kelly NA Brad,Stu,David,Kelly NA Wireless Sensor Network Health Diagnostic 34 ECE 480 – Design Team 2 Paper 9/17/13 10/18/13 Mon Fri Team Progress Report 2 & Project 5 days 11/18/13 11/22/13 18 Brad,Stu,David,Kelly NA 15 Brad,Stu,David,Kelly Fri 11/8/13 21 Stu,Brad,David,Kelly 22 Stu,Brad,David,Kelly Demonstration Identify Simple Network Health 11 days Metrics Sat Fri 10/26/13 11/8/13 Develop Graphical User Interface (GUI) 11 days for Configuring Sat Fri 11/9/13 11/22/13 Sat Sun Fri 11/22/13 Sensor Nodes Confirm Health Diagnostics & Implement Network 7 days Security 11/23/13 12/1/13 Sun 12/1/13 Functionality (If Time Allows) Wed Final Reports Design Day 12/4/2013 Brad,Stu,David,Kelly 12/4/13 1 day Fri Fri 12/6/13 12/6/13 23 NA Stu,David,Brad,Kelly Fri 12/6/13 Wireless Sensor Network Health Diagnostic 35 ECE 480 – Design Team 2 Gantt Chart – Final Task Name Duration Start Finish Wed Mon 9/4/13 9/16/13 Wed Wed 9/4/13 9/4/13 Wed Wed 9/4/13 9/4/13 Tue Tue Project Overview & 9 days Tasks Predecessors Resource Names Deadline NA First Group Meeting, Project 1 day Assignment & Brad,Stu,David,Kelly Wed 9/4/13 Initial Tasks Meeting Times & 1 day Scheduling First Meeting w/Group 1 day Facilitator 9/10/13 9/10/13 Brad,Stu,David,Kelly NA Brad,Stu,David,Kelly NA Air Force Research Labortory 7 days Thu Fri 9/5/13 9/13/13 Mon Mon 2 Brad,Stu,David,Kelly 5 Stu Fri 9/13/13 (AFRL) Proposal Submit AFRL Proposal GANTT Chart Pre-Proposal Due 1 day 2 days 5 days Team Webpage 6 days 12/4/2013 9/16/13 9/16/13 Mon Tue 9/16/13 9/17/13 Mon Fri 9/16/13 9/20/13 Mon Sun Mon 9/16/13 Stu NA Stu,David,Brad,Kelly NA David NA Wireless Sensor Network Health Diagnostic 36 ECE 480 – Design Team 2 Started First Contact w/Sponsor Propsal 9/16/13 9/22/13 1 day 15 days Wed Wed 10/2/13 10/2/13 Mon Fri 9/23/13 10/11/13 6 Stu,David,Brad,Kelly 8 Stu,David,Brad,Kelly 8 Stu,David,Brad,Kelly Wed 10/2/13 NA Configure Sensor Network & Verify Correct 16 days Sensor Fri Fri 10/4/13 10/25/13 Fri 10/25/13 Readings Research & Order Sensor Development 2 days Fri Mon 10/4/13 10/7/13 Brad Mon 10/7/13 Kit Verification of Correct Sensor 6 days Readings Design Day Team Page 10 days Work Oral Proposal Presentation 10 days Practice Team Progress Report 1 Design Issues Paper 12/4/2013 5 days 24 days Tue Tue 10/8/13 10/15/13 Mon Fri 9/23/13 10/4/13 Mon Fri 9/23/13 10/4/13 Mon Fri 10/28/13 11/1/13 Tue Fri 9/17/13 10/18/13 Kelly,Stu Tue 10/15/13 David,Kelly NA Brad,Stu,David,Kelly NA Brad,Stu,David,Kelly NA Brad,Stu,David,Kelly NA Wireless Sensor Network Health Diagnostic 37 ECE 480 – Design Team 2 Team Progress Report 2 & Project 5 days Mon Fri 11/18/13 11/22/13 17 Brad,Stu,David,Kelly 14 Brad,Stu,David,Kelly 20 Stu,Brad,David,Kelly 21 Stu,Brad,David,Kelly NA Demonstration Identify Simple Network Health 6 days Metrics Tue Tue 11/5/13 11/12/13 Fri 11/8/13 Develop Graphical User Interface (GUI) 11 days for Configuring Wed Wed 11/13/13 11/27/13 Fri 11/22/13 Sensor Nodes Confirm Health Diagnostics & Implement Network 3 days Security Thu Sun 11/28/13 12/1/13 Sun 12/1/13 Functionality (If Time Allows) Wed Final Reports Design Day 12/4/2013 Brad,Stu,David,Kelly 12/4/13 1 day Fri Fri 12/6/13 12/6/13 22 Stu,David,Brad,Kelly Wireless Sensor Network Health Diagnostic NA Fri 12/6/13 38 ECE 480 – Design Team 2 APPENDIX 4 – TEST DATA & SCREEN CAPTURES Sample 2-3 Test Data Sample 2-4 Test Data 12/4/2013 Wireless Sensor Network Health Diagnostic 39 ECE 480 – Design Team 2 Sample 2-5 Test Data Sample 2-6 Test Data 12/4/2013 Wireless Sensor Network Health Diagnostic 40 ECE 480 – Design Team 2 Sample 2-7 Test Data Sample 2-8 Test Data 12/4/2013 Wireless Sensor Network Health Diagnostic 41 ECE 480 – Design Team 2 Sample 2-9 Test Data 12/4/2013 Wireless Sensor Network Health Diagnostic 42 ECE 480 – Design Team 2 Sample 2-3: JP2 Voltage Screen Capture Sample 2-4: JP2 Voltage Screen Capture 12/4/2013 Wireless Sensor Network Health Diagnostic 43 ECE 480 – Design Team 2 Sample 2-5: JP2 Voltage Screen Capture Sample 2-6: JP2 Voltage Screen Capture 12/4/2013 Wireless Sensor Network Health Diagnostic 44