1
DESIGN OF A UNIVERSAL SCAN TOOL
by
SUNITHA GODAVARTY, B.E.
A THESIS
IN
ELECTRICAL ENGINEERING
Submitted to the Graduate Faculty
of Texas Tech University in
Partial Fulfillment of
the Requirements for
the Degree of
MASTER OF SCIENCE
IN
ELECTRICAL ENGINEERING
Approved^
May, 1998
.M4
Syby
f a
'
Q.
ACKNOWLEDGEMENTS
. o
D4
I wish to express my sincere gratitude to Dr. IVlicheal Parten, my graduate advisor,
0(
for his guidance, valuble suggestions, encouragement, and moral support thruoghout the
period of my study and research at the Texas Tech University. I am grateful to
Dr. Sunanda Mitra and Dr. Mary Baker for serving as members of my thesis committee. I
would like to thank all the members of OBD II scan tool design project for their
enormous contributions to the project. I would like to thank the Department of Electrical
Engineering for providing financial assistance throught my graduate studies. I am most
grateful to my parents and my family, for their support and encouragement. Finally, I
would like to thank all my friends for their encouragement and support.
11
TABLE OF CONTENTS
ACKNOWLEDGEMENTS
ii
ABSTRACT
vii
LIST OF TABLES
viii
LIST OF FIGURES
ix
CHAPTER
1. INTRODUCTION
1
1.1 Introduction
1
1.2 Diagnostic tool
2
1.3 Statement of the problem
3
2. ON-BOARD DIAGNOSTIC SYSTEMS
2.1 Introduction
8
8
2.2 California Code of Regulations (CCR)
10
2.3 Environment Protection Agency (EPA)
11
2.31 Clean air act
12
2.4 On-board diagnostics test standards
13
2.4.1 On-board diagnostics test procedures
15
2.4.2 On-board diagnostics test report
17
2.4.3 On-board diagnostics test equipment requirements
18
2.5 Technical Status and Proposed Monitoring System Amendments-IV
19
2.5.1 Catalyst Monitoring
19
2.5.2 Misfire monitoring
21
iii
2.5.3 Evaporative System Monitoring
22
2.5.4 Positive Crankcase Ventilation (PCV) System Monitoring
23
3. PROTOCOL/INTERFACE
25
3.1 Introduction
25
3.2 Class B Data Communication Network Interface- J1850
25
3.2.1 Network Architecture Support
26
3.2.2 Data Bus Topology
26
3.2.3 Data Bus Control
27
3.3 ISO 9141-2: 1994(E) Road Vehicles- Diagnostic Systems-CRAB
27
3.3.1 Application Layer
29
3.3.2 Data Link Layer
29
3.3.3 Physical Layer
30
4. DAT A LINK LAYER
32
4.1 Introduction
32
4.2 Addressing Strategy
32
4.3 Network Element and Structure
33
4.4Class B Data Communication Network Message
33
4.5 Header Field
34
4.5.1 Single-Byte Header Message Format
35
4.5.2 Consolidate Header Message Format
36
4.5.2.1 One-Byte Form of consolidate Header Format
36
4.5.2.2 Three-Byte form of the consolidate header format
36
4.5.3 Target Address Byte
38
iv
4.5.4 Source address
38
4.6 Data Field
39
4.6.1 Functional Data Field Formats
39
4.6.1.1 Functional Data Field Format O&l
39
4.6.1.2 Functional Data Field Format 2
40
4.6.1.3 Functional Data Field Format 3
40
4.6.1.4 Functional Data Field Format 4
41
4.7 In-Frame Response (IFR)
41
4.8 Cyclic Redundancy Check (CRC)
42
5. STANDARD DISPLAY FORMAT
44
5.1 General Characteristics Display
44
5.2 User Input
45
5.3 Application layer
45
5.4 Test Modes
46
5.4.1 Mode $01-Request Current Power Diagnostic Data
46
5.4.2 Mode $02 -Request Powertrain Freeze Frame Data
47
5.4.3 Mode $03 -Requested emission-related Powertrain
Diagnostic Trouble Codes
47
5.4.4 Mode $04-Reset/clear emission-related
Diagnostic information
49
5.4.5 Mode $05 - Request Oxygen Sensor Monitoring Test results
49
5.4.6 Mode $06 - Request On-Board Monitoring Test results
for non-continuously monitored System
50
5.4.7 Mode $07 - Request On-Board Monitoring Test results
for continuously monitored System
50
V
5.4.8 Mode $08 - Request control of On-Board System,
Test or component
50
5.5 Multiple Response to a Single Data Request
51
5.6 Response Time
51
5.7 Minimum Time between Requests from Scan Tool
52
5.8 Data Not Available
52
5.9 Maximum Values
52
6. SOFTWARE DVIPLEIVDENTATION
53
6.1 Introduction
53
6.2 Diagnostic Message Format
53
6.3 Response Message
55
6.4 Request Message
57
6.5 Standard Display
59
7. RESULTS
64
7.1 Display of diagnostic trouble codes
64
7.2 Freeze Frame Data Display
65
7.3 P.C Interface
69
8.CONCLUSIONS
72
8.1 Recommendations for Future Work
BIBLIOGRAPHY
73
74
APPEl^DIX:
SOURCE CODE FOR THE APPLICATION LAYER AND DATA LINK
LAYER
77
VI
ABSTRACT
This project deals with developing a system, which can be implemented by
TNRCC (Texas natural resource conservation Commission), as a part of State
implementation plan to verify compliance with EPA (Environment Protection Agency)
program performance standards. In the process, a Universal scan tool has been designed,
in accordance with the EPA and Society of Automotive Engineers (SAE specifications).
The system developed here not only acts as scan tool to diagnosis the trouble code, but
also aids in computer interface, which helps TNCC to maintain a database of all the cars
in Texas, with their emission-related data. A design of universal scan tool is discussed
from software perspective. The results of this system were compared by actually
plugging in a scan tool into the 1996 and 1997 model vehicles. The conclusions and
recommendations for future work are discussed.
vii
LIST OF TABLES
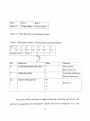
2.1 OBD Codes
H
2.2 Listing of OBD Codes when Retrieved
17
4.1 Description of Byte 1 of Three-Byte Consolidate Header
37
5.1 Message Data Bytes
47
6.1 Standard Diagnostic Message Format
54
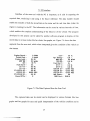
7.1 Message Data Bytes to Retrieve DTC
64
Vlll
LIST OF FIGURES
1.1 Basic Block Diagram of Scan Tool
5
3.1 ISO 9141-2 System Configuration
28
3.2 Map ofSAEJ1850 to the ISO Model
31
4.1 SAE J1850 Frame Structure with and without IFR (In-Frame Response)
34
4.2 Overview ofSAE J1850 Header Field
35
4.3 Single-Byte Header Format
35
4.4 One-Byte Form of Consolidate Header
36
4.5 Three-Byte Form of Consolidate Header
37
4.6 Target Address
38
4.7 Secondary Address Byte Format
40
5.1 Diagnostic Trouble Code
48
6.1 Data Transfer from Physical Layer to the Application Layer
56
6.2 Data Transfer from Application Layer to Physical Layer
58
6.3 Flowchart of Application Layer
60
6.4 Description of the Readiness Test
61
6.5 Display of Diagnostic Trouble Codes
62
6.6 Display of Current Data Form
63
7.1 Scan Tool Data Link Interface
66
7.2 Display of DTCs on the Scan Tool
67
7.3 Freeze Frame Data Display
68
7.4 The Data Captured from the Scan Tool
69
ix
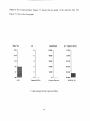
7.5 Bar Graph of the Captured Data
^^
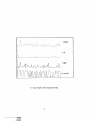
7.6 Line Graph of the Captured Data
'
—
r
^ - -
--
.-^-^
---•*
CHAPTER I
INTRODUCTION
1.1 Introduction
As the quality of air is decreasing in urban areas, state and national regulatory
agencies are passing more stringent automobile emission standards. California is the first
state to take serious action with regard to automobile emissions and fuel consumption.
The California Code of Regulations (CCR) has developed an enhanced inspection and
maintenance (I&M) program (commonly referred to as smog check II) that was to be
implemented in the 1996 calendar year. All 1996 and later model year passenger cars,
light and medium-duty trucks sold in California have to be equipped with an On-Board
Diagnostic (OBD-II) system.
The EPA (Environmental Protection Agency) updated the California OBD II
requirements for federal OBD II compliance demonstration. This system is designed to
monitor critical emission related components and activate a IVIIL (Malfunction Indicator
Light), when a failure or a drift in calibration is likely to cause emissions to exceed 1.5
times the vehicle certification standards [1].
With the increasingly complex electronic systems on new vehicles, it is becoming
more difficult to repair and maintain the vehicles. Therefore the SAE Vehicle E/E System
Diagnostic committee was formed to increase customer satisfaction and lower product
life cycle costs by investigating and recommending "standards" that will more effectively
diagnosis vehicle electrical and electronic system problems.
The OBD-II regulations define diagnostic functions to be supported by the vehicle
and functions to be supported by the test equipment that interfaces with the vehicle
diagnostic functions. Ranges of test equipment fi-om a handheld scan tool, to a PC based
diagnostic computer can be used to perform the required interface support function.
1.2 Diagnostic tool
Maintaining the microprocessor-equipped car is made easier because the ECM
(Electronic Control Module) through the OBD II standards aids in maintenance by telling
(or at least giving a good hint) the automobile mechanic, what is wrong with the car.
Before scan tools to read the OBD II data were built, many crude methods were
implemented to find the fault when the MIL was illuminated.
One of the methods of detecting a problem is by simply connecting two pins in
the under dash diagnostic connector, which puts the EMC in the in service mode. Then
the MIT, blinks at a rate that can be referenced to the error the controller found. For
instance, a malfunctioning exhaust gas recirculation valve (EGR) give a trouble code 32
and the MIL starts to blink in a flash-flash-flash-pause-flash-flash rate. To know the
malfunction, the user has to refer to a huge manual, which describes how to interpret the
code [2].
In another method, a normal PC is connected a to the diagnostic connector and the
PC runs special written diagnostic software. The PC then communicates with the onboard computer and depending on the model and type of the car-computer, the PC can
capture records in a rate varying from one per two seconds up to 20 records per second.
These records contain momentary data fields, filled by information on all the sensors and
actuators on the car. The data can be to logged and graphed for fiature use. The data is a
very valuable aid in trouble shooting and trend tracking. However, most of the PC
programs available can only be used with a specific make of automobile, they are not
universal [2].
To avoid these inconveniences of counting the number of times the MIL blinks or
connecting a PC to the diagnostic connector, small hand held tools were developed.
These small hand held tools when connected to the diagnostic connector to display the
diagnostic trouble code, which consists of an alphanumeric designator, followed by three
digits. These primitive scan tools could not describe the diagnostic trouble code,
consequently ordinary people could not figure out the problem without consulting the
thick manual. Scan tools designed in the early days could support only few makes and
models of automobiles. Therefore, the service technician was supposed to possess a
specific scan tool for each vehicle he repaired from a different manufacturer.
As a result, there was a risks of a new monopoly of maintenance and repair by
manufacturer approved dealerships. This would severely limit the freedom of choice of
consumers. There could be a sharp increase in the cost of vehicle maintenance and repair.
Roadside rescue organization and independent garages would be unable to repair a wide
range of relatively simple faults [3].
1 • 3 Statement of the problem
Under the safety inspection program, operated by the Texas Department of Public
Safety, all vehicles are tested annually at a test-and-repair or test-only facility using
TNRCC certified test equipment (TX96). The Texas Motorist's Choice Emissions
Testing Program, which is part of the annual safety inspection program in the three
geographical areas of Texas (core program counties: Harris, Dallas, Tarrant, and El Paso)
includes OBD II testing. The diagnostic requirements based on Title 13, California Code
of Regulations, section 1968.1 [6] are designated as OBD II with a goal of monitoring all
of the emission related components on-board the vehicle for proper operation. To
implement the OBD II testing, a OBD II test equipment was required to interface with the
on-board diagnostics system for receiving and downloading emission related data and
transmit this data to the TX96 equipment for communication with the Texas Data Link
system.
This project deals with the design of an OBD II test equipment, which is
Universal and that, can be used to test any car that supports the On-Board Diagnosticss II
protocol. This project was funded in part by the Mobile Source Division of the TNRCC
(Texas Natural Resource Conservation commission). An attempt has been made to design
a Universal scan tool, which can diagnosis any problem with any vehicle equipped with
an on-board diagnostic (OBD II) system. In addition to the functions of Universal scan
tool, this system should be able to interface with the PC, so that the required data can be
captured and used for future reference. The data transfer should enable the transfer of
both the stored data in the tester and the real time data (when the engine is running) to the
PC. This stored data can be used to build a database for all the cars in Texas when they
are operating correctly and when there is a problem. This stored data can then be
retrieved to compare with current data from the vehicle during the inspection and testing.
With the interface of this system to the internal network supported by TMCP (Texas
Motorist's Choice Emissions), the Texas government can implement it as a part of state's
vehicle emissions testing program.
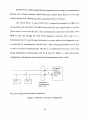
The OBD-II Scan tool is any test equipment that meets the requirements of the
SAE J1978 JUN 94-document [4]. The OBD E scan tool can be divided into three parts,
the Physical layer, the Data link layer and the Application layer. Various layers of
implementation are shown in Figure 1.1. The application and data link layers are software
part of the project and Physical layer is the hardware part. Each layer is described in
Chapter 3.
Application Layer
IzData link Layer
I
Physical Layer
Figure 1.1 Basic Block Diagram of Scan Tool.
The OBD II scan tool must be able to communicate with the vehicle control
modules using the prescribed communication interfaces. There are three types of
communication interfaces that are used to access the OBD II ftinctions for a given
vehicle, but only one is allowed in any one vehicle. The interfaces are (1) SAE J1850
41.6 Kbps PWM, (2) SAE J1850 10.4 Kbps VPW and (3) ISO 9141-2. In this project
only two protocols (SAE J1850 41.6 Kbps PWM, SAE J1850 10.4 Kbps) have been
implemented.
The aim of this thesis is to develop a PC-based universal, on-board diagnostic scan
tool, which can be used to test any vehicle, which supports OBD E. The test equipment
must also be able to store diagnostic data for fiirther reference and records and interface
to other PC programs. The basic functions which the OBD II scan tool is required to
support or provide include:
•
Automatic hands-off determination of the communication interfaced used.
•
Obtaining and displaying the status and resuhs of vehicle on-board diagnostic
evaluations.
•
Obtaining and displaying OBD II emission-related diagnostic trouble codes as
defined in SAE J2012 JUL96.
•
Obtaining and displaying OBD II emission-related current data.
•
Obtaining and displaying OBD II emissions-related freeze frame data.
•
Clearing the storage of OBD II emissions-related diagnostic trouble codes, OBD II
emissions-related freeze frame data storage and OBD II emissions-related diagnostics
test status.
•
Obtaining and displaying OBD II emissions-related test parameters and results as
described as described in SAE J1979.
•
Provide user manual/or help facility.
The data link layer of the Universal scan tool designed in this project was
implemented using "C" code and the Application layer of the Universal scan tool
designed in this project was implemented using Visual Basic code. The code is included
in Appendix.
The next chapter will provide an insight into what OBDII is and its background.
Chapter 3 explains the protocols and communication network used. Chapter 4 describes
the data link layer. Chapter 5 deals with the standard display format and the test modes.
Implementation of the Universal scan tool is described in Chapter 6. The final chapter
provides results and conclusions, and also suggests further improvements.
CHAPTER 2
ON-BOARD DIAGNOSTIC SYSTEMS
2.1 Introduction
The on-board diagnostic system is like any diagnostic system used to detect
malfunctions in the automobile. The on-board diagnostic system reduces the time
between the occurrence of a malfunction and its detection and repair. This will not only
reduce emissions caused by a malfunction but will minimize consequential damage to
other vehicle components or systems.
Virtually all current motor vehicle emission control systems are integrated into a
broad microprocessor-based power train management controller. By incorporating
additional software to analyze data already available to the controller, and with the
addition of only a few electronic hardware components for providing additional
information, an on-board diagnostic system can be developed to monitor the entire
emission control system. When a malfunction is detected, the on-board diagnostic system
notifies the driver by illuminating a Malfunction Indication Light (MIL) on the
instrument panel. A code identifying the likely area of the malfunction is also stored in
memory.
On-board diagnostic regulations were originally adopted in California in 1985 for
1988 and later light- and medium-duty vehicles equipped with three-way catalysts and
feedback fuel control systems. This regulation is now known as OBD 1 and was
developed because the increasing use of sophisticated electronic emission and power
train control systems made it increasingly difficuh for technicians to detect defective
8
fWSSJBRv
components. OBD I was seen as a promising mechanism for quickly identifying faulty
electronic-based emission control system components in California's Smog Check
Program.
In OBD II, the ARB (Air Resources Board) broadened the scope of OBD I by
increasing the number of components and systems to be monitored by the system. When
OBD I was adopted, technology did not exist or had not been identified to monitor some
of the components now contained in OBD II, such as, the catalyst and evaporative control
system monitoring. OBD II requires that virtually every emission control system and
electronic emission-related power train component be monitored. In addition to the
foregoing, OBD II systems also require the detection of engine misfire.
The underlying principle behind OBD II is that most malfunctions should be
detected when the performance of a component or system deteriorates to the point that
the vehicle's emissions exceed a threshold value tied to the applicable emission standard.
This is in contrast to detecting malfunctions when the component or system is simply no
longer functioning. Under the OBD II approach, the vehicle operator is notified, at the
time the vehicle begins to marginally exceed emission standards. The regulation, as
adopted, is specific regarding when the vehicle operator must be notified via the MIL to
ensure prompt notification.
In OBD II, the ARB (Air Resources Board) also required that additional
information be provided to technicians for diagnosis and repair of emission-related
problems. OBD II systems are required to use new standardized on-board vehicle
communication systems to provide service technicians with detailed information about
system performance and detected malfunctions. This information includes stored fault
^
codes that will lead technicians to the likely area of the malfunction, and continuousK
updated information for some engine parameters to help them isolate the specific fault
The communication systems are to provide all of this information in a standardized
format through a communication link similar to a telephone line. Specifications for this
link have been developed by the Society of Automotive Engineers (SAE). The SAE has
also developed specifications for a low-cost, hand-held diagnostic scan tool that will be
capable of communicating with all vehicle makes and models equipped with OBD II
systems. Consequently, service centers will be able to access on-board diagnostic
information without having to buy a separate piece of diagnostic equipment for every
make of vehicle they service [5].
2.2 California Code of Regulations (CCR)
California is a pioneer in setting up automobile emission standards. The
California Code of Regulations (CCR) includes an enhanced inspection and maintenance
(I&M) program (commonly referred to as smog check II) to be implemented with 1996
calendar year. This program includes the On-Board Diagnostic (OBD-II) system [1].
Section 1968.1 of Title 13, California Code of Regulations (CCR), entitled
"Malfunction and Diagnostic System Requirements—1994 and Subsequent Model-Year
Passenger Cars, Light-Duty Trucks, and Medium-Duty Vehicles and Engines" (OBD II),
was adopted by the Air Resources Board on September 14, 1989. The regulation requires
manufacturers to implement new comprehensive on-board diagnostic systems, replacing
the original on-board diagnostic requirements (OBD I) found in Title 13 CCR, Section
1968, beginning with the 1994 model year [5].
10
The on-board diagnostic system requires, monitoring of engine misfire, catalysts,
oxygen sensors, evaporative systems, exhaust gas recirculation, secondary air systems,
fuel systems, and all electronic power train components that can affect emissions when
malfunctioning. The regulation also requires OBD II systems to provide specific
diagnostic information in a standardized format through a standardized serial data link
on-board the vehicle [6].
Some amendments were made so that the US EPA could also adopt the OBD II
implemented by CCR. The proposed amendments are to clarify the MIL illumination
requirements for misfire detection and to avoid tempering resistance in the OBD II
requirements.
2.3 Environment Protection Agency (EPA)
The mission of the U.S. Environmental Protection Agency is to protect human
health and to safeguard the natural environment—air, water, and land—upon which life
depends [7].
Environmental protection is an integral consideration in U.S. policies concerning
natural resources, human health, economic growth, energy, transportation, agriculture,
industry, and international trade, and these factors are similarly considered in establishing
environmental policy [7].
In 1970, the nation passed the Clean Air Act in response to the growing
recognition that our air was potentially unhealthy. The Clean Air Act quickly eliminated
the most egregious sources of air pollution. In addition, the law put in place heahh-based
standards to protect our right to breathe clean air. All across the country, improvement in
11
air quality is regarded as one of the most important environmental achievements of the
last quarter century [8].
2.3.1
Clean air act
The Clean Air Act of 1970 set a national goal of clean air for all. It established the
first specific responsibilities for government and private industry to reduce emissions
from vehicles, factories, and other pollution sources. In many ways, the far-reaching law
has been a great success. Today's cars, for example, typically emit 70 to 90 percent less
pollution over their lifetimes than their 1970 counterparts.
In 1990, Congress and the Administration amended and updated the Clean Air
Act for the first time since 1977, considering the new pollution sources and unrecognized
threats such as global warming, acid rain and air toxins. The new Clean Air Act
strengthens components of the earlier law. The tailpipe standards for cars, buses, and
trucks have been tightened, and Inspection and Maintenance (I&M) programs have been
expanded to include more areas and allow for more stringent tests [9].
The 1990 law also introduces several entirely new concepts with regard to
reducing motor vehicle-related air pollution like alternative fuels. For the first time, fuel
is considered along with vehicle technology as a potential source of emission reductions.
And more attention is focused on reducing the growth in vehicle travel.
The Inspection and Maintenance (I&M) program is made more stringent by
including on-board diagnostics. The EPA published a final rule (61 FR 45898), an
updated version of the California OBD II requirements, acceptable for federal OBD
compliance. This action also amended the federal OBD requirements to harmonize with
12
those of the California OBD E requirements for 1999 and later model year light-dut\
vehicles (LDVs) and light-duty trucks (LDTs). This will result in federal OBD
malfunction thresholds consistent with the California OBD II thresholds, and it will
require monitoring of all emission-related power train components similar to the
California OBD II regulations. The EPA believes that this harmonization is consistent
with the requirements of section 202(m) of the CAA and will not compromise the
stringency of the federal OBD program [10]. The on-board diagnostic test standards, test
procedures, test report and test equipment requirements are discussed here as in clean Air
act [10].
2.4 On-board diagnostics test standards
The on-board diagnostics test standards are defined in the section 85.220585.2206 in the clean air act [10].
1.
Beginning January 1,2000, failure of the on-board diagnostic test shall be a basis
for failure of the Inspection and Maintenance (I&M) test. Prior to this date, it may be a
basis for failure of the Inspection and Maintenance (I&M) test, but it is not mandatory.
2.
A vehicle may fail the on-board diagnostics test if it is a 1996 or newer vehicle
and the vehicle connector is missing, has been tampered with, or is otherwise inoperable.
3.
A vehicle may fail the on-board diagnostics test if the malfunction indicator light
is commanded to be illuminated according to visual inspection.
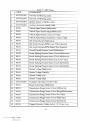
4.
A vehicle may fail the on-board diagnostics test if the malfianction indicator light
is commanded to be illuminated and any of the following OBD codes are present. The
codes are given in Table 2.1.
13
CODE
Table 2.1 OBD Codes.
COMPONENT
1
ANYPXIXX
Fuel and Air Metering codes.
2
ANYPX2XX
Fuel and Air Metering codes.
3
ANYPX3XX
Ignition System or Misfire codes.
4
ANYPX4XX
Auxiliary Emission control codes.
5
P0500
Vehicle Speed Sensor Malfunction.
6
P0501
Vehicle Speed Sensor Range/Malfunction
7
P0502
Vehicle Speed Sensor Circuit Low Input
8
P0503
Vehicle Speed Sensor Intermittent / erratic / High.
9
P0505
Idle Control System Malfunction.
10
P0506
Idle Control System RPM Lower Then Expected.
11
P0507
Idle Control System RPM Higher Then Expected.
12
P0510
Closed Throttle Position Switch Malfunction.
13
P0550
Power Steering Pressure Sensor Circuit Malfunction.
14
P0551
Power Steering Pressure Sensor Circuit Malfunction
15
P0552
Power Steering Pressure Sensor Circuit Low Input.
16
P0553
Power Steering Pressure Sensor Circuit Intermittent
17
P0554
Power Steering Pressure Sensor Circuit Intermittent
18
P0560
System Voltage Malfunction.
19
P0561
System Vohage Unstable.
20
P0562
System Voltage Low.
21
P0563
System Vohage High.
22
ANYPX6XX
Computer and output Circuits Codes.
23
P0703
Break Switch Input Malfunction.
24
P0705
Transmission Range Sensor Circuit Malfunction.
25
P0706
Transmission Range Sensor Circuit Range/Performance.
26
P0707
Transmission Range Sensor Circuit Low Input.
27
P0708
Transmission Range Sensor Circuit High Input.
28
P0709
Transmission Range Sensor Circuit Intermittent.
29
P0719
Torque Converter / Brake Switch " B" Circuit Low.
14
.iJ'-..'-JV
CODE
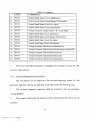
Table 2.1 Continued
COMPONENT
30
P0720
Output Speed Sensor Circuit Malfunction.
31
P0721
Output Speed Sensor Circuit Range / Performance.
32
P0722
Output Speed Sensor Circuit No Signal.
33
P0723
Output Speed Sensor Circuit Intermittent.
34
P0724
Torque Converter / Brake Switch " B" Circuit High.
35
P0725
Engine Speed Input Circuit malfianction.
36
P0726
Engine Speed Input Circuit Range / Performance
37
P0727
Engine Speed Input Circuit No Signal.
38
P0728
Engine Speed Input Circuit Intermittent.
39
P0740
Torque Converter Clutch System Malfunction.
40
P0741
Torque Converter Clutch System Performance or Stuck Off.
41
P0742
Torque Converter Clutch System Stuck On.
42
P0743
Torque Converter Clutch System Electrical.
43
P0744
Torque Converter Clutch Circuit intermittent.
5.
The list of codes shall be updated in conjugation with changes to section 40 CFR
86.094-17(h)(3)ofEPA.
2.4.1
On-board diagnostics test procedures
The test sequence for the inspector of the on-board diagnostics system on 1996
and newer light-duty vehicles and light-duty trucks shall consist the following steps:
1.
The on-board diagnostic inspection shall be conducted with key-on/engine-
running (KOER).
2.
The inspector shall locate the vehicle connector and plug the test system into the
connector.
15
"^
3.
The test system shall send a Mode $01, PID $01 request to determine the
evaluation status of the vehicle's on-board diagnostic system. The test system shall
determine what monitors are supported by the on-board diagnostic system, and the
readiness evaluation for applicable monitors accordance with SAE J1979. Beginning
January 1, 2000, if the readiness evaluation indicates that any on-board tests are not
complete, the customer shall be instructed to return after the vehicle has been run under
conditions that allows completion of all applicable on-board tests. If the readiness
evaluation again indicates that any on-board test is not complete, the vehicle shall be
failed.
4.
The test system shall evaluate the malfunction indicator light status bit and record
status information in the vehicle test record.
a. If the malfunction indicator status bit indicates that the malfunction indicator light
has been commanded to be illuminated, the test shall send a Mode $03 request to
determine the stored emission related power train trouble codes. The system shall
repeat this cycle until the number of codes reported equals the number of
expected based on the Mode 1 response. If any of the codes given above are
present, they shall be recorded in the vehicle test record and the vehicle shall fail
the on-board diagnostic inspection.
b. If the malfunction indicator light bit is not commanded to be illuminated, the
vehicle shall pass the on-board diagnostic inspection even if the OBD codes are
present.
c. If the malfunction indicator light bit is commanded to be illuminated, the
inspector shall visually inspect the malfunction indicator light to determine if it is
16
illuminated. If the malfimction light is commanded to be illuminated but is not,
the vehicle shall fail the on-board diagnostic inspection.
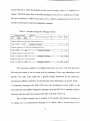
2.4.2
On-board diagnostics test report
The results of the inspection or the test report after a vehicle is inspected is
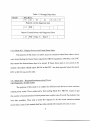
interpreted in the following ways.
1. A motorist whose vehicle fails the on-board diagnostic test shall be provided with
On-board diagnostic test resuhs, including the codes retrieved the status of the MIL
illumination command, and the customer alert statement.
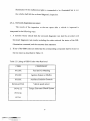
2. If any of the OBD codes are retrieved, the corresponding component shall be listed on
the test report as described in Table 2.2.
Table 2.2 Listing of OBD Codes when Retrieved
CODE
COMPONENT
PXIXX
Fuel and Air Metering
PX3XX
Ignition System or Msfire
PX4XX
Auxiliary Emission Controls
P0500&P0501
Vehicle speed sensor
P0742 &
Torque Converter Clutch System
P0743 &
P0744
17
_^' 'LBMil
^^
3. In addition to any codes that are retrieved, the test report shall include the following
language:
Your vehicle's computerized self-diagnostic system (OBD) registered the fault(s) listed
below. This fault(s) is probably an indication of malfianction of an emission component.
However, multiple and/or seemingly unrelated faults may be an indication of an emission
related
problem inai
that occurrea
occurred previously
previously but
upon turtner
further evaluation
evaluation by
the \Jtiu
OBD sysiem
system
su piuuiem
out upon
oy tne
was determined only to be temporary. Therefore, proper diagnosis by a qualified
technician is required to positively identify the source of any emission-related problem.
2.4.3
On-board diagnostics test equipment requirements
The basic requirements of the scan tool or the OBD II test equipment are:
1.
The test system interface to the vehicle shall include a plug that confirms to SAE
J1962 "Diagnostic connector."
2.
The test system shall be capable of communicating via the J1962 connector with a
vehicle certified as complying with on-board diagnostic requirements.
3.
The test system shall be capable of checking for the monitors supported by the
on-board diagnostic system and the evaluation status of supported monitors in Mode $01
PED $01, as well as be able to request the diagnostic trouble codes, as specified in SAE J
1997. In addition, the system shall have the capability to include bi-directional
communication for control of the evaporative canister vent solenoid.
4.
The test system shall automatically make a pass, fail or reject decision.
18
^v
2.5 Technical Status and Proposed Monitoring System .Amendments-IV
2.5.1 Catalyst Monitoring
Emission control systems on virtually all new California \ chicles include threeway catalysts. These catalysts consist of ceramic or metal honeycomb structures coated
with precious metals such as platinum, palladium, or rhodium. Three-way catalysts are
so-designated because they are capable of simuhaneously oxidizing HC and carbon
monoxide (CO) emissions into water and carbon dioxide (CO2), and of reducing oxides
of nitrogen (NOx) emissions (by reacting with CO and hydrogen) into elemental
nitrogen, CO2, and water.
Oxygen storage can be used as an indicator of catalyst performance,
discriminating between catalysts with sufficient and insufficient oxygen storage
capability. In addition to being used for catalyst monitoring, the rear sensor can be used
to monitor and correct for front oxygen sensor aging as needed to maintain the
stochiometric air-fuel mixture at high mileage. With a properly functioning catalyst, the
rear oxygen sensor signal will be fairly steady since the fluctuating oxygen concentration
(due to the fuel system cycling about stoichiometric) at the inlet of the catalyst is damped
by the storage and release of oxygen in the catalyst. When a catalyst deteriorates,
damping is reduced, causing the frequency and peak-to-peak vohage of the rear oxygen
sensor to approximate the signal from the oxygen sensor before the catalyst.
The OBD II regulation currently requires manufacturers to identify a malfianction
on low emission vehicles when the catalyst system has deteriorated to the point that
tailpipe emissions exceed 1.5 times the applicable HC standard.
Manufacturers are
required to phase-in use of this malfunction criterion for low emission \ chicles on 30
19
~\
percent of the 1998 model year vehicles, 60 percent of the 1999 model year vehicles, and
100 percent of the 2000 model year vehicles.
Most manufacturers have worked to develop strategies that monitor the oxygen
storage capability of the front portion of the catalyst system. Factors that manufacturers
have considered in selecting the correct front volume include the configuration of the
catalyst system, washcoat formulation, engine-out emission level, and others. According
to manufacturers, a higher amount of variability exists with the catalyst monitor than with
other OBD II monitors due to catalyst manufacturing processes, vehicle production
tolerances, fiael quality, and variability in real world driving patterns.
The malfianction
criterion must be selected such that all vehicles will identify a catalyst malfunction before
the tailpipe emission level exceeds 1.5 times the standard. Manufacturers have stated that
the wide distribution of monitoring system results caused by this variability may result in
a malfunction indication at tailpipe emission levels below the standards on a percentage
of vehicles.
Manufacturers have requested the ARB to accept catalyst-monitoring strategies
that operate over the "Unified Cycle" instead of over the Federal Test Procedure (FTP)
cycle that the current regulation requires. The Unified Cycle was developed by the ARB
for emission inventory purposes, and contains more high speed and load driving
conditions than the FTP cycle. The expanded speed and load regions on unified cycle
would better facilitate reliable monitoring due to the higher exhaust flow rates and
catalyst temperatures.
Increasing the malfunction criterion to 1.75 times the HC standard should allow
manufacturers to, on average, indicate a catalyst malfimction still very close to 1.5 times
20
the standard, but without the MIL illuminating below the emission standards on some
vehicles.
A provision was provided in the OBD II regulation to allow (with Executive
Officer approval) manufacturers to use the Unified Cycle as an option to the FTP cycle
for demonstrafion of monitoring system performance. The Unified Cycle was developed
by the ARB to represent real world driving and quantify in-use vehicle emission levels.
This provision would allow manufacturers greater flexibility in designing monitoring
strategies without diminishing the frequency with which the monitor executes during
typical driving. Because this flexibility may be useful for other monitoring requirements,
the provision would not be limited to just catalyst monitoring.
Manufacturers
demonstrating a specific need for a particular monitor would be allowed to use the
Unified Cycle for demonstration and monitoring purposes.
2.5.2
Misfire monitoring
The OBD II requirements presently include monitoring for proper combustion in
each engine cylinder to ensure that misfiring does not contribute either to excess
emissions or to catalyst damage because of overheating. The OBD II system has to
identify the cylinder or cylinders that are misfiring under most condifions. During the
initial phase-in of OBD II requirements for 1994 through 1996 models, manufacturers
were only required to monitor for misfire over the engine operating conditions
encountered during the FTP test. Beginning with the 1997 models, however, all but
small volume manufacturers are required to phase-in misfire detection over nearly the
21
entire engine operafing range. Misfire causing catalyst damage will generally be detected
in less than a minute, and lower levels of misfire will still be detected within two trips
Sometimes misfires can occur temporary due to poor fuel quality, unusual
ambient condifions, or other causes. So the current OBD E MIL illumination
requirements may need some revision to delay illuminating the ME. until misfire is more
repeatable than under the current requirements. The primary misfire patterns for which
detection is most important are random misfire, single cylinder confinuous misfire, and
paired cylinder misfire.
2.5.3
Evaporative System Monitoring
The OBD E regulation requires manufacturers through the 1999 model year to
monitor the evaporative system for leaks equal or greater in magnitude than a 0.040-inch
diameter hole.
With the 2000 model year, manufacturers must begin to phase-in
monitoring for small leaks equal or greater in magnitude than a 0.020-inch diameter hole.
The requirements were developed in response to data indicating that small system leaks
can cause evaporative emissions to exceed 30 grams per test (over 15 times the standard)
on the 105 degree Fahrenheit test procedure.
An OBD II system shall monitor the proper operation of the evaporative system
by checking the function of its electromechanical components and by checking the flow
of hydrocarbon vapors from the canister to the engine. Manufacturers are complying with
the current leak detecfion requirements using monitoring techniques that create either a
vacuum or a pressurized condition in the ftiel tank and evaporative system. The pressure
inside the system is monitored over an interval of fime. If the pressure or \ acuum
22
changes toward ambient at a significant rate, a leak is considered to be present. If the
pressure or vacuum holds reasonably steady, the system is considered leak free.
Manufacturers can be exempted from detecting small leak sizes if they provide
sufficiently reliable data demonstrafing that evaporafive emissions will not exceed 1.5
fimes the applicable standards. For those system designs for which a larger emission
impact would resuh from small leaks, the requirements would remain unchanged.
To meet the evaporative system requirements on some vehicles with specific
types of fuel tank designs, steel tanks can be replaced by plastic fiael tanks These tanks
are generally more flexible than steel tanks, possibly causing some slight deformation
when pressure or vacuum is applied. Although slight, the manufacturers indicate that the
deformation may change the pressure in the tank sufficiently to aher the results of the
monitoring system and possibly cause false malfunction detections. The manufacturers
have stated that they are making modifications to strengthen the tank walls to resolve
false malfunction detection concerns.
2.5.4
Positive Crankcase Ventilation (PCV) System Monitoring
Currently, the OBD II regulation does not contain specific monitoring
requirements for the detection of PCV system failures. Additionally, monitoring of the
PCV system is not required under the comprehensive component monitoring section of
the regulation because such systems generally do not use electronic components.
Nonetheless, certain failure modes of the PCV system can cause a substantial increase in
emissions by venting crankcase hydrocarbon emissions directly to the atmosphere. To
23
take care of these excess in-use emissions, a PCV system-monitoring requirement is
added to the OBD II regulation.
Drawing air and fuel into the cylinder, compressing the mixture with a piston, and
then igniting the mixture achieve combustion in each of the cylinder.
After the
combusfion event, the mixture is exhausted from the cylinder with another stroke of the
piston. However, during the combustion process, exhaust gases can escape past the
piston into the crankcase. The PCV system is then used to remove these gases (known as
"blow-by") from the crankcase and directs them to the intake manifold to be burned by
the engine. Before the introduction of PCV systems in the early 1960's, these vapors were
vented to the atmosphere.
The U.S. EPA's Mobile5a emission model quantifies these emissions at 1.2 grams
per mile (g/mi) hydrocarbons (HC). While the percentage of PCV failures causing high
emissions appears to be small (one percent of the vehicles tested), the total emissions
from tampered and improperly serviced PCV systems would raise the 2003 fleet average
standard of 0.062 g/mi HC by 0.012 g/mi, or nearly 20 percent. So the proposed
amendment would only require the detection of a disconnection in the system between
both the crankcase and the PCV valve or between the PCV valve and the intake manifold.
Because disconnections between the valve and the intake manifold will resuh in a
significant intake air leak, effective monitoring should be readily achievable through the
existing monitoring strategies for the idle air control system or the fiael system.
24
CHAPTER 3
PROTOCOL/INTERFACE
3.1 Introduction
There are three types of communication interfaces to access the OBD II fianctions
in a given vehicle. They are SAE J1850 41.6 Kbps PWM, SAE j 1850 10.4 Kbps VPW
and ISO 9141-2, of which only one can be used in any one vehicle to access all supported
OBD II fiincfions.
3.2 Class B Data Communication Network Interface- J1850
The SAE standard establishes the requirements for
a Class B Data
Communication Network Interface applicable to aU on- and off-road land-based vehicles.
It defines the minimum set of data communication requirements such that the resuhing
network is cost effective for simple applications and flexible enough to use in complex
applications.
Two specific implementations of this network are described based on the Physical
layer differences. One Physical layer is opfimized for a data rate of 10.4Kbps, while the
other Physical layer is opfimized for a data rate of 43.6Kbps. Depending on the specific
application and corporate philosophy towards network usage, a manufacturer can
implement either of the protocols.
25
3.2.1 Network Archhecture Support
It IS the intent of this network to interconnect different electric modules on the
vehicle using an "Open Architecture" approach. An open architecture network is one in
which the addhion or delefion of one or more modules (data nodes) has minimal
hardware and/or software impact on the remaining modules.
In order to support an open architecture approach, the Class B network utilizes the
concept of Carrier Sense Muhiple Access (CSMA) with nondestructive contention
resolution. Additionally this network supports the prioritization of frames such that, in
the case of contenfion, the higher priority frames will always win arbitration and be
completed [11].
3.2.2 Data Bus Topology
Data bus topology is the map of physical connections of the data bus nodes to the
data bus. It includes all nodes and data buses involved in the data bus integration of the
vehicle. A single-level bus topology, the simplest topology, is currently being used in
several automotive applications. The redundancy requirements of a particular application
may require a single-level topology to be implemented using multiple interconnecting
cables operating in various modes (active or passive). However, the requirement to use
multiple buses for redundancy purposes does not change the single-level bus topology
definition if the following criteria are maintained:
1. All nodes/devices transmit and receive from a single path.
2. All nodes/devices receive all frames at the same fime.
3. Communication on each data bus is identical.
26
3.2.3 Data Bus Control
Although various methods of data bus control can be used, this Class B network is
intended for "mastedess" bus control. The principal advantage of the masteriess bus
control concept is its ability to provide the basis for an open-architecture data
communications system. Since a master does not exist, each node has an equal
opportunity to initiate a data transmission once an idle bus has been detected. However,
not all nodes and/or data are of equal importance, prioritization of frames is allowed and
the highest priority frame will always be completed. This also implies that frame/data
contention will not resuh in lost data. Two disadvantages of the masteriess bus concept
are that the data latency cannot be guaranteed, except for the single highest system
priority frame, and bus utilization extremes are difficuh to evaluate [11].
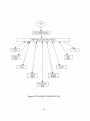
3.3 ISO 9141-2: 1994(E) Road Vehicles- Diagnosfic SystemsCRAB Requirements for Interchange of Digital Information
ISO (The International Organization for Standardization) is a worldwide
federation of national standard bodies who work for preparing Intemational Standards
[12]. The ISO 9141-2 describes the physical and data link layer of a vehicle serial
diagnosfic bus. The specifications of the protocol are:
1. The maximum sink current be supported by the OBD-II Scan Tool is 100mA.
2. The range for all tests preformed relative to ISO 7637is -1.0 to +40.OV.
3. The minimum bus idle period before the tool transmhs an address shall be 300ms.
27
The ISO 9141-2 protocol specifies the requirements for setting up communication
between the on-board emission related Electronic Control Units (ECUs) of the road
vehicles and the SAE OBD II scan tool as specified in SAE J 1978 [22].
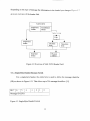
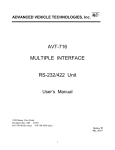
The vehicle ECUs, in case of ISO 9141-2 protocol are required by OBD 11 to
communicate with the SAE J1978 OBD E scan tool [22] must support either a one-line
(K line only) or a two-wire (K and L line) communication connecfion to the SAE J 1978
OBD II scan tool through the SAE J1962 diagnostic connector [25]. Line K is a
bidirectional line. It is used during initialization to convey address from diagnostic tester
to vehicle ECUs, simuhaneously whh the line L. After conveying the address, the K line
is used to convey bi-direcfional data. The line L is unidirecfional line and is only used
during imtialization simuhaneously with the K line [13]. Figure 3.1 shows the system
configuration indicating the role of each of the communication lines L and K.
O
K
O <
^
Diagnoshc
tester in
accordance
with SAE J
• 1978
ECU 2
Connector in
accordance with
SAE J 1962
The arrows indicate the direction of data flow.
Figure 3.1 ISO 9141-2 System Configurafion
28
The OBD II emission-related communications consist of messages of between 5
and 11 bytes. The sequence and descripfion of all the bytes except the error checking b\^e
is the same as that in the SAE J 1850 protocol. Each of these bytes is described in
Chapter 4. Instead of CRC (Cyclic Redundancy Check) as in SAE J1850 protocol, the
checker sum is used. The algorithm is described in detail in ISO 9141-2 protocol [13].
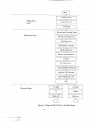
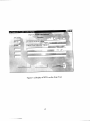
The Class B network maps into the OSI (ISO open System Interconnect) model as
described in the following paragraphs. The mapping of SAE J1850 to the ISO model is
shown in Figure 3.2.
3.3.1 Application Layer
At the top of the OSI reference model is the Application Layer.
This layer
establishes the relationship between application input and output devices, including what
is expected of human operators. This layer documents the high level description of the
fianction including control algorithms if appropriate.
3.3.2 Data Link Layer
The primary function of the Data Link Layer is to convert bhs and/or symbols to
validated error free frames or data. Typical services provided are serialization (parallel to
serial conversion) and clock recovery or bh synchronization.
An important addhional
service provided by the Data Link Layer is error checking. When error are detected, they
may be corrected or higher layers may be nofified.
29
3.3.3 Physical Layer
The Physical Layer and hs associated wiring form the interconnecting path for
information transfer between Data Link Layers. Typical Layer protocol elements include
voltage and current levels, media impedance, and bit/symbol definhion and timing [14].
30
J1850
Standard Message
I
Application
Layer
Hardware or Software
As Needed
Physical and Functional Modes
I
Data Link Layer
Bit, Byte or message level
Non-Destructive
Determined b\ message
Idle Bus Detection
Bit-level synchronization
12 Bytes
Most Significant First
SOF,Data,EOD,NB,IFKEOF
Invahd bit.CRC,Stmcture
Ignore Message/No IFR
CRC
Physical Layer
10.4 Kbps
41.6Kbps
VPW
PWM
I
Single-wire
Dual-wire
Figure 3.2 Map of SAE J1850 to the ISO Model.
31
CHAPTER 4
DATA LINK LAYER
4.1 Introduction
The primary funcfion of the Data Link Layer is to convert bits and symbols to
validate error free frames. The Data Link Layer deals with the following attributes:
1. Addressing Strategy,
2. Network Access and Data Synchronization,
3. Frame Element and Structure,
4. Error Detection,
5. Error Response.
4.2 Addressing Strategy
Two types of addressing strategies are defined and can co-exist on this network.
They are physical addressing and functional addressing. In the case of physical
addressing, frames are exchanged only between two devices based on their Physical
address within the network. Each node has a unique address within the network. This
type of addressing strategy is used when the communications involve specific nodes and
not the others that may be on the network.
In the case of functional addressing, frames are transmitted between many devices
based on the function of the frame. A node is assigned with a set of functions and can be
located anywhere in the network. Here the function of the message is important not the
32
physical address of the node. The fiinctional addressing is intended for messages that ma>
be of interest to more than a single node.
4.3 Network Element and Structure
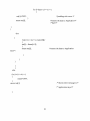
The general format of a message is:
Idle, SOF, DATAO,...., DATAN, CRC, EOD, NB, IFR_l, ., IFR_N, EOF, IFS, Idle:
The preceding acronyms are defined as follows:
Idle: Idle Bus (Occurs before SOF and after IFS)
SOF: Start of Frame
DATA: Data byte (each 8-bhs long)
EOD: end of data (only when IFR is used)
CRC: CRC error Detection Byte
NB: Normalization Bh (10.4Kbps only)
IFR: In-Frame Response Byte
EOF: End of frame
EFS: Inter-Frame Separation.
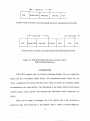
4.4 Class B Data Communication Network Message:
The general structure of SAE J 1850 message within-frame response and without
in-frame is shown in Figure 4.1.
33
<
SOF
SAE J2178
Header Field
Data Field
CRC b\1e
EOF
SCOPE OF SAE J2178 FOR A SAE J1850 FRAME WrTHOUT INFRAME RESPONSE(IFR)
-^
SOF
SAEJ2178
Header Field
•
Data Field
-^—SAEJ2178
CRC byte
EOD
IFR
—•
EOF
SCOPE OF SAE J2178 FOR A SAE J1850 FRAME WITH INFRAME RESPONSE
Figure 4.1 SAE J1850 Frame Structure with and without
IFR (In-Frame Response)
4.5 Header Field
SAE J1850 supports only two formats of message headers. They are single-byte
header and the consolidated header format. The consolidated header format has two
forms, a single-byte form and a three-byte form. These two forms of consolidate header
are idenfified by the value of H-bh. The informafion in the header field for both formats
contains target, source, priority and message type information and/or diagnostic test
modes.
There are two types of messages, one is the request, that is the command or
queries for data. The second one is the response, that is, reports or acknowledgment.
34
Depending on the type of message the informafion in the header byte changes Figure 4 2
gives an overview of the header field.
SAEJ1850
Single-Byte
Header
Consolidated
Header
7 6 5 4 3 2 10
H-bit
hOne-Byte
form
Three-B>1e
form
I
I
Data field
format
Physical
Address
Figure 4.2 Overview of SAE J1850 Header Field
4.5.1 Single-Byte Header Message Format
For a single-byte header, the entire byte is used to define the message identifier
(ID) as shown in Figure 4.31. This allows up to 256-message identifiers [15].
Bh7
0
Message ID (256)
Figure 4.3 Single-Byte Header Format
35
4.5.2 Consolidate Header Message Format
The consolidate header format includes both a one-byte form and a three-b\ie
form.
4.5.2.1 One-byte Form of consolidate Header Format
The one-byte form ufilizes 7 bhs from the message identifier, resuhing in 128
distinct Ids. The H-bh is always at logic "one"[15]. The one-byte form of the consolidate
header is shown in Figure 4.4.
Bh7
6
5
4
3
X
X
X
H=l
X
2
X
1
0
X
X
Message ID (128)
Figure 4.4
One-Byte Form of Consolidate Header
4.5.2.2 Three-byte form of the consolidate header format
The header byte ufilizes the first three bytes of the message. The H-bit of the first
b3^e is always at logic "0". The remaining seven bhs of the first byte contain information
about priority (PPP) and message type (KYZZ). The second byte contains the target
address informafion. The target can either be flmcfionally addressed or physically
addressed. The third byte contains the physical address of the source of the message. The
three-byte header is described in detail in Figure 4.5 and Table 4.1
36
Byte 1
Byte 2
Byte 3
Figure 8
Target address
Source address
Figure 4.5 Three-Byte form of Consolidate Header
Table 4.1 Description of Byte 1 of Three-Byte Consolidate Header
Bh7
6
5
4
3
2
1
0
P
P
P
H
K
Y
Z
z
Priority (0 to 7)
H=0
Bh
Definition
Value
Meaning
K
IN-FRAME RESPONSE (IFR)
0
IFR required
1
IFR Not allowed
0
Functional addressing
1
Physical addressing
Y
ZZ
Addressing Mode
Specific Message Type
00
01
Refer [17]
10
11
The priority field is three bhs in length and proceeds the header type (H) bit. The
priority bh assignments are manufacturer specific and are not assigned by S.AE The
37
priority "0" is the highest level of priority and priority "7 (111)" is the lowest level of
priority.
4.5.3 Target Address Bvte
The second byte of the three-byte form of the consolidate header format contains
either a functional or a physical target address. The physical and functional addresses are
found in SAE J2178/4 [16]. The "W" bh in the target address byte differenfiates between
the command target and status target. If "W" is "0" h signifies a Command target, if " 1 "
signifies a status target. Figure 4.6 describes the target address.
Bh7
6
5
4
3
2
1
0
X
X
X
X
X
X
X
w
Primary ID (128 pairs)
Figure 4.6 Target Address
4.5.4 Source address
The third byte of the three-byte format of the consolidate header format is the
physical address of the message. The physical assignments are available in SAE
J2178/l[18].
38
4.6 Data Field
The data or the data field refer to a field whhin a frame that may include bytes
with parameters pertaining to the message and/or secondary ID and/or extended
addresses and/or test modes which further define a particular message content being
exchanged over the network.
In both message header formats, single-byte and consolidated, the data field can
usually be encoded in the same way. There are different ways in which information can
be formatted in the data field. The data field immediately follows the header field. The
number of bytes in this field will vary, based upon the content of the header field. The
maximum data field length is limited by the requirements of SAE J1850. Because of
differences in functionally and physically addressed messages or within-frame response
data, these cases are defined separately.
4.6.1 Functional Data Field Formats
There are five different formats for functional data fields depending on the
number of data bytes and secondary address.
4.6.1.1 Funcfional Data Field Format O&l
There are no addhional bytes of data in case of data field with "0" format. It only
has header, CRC and IFR bytes. In case of Format " 1 " h includes data (only parametric
data). Used for message types 0 andl.
39
4.6.1.2 Functional Data Field Format 2
In this format, the data field contains a secondary address byte, which is used to
determine the target funcfion being addressed.
Bh7
6
5
Q
C
Secondary ID (6 bytes)
4
3
2
I
0
Functional Data Field Forms
Secondary address Byte
datal
data n
Figure 4.7 Secondary Address Byte Format
"Q" is the quality bh and "C" is the control bh used to distinguish between
request/report and query message operafions. The combinations of primary and
secondary addresses define whether addhional data is used by that message.
4.6.1.3 Functional Data Field Format 3
The data field format 3 message, depending on the primary and secondary ID,
also has an extended address byte. The extended address byte is used to determine where,
geographically on a vehicle, a particular funcfion is located.
40
4.6.1.4 Functional Data Field Format 4
The data field format 4 message, contains a byte which defines the diagnostic test
mode of the target function being addressed. The test mode byte is used to determine
which diagnostic function is involved [18,19].
4.7 In-Frame Response TIER)
For In-Frame Response, the response byte(s) are transmitted by the responders
and begin after EOD. If the first bh of the in-frame response byte does not occur at this
point and the bus remains passive for a period of time defined as EOF, then the originator
and all receivers must consider the frame complete. In-frame response bytes may take
one of the following forms:
1. None.
2. A single-byte transmitted from a single recipient, typically a unique identifier (ID) or
address.
3. Multiple bytes with a single-byte transmitted from each recipient. The effect is to
concatenate the individual response bytes into a response "stream."
The response
byte from each recipient must be unique, typically a physical address (ID n).
Arbitration takes place during the response process so that each recipient, if
arbitrafion is lost during hs response byte, will retransmit the single-byte until the
recipient observes hs unique byte in the response stream. Once a given recipient
observes hs own unique response byte, h disconfinues the transmission process to
allow any remaining responders to transmh their byte.
41
4. One or more data bytes, all from a single recipient. A CRC byte may be appended to
the data byte(s).
Even if In-frame response bytes are used, the overall frame/message length limit remains
in effect. The sum total of data bytes, CRC bytes, and in-frame response bytes shall not
exceed the frame length. (The maximum number of message bytes in a frame (i.e.,
excluding frame delimhers SOF, EOD, EOF and EFS) is 12 bytes [18].)
4.8 Cyclic Redundancv Check (CRC)
The CRC is required whh either of the header byte systems used. The method of
calculating and checking the CRC byte is defined as follows. An invalid CRC byte may
constitute a detected error.
1. The CRC calculation and the CRC checker shift registers (or memory locations) will
be located in the sender and receiver nodes, respectively, and shall be inhially set to
the "all ones" state during SOF. (The setting to "ones" prevents an "all zeros" CRC
byte with an all zero-data stream.)
2. All frame bhs that occur after SOF and before the CRC field are used to form the
Data Segment Polynomial, which is designated as D(X). For any given frame, this
number can be interpreted, as an "n-bit" binary constant, where n is equal to the
frame length, counted in bhs.
3. The CRC division polynomial is X^ + X^ + X^ + X^ + 1.
This polynomial is
designated as P(X).
4. The Remainder Polynomial R(X) is determined from the following Modulo 2 division
equation:
42
X^*D(X) + X" + X"-^+
+y"-^ = Q(X) + R(X)/P(X)
P(X)
NOTE: Q(X) is the quofient resuhing from the division process.
5. The CRC byte is made equal to R(X), where R(X) is the one's complement of R(X)
6. The Frame Polynomial M(X) that is transmitted is shown in Equation 2;
7. M(X) = X^ * D(X) + R(X)
8. The receiver checking process shifts the entire received frame, including the
transmitted CRC byte, through the CRC checker circuh. An error-free frame will
always resuh in the unique constant polynomial of X^ + X^ + X^ (C4 hex) in the
checker shift register regardless of the frame content.
When a CRC field protects In-Frame Response data, the previous rules are used to
define the CRC, except that the sender and receiver nodes are interchanged. The CRC
calculation only includes the in-frame response bytes. (Note that the SOF, EOD, EOF,
and NB are not used in the CRC calculation and serve as data delimhers.)
43
CHAPTER 5
STANDARD DISPLAY FORMAT
5.1 General Characteristics Display
The OBD II Scan Tool must be capable of displaying simuhaneously at least two
hems of OBD II emissions related current data hems, or OBD II emissions related
diagnostic trouble codes. A list of the OBD II emissions related current data and freeze
frame data hems, their parameter Ids, data resolufion and data conversion information,
unhs and display formats is provided in SAE J1979 [20]. The display units shall be the
Standard Intemafional (SI) and English unhs as specified in SAE J1979 [20].
The display of each OBD II emissions related current data or freeze frame data should
include the following:
1. Data value,
2. Data Parameter id or name,
3. The module id of the module that supplied the data.
As a minimum the data values of two data items must be displayed
simuhaneously. A display of the parameter Ids of the data hems and the Ids of the
modules that supplied the data hems must be easily accessible if not displayed whh the
data values.
The unhs of measure associated with the data items displayed must either be
displayed with the data values, easily accessible on another display, or otherwise readily
available to the user (e.g., on the tester body, as a part of the tester on a cheat sheet, etc.).
Having this informafion available in a user's manual separate from the body of the tool
44
does not safisfy this requirement. The display must be capable of showing alphanumeric
characters.
5.2 User Input
The OBD II Scan Tool must include some form of user input that would allow the
user to:
a. Select between the basic fianctions required by OBD II (i.e., display current
data, display freeze frame data, display trouble codes, clear emissions related
data, and display test parameters and resuhs.)
b. Select for simultaneous display at least two items of any one of the following:
1. OBD II emissions related current data.
2. OBD II emissions related diagnostic trouble codes.
3. OBD II emissions freeze frame data.
4. OBD II emissions related test parameters and results.
c. Verify a request to clear and/or reset OBD II emissions related diagnostic
information as defined by SAE J1979.
d. Enter and send Expanded Diagnostic Protocol messages.
5.3 Application layer
The Application layer implements the General characterisfic display described
above. This layer establishes the relationship between the application input and output
devices, including what is expected of human operators. This layer documents the high
label description of the function including control algorithms if appropriate. Application
45
layer implements the standard format of the data to be displayed [22]. The various modes
described below help in analyzing the request and response messages and their operation
The higher layer (Applicafion layer) sends a request message for a particular information
and gets the informafion from that particular node in the vehicle as response message.
5.4 Test Modes
5.4.1 Mode $01- Request Current Power Diagnosfic Data
The purpose of this mode is to allow access to current emission related data
values, including analog inputs and outputs, and system status information. The request
for information includes a parametric Identification (PID) that indicates the on-board
system the specific information requested.
The on-board system will respond to this message by transmitting the requested
data value last determined by the system. All the data values returned from the sensor
readings will be actual reading.
Not all PIDs are applicable or supported by all systems. PID $00 is a bit encoded
PID that indicates, foi each module, which PIDs that module supports. PID $00 must be
supported by all modules that respond to $01 request that determines which protocol is
supported for OBD II communicafions. The message data byte is given in Table 5.1.
46
Table 5.1 Message Data Bytes
Header
Data Bytes
#1
#2
#3
#4
#5
#6
#7
Request current diagnostic data
01
PID
Report Current Power train Diagnostic Data
41
PID
Data A
Data b
5.4.2 Mode $02 - Request Power train Freeze Frame Data
The purpose of this mode is to allow access to emission related data values which
were stored during the freeze frame required by OBD II regulations. PID $02 is the DTC
that caused the freeze-frame data to be stored. If freeze frame data is not stored in the
module, the system should report $00 00 as the DTC. Any data reported when the stored
DTC is $00 00 may not be valid.
5.4.3 Mode $03 - Requested emission-related Power
train Diagnostic Trouble Codes
The purpose of this mode is to enable the off-board test device to store emission
related power codes. This is achieved by first sending Mode $01, PID $01 request to get
the number of stored emission-related power train trouble codes from all the modules that
have this available. Then send a mode $03 request for all the stored emission-related
power train codes. Each module that has codes stored will respond with one or more
47
messages each containing up to 3 codes. If no codes are stored in the module, then the
module may not respond to the request.
The diagnostic trouble code consists of an alphanumeric designator, B0-B3 for
Body, C0-C3 for Chassis, P0-P3 for power train and U0-U3 for network communication,
followed by three dighs. The assignment of proper alphanumeric designator should be
determined by the controller into which a particular fianction is being diagnosed is being
integrated. In most cases, the alphanumeric designator will be implied since diagnostic
information will be requested from a particular controller [21].
The diagnostic trouble codes are transmitted in two bytes of information for each
code. The first two bytes (high order) of the first byte for each code will be zeros, in case
of power train code. The second two bits will indicate the first digh of the diagnostic
code (0 through 3). The second nibble of the first byte and the entire second byte are the
next 3 digits of the actual code. If less than three trouble codes are reported, the response
bytes are padded with $00 to fill the 7 data bytes. If no D T C s are reported the response
is allowed but not required. The interpretation of diagnosfic trouble codes is as shown in
Figure 5.1.
0
0
0
0
vv
P
0
0
0
1 0 0 0 0
1 1
1
0
Figure 5.1 Diagnostic Trouble Code
48
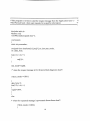
5.4.4 Mode $04 - Reset/clear emission-related Diagnosfic information
The purpose of this mode is to provide a means for the external test device to
command on mode modules to clear all emission-related diagnostic information. This
includes:
1. Clear number of diagnostic trouble codes (Mode $01, PID $01).
2. Clear diagnostic trouble codes (Mode $03).
3. Clear trouble code for Freeze frame data (Mode $01, PID $02).
4. Clear Freeze frame data (Mode $02).
5. Clear oxygen sensor test data.
6. Reset status of system monhoring tests (Mode $01, PID $01).
7. Clear on-board monitoring test resuhs (Mode $06, PID $07).
All modules must respond to this test mode request whh ignhion ON and with
engine not running.
5 4 5 Mode ?i^05 - Request Oxygen Sensor Monitoring Test resuhs
The purpose of this mode is to allow the access to the on-board sensor monhoring
test resuhs as required in OBD II regulations. The use of this mode is optional depending
on the method used by the vehicle manufacturers to comply with the requirements for
oxygen sensor. The resuh of the test resuhs includes a test ID value that indicates the
information requested.
49
5.4.6 Mode $06-Request On-Board Monitoring Test resuhs
for non-continuouslv monitored System
The purpose of this test mode is to allow access to the results for on-board
diagnostic monitoring tests of specific components/systems that are not continuously
monhored, for example, catalyst monhoring and the evaporative system monhoring
5.4.7 Mode $07-Request On-Board Monitoring Test results
for continuously monitored System
The purpose of this test mode is to allow access to the resuhs for on-board
diagnostic monhoring tests of specific components/systems that are continuously
monhored during normal driving condifions. The intended use of this data is to assist the
service technician after vehicle repair, and after clearing diagnostic information, by
reporting test resuhs after a single driving cycle. If the tests failed during the driving
cycle, the DTC associated with the test will be reported. If the tests indicate a failure after
addhional driving, then the MEL will be illuminated and a DTC will be set and reported
in mode $03, indicating a faulty component.
5.4.8 Mode $Q8-Request control of On-Board Svstem. Test or component
The purpose of this test mode is to enable the off-board test device to control the
operafion of an on-board system, test, or component. If any data bytes are unused for any
test, they should be filled with $00 to maintain a fixed length.
To obtain the information regarding the message data bytes of each mode and test
ID and data byte descripfion refer SAE J1979 [20]. Enhanced E/E Diagnostic test modes
are defined for access to emission related test data beyond what is included in SAE
50
J1997, and for non-emissionn related data. These modes are not included here, as the\
these need not be implemented according to OBD II minimum requirements Refer SAE
J2190 [23] for addifional informafion on enhanced test modes.
In addhion to the functions described above the Application layer must include
some addhional provisions to ensure proper operation of both the test equipment and the
vehicle during diagnosfic procedures.
5.5 Multiple Response to a Single Data Request
In case of a fianctional message, test equipment will request data without
knowledge of which module on the vehicle will respond. In some cases, multiple
modules may respond with the information requested. In addhion, a single module may
respond with multiple responses for a single request. Any test equipment requesting
information must, have provision for receiving the multiple responses.
5.6 Response Time
The on-board system should respond to a request whhin 100ms of a request or a
previous response. In case of muhiple responses for a single request, this allows as much
fime as is necessary for all modules to access the datalink and transmh their responses. If
there is no response within this time, the tool can assume no response will be received.
51
5.7 Minimum Timp between Requests from Scan Tool
A scan tool should always wah for a response from the previous request, or "no
response" fimeout before sending another request. In no case should a request be sent less
than 100ms after the previous request.
5.8 Data Not Available
There are two condhions for which data is not available. One condition is that the
test mode is not supported, and the other condhion is that the test mode is supported but
the data is not currently available.
5.9 Maximum Values
If the data value exceeds the maximum value possible to be sent, the on-board
system should send a maximum message value possible ($FF or $FFFF). The tool should
display the maximum value or an indication of data too high. This is not normally critical
for real time, but essential in case of misfire at 260 Km/h whh resulting freeze frame data
stored.
52
CHAPTER 6
SOFTWARE IMPLEMENTATION
6.1 Introducfion
In the previous chapters various addressing modes, test modes and the frame
structures were described in detail. This chapter gives a detailed description of how the
data link and Application layers are implemented in this project, ft gives a detailed
description of all the flow charts designed to implement the data link layer using a "C"
source code and Application layer using the visual basic software. This chapter also
includes the message format, which was comprehended for the Chapters 4 and 5 to
implement a Universal scan tool.
6.2 Diagnostic Message Format
The message format used in implementing the data link layer is described below.
Functional addressing is used for all generic diagnostic test modes because the test tool
does not know which system on the vehicle has the information that is needed. The
maximum message length effectively limhs the number of bytes that can be used to 12
bytes. To conform to the SAE J1850 [11] limitafions on message length, a diagnostic
message is selected to have a three-byte header, a maximum of seven data bytes, a
required ERR (error detecfion byte), and an in-frame response byte as shown in Table
6.1.
The first three bytes of all diagnostic messages are the header bytes. The value of
the first header byte is dependent on the bh rate of the data link and type of message. The
53
second byte has a value that depends on the type of message, either in a response or a
request. The third header byte is the physical address of the device sending the message
The device address for OBD II scan tool is $ Fl. Vehicle manufacturers do not use this
format for any purpose other than diagnosfic messages.
Table 6.1 Standard Diagnostic Message Format
Header Bytes (Hex)
Target
Source
Address
Address
Priority
type
Data Bytes
#1
#2
#3
#4
#5
#6
nl
ERR
IFR
Diagnostic Request at 10.4 Kps (SAE J1850) and (ISO 9141-2)
68
6A
FX
Maximum 7 Data Bytes
ves
no
Maximum 7 Data Bytes
Yes
no
Maximum 7 Data Bytes
Yes
Yes
Maximum 7 Data Bytes
Yes
Yes
Diagnostic Response at 10.4 Kps (SAE J1850) and (ISO 9141-2)
48
6B
addr
Diagnostic Request at 41.6 Kps (SAE J1850)
61
6A
FX
Diagnostic Response at 41.6 Kps (SAE J1850)
41
6B
addr
The maximum numbers of available data bytes are seven. The first data byte
following the header is the test mode, and the remaining 6 bytes vary depending on the
specific test mode. Each mode has a specific length determined by the parametric
identification (PID) or Test ID or on the particular mode depending on a specific mode.
All diagnostic messages with SAE J1850 use Cyclic Redundancy Check (CRC) as the
error detecfion byte (ERR). Diagnosfic messages using the IS09141-2 standard include a
checksum after the data bytes instead of the CRC with SAE J1850 [13].
The in-frame response byte is required in all requests and response messages at
41.6 Kbps, but is not allowed for messages at 10.4 Kbps. there is no provision for in-
54
frame response. This program implements the messages at 10.4kbps, so the in-fram(
response is not considered.
6.3 Response Message
The module in the vehicle responds with the data stored or its status when
information is requested by the test equipment. The Physical layer interprets this
information into frame [14]. Figure 6.1 shows the basic flow chart for the data transfer
from Physical layer to the Application layer.
The data obtained from the Physical layer has the same format as shown in
Figure 4.1 depending on which protocol is supported by the vehicle. The first step in data
transfer is to check for errors. The error check is performed with the help of a Cyclic
Redundancy Check (CRC) as prescribed by J1850 protocol. The CRC byte is obtained
from the algorithm described in Chapter 4. In case of an error, the response is sent back
to the Physical layer and the Application layer is informed. All other bytes of the
response are masked and only data bytes are transferred to the Application layer. Because
of the constraints whh the standard display format, the Application layer can only
interpret seven bytes of data. In order to avoid any misinterpretafion of data by the
Application layer, additional zeros are padded to the data if the number of bytes is less
than seven.
55
—~^~ -- — - ^f
--
PHYSICAL LAYER
Single-Byte Header
no
Three-Byte Header
Mask only header bt\e/(s)
Mask Header and IFR
Byte/(s)
Pad with zeros to fill
Tbytes
ves
TO APPLICATION LAYER
Figure 6.1 Data Transfer from the Physical to the Application Layer
56
6.4 Request Message
The request message is the command placed by the Application la\er to obtain
particular information from the vehicle. When the user requests some information by
pressing a key on the scan tool, seven bytes of data are sent to the data link la\ er The
protocol being supported by the vehicle is determined during the inhialization and is
stored for the rest of the transactions. Depending on the protocol being supported by the
vehicle and the test mode of the message, the header byte is constructed. The CRC byte
can be calculated from the algorithm described in Chapter 4. This whole frame is
transferred to the Physical layer. The Physical layer sends the request message to the
automobile. Figure 6.2 gives an over view of the data transfer between the Application
layer and the Physical layer.
57
USER
i
Scan Tool Key
Pressed
I
Data Bytes from
apphcation layer
Determine the
protocol supported
Construct message
Header
Construct CRC
Frame To Physical La\ er
Figure 6.2 Data Transfer from Application Layer to Physical Layer
58
6.5 Standard Display
One of the aims of this project is to design a Universal scan tool which is
efficient and easy to use. The primhive scan tools could not describe the diagnostic
trouble code, they could only display the DTC, and consequently ordinary people could
not figure out the problem whhout verifying the thick manual. To avoid these
inconveniences, this system display the actual code followed by the description of the
DTCs. All the requirements described in Chapter 5 have been met. The system
implemented in this project fiirnishes a user-friendly display format, h also includes a
help facility, which includes all the SAE J1979 [20] definitions, how to select the
functions and also how to determine the PID ID, hem name, and module id of data
returned for display. The scan tool display was built whh the help of Visual Basic
software [24]. Figure 6.3 describes the Application layer flowchart. Figures 6.4 give the
description of the readiness test. Figures 6.5 and 6.6 give a description of how the
diagnostic trouble codes and the current data from the automobile are displayed on the
scan tool.
59
Jb^^^EKB
Detect OBDII Interface
OBDII Main Function Select Window
Oxygen
Sensors
Current
Data
Freeze Frame
Data
Figure 6.3 Flowchart of Applicafion layer
60
Readiness Test
Select test items
windows
^
.
w
No
/
A—<(^
\
Sele(:tion
Con ect?
Show Readiness
Test Results
Yes
Decode Response
Encode Request
Data Link Layer Function (SendRequest)
Figure 6.4 Description of the Readiness Test
61
DTCs
Show"RetrievingDTCs"
Encode Request
Show DTCs and
Descriptions
Looks for DTC Database
for Descriptions
Decode Response
Data Link Layer Function (SendRequest)
Figure 6.5 Display of Diagnostic Trouble codes
62
Current Data
Select data item
windows
^
w
No
/
\
Selei::tion
<-
Show Current
Data Values
Con-ect?
Update Request
Decode Response
Data Link Layer Function (SendRequest)
Figure 6.6 Display of Current Data Form
63
CHAPTER 7
RESULTS
The previous chapters detail the various aspects of the data link and Application
layers. This chapter summarizes the resuhs and gives some fiature directions to make this
system more versatile.
7.1 Displav of diagnostic trouble codes
One of the most important functions of OBD II scan tool is to obtain and display
OBD II emission related diagnosfic trouble codes. When the input to the data link layer is
as shown below the respective DTCs corresponding to the Code 1, Code 2 and Code 3
are displayed on the scan tool.
Table 7.1 Message Data Bytes to Retrieve DTC
Data Bytes
#1
#2
#3
#4
#5
#6
#7
Request current diagnostic data
Request DTC
03
Report Current Power train Diagnostic Data
Report DTC
43
Code#l
Code #2
Code #3
00
00
00
For example, if a response obtained from the Physical layer is given by
64
48
6B
C3
43
01
43
02
05
00
which can be interpreted as module C3 of the vehicle has two-stored DTCs. Figure 7,1
shows the actual display what the user can see, on interfacing the scan tool with the
automobile. The display shows both the request to the data link layer from the
Application layer when a specific key is pressed, and the response from the data link
layer.
When the DTC display is selected, the DTC and the description of the particular
diagnosfic trouble code is displayed, which shown in the Figure 7.2. The first DTC is
"P0143" for "Oxygen Sensor Low Voltage" and the second is "P0205" for "injector
funcfion malfuncfion-Cylinder 5" [21]. Figure 7.2 shows that the same resuh is displayed
by the system.
7.2 Freeze Frame Data Display
The emission-related data values, which were stored during the freeze frame
required by OBD regulations, can be retrieved [20]. The retrieved data helps the service
technician to examine minutely the condition of the vehicle when the DTC occurred.
Figure 7.3 shows the various parameters when one of the DTCs described above was
stored.
65
MEl
Help
lestSTS
DTCs Current Data Freeze Data 02 Sensor Control Qear Exit
^19^
j t
R equest D ata to D ataUnk
Response r^alM^(m&^\wk
,
j3
V
....
!«
,.
1°
f
' " • ' • '
•
r
•'
1"
jo
1°
V
|0
15
|o
jo
F
f
...
•L•:^-.
\
DataLinklnte[^3ceDemo
Figure 7.1 Scan Tool Data Link Interface.
66
-
gXi]
iii^ Diagnostic Trouble Codes Display
Diagnostic TtoubfeCode* M e ¥ ^ ' ' ^ ; ;
Descripli3Js
DTC Codes
P0143
|02 Sensor Circuit Low Voltage
P0205
|lniector Circuit Malfunction - Cylinder 5
'• '•'"<
1
' •
1
. ^ ^ 1 ^ ^
I . I I
1
' . " , > , ' - " "
'
••••^••••••••••••^•^-*^
iMIIIIIHHIIIIIHMMMMHI
hf-
--^--^^^^^^^4444^^444444*4**444***4********************"
"
Figure 7.2 Display of DTCs on the Scan Tool
67
'
; •
•i^ Freeze Frame Data Display
HHMMMMlMiiJ
Selected Freeze Frame Da^^^Displasf,,
The Diagnostic Trouble Code which cause the Freeze Frame Data to be^toxett
Code:
IP0134
Descriptor
jo2 Sensor Circuit No Activity Detected
^tit-A
ttm
Calculated Load Value:(%)
0.3921569
Long Term Fuel Trim Bank2; [X]
1-99.21875
Engine Coolant Temperature: (C)
-39
Fuel Pressure: (kPaG)
[3
Short Term Fuel Trim Banki: [Z]
-99.21875
Intake Manifold Abs Pressufe:(kPaA) Pj
Long Term Fuel Trim Banki: [Z]
Short Term Trim Bank2: [Z]
r
.. .>^
Engine RPM; (r/min)
•99.21875
Vehicle Speed: (km/h)
-99.21875
. ^ [79 75
pf
^•4
Cancel
^ .....^^^^^
•V^,.......-^..>........>^>^..........>V»..»..>..V»......^
Figure 7.3 Freeze Frame Data Display
68
7.3 PC Interface
Interface of the scan tool with the PC is important, as h aids in capturing the
required data, analyzing h and using h for future reference. The data transfer should
enable the transfer of both the stored data in the tester and the real time data (when the
engine is running) to the PC. The information can be stored at various intervals of time,
which enables the complete understanding of the behavior of the vehicle. The program
developed in this project can be called by another software program to display all the
stored data in various modes like bar charts, line graphs, etc. Figure 7.4 shows the data
captured from the scan tool, which when interpreted gives the condhion of the vehicle at
that instant.
Engine Speed =
Vehicle Spd =
Engine Load =
MAP (R] =
IAT =
Fuel Stat 2 =
LTFTl =
LIFT 2 =
F T 0 2 S B 1 SI =
02S B l S3 =
FT02SB2S1 =
Stored DTCs =
0
0
0.0
0.0
38
OL
0.0
0.0
0.0
0.850
0.0
0
RPM
km/h
%
gm/s
"C
ECT =
Ign. Timing =
MAP (PJ =
TPS(%) =
Fuel Stat 1 =
STFT1 =
ST FT 2 =
02S B l SI =
02S B l S2 =
02S B2 SI =
MIL Status =
%
%
%
VDC
%
59
-2.0
99
0.0
OL
0.0
0.0
0.195
0.755
0.755
Off
"C
"
kPaA
%
%
%
VDC
VDC
VDC
OBD Cert. = OBD
Figure 7.4 The Data Capturedfi"omthe Scan Tool.
The captured data can be stored can be displayed in various formats like line
graphs and bar graphs for easy and quick interpretation of the vehicle condition and to
69
diagnose the actual problem. Figure 7.5 shows the bar graph of the captured data and
Figure 7.6 shows the line graph.
59X
215-
164;
0
ORPM
6n
GOOG-i
1.300
5-
4800-
1.040-
3600-
0.780-
2-
2400-
0.520
1-
1200
0.260-
113":
62-
11
-40 '
ECT
0.195VDC
0
Q_l
Engine Speed
Stored DTCs
7.5 Bar Graph of the Captured Data.
70
0.000
02S B l SI
ORPM
\ j
''-I W
u
'—^
-J 'J
*„—
i'l-
I -J
-2.0^
-./-v
/'V-
<v_/-
/•.._/---^V''"-JV
0.0%
(^^^•y
rtn tA.u
u /
viins
rv!
M
V
n
iJ
M
n hn
L/v-
i 0.19!^VDC
u
7.6 Line Graph of the Captured Data.
71
CHAPTER 8
CONCLUSIONS
The objective of this thesis was to develop a Universal scan tool, which was
required to interface whh the on-board diagnostics system for receiving and downloading emission-related data and transmh this data to the TX96 equipment for
communication with the Texas Data Link system. The resuhs in the previous chapter
show that this project was successful in accomplishing most of the goals set at the
beginning of the project.
The system implemented in this project supports aU the basic requirements of the
OBD II test equipment. The Universal scan tool developed in this project can be used on
any model vehicle and of any specific make. This helps the service technician to maintain
only one test equipment to test all the vehicles he or she repairs.
The results shown in Chapter 7 are verified using a Vetronix Mastertech [26] scan
tool on the 1996 and 1997 model vehicles. The diagnostic trouble code displayed on the
Vertronix Mastertech by actually removing the fuel injector from the cyclinder-5 in the
vehicle, is the same as that displayed by the system developed in this project when
appropriate input is given, as described in Chapter 7. So the Universal scan tool
developed in this project can effectively detect any emission-related malfunctions.
As the Universal scan tool developed in this project is a PC-based scan tool, h is
relatively easy to store the retrieved data from the vehicle and to transmit this data to the
TX96 equipment for communication with the Texas Data Link system, compared to
normal scan tools.
72
8.1 Recommendations for Future Work
The results obtained show that there is definhe room for improvements in the
Universal scan tool. One of the areas of future work can be to implement the enhanced
diagnostic test modes [23]. The enhanced diagnostic test modes can supplement the
legislated diagnostic test modes defined in SAE J 1979[20]. These modes increase the
access to emission-related test data compared to diagnostic test modes included in SAE J
1979 [20], and can also obtain non-emission related data. Implementation of enhanced
diagnostic test codes will improve the efficiency and accuracy of OBD II test equipment.
In this project only the minimum requirements of the OBD II test equipment have been
achieved.
Since most of the manufacturers are implementing the ISO 9141-2 protocol, it can
also be implemented with very few changes. Only the error checking byte in ISO 9141-2
protocol differs compared to SAE J1850 protocol. In case of ISO 9141-2, checker sum
algorithm is implemented instead of cyclic redundancy check as in SAE J1850 protocol.
The design in this project can be slightly modified to implement the ISO 9141-2
protocol.
This system can be upgraded, as the standards are reviewed and new
modifications are made.
73
BIBLIOGRAPHY
[I] Proposed rule making, "Modification of Federal On-Board Diagnostic Regulations;
Extension of Acceptance of California OBD II Requirements," Environment
Protection Agency, 40 CFR Part 86, EPA, May 1997.
[2] Gerard, "Diagnostic Tools," www.rug.nl/rug/homepage/wink/scantool.htm.
[3] FIA,"Freedom of choice,"www.fia.com/homepage/selection-a.html Novemberl996.
[4] SAE J1978 JUN 94, "OBD II Scan Tool," SAE On-BoardDiagnostics and multiplex
Technical Reports, SAE international, 1997.
[5] Staff Report, "Technical Status Update and Procedure Revisions to Malfunction and
Diagnostic System Requirements Applicable to 1994 and Subsequent California
Passenger Cars, Light-Duty Trucks, and Medium-Duty Vehicles- (OBD II),"
California Air Resources Board, August 1991, pp 1-8.
[6] Staff Report and Notice of Public Hearing, " Titlel3. California Code of Regulations
section 1968," www.arb.ca.gov/msprog/obdprog/obdprog.htm/, December 1996.
[7] EPA, "EPA's Mission," www, epa. gov/epahome/epa. html, USER A.
[8] EPA, "Air Quality," www, epa. gov/25year/air/air. html, USER A.
[9] Air Resources Board, "Amendments to Regulations Regarding On-Board Diagnostic
System Requirements for 1994 and Later Passenger Cars, Light-Duty Trucks, and
Medium-Duty Vehicles and Engines (OBD II)," CARE, July 1997.
[10] "Subpart WEmission control System Performance Warranty Short Tests," Clean
Air Act as amended, 42 U.S.C 7541(b) and 7601(a).
[II] Society of Automotive Engineers, Inc., "Class B data Communications Network
Interface - SAE J1850 July 95," SAE Diagnostics for Light and Medium Duty
Vehicles Standard Manual, Warrendale, PA, 1997, pp 91-108.
[12] Draft International Standard ISO/DIS 14230-2, "Road Vehicles-Diagnostic SystemsKeyword protocol 2000," International Organization for Standards, Geneva,
Switzerland, Junel995.
[13] International Standards, "Road Vehicles-Diagnostic Systems-CARB requirements
for interchange of dighal information," International Organization for Standards,
Geneva, Switzerland, First edition, 1994-02-01.
74
[14] Mohamed Sohel Sarwar, "Physical Layer," Master's Thesis, Texas Tech University,
unpublished.
[15] Society of Automotive Engineers, Inc., "Class B data communications Network
messages-part 3: Frame Ids for single-byte forms of headers - SAE J2178/3 SEP
93," SAE Diagnostics for Light and Medium Duty Vehicles Standard Manual,
Warrendale, PA, 1997, pp 137-140.
[16] Society of Automotive Engineers, Inc., "Class B data communications Network
messages-part 4: Message definhions for three-byte headers - SAE J2178/4 FEB95,"
SAE Diagnostics for Light and Medium Duty Vehicles Standard Manual,
Warrendale, PA, 1997, pp 137-140.
[17] Society of Automotive Engineers, Inc., "Table 6 -The sixteen message Types," SAE
Diagnostics for Light and Medium Duty Vehicles Standard Manual, Warrendale,
PA, 1997, pp 112.
[18] Society of Automotive Engineers, Inc., "Class B data communications Network
messages-Detailed header format and Physical Address Assignments." - SAE
J2178/1 Jan95," Diagnostics for Light and Medium Duty Vehicles Standard Manual,
Warrendale, PA, 1997, pp 109-115.
[19] Society of Automotive Engineers, Inc., "Class B data communications Network
messages-Data Parameter Definitions - SAE J2178/2 Jan95," Diagnostics for Light
and Medium Duty Vehicles Standard Manual, Warrendale, PA, 1997, pp 116-136.
[20] Society of Automotive Engineers, Inc., "E/E diagnostic test modes - SAE 1979
Jul96," Diagnostics for Light and Medium Duty Vehicles Standard Manual,
Warrendale, PA, 1997, pp 29-38.
[21] Society of Automotive Engineers, Inc., "Recommended practice for Diagnostic
Trouble Code Definhions - SAE J2012 JUL96," Diagnostics for Light and Medium
Duty Vehicles Standard Manual, Warrendale, PA, 1997, pp 39-45.
[22] Society of Automotive Engineers, Inc., "OBD II scan tool - SAE J1978 JUN94,"
Diagnostics for Light and Medium Duty Vehicles Standard Manual, Warrendale,
PA, 1997, pp 25-28.
[23] Society of Automotive Engineers, Inc., "Enhanced E/E Diagnostic Test Modes SAE J2190 JUN 93," Diagnostics for Light and Medium Duty Vehicles Standard
Manual, Warrendale, PA, 1997, pp 48-64.
[24] Geng Fu, "Application Layer," Texas Tech University, Unpublished report.
75
[25] Society of Automotive Engineers, Inc., "diagnostic connector - SAE J1962 JAN
95," Diagnostics for Light and Medium Duty Vehicles Standard Manual,
Warrendale, PA, 1997, pp 19-24.
[26] Vetronix Mastertech, Vetronix Corp., Diagnostics for Vehicle Electronics, Santa
Barbara, California, 1997.
76
APPENDIX
SOURCE CODE FOR THE APPLICATION LAYER AND DATA LINK LAYER
This appendix contains the listing of the source code developed
for
implementation of data link layer and application in the design of Universal scan tool.
Source code for data link layer is in "C" and for Application layer source code is in
Visual Basic.
/* This program written to implement data link layer in the Universal scan tool. */
/*This program includes four different modules. All four modules are included. */
/
^If ^Jt* ^^ ^f ^Jf %^ *S^ ^£ ^^ ^^ ^^ ^^ %s^ ^1^ ^^ ^^ ^^ ^^ ^^ ^^ ^^ ^^ ^^ ^u ^^ ^^ ^u ^£r 4^ ^^ ^^ «^ ^^ ^u ^^ ^^ ^u %^ ^^ ^u ^# «£# ^^ ^u ^^ ^^ ^^ ^^ ^u ^^ ^^ ^^ ^^ ^U ^^ >1^ ^^ >^ ^^ ^^ ^^ ^^ ^^ ^U /
^j% ^^ ^^ ^^ ^T* ^^ ^P ^n ^n ^^ ^p ^^ ^p ^* ^^ ^^ ^^ ^^ ^^ ^^ ' ^ ^^ ^p ^^ ^^ ^^ ^p ^p ^^ ^^ ^p ^^ ^^ ^p ^^ ^^ ^^ ^^ ^^ ^p M* *T* '^ ^n ^^ ^^ ^^ ^P ^n ^P ^^ ^^ ^n ^^ ' ^ ' ^ ^* ^n ^n ^n ^^ ' ^ ^n ^n /
/*This program is written to transfer the response received from the Physical layer to the
Application layer""/
#include <stdio.h>
#include <stdlib.h>
#define crc()
unsigned char phy_app(unsigned char Physical[],int size);
main()
{
unsigned char head_byte,Physical[12],temp,ifr_bh,res[7],crc_byte,frame[l 1];
unsigned char old_crc,old;
int size, data, i;
/'^input data is obtained from the Physical layer*/
77
for(i=0;i<=ll;i++)
{
Physical[i]=i+1;
}
size=i;
if (size <= 12)
{
crc_byte=Physical[size];
for(i=0;i < size;i++)
/*The last byte of the frame is the crc which is compared */
/* with that of the calculated crc*/
{
frame[i]=Physical[i];
}
old = new_crc(dataframe)
old crc=old;
if (crcbyte == old_crc)
{
temp=frame[0];
head_byte=temp & 0x10;
if(head_byte==OxlO)
/* single byte header*/
ifr_bit=temp & 0x08;
if(ifr_bh == 0x08)
/*check for IFR*/
{
for(i=0;i<=6;i++)
{
res[i]=frame[i+l];
data=i;
/*IFR not allowed*/
78
if(data<=7)
for (i=data+l;i<=7;i+-H)
{
res[i]=OXOO;
}
return res[i];
else
for(i-0;i<=6;i++)
{
res[i]==frame[i+l];
}
return res[i];
/*retums the data to Application layer*/
else
ifr_bit=temp & 0x08;
/* Three byte header (H bh =0)*/
{
if(ifr_bh -= 0x08)
{
for(i=0;i<=6;i++)
{
res[i]=frame[i+3];
/* The frame does not have IFR*/
data=i;
/*send only the data bytes */
/* to Application layer.*/
/*Check for number of data
bytes*/
if(data<=7)
79
for(i=data+l;i<=7;i++)
{
res[i]=OXOO;
/*padding with zeros.*/
return res[i];
/*returns the data to Application*/
/*layer*/
else
for(i-0;i<=6;i++) //with IFR//
{
res[i] = frame[i+3];
>
/*retums the data to Application
return res[i];
layer*/
else
for (i=0;i<=6;i++)
{
res[i]=OXOO;
}
return res[i];
/*returns error message to*/
/* Application layer*/
80
/*This program is written to send the request message from the Application layer to
/*the Physical layer, when user requests for a specific information
*************************************************************
#include<stdio.h>
#define crc()
void Physical(unsigned char *);
void main()
{
static int pronumber;
unsigned char dataframe[12],req[7],crc_byte,test_mode;
int i,data_byte;
for(i=0;i<=6;i++)
{
req[i]=i;
}
test_mode=req[0];
/* when the request message is for the powertrain diagnostic data*/
if(test_mode==0X01)
I
data_byte=2;
for(i=2;i<=6;i++)
{
req[i]=OXOO;
}
}
else
/* when the requested message is powertrain freeze frame data*/
if(test_mode==0X02)
{
81
*/
*/
data_byte=3;
for(i=3;i<=6;i++)
{
req[i]=OXOO;
}
}
else
/* the request for emission related powertrain diagnostic
trouble codes.*/
if(test_mode==0X03)
data_byte=l;
for(i=l;i<=6;i++)
{
req[i]=OXOO;
}
else
/* the request message is to clear or reset emission related
diagnostic information.*/
if(test_mode==0X04)
(
data_byte=l;
for(i=l;i<=6;i++)
{
req[i]=OXOO;
}
}
else
/* request for oxygen sensor monhoring resuhs*/
if(test_mode=0X05)
{
data_byte=3;
for(i==3;i<-6;i++)
{
req[i]=OXOO;
}
}
else
82
/* request for On-Board monhoring Test Resuhs for
non-continuously monitored system*/
if(test_mode==0X06)
{
data_byte=2;
for (i==2;i<=6;i++)
{
req[i]=OXOO;
}
}
else
/* request for On-board monitoring test results for
continuously monitored system*/
if(test_mode==0X07)
{
data_byte=7;
}
if (pronumber== 1)
{
dataframe[0]=0x68;
dataframe[ 1 ]=0x6 A;
dataframe[2]=0xFl;
}
else
{
dataframe[0]=0x61;
dataframe[ 1 ]=0x6 A;
dataframe[2]=0xFl;
}
for(i=0;i<=6;i++)
{
dataframe[3+i]=req[i];
}
crc_byte= new_crc(frame)
dataframe[ 10]=crc_byte;
83
dataframe[ll]=OxOO;
Physical(dataframe);
}
void Physical(unsigned char *frame){
int loop;
for(loop=0;loop<l 1 ;loop++)printf("%x",frame[loop]);
84
/**********************************************************************/
/* This program is written to detect any error in the frame during the transmission. This*/
/* program implements the cyclic redundancy check, to detect errors and is called in */
/* the above programs.
*/
/**********************************************************************/
#include <stdio.h>
#include <stdlib.h>
/* table of crcs of all 8-bh messages*/
unsigned char crc_table[256];
/*check if the table is computed or not*/
int crc_computed = 0;
int n,c;
unsigned char new_crc(unsigned char crc,unsigned char *buf,int len);
void makecrcO;
unsigned char crc (unsigned char * buf, int len);
void main()
{
/*make a crc table for fast computation.*/
void makecrcO
{
int n,k,c;
for(n=0; n<256; n++)
{
c = n;
for (k=0; k<8; k++)
{
if(c&l)
c = OXlld'^(c»l);
85
else
c= c»l;
}
crc_table[n] = (unsigned char) c;
}
crc_computed = 1;
}
/* The crc is initialized to all I's, and the transmitted value is
the I's complement of the final running crc*/
unsigned char new_crc(unsigned char crc,unsigned char *buf,int len)
{
unsigned char c = crc;
int n;
if (! crccomputed)
makecrcO;
for (n=0; n<len; n++)
{
c = crc_table[(c ^ buf[n]) & OXflf] ^ (c » 8);
}
return c;
}
unsigned char crc (unsigned char * buf, int len)
{
return new_crc(OXff, buf, len) ^ OXff;
}
86
/* This part of the program provides the interface between the data link layer and
/* the Application layer.
*/
*/
#include <windows.h>
#include "datalink.h"
/* BOOL WINAPI DLLMain (HINSTANCE hDLL, DWORD dwReason, LPVOID
IpReserved)*/
unsigned char PASCAL SendRequest (unsigned char *x, unsigned char *y)
{
unsigned char Req[7], Res[7];
int i;
/*get the request from the passed parameters.*/
for (i=0; i<7; i++)
{
Req[i]=*(x+sizeof(unsigned char)*i);
}
/*get response from the somewhere*/
for (i=0; i<7; i++)
{
Res[i]=Req[i]+l;
}
/*return the repsonse to Application layer*/
for (i=0; i<7; i++)
{
*(y+sizeof(unsignedchar)*i)=Res[i];
}
return (*x+*y);
}
87
/**********************************ife******itJfe*vk*************************/
APPLICATION LAYER
/*
*/
/* In this part of the appendix visual basic code is included, to implement the
/* Application layer. Various form files are included to display and request the
/* current data, freeze frame data, diagnostic trouble codes, oxygen sensor data
/* request control and help topics.
*/
*/
*/
*/
/*
*/
/*******************S|C***5|C5|c5(c:|Cj|«;,Cj|j,|<,lC,|5,|j,l(,|j,|5,^,|(,^,^,|j,|(^,|<,|(5,t,|55lt,|<,|j,|<,|<5|(j|t,|t,|<j|<5|c,|<:^^
/* This code is to display the current data received from the automobile.*/
Private Sub cmdCancel_Click()
Unload Me
End Sub
Private Sub cmdRefresh_Click()
Call Timer 1 Timer
End Sub
Private Sub Form_Activate()
'Define the Fuel System Status
Dim FuelSystemStatus(0 To 7) As String
FuelSystemStatus(O) = "Open Loop, has not yet satisfied condhion to go closed loop"
FuelSystemStatus(l) = "Closed Loop, using oxygen sensor(s) as feedback for fuel
control"
FuelSystemStatus(2) = "Open Loop due to driving condhions(power enrichment,
deceleration enleanment)"
FuelSystemStatus(3) = "Close Loop, but fauh with at least one oxygen sensor - maybe
using single oxygen sensor for fiiel control"
FuelSystemStatus(4) = ""
FuelSystemStatus(5) = ""
FuelSystemStatus(6) = ""
FuelSystemStatus(7) = ""
'Define the Secondary Air Status
Dim AirStatus(0 To 7) As String
AirStatus(O) = "upstream of first catalytic converter"
AirStatus(l) = "downstream of first catalytic converter inlet"
AirStatus(2) = "atmosphere/off'
AirStatus(3) = ""
AirStatus(4) = '"
AirStatus(5) = "'
AirStatus(6) = "'
AirStatus(7) = "'
88
'Define the Aux Input Status
Dim AUX(0 To 7) As String
AUX(O) = "Power Take_OFF Not Active"
AUX(l) = "Power Take_OFF Active"
Dim Value As Single
Dim I As Byte
Dim Step As Integer
•Response: (l)=testmode, (2)= TestID, (3)=data_HighByte, (4)-data_LowByte
If Response(l) <> &H41 Then
Debug.Print "RESPONSE ERROR"
Else
Select Case Response(2)
Case &H3
For I = 0 To 7
If Response(3) = 2 ^ (I) Then
txtCurrentData(2).Text = FuelSystemStatus(I)
Exit For
End If
Next I
If Response(4) <> 0 Then
For I = 0 To 7
If Response(4) = 2 ^ (I) Then
txtCurrentData(3).Text = FuelSystemStatus(I)
Exit For
End If
Next I
End If
Case &H4 To &HB, &HD To &HF, &H11
Value = Calculation(CLng(Response(3)), Response(2))
txtCurrentData(Response(2)).Text = Value
Case&HC, &H10
Dim Datalnput As Long
Datalnput = CLng(Response(3)) * 256 + CLng(Response(4))
Value = Calculation(DataInput, Response(2))
txtCurrentData(Response(2)).Text = Value
Case &H12
For I = 0 To 7
If Response(3) - 2 ^ (I) Then
txtCurrentData(&H12).Text = AirStatus(I)
Exit For
End If
89
Next I
Case&H13
Value = Response(3)
Step = 256
For I = 0 To 7
Step = Step / 2
IfValue>= Step Then
txtCurrentData(&HlB - I).Visible = True
Label2(&HlB - I).Enabled = True
Value = Value - Step
Else
txtCurrentData(&HlB -1).Visible = False
Label2(&HlB - I).Enabled = False
End If
Next I
Case &H14 To &H1B
Value = Calculation(CLng(Response(3)), Response(2))
txtCurrentData(Response(2)).Text = Value
Case &H1E
If Response(3) <= I Then
txtCurrentData(Response(2)).Text = AUX(Response(3))
Else
txtCurrentData(Response(2)).Text = "SAE NOT DEFINED"
End If
End Select
End If
End Sub
Private Function Calculation(DataIn As Long, Index As Byte) As Single
Dim Min(4 To &H1B) As Single
Dim Scaling(4 To &H1B) As Single
Dim Max(4 To &H1B) As Single
'MIN ARRAY
Min(4) = 0#
Min(5) = -40
Min(6) = -100
Min(7) = -100
Min(8) = -100
Min(9) = -100
Min(&HA) = 0
Min(&HB) = 0
Min(&HC) = 0
Min(&HD) = 0
Min(&HE) = -64
Min(&HF) = -40
90
Min(&H10) = 0
Min(&Hll) = 0
Min(&H14) = 0
Min(&H15) = 0
Min(&H16) = 0
Min(&H17) = 0
Min(&H18) = 0
Min(&H19) = 0
Min(&HlA) = 0
Min(&HlB) = 0
'SCALESIG ARRAY
Seal n g ( 4 ) = 1 0 0 / 2 5 5
Seal ng(5) = 1
Seal n g ( 6 ) - 100/128
Seal ng(7) = 100 / 128
Seal ng(8) = 100 /128
Seal ng(9)= 100/128
Seal ng(&HA) = 3
Seal ng(&HB) = 1
Seal ng(&HC) = 1 / 4
Seal ng(&HD) = 1
Seal ng(&HE) = 1 / 2
Seal ng(&HF) = 1
Seal ng(&H10) = 0.01
Seal n g ( & H l l ) = 100/255
Seal ng(&H14) = 0.005
Seal ng(&H15) = 0.005
Seal ng(&H16) = 0.005
Seal ng(&H17) = 0.005
Seal ng(&H18) = 0.005
Seal ng(&H19) = 0.005
Seal ng(&Hl A) = 0.005
Seal ng(&HlB) = 0.005
'MAX ARRAY
Calculation = Min(Index) + Scaling(Index) * Datain
End Function
Private Sub Form_load()
Dim I As Integer
'set all disabled and invisible first.
For 1 = 2 To 30
Label2(I).Enabled = False
91
txtCurrentData(I). Visible = False
Next I
'then recover those selected PID
For I = 0 To 99
If PID(I) = 0 Then
Exit For
Elself PID(I) <> 19 Then 'PID= 19 shows nothing
Label2(PID(I)).Enabled = True
txtCurrentData(PID(I)).Visible = True
End If
Next I
If PID(O) = 3 Then 'PID=3 show the 2 friel system status
Label2(2).Enabled = True
txtCurrentData(2).Visible = True
End If
End Sub
92
/* This code is to display the Diagnosfic trouble codes received from the automobile */
Private Sub Timer l_Timer()
Static pointer As Integer
pointer = pointer + 1
Const maxium = 30
If pointer > maxium Then
pointer = 1
End If
Response(l) = &H41
Response(2) = pointer + 3
Response(3) = &H1
Response(4) = &H33
Call Form_Activate
'For the true call to OBDII]
Static I As Integer
1 = 1+1
IfI>=PIDSelNumThen
1 = 0 'reset PID2 counter if bigger than selected TestID Num.
End If
Request(l) = &H2
Request(2)=PID(I)
For J = 3 To 7
Request(J) = 0
Next J
Dim reply As Byte
'reply = SendRequest(Request(l), Response(l))
'Call FormActivate
End Sub
Private Sub Form_Activate()
Dim reply As Byte
Dim i As Integer
Dim tempi, temp2 As String
Request(l) = &H3
For i = 2 To 7
Request(i) = &H0
Next i
93
reply = SendRequest(Request(l), Response(l))
DTCNum = 2
Debug.Print Hex(Response(l))
If Response(l) <> &H43 Then
MsgBox "Response Message Error."
Exit Sub
Elself Response(2) < &H10 Then
tempi = Hex(Response(2))
temp2 = Hex(Response(3))
If Len(templ) < 2 Then tempi = "0" & tempi
If Len(temp2) < 2 Then temp2 = "0" & temp2
DTCString(O) = "P" & tempi & temp2
Debug.Print "DTCl", DTCString(O)
If Response(4) <> &H0 Then
tempi = Hex(Response(4))
temp2 = Hex(Response(5))
If Len(templ) < 2 Then tempi = "0" & tempi
If Len(temp2) < 2 Then temp2 = "0" & temp2
DTCString(l) = "P" & tempi & temp2
Debug.Print "DTC2", DTCString(l)
End If
If Response(6) <> «feHO Then
tempi = Hex(Response(6))
temp2 = Hex(Response(7))
If Len(templ) < 2 Then tempi = "0" & tempi
If Len(temp2) < 2 Then temp2 = "0" & temp2
DTCString(2) = "P" & tempi & temp2
Debug.Print "DTC3", DTCString(2)
End If
Else
MsgBox "DTC is not defined in SAE Documents"
End If
DTCGroup = 0
Call DTCShowGroup(DTCGroup)
End Sub
Private Sub DTCShowGroup(Base As Integer)
Const GroupNum = 5
For i = 0 To GroupNum - 1
If DTCString(i + Base) = "" Then
txtDTC(i).Text = ""
94
txtRemarks(i).Text = ""
Else
'For how to convert the DTC into DTCString, relate the Display Freeze Frame
datDTCs.Recordset.FindFhst "DTC = '" & DTCString(i + Base) &
txtDTC(i).Text = datDTCs.Recordset.Fields(0).Value
txtRemarks(i).Text = datDTCs.Recordset.Fields(l).Value
End If
Next i
End Sub
Private Sub Form_Load()
cmdBack.Enabled = False
IfDTCNum<=5Then
cmdMore.Enabled = False
End If
End Sub
95
/* This code is to display the freeze frame data*/
Private Sub cmdCancel_Click()
Unload Me
End Sub
Private Sub Form_Activate()
'Define the Fuel System Status
Dim FuelSystemStatus(0 To 7) As String
FuelSystemStatus(O) = "Open Loop, has not yet satisfied condhion to go closed loop"
FuelSystemStatus(l) = "Closed Loop, using oxygen sensor(s) as feedback for fuel
control"
FuelSystemStatus(2) = "Open Loop due to driving condhions(power enrichment,
deceleration enleanment)"
FuelSystemStatus(3) = "Closed Loop, but fauh with at least one oxygen sensor - maybe
using single oxygen sensor for fuel control"
FuelSystemStatus(4)=""
FuelSystemStatus(5) = ""
FuelSystemStatus(6) = ""
FuelSystemStatus(7) = ""
'Response: (l)=testmode, (2)= TestID, (3)=data_HighByte, (4)=data_LowByte
Dim Value As Single
Dim i As Byte
Dim Step As Integer
Dim HighByte, LowByte, DTCode As String
If Response(l) <> &H42 Then
Debug.Print "RESPONSE ERROR"
Else
Select Case Response(2)
Case &II2
HighByte = Hex(Response(3))
LowByte = Hex(Response(4))
If Len(HighByte) = 1 Then 'OX stands for Powertrain DTCs
HighByte = "PO" & HighByte
DTCode = HighByte & LowByte
datDTCs.Recordset.FindFhst "DTC = '" & DTCode &
txtDTC(0).Text = datDTCs.Recordset.Fields(O). Value
txtRemarks(0).Text = datDTCs.Recordset.Fields(l).Value
Else
Debug.Print "Other DTCs are not defined in SAE documents"
End If
96
Case &H3
For i = 0 To 7
If Response(3) = 2 ^ (i) Then
txtCurrentData(0).Text = FuelSystemStatus(i)
Exit For
End If
Nexti
If Response(4) <> 0 Then
For i = 0 To 7
If Response(4) = 2 ^ (i) Then
txtCurrentData(l).Text = FuelSystemStatus(i)
Exit For
End If
Nexti
End If
Case &H4 To &HB, &HD
Value = Calculation(CLng(Response(3)), Response(2))
txtCurrentData(Response(2) - 2). Text = Value
Case &HC
Dim Datalnput As Long
Datalnput = CLng(Response(3)) * 256 + CLng(Response(4))
Value = Calculation(DataInput, Response(2))
txtCurrentData(Response(2) - 2). Text = Value
End Select
End If
End Sub
Private Function Calculation(DataIn As Long, Index As Byte) As Single
Dim Min(4 To &H1B) As Single
Dim Scaling(4 To &H1B) As Single
Dim Max(4 To &H1B) As Single
'MIN ARRAY
Min(4) = 0#
Min(5) = -40
Min(6) = -100
Min(7) = -100
Min(8) = -100
Min(9) = -100
Min(&HA) = 0
Min(&HB) = 0
Min(&HC) = 0
Min(&HD) = 0
Min(&HE) = -64
Min(&HF) = -40
Min(&H10) = 0
Min(&Hll) = 0
97
Min(&H14) = 0
Min(&H15) = 0
Min(&H16) = 0
Min(&H17) = 0
Min(&H18) = 0
Min(&HI9) = 0
Min(&HIA) = 0
Min(&HlB) = 0
'SCALING ARRAY
Scaling(4)= 100/255
Scaling(5) = 1
Scaling(6)= 100/128
Scaling(7)= 100/128
Scaling(8)= 100/128
Scaling(9)= 100/128
Scaling(&HA) = 3
Scaling(«&HB) = 1
Scaling(&HC) = 1 / 4
Scaling(&HD) = 1
Scaling(&HE) = 1 / 2
Scaling(&HF) = I
Scaling(&H10) = 0.0I
Scaling(&Hll)= 100/255
Scaling(&HI4) = 0.005
Scaling(&H15) = 0.005
Scaling(&H16) = 0.005
Scaling(&H17) = 0.005
Scaling(&H18) = 0.005
Scaling(&H19) = 0.005
Scaling(&HIA) = 0.005
Scaling(&HlB) = 0.005
'MAX ARRAY
Calculation = Min(Index) + Scaling(Index) * Datain
End Function
Private Sub Form_Load()
Dim Mode, PID As String
Dim i As Integer
Mode = "02": PID = "02"
98
'call SendRequest(Mode, PID)
'simulate response
Response(l) = &H42
Response(2) = &H2
Response(3) = «&H1 'P0134
Response(4) = &H34
'set all disabled and invisible first.
For i = 0 To 11
Label2(i).Enabled = False
txtCurrentData(i).Visible = False
Next i
'then recover those selected PID
For i = 0 To 99
If PID2(i) = 0 Then
Exit For
Else
Label2(PID2(i) - 2).Enabled = True
txtCurrentData(PID2(i) - 2).Visible = True
End If
Next i
If PID2(0) = 3 Then 'PID=3 show the 2 fuel system status
Label2(0).Enabled = True
txtCurrentData(0).Visible = True
End If
End Sub
Private Sub Timer l_TimerO
Stafic pointer As Integer
pointer = pointer + 1
Const maxium =10
If pointer > maxium Then
pointer = 1
End If
Response(l) = &H42
Response(2) = pointer + 3
Response(3) = &H1
Response(4) = &H33
Call Form_Activate
'For the true call to OBDII]
99
Static i As Integer
i = i+l
If i >= PID2SelNum Then
i = 0 'reset PID2 counter if bigger than selected TestID Num.
End If
Request(l) = &H2
Request(2) = PID2(i)
For J = 3 To 7
Request(J) = 0
Next J
Dim reply As Byte
'reply = SendRequest(Request(l), Response(l))
'Call Form_Activate
End Sub
100
/* This code can display the Oxygen sensor data*/
Private Sub cmdCancelClickO
Unload Me
End Sub
Private Sub Form_ActivateO
'Define Sensor Locafion Marks
Dim SensorLab(0 To 7) As String
SensorLab(O) = "Banki Sensor 1"
SensorLab(l) = "Banki Sensor2"
SensorLab(2) = "Banki Sensor3"
SensorLab(3) = "Banki Sensor4"
SensorLab(4) = "Bank2 Sensorl"
SensorLab(5) = "Bank2 Sensor2"
SensorLab(6) = "Bank2 Sensor3"
SensorLab(7) = "Bank2 Sensor4"
'Response: (l)=testmode, (2)= TestID, (3)=Sensor_Location, (4)=data_HighByte
Dim Value As Single
Dim i As Byte
Dim Step As Integer
If Response(l) o &H45 Then
Debug.Print "RESPONSE ERROR"
Else
Select Case Response(2)
Case &H1 To &H9
For i = 0 To 7
If Response(3) = 2 ^ (i) Then
'Label2(0).Capfion = "02 Sensor Locafion: " & SensorLab(I)
'Use the selected sensor directly.
Label2(0).Caption = "02 Sensor Locafion: " & SensorLab(SensorLoc)
Exit For
End If
Next i
Value = Calculation(CLng(Response(4)), Response(2))
txt02SensorData(Response(2)).Text = Value
End Select
End If
End Sub
Private Funcfion Calculation(DataIn As Long, Index As Byte) As Single
Dim Min(&Hl To &H9) As Single
Dim Scaling(&Hl To &H9) As Single
101
Dim Max(&Hl To &H9) As Single
Dim J As Integer
'MIN ARRAY & Scaling Array
For J = &H1 To &H9
Min(J) = 0 'Min Array
Scaling(J) = 0.005 'Scaling Array
Next J
Scaling(5) = 0.004: Scaling(6) = 0.004
Scaling(9) = 0.04
'MAX ARRAY
Calculafion = Min(Index) + Scaling(Index) * Datain
End Function
Private Sub Form_LoadO
Dim i As Integer 'set all disabled and invisible first.
For i = 0 To 9
Label2(i).Enabled = False
txt02SensorData(i).Visible = False
Next i
'then recover those selected PID
Label2(0).Enabled = True
For i = 0 To 99
IfTestID(i) = OThen
Exit For
Else
Label2(TestID(i)).Enabled = True
txt02SensorData(TestID(i)).Visible = True
End If
Next i
End Sub
Private Sub Timerl_TimerO
Static pointer As Integer
pointer = pointer + 1
Const maxium = 9
If pointer >'maxium Then
pointer = 1
102
End If
Response(l) = &H45
Response(2) = pointer
Response(3) = &H10
Response(4) = &H33
Call FormActivate
'For the true call to OBDII
Static i As Integer
i = i+ 1
If i >= TestlDSelNum Then
i = 0 'reset TestID counter if bigger than selected TestID Num.
End If
Request(l) = &H5
Request(2) = TestlD(i)
For J = 3 To 7
Request(J) = 0
Next J
Dim reply As Byte
'reply = SendRequest(Request(l), Response(l))
'Call FormActivate
End Sub
/* Code to control the request*/
Private Sub cmdCancel_ClickO
Unload Me
End Sub
Private Sub cmdOK_ClickO
Dim i As Integer
Dim reply As Byte
If Checkl(0).Value = Checked Then
'send request
Response(l) = &H8
Response(2) = &H1
For i = 3 To 7
Response(i) = &H0
Next i
'reply = SendRequest(Request(l), Response(l))
MsgBox "Control request has been sent."
103
Unload Me
Else
MsgBox "Please select the Control Test'
Exit Sub
End If
'Reply = SendRequest(Mode, PID)
'Details continued
End Sub
Private Sub Form_LoadO
End Sub
104
/* This code is to request DTC by status.*/
Private Sub cmdCancel_ClickO
Unload Me
End Sub
Private Sub cmdOK_ClickO
Dim i As Integer
Dim Status As Integer
Status = 0
For i = 0 To 7
If Checkl(i). Value = Checked Then
Status = Status + 2 ^ (7 - i)
End If
Next i
If Status = 0 Then
MsgBox "Please check at least one status!"
End If
End Sub
Private Sub FormLoadO
End Sub
/* This code is to request status of DTC */
Private Sub Optionl_Click(Index As Integer)
Label3. Visible = True
txtDTC(O). Visible = True
txtRemarks(O). Visible = True
txtDTC(0).SetFocus
End Sub
Private Sub cmdOK_ClickO
Dim Mode, PID As String
Mode = "17"
Select Case True
Case Opfion 1(0). Value
'SendRequest(Mode)
Case Optionl(l).Value
•PID="00 00"
105
'SendRequest(Mode, PID)
Case Opfion 1(2). Value
'PID="40 00"
'SendRequest(Mode,PID)
Case Option I (3). Value
•PID="80 00"
'SendRequest(Mode,PID)
Case Option I (4). Value
If txtDTC(0).Text = "" Then
MsgBox "Input the DTC please.'
Else
'convert the string to PID
' S endRequest(Mode, PID)
End If
End Select
End Sub
/* This code is to clear DTC */
Private Sub cmdSearchClickO
If OptionI(4).Value = False Then
MsgBox "Click the OK Button to Clear please."
Exit Sub
Elself txtDTC(O) = "" Then
MsgBox "Please Input the DTC you want to Clear."
Exit Sub
Else
datDTCs.Recordset.FindFirst "DTC = '" & txtDTC(O) &
txtRemarks(0).Text = datDTCs.Recordset.Fields(l).Value
Exit Sub
End If
End Sub
Private Sub Form_Load()
End Sub
Private Sub Opfionl_Click(Index As Integer)
Label3. Visible = True
txtDTC(O). Visible = True
txtRemarks(O). Visible = True
txtDTC(0).SetFocus
End Sub
106
/* This code is used to select the Freeze PID*/
Private Sub cmdBackClickO
End Sub
Private Sub cmdCancel_ClickO
Unload Me
End Sub
Private Sub cmdNext_ClickO
End Sub
Private Sub cmdOK_ClickO
Dim i, J, Total As Integer
'clear PID2 group
For i = 0 To 99
PID2(i) = 0
Next i
'get which has been checked
For i = &H3 To &HD
If Checkl(i - 3).Value = Checked Then
PID2(Total) = i
Total = Total + 1
End If
Next i
Debug.Print "Total", Total
For J = 0 To Total - 1
Debug.Print "PID2", Hex(PID2(J))
Next J
'Provide some response here
Response(l) = &H42
Response(2) = &H3
Response(3) = &H1
Response(4) = &H2
Unload Me
frmDisplayFreezeData. Show vbModeless
End Sub
107
Private Sub FormLoadO
End Sub
/* This code is to check the test status*/
Private Sub FormLoadO
Dim reply As Byte
Dim i As Integer
'construct request
Request(l) = &Hl
Request(2) = &H1
For i = 3 To 7
Request(i) = &H0
Next i
'Send Request
'reply = SendRequest(Request(l), Response(I))
Response(l) = &H41
Response(2) = &H1
Response(3) = &HD
Response(4) = &H77
Response(5) = &H77
Response(6) = &H77
Response(7) = 0
If Response(l) o &H41 Then
Debug.Print "RESPONSE ERROR"
Elself Response(2) o &H1 Then
Debug.Print "RESPONSE ERROR"
Else
'Get the # of DTC and MIL Status
If Response(3) >= 128 Then
DTCNum = Response(3) - 128
MEL = True
Else
DTCNum = Response(3)
MIL = False
End If
'Get the status of Test.
Call BytetoBh(Response(4))
For i = 0 To 2
Label2(i).Enabled = Bit(i)
108
IfBit(i) = False Then
Check l(i). Value = Gray
End If
Next i
For i = 4 To 6
If Bh(i) Then
Checkl(i - 4).Value = Checked
End If
Next i
Call BytetoBh(Response(5))
For i = 0 To 7
Label2(3 + i).Enabled = Bit(i)
Nexti
Call BytetoBh(Response(6))
For i = 0 To 7
If Bh(i) Then
Checkl(3 + i).Value = Checked
End If
Next i
End If
End Sub
/* To select the oxygen sensor ID code */
For J = 0 To TestlDSelNum - 1
Debug.Print "TestID", Hex(TestID(J))
Next J
'get which sensor has been selected, if not, notice user
SensorSelected = False
For J = 0 To 7
If Option I (J). Value = True Then
SensorLoc = J
SensorSelected = True
Exit For
End If
Next J
If SensorSelected = False Then
MsgBox "Please Select Sensor Location!"
Exit Sub
End If
Debug.Print "SensorLoc", SensorLoc
109
Unload Me
frmDisplay02Sensor.Show vbModeless
End Sub
Private Sub Label2_Click(Index As Integer)
End Sub
110
PERMISSION TO COPY
In presenting this thesis in partial fulfillment of the requirements for a
master's degree at Texas Tech University or Texas Tech University Health Sciences
Center, I agree that the Library and my major department shall make it freely
available for research purposes. Permission to copy this thesis for scholarly
purposes may be granted by the Director of the Library or my major professor.
It is understood that any copying or publication of this thesis for financial gafn
shall not be allowed without my further written permission and that any user
may be liable for copyright infringement.
Agree (Permission is granted.)
S t u ^ n t ' s Signature
Disagree
Date
(Permission is not granted.)
Student's Signature
Date