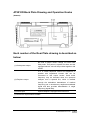
1
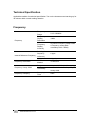
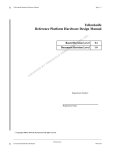
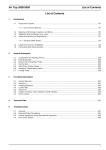
AT5010D Spectrum Analyzer User manual AT5010D High performance digital synthesis design Broadband frequency range Broadband dynamic range Mobile communication testing function 7-inch TFT LCD AT5010D SPECTRUM ANALYZERS Thanks for using our products, please read this manual thoroughly before Contents AT5010D Spectrum Analyzer ..........................................................................1 Near Field Probe AZ530 series (selective)................................................................. 5 Frequency Extender AT5000F series (selective)........................................................ 7 AT808 Special Radio Frequency Signal Source (selective) ....................................... 8 General instructions......................................................................................... 10 Signals ..................................................................................................................... 10 Safety......................................................................................................................... 11 Using conditions........................................................................................................11 Product Warranty ......................................................................................................11 Maintenance ............................................................................................................ 12 Product overview ............................................................................................... 13 Instruction ................................................................................................................ 13 AT5010D Front Plate Drawing and Operation Knobs (buttons) ............................. 15 AT5010D Back Plate Drawing and Operation Knobs (buttons) ............................. 17 Introduction of Spectrum Analyzer ......................................................... 18 Categories of Spectrum Analyzer............................................................................. 18 Requirements of Spectrum Analyzer ........................................................................ 20 Measurement of Frequency ..................................................................................... 20 Resolution ................................................................................................................ 21 Sensitivity................................................................................................................. 22 Video filter ................................................................................................................ 23 Sensitivity of spectrum analyzer............................................................................... 23 Frequency response ................................................................................................ 25 AT5010D Spectrum Analyzer AT5010D Purpose AT5010D spectrum analyzer can be used very well to check both the wired and wireless systems like remoter/ intercom/transmitter and receiver measurer/cordless telephone/cable television, CATV and communication machine and so on and also to analyze and compare the signal frequencies. AT5010D spectrum analyzer can be used to check signals of handset radiofrequency circuit like vibration signal/ intermediate-frequency signal/transmit signal and so on. It is very fast and correct to check the fault points of the handset not accessible into network by using AT5000 series analog spectrum analyzer. The spectrum analyzer usually shows the information like voltage/power/circle/wave shape/sideband and frequency of the original signals which are not handled yet. The commonly used measurements of spectrum analyzer are spectral distortion/ dual tone inter-modulation distortion and clutter detection. Electromagnetic compatibility testing (EMC) feature is used to measure the function of harmful electromagnetic wave radiated from kinds of electronic equipment. Also, the AM/FM detection signal output from the PHOTE (earhole) hub can be used to identify the broadcast signal influenced by noise. From authentication’s opinion, the measurement of radiation noise in advance is very effective measuring function to the evaluation and analysis. The spectrum analyzer is also used widely in teaching and scientific research. The analyzer really can show the image of electric signal like Radio frequency pulse signals deployed by Fu Li blade series, which make teaching easier to understand and scientific research more clear. www.attenelectronics.com 1 Technical Specification Applicable condition for technical specification: Turn on the instrument and warming up for 30 minutes within normal working situation. Frequency Frequency Frequency Range 0.15~1050MHz Frequency Display Resolution 10kHz Frequency Display Accuracy Internal Reference Frequency Frequency Generation Frequency Sweep Width Frequency Sweeping 2 www.attenelectronics.com ≤±(10kHz+Frequency sweep width x Frequency sweep width uncertainty+50% x RBW) Stability (for frequency reference) ±1ppm Aging rate ±5ppm/year Generation Method TCXO,DDS Range 0Hz, 1~1000MHz ( 1-2-5 stepping) Uncertainty ± 10% x indicative the frequency sweep width Sweeping Time 50ms Range (Relative Gauge Point) 150kHz~1GHz Range Range Frequency Response -100dBm ~+10dBm Display 7" TFT 800 (H) X 480 (V), 8X10 grid Display scale 10dB/div, logarithm Display range 80dB (10dB/div) Frequency Response (Zero Sweep width, 400kHz RBW, -40dBm signal) +2dB ~ -5dB Setting Range 0~40dB, 10dB stepping Uncertainty 10dB hours, ≤ ± 2dB; 30dB/40 dB hours, ≤ ± 3dB Minimum average noise base < - 100dBM (20kHz RBW,4kHz VBW) Input Attenuation Noise Range Referenced Electrical level Intermodulation(IM) Resolution bandwidth (RBW) - 90dBm ~ + 10dBm resolution ratio 0.5dB stepping Uncertainty (frequency 50 MHz, -40dBm, zero sweep width, 400 kHz RBW) ≤ ± 2dB Three order intermodulation( A two signal level -30dBm, frequency interval >3MHz) ≤ - 60dBc Two harmonic suppression(-30dBm, zero dB attenuation, >3MHz) ≤ - 50dBc RBW option 20kHz, 400kHz RBW uncertainty ±50% shape factor 60dB/3dB percentage < 15:1 Conversion error ≤ ± 2dB Video bandwidth(VBW) 4kHz www.attenelectronics.com 3 Input/output RF input Test Signal output Connector BNC(Female) Impedance 50Ώ Max DC output voltage ±25V Maximum continuous wave RF input +20 dBm (10~40dB attenuation), +10dBm (0dB attenuation) VSWR( attenuation ≥10db) Representative value, 1.5:1 Connector BNC(Female) Frequency 50MHz Impedance 50Ώ Electrical level -40dB±2dB Probe power voltage DC+6V±0.5V Audio output Audio output Φ 3.5mm, Audio connector General Technical Specification Warm-up Time > 30 min Working Temperature 0~40°C Storage Temperature Input Voltage Range DC 10.5v ~26v, AC adapter Power Dissipation < 15W Overall n(WXHXD) Weight 4 -20~70°C www.attenelectronics.com 140 x 350 x 160mm About 4 kg Near Field Probe AZ530 series (selective) AZ530 is the ideal tool kit for the investigation of RF electromagnetic field. During the product development stage, it is the necessary measure to test the electromagnetic interference pre authentication before the product is taken over to the third party for testing. The kit includes 3 hand-held probes with a built-in pre-amplifier covering the frequency range from 100 KHz to over 1000MHz. These probes include one magnetic field probe and one high impedance probe which can all match with the spectrum analyzers or 50 Ώ input impedance of radio frequency receiver (RFR). The power supply can be battery and nickel-cadmium cell or that transmitted from the spectrum analyzers through power line, and the signal transmission is done through 1.5 meters BNC cable. When the probe connects with the spectrum analyzer or the measuring receiver, the probe can find or determine the source of electromagnetic interference and evaluate the compatibility issues of the circuit board and prototype electromagnetic. The spectrum analyzer can help users to evaluate the launching site and the function comparison after be screened, and also can test the function screening and compatibility of the cable and components. Technical specification Frequency Range 0.1~ 1000MHz ( the lower frequency limit depends on the probe) Output Impedance 50Ώ Socket BNC head Input Electric Capacity 2pF ( high impedance probe) Max Input Electrical Level +10 dBm ( depends on frequency range) DC Input Voltage 20 Vmax Power Supply 6VDC, 4 AA batteries, spectrum analyzer power supply 8mA ( magnetic field probe) Supply Current 5mA (electric field probe) 24mA ( high impedance probe) Probe Dimension: 195 x 40 x 19(L x W x H)mm Shell Plastic ( electric screening inside) www.attenelectronics.com 5 Magnetic Near-Field Probe AZ530-M (selective) The magnetic near-field probe AZ530-M outputs voltage to the instrument connected with it, and the voltage is proportional to the intensity of RF magnetic field. The high frequency source of circuit can be close to each other through this probe and the intensity of magnetic field is inversely proportional to the cube of power distance. When the distance is doubled, the intensity of magnetic source will be 1/8 of the original point (H=1/d3, the letter “d” means distance). During practical application, the output voltage of the probe will increase quickly when the interference source appears, it is very easy to test the causes of the interference (e.g. IC) when producing the circuit board, and it can be seen from the spectrum analyzer that where the frequency making the maximum range interference is. Therefore, users can take measures to improve it until meet requirements of electromagnetic compatibility with a very good effectiveness. And also, the spectrum analyzer can be used to research the screening of leakage area and the interference leakage during cable and wire transmission. High Impedance Probe AZ530-H (selective) The high impedance probe (Hi-Z) can be used to measure individual connection points or RFI of printed circuit board and circuit board. It is a direct contact type probe with high impedance (close to insulation resistance of printed board) and electric capacity of only 2pF (80Ώ per 1GHz hour), therefore it can be connected directly without affecting the circuit relationship (not too much). It can be used to test individual points of the circuit board, for example, to measure the filter or other vibration resistance circuit quantitatively, some IC pins can be deemed as the source of RFI. The probe output is low impedance and can be connected to 50Ώ input end of spectrum analyzers through this high impedance probe to the measure point of circuit. 6 www.attenelectronics.com Electric Field Unipolar Probe AZ530-E (selective) E-field unipolar probe has the highest sensitivity among the three kinds of probes. Its sensitivity is high enough to be the active antenna of radio or television to probe the circuit board or the electric field intensity distributed during equipment operation. For example, it can be used to determine the effectiveness of screening and the same of measuring filter, and to measure RFI produced by electric source. In addition, Efield probe can be also used to do relative measurement in identification test, thus it can implement corrective compression (interference) measurement so as to be determined when submitting identification. Therefore, it can be assured that no problem will happen when implementing formal testing after pre-authentication testing. Frequency Extender AT5000F series (selective) Nowadays the sale price for 3000MHz spectrum analyzer is up to several ten thousand in the current market which is unaffordable for radio amateur/ maintenance personnel and even medium and small-sized enterprises. But signals over 1000MHz takes up much percentage in the telecommunication market, such as the vibration signal of handset is between 1000~2000MHz, and some signals wave in above 2000MHz, even in 800MHz and 2400MHz and so on. Based on above said situation and also keepin in mind the world market, Nanjing Glarun Atten Electronics Co. Ltd produced a new frequency extender with low price. The frequency can be extended to 105-2050MHz when AT5000F is used together with 1000MHz of AT5010D series spectrum analyzer, e.g.: One signal of 800MHz can be tested and shown on the AT5010D spectrum analyzer when AT5010D is used together with AT5000F1, at the moment the signal tested shall plus 1000MHz, i.e. signal tested shall be 1800MH. Frequency of AT5000F2 can be extended to 2050-3050MHz; frequency tested shall be the sum of display frequency plus 2000MHz. Frequency of AT5000F3 can be extended to 3050-4050MHz; frequency tested shall be the sum of display frequency plus 3000MHz. www.attenelectronics.com 7 AT808 Special Radio Frequency Signal Source (selective) AT808 handset signal source is an analog signal of radio-frequency signal of cellular handset receiving frequency, mainly used to maintain mobile receiver fault, and it is the best partner of spectrum analyzer. The purpose of AT808 special radio frequency signal source is: Because the mobile received signal radiated from the base site is not stable, generally ranging from -70dBm~-90dBm, and some places have weaker and even no signals at all. In order to facilitate most maintenance personnel to use spectrum analyzers to measure and analyze radio-frequency circuit especially intermediate-frequency signal conveniently, Atten Electronics Company produced AT808 handset radio-frequency signal source. When it is used together with AT5010D spectrum analyzers the zero receiving and receiving fault can be tested. The operation of AT808 radio-frequency signal source is simple, and it will be more convenient in maintenance of receiving faults of mobile phone when using together with spectrum analyzers. If you know better about the handset circuit, then you can maintain the receiving faults of all handsets quickly and correctly by using radio-frequency signal source and spectrum analyzers. The features of AT808 radio-frequency signal source are: Output the adjustable radio-frequency signal between 935 MHz and 960MHz and set 3 fix frequency outputs through operating the buttons. They are respectively 945MHz of 50 information channel/950MHz of 75 information channel and 955MHz of 100 information channel. It can make sure to output the concrete and fix radio-frequency signals with inside phase locked circuit by using the fix point frequency output, so as to measure stably and easily if the receiving medium frequency and after- the –circuit are normal. The signal range outputted by radio-frequency signal source is from -85 dBm ~-20dBm and different range of signal output can be set though operating the attenuation buttons. During checking zero receiving faults, the output of signal generator is set usually at about – 20dBm (do not press any attenuation button, the range of signal source output at the moment is -20dBm). When checking the bad receiving faults, the range of signal source output at the moment is about-70dBm (press the attenuation button of 20dB/20dB/10dB at same time, and the range of signal source output at the moment is -70ddBm). 8 www.attenelectronics.com As to the Motorola and Nokia handsets, the fault handsets can be set under testing conditions, and the working information channel of receiver is 75 information channel (i.e. 950MHz), point frequency of 75 information channel of radio-frequency signal source is ok, that means only when the working information channel of fault handsets is corresponding with the same one of AT808 signal source, can the signal of signal source be transmitted into the handsets. As to other handsets, the radio-frequency signal can be set on any information channel, but can be implemented only when using together with spectrum analyzers. When connecting the radio-frequency signal source and handsets, it can be realized this step by connecting the signal source to the antenna contacts of fault handsets through radio-frequency cable. www.attenelectronics.com 9 General instructions The operation of AT5010D spectrum analyzer is easy to manage, the reasonable regulators layout make users easy to handle its operation. However, even experienced users shall read the Instruction first to know all the functions. After opening the box, users need to check if there are mechanical parts damaged and loose, it is required to inform supplier immediately in case of any transportation damages, and this instrument cannot be put into service. Signals Attention- refer to Instruction Danger- high voltage Earth-protection (earth) terminal 10 www.attenelectronics.com Safety Using conditions This instrument is used inside door, and the allowed using environment temperature range is +10°C (±50°F) ~ +40°C ( +104°F). It can also be used in limiting situations with temperature is +10°C (±50° F) ~ -10°C ( +14°F), the safety will not be decreased with a short time using. The allowed transportation and storage temperature range is -40°C(-40°F) ~+70°C ( +158°F). The maximum using height is 2200m (5000m when not working). The maximum relative humidity is 80%. In case of water condensation on the instrument, it shall be necessary to assimilate with environment first before power on. Under some special situations (e.g. the temperature of the spectrum analyzer is very low) the instrument shall be recovered for 2 hours before power on. The instrument shall be placed in clean and dry room, and used in places without explosion/corrosion/dust and humidity. The spectrum analyzer can be used in any place but shall not resist convective cooling. The instrument shall be placed horizontally when working continuously, it is better to hold it up a little with a bracket. the deviation listed by the index is only effective when the environment temperature is between +15°C( +59°F) and +30°C ( 86°F) and also the instrument is warmed up for 60 minutes. The value without considering the error is the typical average value of every instrument. Product Warranty ATTEN provides one year free warranty for the material and manufacturing defects of its produced and on-sale products. This warranty is not applicable to any defects or damages arising from improper use or improper maintenance and man-made defects, ATTEN will be not constrained to provide service. Even though the instruments can be repaired under the warranty conditions, it is required to charge materials fees properly if the damages are caused because of installation / maintenance/ service or changing implemented by non-ATTEN personnel. Users shall contact and inform the distributors of this product so as to get the warranty service. www.attenelectronics.com 11 Every set of instrument has been gone through ageing time for 10 hours and the quality is also tested before leave the workshop, and the earlier effectiveness lose can be eliminated with this testing method. It is suggested to save its package during mail-transportation/rail or containerized transport. This warranty is not applicable to the damages occurred during transportation and rude carrying. When instruments break down, it is required to indicate the fault phenomenon and the mail address so as to promote the maintenance efficiency. Maintenance Every important performance of the spectrum analyzer shall be checked carefully periodically, only by which can the signal displayed be assured to have the accuracy degree based on the technical data. The appearance of instrument shall be cleaned with dust brush periodically, and the machine body and the handle and some other dirt difficult to remove can be cleaned with wet cloth (99% of water combined with 1% neutral detergent), the oil dirt can be cleaned by alcohol or washing gasoline (mineral ether), the screen can be cleaned by water or washing gasoline (alcohol or solvent is not allowed), after the above said steps, it is must to wipe the instrument with a piece of dry and clean cloth and it is not allowed to leak the cleaning solvent into the instrument. It is harmful for the plastic components and the coating surface to use other cleaning products. 12 www.attenelectronics.com Product overview This instrument can be used to test the spectrum component of electrical signal with a frequency range waves from 0.15 to 1050MHz, and the signal tested and its composition must be periodical. As to the oscilloscope working under Yt mode that shows range in time domain while the spectrum analyzer is the display of range on frequency domain (Yf). Every spectrum component of one signal can be observed by spectrum analyzer while the same signal on the oscilloscope can be shown as one wave shape. Spectrum analyzer is actually a super heterodyne sweep-frequency receiver of 3 frequency conversion. The signal tested (f input =0.15 ~1050MHz) is arranged to the first mixer where the signal mixes with a signal voltage transmitted from voltage controlled oscillator (f local oscillator = 1350~ 2350MHz) which is called the first local oscillator. The deviation between the oscillator and input frequency (f local - f input= the first medium frequency) is the first medium frequency, which goes into the amplifier through tuning the band pass filter on 350MHz, and then pass 2nd mixer and amplifier. The second medium frequency is 35MHz while the third medium frequency is 2.875MHz. In the third medium frequency, the oscillator passes through one band pass filter of 400 KHz or 20 KHz selectively before getting to the amplitude demodulator. All the controlling methods can be realized inside RMA chip. Instruction It is required to read this manual before operate AT5010D spectrum analyzer, and not required to acquire special knowledge to use the instrument. The intuitive control panel and the constraint of basic functions can make sure the user to operate the spectrum analyzer immediately and effectively. But it is a must to comply with the basic instructions to make sure the instrument can be used to best extent. www.attenelectronics.com 13 Attention! The most sensitive component of AT5010D is the input part which includes the signal attenuator and the first mixer. The voltage compressed to the output end must not be over than +10dBm (0.7Vrms) AC or ± 25VDC without input attenuation. When 40dB maximum attenuation appears, the AC voltage must not be over +20dBm (2.2Vrms), all the said limits must not be exceeded, otherwise, the input attenuation and /or the first mixer can be damaged. When the spectrum analyzer implements measurements through LISN (Line impedance match network), the input of the analyzer must be protected by transient limiter. IT IS REQUIRED TO CHECK IF UNACCEPTABLE HIGH VOLTAGE EXISTS BEFORE MEASURING UNKNOWN SIGNALS, AND IT IS ALSO RECOMMENDED TO USE THE MAXIMUM ATTENUATION AND THE MOST WIDE FREQUENCY SWEEP RANGE ( 1000MHZ). THE USER ALSO SHALL CONSIDER IF HIGH SIGNAL AMPLITUDE OUT OF FREQUENCY RANGE (E.G. 1200MHZ) APPEARS, ALTHOUGH IT IS INVISIBLE. THERE IS NO INDEXES FOR FREQUENCY WITH RANGE FROM 0HZ ~150 KHZ IN THE AT5010D SPECTRUM ANALYZER, AND THE RANGE IS NOT CORRECT IF THE HIGH SIGNAL AMPLITUDE OUT OF FREQUENCY APPEARS WITHIN THE ABOVE SAID RANGE. Due to the frequency principle, a spectral line will appear on 0Hz which is called IF feed-through; the reason for this phenomenon is the first local oscillator sweeping the medium frequency. The height of spectral line varies due to different instruments. It does not indicate that the instruments have faults with the height of the line exceeding the full screen. 14 www.attenelectronics.com AT5010D Front Plate Drawing and Operation Knobs (buttons) Each number of the Front Plate drawing is described as below: (1) LCD Display Screen (2) Instrument Model (3) Power Switch Press the key and keep it for 1-2 seconds and the color of the turn-on light turns from red to blue, press and keep it for 3-5 seconds, the color of the shutdown light turns from blue to red. when red light flickers it means that the power input voltage is not in the range and cannot turn on the instrument, it is required to check if the power supply normal (4) Functional Keys Be used to select the menu. (5) Number Key Be used to input numbers. (6) Center Frequency Regulating Knob Be used to adjust Center Freg. (7) RFEQ Be used to set the center freq and CF Step. www.attenelectronics.com 15 (8) SPAN Be used to set the Span, Full Span, Zero Span. (9) AMPTD Be used to set the Ref Level, Attenuator. (10) MARKER Be used to mark markers, control ON and OFF and research Cont Peak. (11) PEAK SEARCH (12) MARKER → CF (13) RBW/VBW Be used to set the Res Bw and Video Bw. (14) AUTO One key can realize the signal research; the AUTO is used to research signals tested in all the frequency range automatically, and to adjust the parameters of frequency and range to be the instrument setting condition, the spectrum line is shown at the screen center. (16) DISPLAY Be used to set the Model and Brightness (17) RF INPUT Be used to input the signals tested. (18) RBW Be used to adjust the resolution bandwidth. (19) MARKER Be used to adjust the markers. (20) REF LEVEL Be used to adjust the reference level. (21) SPAN Be used to adjust the sweep width. (22) CF STEP Be used to adjust center frequency stepping 16 www.attenelectronics.com AT5010D Back Plate Drawing and Operation Knobs (buttons) Each number of the Rear Plate drawing is described as below: (1) Probe power output Be used to output +6VDC voltage for AZ530 near field probe. This power is special for them and the equipped electric wire will be provided together with AZ530. (2) Earphone output It is a 3.5mm earphone socket and earphone or speaker with impedance exceed 16Ώ can be connected to this output socket. Good audio frequency may be decoded when the spectrum analyzer tune a spectral line, which is realized through the modulation demodulator of medium frequency part. It decodes any amplitude-modulated signal and also provides demodulation of single frequency (signal filter). (3) Power input Special adapter is equipped with instrument. (4) Reference output 50MHz/-40dBm www.attenelectronics.com 17 Introduction of Spectrum Analyzer Categories of Spectrum Analyzer There are two categories for spectrum analyzer: sweep tuning and real-time analyzer. The sweep tuning one uses power to sweep and tune within frequency range, therefore, the spectral frequency of frequency spectrum is taken samples in turn as time passes by. So the sweep tuning spectrum analyzer can display the periodical and random signal but cannot measure display transient response. The real-time analyzer can display each component range of signal within the measuring range, which can maintain time attributes so as to display the phase signal information. The real-time analyzer can display transient response as well as the periodical and random signal. The sweep tuning analyzer includes tuned radio frequency and super heterodyne type. The TRF spectrum analyzer realizes spanning of expected frequency range with a tunable band pass filter of adjustable center frequency, and then the detector outputs in deflection status vertically on oscilloscope tube, the horizontal-sweeping generator sweeps filter as well as outputs to the horizontal deflection plate. This is a simple and cheap spectrum analyzer with wide frequency range, but the resolution ratio and sensibility are not good. Because the TRF spectrum analyzer is used to sweep filter and limited by the sweeping width, in this condition, the frequency range is also limited (usually less than 10 times frequency range). The resolution ratio depends on the bandwidth of filter, while the bandwidth varies with frequency. The difference of commonly used spectrum analyzer and TRF one is that the former is used to sweep a band-pass filter with a fix bandwidth while the latter is used to select signal frequency through sweeping band-pass filter. This is narrow-band receiver to compress the frequency of the local oscillator through zigzag voltage and realize electronic tuning to signals tested. Similarly, zigzag voltage is compressed to the horizontal deflector. The output of receiver is compressed to the vertical deflector of oscilloscope tube synchronously, and then the amplitude versus frequency diagram is shown there. 18 www.attenelectronics.com The tuning to the measuring frequency range by spectrum analyzer is realized through changing the tuning voltage of local oscillator. The local oscillator is mixed with the input signal and then generates medium frequency, and then be detected and shown in deflecting status. When the deviation of input signal and frequency of local oscillator equals to medium frequency, and then a response spectrum line appears on the spectrum analyzer. The advantages of super heterodyne technique are to realize high sensibility (because of intermediate amplification), so multiple harmonic waves of signals can also be seen on the spectrum analyzer except for the fundamental wave of signals. Similarly, changing the bandwidth of medium frequency filter is to change the resolution ratio. Certainly, the super heterodyne spectrum analyzer is not real-time, and its sweeping speed is always influenced by time constant of medium frequency filter. The spectrum line peak appeared on left of the oscilloscope tube can be called as 0 frequency indication or local oscillation pass by. When spectrum analyzer sweeps 0 frequencies, the local oscillation passes by medium frequency directly and generate peak lines on the oscilloscope tube, even same situation without any outer signal be input. (0 signal tuning means that local oscillation =center frequency of medium filter)., which affects the lower limits of spectrum analyzer. www.attenelectronics.com 19 Requirements of Spectrum Analyzer The spectrum analyzer must be specially calibrated in order to show accurate frequency and range of signal, and it must fulfill many requirements: Wide frequency display range Stability Resolution ratio Even frequency response High sensitivity Low inner distortion z z z z z z Measurement of Frequency Frequency marker has 3 kinds of different sweeping mode: full frequency range, each grid sweep width and 0 sweeping. The full frequency range has the most wide frequency range display and captures signals very quickly. ( Not all kinds of spectrum analyzers can provide this mode). Each grid sweep width is used to pull special signal close and observe it. The center frequency displayed is controlled by the tuning Knobs while the calibration factor is set by frequency width or sweeping width control. The spectrum analyzer operates like a fix tuning receiver with a selectable bandwidth when it places in 0 sweeping status. Absolute frequency measurement is usually acquired by the tuning plate of spectrum analyzer. The relative frequency measurement requires linear frequency sweep. The frequency deviation between the above said measurements can be acquired from the relative interval of the 2 signals on the measuring screen. It is very important that the spectrum analyzer is more stable than signals tested. The stability of spectrum analyzer depends on its local oscillator and can be expressed with the word of short or long period. The remaining frequency is an index of short stability and expressed with HZ peak. The short period stability can also be expressed as noise sideband; and it indicates the spectral purity of spectrum analyzer. The expression of noise sideband is several HZ distance far from the carrier frequency, and display dB value lower than carrier frequency by stipulated medium bandwidth. Long period stability means the frequency drift of spectrum analyzer local oscillation. The frequency drift means that how much value changed with the frequency during specified time, (e.g. HZ/minute, or HZ/ hour). 20 www.attenelectronics.com Resolution The signal frequency should be separated out before being measured by the spectrum analyzer. The separation means that the signal is separated from the nearest one. The resolution of the spectrum analyzer depends on the intermediate-frequency bandwidth. The intermediate-frequency bandwidth is generally defined as 3dB bandwidth of an intermediate-frequency filter. The ratio of 60dB bandwidth (Hz) of a radio receiver and the 3dB bandwidth (Hz) is regarded as rectangle coefficient. A smaller rectangle coefficient shows that the spectrum analyzer can more possibly distinguish adjacent signals with unequal amplitudes. If the rectangle coefficient is 15:1, two signals, the difference between which is 60dB, only can be separately measured by using separated frequencies with 7.5 times of intermediate-frequency bandwidths. Otherwise, only one signal is shown by the spectrum analyzer. The capability of distinguishing the two adjacent signals with unequal amplitudes not only depends on the rectangle coefficient of the intermediate-frequency filter in the spectrum analyzer but also can be reduced by using a noise sideband. The rectangle coefficient and the noise sideband appear at the inclined edge of the intermediate-frequency filter so as to reduce the out-of-band rejection capability of the filter. Therefore, the measurement of the resolution of the signals with unequal amplitudes is limited. The resolution of the spectrum analyzer is determined by the bandwidth of the narrowest intermediate-frequency filter. For example, the narrowest intermediate-frequency filter is 10 KHz, any two signals are signals which can be and always be separated from each other by 10 KHz. It is because the waveform scanned by the spectrum analyzer is the waveform of the intermediate-frequency filter like the waveform obtained when a carrier frequency scans through the intermediate-frequency filter. Because the resolution of the spectrum analyzer is limited by the bandwidth, it seems like that the infinitely good resolution rate can be obtained by infinitely reducing the intermediate-frequency bandwidth. However, the available intermediate-frequency bandwidth is actually limited by spectrum analyzer stability (residential frequency modulation). If the residential frequency modulation of the spectrum analyzer is 10 KHz, the residential frequency modulation can be used for reading the narrowest intermediate-frequency bandwidth of one single input signal, namely, 10 KHz. Any narrower intermediate-frequency filter may cause more responses than one or lose response (during single frequency input). Practical restriction belonging to the intermediate-frequency filter bandwidth is also available because the narrower filter has a longer time constant and consequently slower scanning is required. www.attenelectronics.com 21 Sensitivity The sensitivity is the capability of detecting a small signal through measurement. The highest sensitivity of the spectrum analyzer is restricted by internal noises. The noises can be substantially divided into the following two kinds: thermal (Johnson) noises and non-thermal noises. The thermal noise power is expressed as follows: z z z z z Pn=K.T.B; and in the formula, Pn = noise power (W), K = Boltzmann constant (1.38x10⁻²³ Joule/K), T = absolute temperature K, B = system bandwidth (Hz). It can be known from the above equation that the noise level is directly proportional to the bandwidth. Therefore, if the bandwidth is reduced by 10 times, the noise is reduced by 10dB and the sensitivity is increased by 10dB. The non-thermal noises are all noises which are not generated by thermal in the spectrum analyzer. The parasitic emission and the like caused by nonlinearity, mismatched impedances and the like of active components are all non-thermal noises. As measurement of the non-thermal noise, the noise coefficient is added by the thermal noise so as to obtain the total noise of the spectrum analyzer system. The system noise is shown on an oscillation tube so as to determine the highest sensitivity of the spectrum analyzer. Because the noise level varies with the bandwidth, the same bandwidth shall be used during the evaluation of the sensitivities of the two spectrum analyzers. The sweep frequency of one spectrum analyzer falls within a wide frequency range; however, this spectrum analyzer is a narrow pass band instrument. All signals appearing within the spectrum analyzer frequency range are converted into a single signal which must pass through the immediate-frequency filter; however, a detector can see the noise at any time, so the noises shown by the spectrum analyzer are all included within the immediate-frequency bandwidth. During the measurement of a discrete signal, the maximum sensitivity is obtained from the narrowest immediate-frequency width. 22 www.attenelectronics.com Video filter The video filter shall be used during measuring the small signal having the substantially same amplitude as the average noise level of the spectrum analyzer. The video filter is a low-pass filter before deflection, which averages the internal noises of the frequency spectrum. At the moment, the input signal can be seen. If a very narrow resolution bandwidth is used for the sweep frequency width, the video filter shall not be used because the video filter stops the amplitude of an analyzed signal from reaching a full value due to the video pass band property. Sensitivity of spectrum analyzer The sensitivity of one frequency spectrum analyzer can be shown in multiple forms. One is signal amplitude level whose power is the average noise power. The frequency spectrograph usually measures the signal and the noise. Therefore, when the input signal is equal to the internal noise level, the signal can be 3dB higher than the noise. When the signal power is added to the average noise power, the power level on the oscillation tube is doubled (increased by 3dB) because the signal power is equal to the average noise power. The maximum input level of the frequency spectrograph is damage level or burnout level of an input circuit. For an AT5000 series frequency spectrograph, the level is +10dBm before being input into a mixer and is +20dBm before being input into an attenuator. When the power condition of the burnout level of the frequency spectrograph is not reached, the frequency spectrograph begins to compress the gain of the input signal until reaching 1dB compression. No consideration of the gain compression is serious. The maximum input signal level is regarded as linear input level when the result generated by the maximum input signal level is less than 1dB gain compression. When the signal is higher than a 1dB gain compression point, the signal amplitude shown on the oscillation tube of the frequency spectrograph does not accurately represent the input signal level any more, and here the frequency spectrograph is regarded as working in a nonlinear state. When one signal is input into the frequency spectrograph, distortion can be generated in the frequency spectrograph. Most situations are caused by nonlinear characteristic of the input mixer. For the AT5010D series frequency spectrograph, the typical distortion value is www.attenelectronics.com 23 70dB lower than that of the input signal when the input signal level does not exceed -30bBm after being sent to the input of a first mixer. A larger input signal is regarded as the optimal input level of the frequency spectrograph at an input end together with a first maximum input signal. The signal passes through the attenuator before reaching the first mixer so that the signal reaching the mixer does not exceed -30dBm; otherwise, the product with frequency spectrum distortion can exceed the 70dB range listed by indexes. The 70dB non-distortion range is named as spurious-free dynamic range of the frequency spectrograph. The display dynamic range is defined as the ratio between a maximum signal and a minimum signal which can be simultaneously seen on the display screen when non-spectrum distortion appears. The use requirements of the dynamic range are as follows: the display range must be enough without spurious-free or unnecessary response; and the sensitivity must be enough to eliminate noises from the displayed amplitude range. The maximum dynamic range of the frequency spectrograph can be figured out from the indexes of the frequency spectrograph. First, the distortion index is looked up. For example, all spurious products shall be lower than 70dB when -30dBm is added to the input mixer. And then, the proper sensitivity is figured out. For example, it is -100dBm which is 70dB lower than -30dBm. We must detect the level; the requirement of the sensitivity on the bandwidth must be very wide; otherwise, the sensitivity can not be used. Finally, the display range shall be enough. Another remarkable point is that the spurious-free measuring range can be obtained by reducing the signal level sent to the first mixer. Only the sensitivity is affected. To ensure the maximum dynamic range on the screen, please refer to the following requirements: 24 ● The maximum input signal does not exceed the optimal input level of the frequency spectrograph (the maximum input signal is typically -30dBm when 0dB input is attenuated). ● Maximum input signal reaches top line of the oscillation tube (please refer to level line) www.attenelectronics.com Frequency response The frequency response of the frequency spectrograph is the flatness of the amplitude of the frequency spectrograph within the frequency range. If the frequencies of the two input signals with equal amplitudes are different from each other and the frequency spectra show the equal amplitude, the frequency conversion loss of the input mixer must not depend on the frequency. If the local oscillator voltage is much larger than the input signal, the frequency conversion loss of the input mixer is related to the frequency; therefore, the frequency response of the system is not linear. In order to obtain accurate measurement, the flatter the frequency spectrograph is within the frequency range, the better the response is. The flatness is very hard to correct because it generally restricts the amplitude accuracy. The first function of the frequency spectrograph is comparing the signal levels with different frequencies; and poor frequency response may seriously restrict the usability of the frequency spectrograph. 1dB compression point level is determined according to the practices, but not regarded as the upper limit of the dynamic range. On the other hand, the lower limit is the sensitivity of the frequency spectrograph; and as we know, the sensitivity of the frequency spectrograph is related to the (immediate frequency) bandwidth. The narrowest available bandwidth is restricted by residential frequency modulation of a tracking generator as well as tracking drift between the tuning frequency of the frequency spectrograph and an output signal of the tracking generator. www.attenelectronics.com 25 Add: Building A8, Tanglang Industrial Zone, Xili, Nanshan, Shenzhen, 518055, P. R. China Tel: +86-755-6161 8252 / 6161 8291 / 2655 9660 Fax: +86-755-8602 1299 E-mail: [email protected] Http:// www.attenelectronics.com www.gratten.com.cn