1
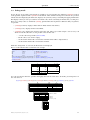
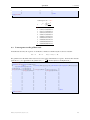
spreadtab v0.4c User’s manual Christian Tellechea [email protected] 6 november 2014 Abstract This package provides spreadsheet features for LATEX table environments. The main feature allows the user to construct tables in a manner similar to a spreadsheet where cells are used in formulas to generate values in other cells. The package computes the formulas in the correct order and finally displays the table with the numeric results. spreadtab CONTENTS Contents 1 Introduction 1.1 Presentation . . . . . . . . . . . . . . . . . . . . . . . . . . . . . . . . . . . . . . . . . . . . . . . 1.2 Motivation . . . . . . . . . . . . . . . . . . . . . . . . . . . . . . . . . . . . . . . . . . . . . . . . 2 2 2 2 Basic features 2.1 Absolute references 2.2 Relative references . 2.3 Text cells . . . . . . 2.4 Mixed cells . . . . . 2.5 Copy a formula . . . . . . . . . . . . . . . . . . . . . . . . . . . . . . . . . . . . . . . . . . . . . . . . . . . . . . . . . . . . . . . . . . . . . . . . . . . . . . . . . . . . . . . . . . . . . . . . . . . . . . . . . . . . . . . . . . . . . . . . . . . . . . . . . . . . . . . . . . . . . . . . . . . . . . . . . . . . . . . . . . . . . . . 3 3 3 4 4 5 3 Features for formatting the table 3.1 Decimal seprarator . . . . . . . . . . . 3.2 Number formatting and the fp package 3.3 End of lines and horizontal rules . . . . 3.4 Hide a row or column . . . . . . . . . . 3.5 Save the result of a cell . . . . . . . . . 3.6 Display the value of a cell . . . . . . . . 3.7 The use of \multicolumn . . . . . . . . . . . . . . . . . . . . . . . . . . . . . . . . . . . . . . . . . . . . . . . . . . . . . . . . . . . . . . . . . . . . . . . . . . . . . . . . . . . . . . . . . . . . . . . . . . . . . . . . . . . . . . . . . . . . . . . . . . . . . . . . . . . . . . . . . . . . . . . . . . . . . . . . . . . . . . . . . . . . . . . . . . . . . . . . . . . . . . . . . . . . . . . . . . . . . . . . . . . . . . . . . . . . . . . . . . . . . . . . . . . . . . . . 7 7 8 9 9 10 11 11 4 Macro-functions 4.1 Mathematical macro-functions . . . . . . . . . . . 4.1.1 Sum cells . . . . . . . . . . . . . . . . . . 4.1.2 The fact macro . . . . . . . . . . . . . . . 4.1.3 The sumprod macro . . . . . . . . . . . . . 4.1.4 Random numbers . . . . . . . . . . . . . . 4.1.5 GCD and LCM . . . . . . . . . . . . . . . 4.1.6 Scientific notation . . . . . . . . . . . . . 4.1.7 Identity . . . . . . . . . . . . . . . . . . . 4.2 Tests . . . . . . . . . . . . . . . . . . . . . . . . . 4.3 Macro-functions manipulating dates . . . . . . . . 4.3.1 Date to number with engshortdatetonum 4.3.2 From a number to a date . . . . . . . . . . 4.4 Coordinate macro functions . . . . . . . . . . . . . . . . . . . . . . . . . . . . . . . . . . . . . . . . . . . . . . . . . . . . . . . . . . . . . . . . . . . . . . . . . . . . . . . . . . . . . . . . . . . . . . . . . . . . . . . . . . . . . . . . . . . . . . . . . . . . . . . . . . . . . . . . . . . . . . . . . . . . . . . . . . . . . . . . . . . . . . . . . . . . . . . . . . . . . . . . . . . . . . . . . . . . . . . . . . . . . . . . . . . . . . . . . . . . . . . . . . . . . . . . . . . . . . . . . . . . . . . . . . . . . . . . . . . . . . . . . . . . . . . . . . . . . . . . . . . . . . . . . . . . . . . . . . . . . . . . . . . . . . . . . . . . . . . . . . . . . . . . . . . . . . . . . . . . . . . . . . . . . . 12 12 12 13 13 13 14 14 15 15 16 16 16 17 5 Particular care 5.1 Defining new commands with \hline . . . 5.2 The use of \multicolumn and \SThidecol . 5.3 Messages delivered by spreadtab . . . . . . 5.4 Debug mode . . . . . . . . . . . . . . . . . . . . . . . . . . . . . . . . . . . . . . . . . . . . . . . . . . . . . . . . . . . . . . . . . . . . . . . . . . . . . . . . . . . . . . . . . . . . . . . . . . . . . . . . . . . . . . . . . . . . . . . . . . . . . . . . . . . . . . . . . 18 18 19 20 21 6 Examples 6.1 Pascal’s triangle again! . . . . . 6.2 The convergence of a series . . . 6.3 Convergence to the golden ratio 6.4 A billing table . . . . . . . . . . 6.5 A magic square . . . . . . . . . 6.6 A pyramid of additions . . . . . . . . . . . . . . . . . . . . . . . . . . . . . . . . . . . . . . . . . . . . . . . . . . . . . . . . . . . . . . . . . . . . . . . . . . . . . . . . . . . . . . . . . . . . . . . . . . . . . . . . . . . . . . . . . . . . . . . . . . . . . . . . . . . . . . . . . . . . . . . . . . . . . . . . . . . . . . . . . . . . . . . . . . . . . . . . . . . . . . . . . 22 22 22 23 24 24 25 LATEXed by Christian Tellechea, the November 6, 2014. . . . . . . . . . . . . . . . . . . . . . . . . . . . . . . . . . . . . . . . . . . . . . . . . . . . . . . . . . . . . . . . . . . . . . . . . . . . . . . . . . . . . . . 1 spreadtab 1 1 INTRODUCTION Introduction 1.1 Presentation This package allows us to construct tables in a manner similar to a spreadsheet. The cells of a table have row and column indices and these can be used in formulas to generate values in other cells. The package requires ε-TEX, LATEX 2ε and the fp package, which performs arithmetic on cell values. Also, the xstring package is needed in its v1.5d [2010/03/28] version or later. The package is compatible with all tabular environments, and assumes that ‘&’ is used to delimit columns and ‘\\’ to end lines (but see page 3). This compatibility requirement led me to program spreadtab so that it works independently of the table environment. Thus, reading the table, processing and calculating the formulas is done before the environment table ‘sees’ the body of the table. Consequently, spreadtab proceeds in 3 main stages before \begin{<table environment>} sees the table: • first, it reads the body of the table, divides it in lines and cells, and in each cell, seeks a possible formula; • then, it computes the formulas in the cells, taking care for each to previously calculate all the dependent cells. The calculations are done by the fp package; • finally, it is necessary to rebuild the table, replacing each formula by its numerical calculated value and handing over to the environment name specified by the user. The syntax in both the following is allowed (and equivalent), where <name> is the name of any table environment available with LATEX or with a package: 1 2 3 \begin{spreadtab}{{<name>}{<parameters>}} table with formulas and numbers \end{spreadtab} 1 or 2 3 \spreadtab{{<name>}{<parameters>}} table with formulas and numbers \endspreadtab After the work of spreadtab, we get a display as if we had written: 1 2 3 \begin{<name>}{<parameters>} table with numbers \end{<name>} Although having features resembling those of a spreadsheet with LATEX is appreciable, the 3 stages described above take time, and above all, fp is slow in its calculations. The spreadtab environment leads to much slower compilation than with a classical table. Moreover, spreadtab cannot stand in for a spreadsheet program. Indeed, it has very few features, and it does not provide visual assistance. This point may cause difficulty1 for big or complex tables. The syntax of spreadtab is also another difficulty. However, the advantage of this package is that it makes it possible to write in the LATEX code tables involving calculation when these tables are usually exported2 from a spreadsheet program to LATEX code. Consequently, it becomes possible to avoid the disadvantages of the exportation programs: fine tuning often necessary to obtain exactly what you want, exported tables containing the values only (formulas are lost when exportation is done), no compatibility with all types of environments, exportation must be started again if a single number or formula is modified in the table. 1.2 Motivation A few months before I started to write this package, Derek O’Connor had pointed out that nothing was available in the world of LATEX packages to imitate – even a little – the behaviour of spreadsheet programs. I found the challenge interesting and I started writing this package as a good programming exercise. The road was long before reaching this version and I especially want to thank Christophe Casseau for his early interest and for the suggestions he made, and more recently Derek O’Connor for his advice and for the constructive discussions we have had. I also thank Andrew Parsloe for proofreading the english translation of this manual. 1I 2I certify that, with use, this discomfort tends to disappear (if you do not work with huge tables, of course). mention the two main exportation programs: cacl2latex for ‘calc’ (Open Office), and excel2latex for ‘excel’ (Microsoft Office). LATEXed by Christian Tellechea, the November 6, 2014. 2 spreadtab 2 2 BASIC FEATURES Basic features A table is a rectangular array of cells which may be viewed as a set of cells arranged in horizontal rows or vertical columns. By default, spreadtab expects a ‘\\’ at the end of lines, which is usual in tables. This end of line marker can be changed via the \STeol{<macro>} command. We can write for example \STeol{\tabularnewline}. It is important to remember that the ends of lines to be inserted in the final table will always be ‘\\’ even if the end of line marker that spreadtab sees when it reads the table is different. 2.1 Absolute references A table cell is identified by the pair <colref><rowref>3 , where: • <colref> is a letter from a to z, and a is the first column on the left: it is limited to 26 columns, which should be sufficient for the majority of cases; the letter can be upper or lowercase; • <rowref> is a positive integer representing row number. The row number 1 is the top row. Here are examples of absolutes references: b4 or C1 or d13. Locations of cells appear clearly in the spreadsheet-like table below: A B C D E 1 2 3 4 5 This example calculates the sum of each row and each column and then calculates the grand total: 1 2 3 4 5 6 7 \begin{spreadtab}{{tabular}{rr|r}} 22 & 54 & a1+b1 \\ 43 & 65 & a2+b2 \\ 49 & 37 & a3+b3 \\ \hline a1+a2+a3 & b1+b2+b3 & a4+b4 \end{spreadtab} 22 43 49 114 54 65 37 156 76 108 86 270 For people familiar with maths, this other example calculates the first lines of Pascal’s triangle: 1 2 3 4 5 6 7 \begin{spreadtab}{{tabular}{ccccc}} 1 & & & & \\ a1 & a1 & & & \\ a2 & a2+b2 & b2 & & \\ a3 & a3+b3 & b3+c3 & c3 & \\ a2 & a4+b4 & b4+c4 & c4+d4 & d4 \end{spreadtab} 2.2 1 1 1 1 1 1 2 3 4 1 3 6 1 4 1 Relative references To refer to a cell, it may be convenient to specify its position relative to where the formula is written. Thus, the relative coordinates of a cell are 2 relative numbers written using this syntax: [x,y] where x is the horizontal offset from the cell containing the formula and y is the vertical offset. For example, [-2,3] refers to the cell located 2 columns before (on the left) and 3 rows after (below) the cell where the formula is located. 3 Note: this is the opposite to the standard matrix convention LATEXed by Christian Tellechea, the November 6, 2014. 3 spreadtab 2 BASIC FEATURES Here is the same table as above but the references are relatives and the matrix environment of the amsmath package is used: 1 2 3 4 5 6 7 8 9 $ \begin{spreadtab}{{matrix}{}} 1\\ [0,-1] & [-1,-1]\\ [0,-1] & [-1,-1]+[0,-1] & [-1,-1]\\ [0,-1] & [-1,-1]+[0,-1] & [-1,-1]+[0,-1] & [-1,-1]\\ [0,-1] & [-1,-1]+[0,-1] & [-1,-1]+[0,-1] & [-1,-1]+[0,-1] & [-1,-1] \end{spreadtab} $ 1 1 1 1 1 1 2 3 4 1 3 6 1 4 1 We note that relative references are more appropriate here, since only 2 different references are used: [0,-1] which refers to the cell above and [-1,-1] which refers to the cell located to the NW of the current cell. Absolute and relative references can be mixed in a formula. 2.3 Text cells If you want to put only text in a cell, you must tell spreadtab that the cell should not be calculated. Simply place somewhere in the cell the character ‘@’ with its usual catcode 12. The cell will be ignored by spreadtab which will consider it as an inert cell impossible to reference4 elsewhere in the table. Example: 1 2 3 4 5 \begin{spreadtab}{{tabular}{|r|ccc|}} \hline @ values of $x$ & -5 & -1 & 4 \\ @ $f(x)=2x$ & 2*[0,-1] & 2*[0,-1] & 2*[0,-1] \\\hline \end{spreadtab} values of x f (x) = 2x -5 -10 -1 -2 The control sequence \STtextcell expands to the character ‘@’. \renewcommand\STtextcell{‘}, a cell containing the char ‘ will 4 8 It is possible to redefine it; for example, after be understood as a text cell. Moreover, if a cell is empty or filled with spaces, spreadtab will consider it as a text cell. 2.4 Mixed cells In reality, each cell is composed of two fields. The first is a numeric field containing the formula; the second is a text field, ignored by fp and not taken into account for calculations: • if nothing is specified in a cell, the entire cell is the number field, and the text field is empty (this was the case for all table cells of Pascal’s triangle seen above); • if the cell contains the ‘@’ character, then the entire cell is the text field. The numeric field is empty and inaccessible; • if the cell contains the marker ‘:=’, then the following argument between braces is the numeric field, and everthing else is the text field. The cell has this structure: <text field>:={numeric field}<end of text field> The marker ‘:=’ is the expansion of the control sequence \STnumericfieldmarker. It is possible to redefine it, for example: \renewcommand\STnumericfieldmarker{\=} In this case, the expansion of the marker ‘\=’ would have no importance and would not be involved in the process. For spreadtab, it is only a token showing where the formula begins. This token is sought and recognized but is never expanded. 4 There is an exception, see page 16. LATEXed by Christian Tellechea, the November 6, 2014. 4 spreadtab 2 BASIC FEATURES Once the numeric field is computed, ‘:={numeric field}’ is replaced by the numeric value. Note that ‘:={numeric field}’ may be inside brackets, whatever be the level of nesting. For example, if a cell contains \textbf{:={a1+1}} and if the numeric value of the cell a1 is 5, then finally, the cell will contain \textbf{6} Here is a simple example: 1 2 3 \begin{spreadtab}{{tabular}{|c|c||c|}}\hline value 1 : :={50} & value 2 : :={29} & average : \textbf{:={(a1+b1)/2}}\\\hline \end{spreadtab} value 1 : 50 value 2 : 29 average : 39.5 If ‘:=’ is written in a cell with an empty argument like this ‘:={}’, then the cell is understood as a text cell. In fact, ‘:={}’ behaves like ‘@’, but they are not equivalent: ‘:={}’ allows the cell to receive a formula from another with \STcopy (see next section) while it is impossible with ‘@’. 2.5 Copy a formula To avoid having to copy formulas into adjacent cells, the spreadtab package provides the \STcopy command. This command must be written in a cell with this syntax: \STcopy{>x,vy }{formula} where x and y are positive numbers that represent horizontal and vertical offsets relative to the cell where the command is. With the cell containing the command (the source cell), these offsets define a range of cells which will receive the <formula>5 . The command \STcopy must not be in a cell where there is a numeric field marker ‘:=’. Here is how the copy is made: it starts from the cell where the command \STcopy is. For the other cells, all the coordinates in the formula are modified taking into account the offsets from the source cell. For example, if the source cell contains the formula a1+b2+c3, and the target cell is located 2 columns rightwards and 5 rows below then, this formula becomes: c6+d7+e8. The formula can also contain relative references but, since they are relative, they are not modified. Preceded by ‘!’, a coordinate in a formula is not modified when the formula is copied. For example, if the source cell contains a!1+!b2+!c!3 and the target cell is located 2 columns rightwards and 5 rows below then, this formula becomes: c1+b7+c3. The feature is compatible with relative coordinates. Let’s suppose a cell contains this formula: [-1,!-1]+[!-1,1]+[!1,!2]. As usual, let’s say that this formula is copied to the cell located 2 columns rightwards and 5 rows below: this formula becomes: [-1,-6]+[-3,1]+[-1,-3]. The ‘!’ character is the expansion of the control sequence \STtransposecar. It may be changed to any other with \renewcommand\STtransposecar{<char>}. The ‘!’ character, used by default, keeps its 13 catcode and remains active if the babel package is loaded with the frenchb option. In ‘\STcopy{>x,vy }{formula}’, if x is omitted, the copy is made to the cells rightwards, up to the right edge of the table. With y, it is the same: if this number is omitted, the copy is done to the cells below until the bottom of the table is reached. If x or y is equal to 0, the copy is limited to the column or row of the source cell. Instead of writing v0 or >0, it is possible to write v or >. Here are some examples: {>3,v1} {>3} {v1} {>} {v} {v,>} copy to 3 columns rightwards and 1 row below copy to 3 cells on the right copy to the cell below copy rightwards up to the right edge copy below copy to the right and below until the end of the table It is easy to generate the multiplication table from 1 to 10: 5 The copy can only be done to cells located on the right and below the cell containing the macro. LATEXed by Christian Tellechea, the November 6, 2014. 5 spreadtab 1 2 3 4 5 6 7 8 9 10 11 12 13 14 \begin{spreadtab}{{tabular}{|c|*{10}{c}|}} \hline @$\times$ & 1 & \STcopy{>}{b1+1} 1 & \STcopy{>,v}{!a2*b!1} & \STcopy{v}{a2+1} & & & & & & & & & & & & & & & & & & \end{spreadtab} × 1 2 3 4 5 6 7 8 9 10 1 1 2 3 4 5 6 7 8 9 10 2 2 4 6 8 10 12 14 16 18 20 3 3 6 9 12 15 18 21 24 27 30 4 4 8 12 16 20 24 28 32 36 40 5 5 10 15 20 25 30 35 40 45 50 & & & & & & & & & & & 2 & & & & & & & & & & & 6 6 12 18 24 30 36 42 48 54 60 & & & & & & & & & & & & & & & & & & & & & & & & & & & & & & & & & & & & & & & & & & & & 7 7 14 21 28 35 42 49 56 63 70 & & & & & & & & & & & 8 8 16 24 32 40 48 56 64 72 80 & & & & & & & & & & & BASIC FEATURES \\\hline \\ \\ \\ \\ \\ \\ \\ \\ \\ \\\hline 9 9 18 27 36 45 54 63 72 81 90 10 10 20 30 40 50 60 70 80 90 100 If the numeric field of a target cell is not empty, it is not replaced and the copy is not done for this cell. If 2 or more \STcopy commands in several source cells have the same target cell, then, the formula this latter receives is the one contained in the last \STcopy command when the table is read from top left to bottom right. In the spreadsheet-like example below, the \STcopy in the pink cell B1 has its target range partially covered by the one of the green cell C3. A B 1 1 \STcopy {v,>}{!a1+1} 2 2 3 3 4 4 5 5 C D E F \STcopy {>2,v1}{!a3*10} Here is this example, treated by spreadtab below. In this table, the cell b5 (numeric field alone) and the cell c5 (text field + numeric field) stay unchanged since their numeric fields are not empty: 1 2 3 4 5 6 7 \begin{spreadtab}{{tabular}{|*6{c|}}}\hline 1 &\STcopy{v,>}{!a1+1} & 2 & & 3 & & \STcopy{>2,v1}{!a3*10} 4 & & 5 & -1 & a:={0}b \end{spreadtab} 1 2 3 4 5 LATEXed by Christian Tellechea, the November 6, 2014. & & & & & 2 3 4 5 -1 & & & & & & & & & & \\\hline \\\hline \\\hline \\\hline \\\hline 2 3 30 40 a0b 2 3 30 40 6 2 3 30 40 6 2 3 4 5 6 6 spreadtab 3 FEATURES FOR FORMATTING THE TABLE As mentioned in the last chapter, you can also copy a formula to a text cell containing an empty numeric field (that is to say a cell containing ‘:={}’). In this case, the formula is copied inside the brackets. On the other hand, a cell containing text ‘@’ cannot receive a formula when copying and the cell remains purely textual. Example : 1 2 3 4 \begin{spreadtab}{{tabular}{|*6{c|}}}\hline 1 & 2 & 3 & 4 X\STcopy{>}{a1+1}Y & @XY & X:={}Y & \textbf{:={}} \end{spreadtab} 1 X2Y 3 & 5 & 6 \\\hline & & \\\hline 2 XY 3 X4Y 4 5 5 6 6 7 Features for formatting the table 3.1 Decimal seprarator The fp package returns its results with the decimal point separator. After the job of fp, spreadtab can change this decimal separator: everything happens as if the results returned by fp were taking this into account. The command \STsetdecimalsep takes a mandatory argument which is the character used as decimal separator: \STsetdecimalsep{<char>} For example, French users should write this in the preamble of the document: \STsetdecimalsep{,} For numeric fields located in math mode, the comma is considered as a math punctuation, which explains why it is followed by a space. To pevent this behaviour, it can be written inside brackets: 1 2 3,14 is not displayed like $3,14$.\par 3,14 is displayed like $3{,}14$ 3,14 is not displayed like 3, 14. 3,14 is displayed like 3,14 When cells are in math mode, you can6 use this feature and ask spreadtab to replace the decimal point by a comma inside braces with the command \STsetdecimalsep{{,}}. In these tables where each cell is in math mode, the space after the commas are neutralized in the second table: 1 2 3 4 5 6 7 8 9 10 11 12 13 14 \STsetdecimalsep{,} \begin{spreadtab}{{tabular}{|*3{>{$}r<{$}}|}}\hline @x & @y & @\text{Average}\\\hline 5 & -4 & (a2+b2)/2\\ -6.1 & -8 & (a3+b3)/2\\ 9.85 & 3.7 & (a4+b4)/2\\\hline \end{spreadtab}\par\smallskip \STsetdecimalsep{{,}} \begin{spreadtab}{{tabular}{|*3{>{$}r<{$}}|}}\hline @x & @y & @\text{Average}\\\hline 5 & -4 & (a2+b2)/2\\ -6.1 & -8 & (a3+b3)/2\\ 9.85 & 3.7 & (a4+b4)/2\\\hline \end{spreadtab} 6 It x 5 −6, 1 9, 85 y −4 −8 3, 7 Average 0, 5 −7, 05 6, 775 x 5 −6,1 9,85 y −4 −8 3,7 Average 0,5 −7,05 6,775 is preferable to use the numprint package to format the results. You can also change the math code of the comma: This trick puts the comma in the class 0 of the ordinary signs while its natural class is 6 (punctuation signs). \mathcode‘,="013B\relax. LATEXed by Christian Tellechea, the November 6, 2014. 7 spreadtab 3.2 3 FEATURES FOR FORMATTING THE TABLE Number formatting and the fp package All calculations are made by the \FPeval macro7 of the fp package. This package provides all necessary arithmetical functions along with various scientific and trigonometric functions. Calculations are made with 18 decimal digits of precision, and fp displays all the decimals! The number of digits displayed can be controlled in various ways: • the numprint package can be used in order to properly display numbers; • fp can round or truncate numbers with round(number,integer) or trunc(number,integer) but the syntax makes this tedious to write if this is needed for many cells; • spreadtab can round all the numbers in the table with the macro \STautoround whose argument is number of digits in the decimal part. If the argument is empty, no rounding is done. If the starred macro \STautoround* is used, the decimal part is filled with 0 as necessary. In this example, floating point numbers are rounded to 6 digits: 1 2 3 4 5 6 \STautoround{6} \begin{spreadtab}{{tabular}{|l|*7{>{\centering\arraybackslash}m{1.35cm}|}}} \hline @$x$ & 1 & 2 & 3 & 4 & 5 & 6 & 7 \\\hline @$x^{-1}$& 1/b1 & 1/c1 & 1/d1 & 1/e1 & 1/f1 & 1/g1 & 1/h1\\\hline \end{spreadtab}\medskip 7 8 9 10 11 12 13 \STautoround*{6} \begin{spreadtab}{{tabular}{|l|*7{>{\centering\arraybackslash}m{1.35cm}|}}} \hline @$x$ & 1 & 2 & 3 & 4 & 5 & 6 & 7 \\\hline @$x^{-1}$& 1/b1 & 1/c1 & 1/d1 & 1/e1 & 1/f1 & 1/g1 & 1/h1\\\hline \end{spreadtab} x x−1 1 1 2 0.5 3 0.333333 4 0.25 5 0.2 6 0.166667 7 0.142857 x x−1 1.000000 1.000000 2.000000 0.500000 3.000000 0.333333 4.000000 0.250000 5.000000 0.200000 6.000000 0.166667 7.000000 0.142857 All the numbers contained in the final table, either typed as is or coming from a calculation are processed by the macro\STprintnum. By default, this macro has no effect on its argument and is defined this way: \newcommand\STprintnum[1]{#1} It is possible to round all the numbers via the \numprint command from the numprint package. To achieve this, the \STprintnum command must be redefined: 1 2 3 4 5 6 \renewcommand\STprintnum[1]{\numprint{#1}} \nprounddigits{6} \begin{spreadtab}{{tabular}{cccccccc}} @$x$ & 1 & 2 & 3 & 4 & 5 & 6 &7 \\\hline @$1/x$ &1/b1&1/c1&1/d1&1/e1&1/f1&1/g1&1/h1 \end{spreadtab} x 1/x 1.000,000 1.000,000 2.000,000 0.500,000 3.000,000 0.333,333 4.000,000 0.250,000 5.000,000 0.200,000 6.000,000 0.166,667 7.000,000 0.142,857 Here is another similar example where we test if the number to display is negative with the command \FPifneg from the fp package. If this happens, the number is displayed in red. The command \STautoround was preferred to \nprounddigits from the numprint package because the latter adds unnecessary 0’s. 7 This macro accepts infix or postfix notation. Consequently, both can be used to write formulas in a cell. For example the infix formula ‘a1+b1’ is equivalent to the postfix ones ‘a1 b1 add’ or ‘a1 b1 +’. LATEXed by Christian Tellechea, the November 6, 2014. 8 spreadtab 1 2 3 4 5 6 7 3 FEATURES FOR FORMATTING THE TABLE \STsetdecimalsep{.} \renewcommand\STprintnum[1]{\FPifneg{#1}\color{red}\fi\numprint{#1}} \STautoround{6} \begin{spreadtab}{{tabular}{cccccccc}} @$x$ & -1 & 2 & -3 & 4 & -5 & 6 & -7 \\\hline @$1/x$ &1/b1&1/c1&1/d1&1/e1&1/f1&1/g1&1/h1 \end{spreadtab} x 1/x 3.3 −1 −1 2 0.5 4 0.25 −3 −0.333,333 −5 −0.2 6 0.166,667 −7 −0.142,857 End of lines and horizontal rules spreadtab recognizes the usual line breaks and horizontal rules \\ and \hline. It is also possible to specify the optional argument in line break: \\[<dimension>]. For horizontal rules, it is possible to use: • \hline; • \cline{x-y} where x and y define the start and the end of the rule; • \hhline{<type>} where <type> is the type of rule (read the manual of the hhline package). • any command of the booktabs package: \toprule, \midrule, \bottomrule, \cmidrule, \addlinespace, \morecmidrule and \specialrule. All the arguments of these macros, optional or mandatory are taken into account; • \noalign and its mandatory argument can be written after \\. Example: 1 2 3 4 5 6 7 \begin{spreadtab}{{tabular}{*5c}} [0,1] & [-1,1]+[0,1] & [-1,1]+[0,1] [0,1] & [-1,1]+[0,1] & [-1,1]+[0,1] [0,1] & [-1,1]+[0,1] & [-1,1] [0,1] & [-1,1] & 1 & & \end{spreadtab} 3.4 & [-1,1]+[0,1] & [-1,1]\\[1em] & [-1,1] & \\ & & \\ \hline\hline & & \\ \cline{2-4} & & \\ \hline 1 4 6 4 1 1 1 1 3 2 1 3 1 1 1 Hide a row or column Sometimes, a column or a row is intended for intermediate calculations and does not need to be displayed in the final table. For this, spreadtab provides two control sequences \SThiderow and \SThidecol which, when placed in a cell, hide the row or column that contains the cell. An example: 1 2 3 4 5 6 7 \begin{spreadtab}{{tabular}{|r|ccc|}} \hline @ values of $x$ & -1 & @$f(x)=2x-1$ & 2*[0,-1]-1 & @$g(x)=x-10$\SThiderow & [0,-2]-10 & @$h(x)=1-x$ & 1-[0,-3] & \end{spreadtab} LATEXed by Christian Tellechea, the November 6, 2014. 0\SThidecol 2*[0,-1]-1 [0,-2]-10 1-[0,-3] & & & & 2 2*[0,-1]-1 [0,-2]-10 1-[0,-3] & & & & 3 2*[0,-1]-1 [0,-2]-10 1-[0,-3] \\\hline \\ \\ \\\hline 9 spreadtab values of x f (x) = 2x − 1 h(x) = 1 − x 3 -1 -3 2 2 3 -1 FEATURES FOR FORMATTING THE TABLE 3 5 -2 The row containing g(x) and column corresponding to the value 0 are hidden. Remember that the hidden rows and columns are invisible to the tabular environment chosen by the user. Thus, only 4 columns have been defined (|r|ccc|) and not 5 as seen by spreadtab. Just to see the difference, here is the table obtained when setting 5 columns in the preamble and not hiding any row or column: values of x f (x) = 2x − 1 g(x) = x − 10 h(x) = 1 − x 3.5 -1 -3 -11 2 0 -1 -10 1 2 3 -8 -1 3 5 -7 -2 Save the result of a cell It may be necessary to save the numerical value of a cell to display it outside a formula or even outside the table. Here is how to do it: \STsavecell{<control sequence>}{<absolute reference>} With a \global\def8 , this command globally saves in <control sequence> the result of the formula contained in the cell <absolute reference>. Only absolute references can be used since this command must be placed in the optional argument of the spreadtab environment. Example: 1 2 3 4 5 6 \begin{spreadtab}[\STsavecell\result{c1}]{{tabular}{|c|c|c|c|c|}} \hline 10 & a1+10 & b1+10 & a1+b1+c1 & @cell c1 : \result\\\hline \end{spreadtab} \par\medskip Here is the cell c1 : \result 10 20 30 60 cell c1 : 30 Here is the cell c1 : 30 In order to save several cells, the command \STsavecell can be put several times in the optionnal argument. Example: 1 2 3 4 5 6 \begin{spreadtab}[\STsavecell\hhh{b3}\STsavecell\mmm{c3}\STsavecell\sss{d3}]{{tabular}{|rc|}}\hline @Speed (km/h) &\SThidecol&\SThidecol&\SThidecol& 35 \\ @distance (km) & & & & 180\\\hline @Time (h min s) & trunc(e2/e1,0) & trunc(60*(e2/e1-b3),0) & trunc(3600*(e2/e1-b3)-60*c3,1) &@\hhh\ h \mmm\ min \ sss\ s\\\hline \end{spreadtab}\par\medskip It lasts more than \hhh\ hours. Speed (km/h) distance (km) Time (h min s) 35 180 5 h 8 min 34.2 s It lasts more than 5 hours. 8 The \def command does not check if the macro it defines already exists. LATEXed by Christian Tellechea, the November 6, 2014. 10 spreadtab 3.6 3 FEATURES FOR FORMATTING THE TABLE Display the value of a cell In order to display the numeric field of a cell in a textual field, we have seen that we could save this value in a control sequence and use this control sequence anywhere in the table. The process is somewhat tedious. . . Indeed, \STsavecell is not intended to be used in such a way. Its aim is to save the value of a numeric field for further use outside the table. There is a simpler way to display the numeric field of a cell in a textual field using the syntax <<reference>> which is replaced by the numeric field of the cell reference, where the reference can be absolute or relative. If the text between << and >> is not a reference, then <<text>> is left as is. The reference must not contain any space; for example, if you write << a1>>, spreadtab does not uderstand it as a reference because of the space before ‘a1’. Example in a textual cell a3: 1 2 3 4 5 \begin{spreadtab}{{tabular}{lr}} @Sell price & 250 \\ @Purchase price & 216 \\\hline @Profit (<<b1>>-<<b2>>) & b1-b2 \end{spreadtab} Sell price Purchase price Profit (250-216) 250 216 34 Example in the mixed cell c1: 1 2 3 \begin{spreadtab}{{tabular}{|c|c||c|}}\hline 23 & 32 & Average $= \frac{<<a1>>+<<b1>>}{2}= :={(a1+b1)/2}$\\\hline \end{spreadtab} 23 32 Average = 23+32 2 = 27.5 The characters used to delimit the reference are set to ‘<<’ and ‘>>’ by default. They can be modified with the \STsetdisplaymarks command whose arguments contain the left and right delimiters. For example, if you write \STsetdisplaymarks{|}{|}, you will write |reference| in order to display the content of the numeric field of the cell reference. 3.7 The use of \multicolumn spreadtab is compatible with the syntax \multicolumn{<n>}{<type>}{<content>} which merges <n> cells in a unique cell whose type and content are specified in the arguments. Even when using \multicolumn, spreadtab maintains some consistency in the references. In this table where is used, the absolute references are displayed: \multicolumn a1 b1 a2 b2 a3 c1 d1 e1 f1 g1 d2 e2 f2 g2 d3 e3 g3 Thus, whatever the number of merged cells, the next cell has a column number that takes into account the number of merged cells. In the last line, cells a3, b3 and c3 are merged and consequently, the cells b3 and c3 do not exist for spreadtab: it is not possible to refer to b3 or c3 anywhere in the table. In this example, every number in the top line is the product of the 2 numbers below: LATEXed by Christian Tellechea, the November 6, 2014. 11 spreadtab 1 2 3 4 5 6 4 MACRO-FUNCTIONS \newcolumntype{K}[1]{@{}>{\centering\arraybackslash}p{#1cm}@{}} \begin{spreadtab}{{tabular}{*6{K{0.5}}}} \cline{2-5} &\multicolumn{2}{|K{1}|}{:={a2*c2}} & \multicolumn{2}{K{1}|}{:={c2*e2}} &\\\hline \multicolumn{2}{|K{1}}{:=8}&\multicolumn{2}{|K{1}}{:=7}&\multicolumn{2}{|K{1}|}{:=6}\\\hline \end{spreadtab} 8 56 7 42 6 The marker ‘:=’ is necessary in every cell where the command \multicolumn is written. Without it, spreadtab would consider that the whole cell (i.e. \multicolumn{2}{|c|}{<formula>}) as the formula, which is impossible to calculate. 4 Macro-functions The fp package provides a limited set of operations and functions. If these are not sufficient then spreadtab allows the advanced programmer to write macros using the operations and functions of fp. This section presents the macro-functions currently available9 . There will be more details on how to program macro functions in the next version of this manual. 4.1 Mathematical macro-functions 4.1.1 Sum cells The macro-function sum sums one or several ranges of cells. It should be used like this: sum(<range 1>;<range 2>;...;<range n>), where a range of cells is: • either a single cell like a1 or [2,1]; • or a rectangular area bounded by the upper-left cell and lower-right with this syntax: <cell 1>:<cell 2> Here are some examples of such areas: a2:d5, [-1,-1]:[2,3], b4:[5,1]. In cell ranges, if a cell does not have a numeric field (empty cell or text cell or merged cell with \mutlicolumn), it is seen as 0 by sum. In the following table, the sum of the binomial coefficients of Pascal’s triangle is calculated: 1 2 3 4 5 6 7 8 \begin{spreadtab}{{tabular}{*5c}} \multicolumn{5}{c}{sum: :={sum(a2:e6)}}\\ [0,1] & [-1,1]+[0,1] & [-1,1]+[0,1] & [-1,1]+[0,1] [0,1] & [-1,1]+[0,1] & [-1,1]+[0,1] & [-1,1] [0,1] & [-1,1]+[0,1] & [-1,1] & [0,1] & [-1,1] & & 1 & & & \end{spreadtab} 9 Many & [-1,1] & & & & \\ \\ \\ \\ 1 1 1 1 1 sum: 31 4 6 4 3 3 1 2 1 1 1 others should be written soon and be available in future versions of the package. LATEXed by Christian Tellechea, the November 6, 2014. 12 spreadtab 4.1.2 4 MACRO-FUNCTIONS The fact macro The macro-function fact(<number>) computes the factorial of its argument, assuming it is an integer between 0 and 18 to avoid overflows10 . The <number> can also be a reference to a cell whose numeric field contains an integer. Here are the factorials from 0 to 8: 1 2 3 4 \begin{spreadtab}{{tabular}{*9c}} 0 & 1 & 2 & 3 & 4 & 5 & 6 & 7 &8\\\hline fact(a1)&fact(b1)&fact(c1)&fact(d1)&fact(e1)&fact(f1)&fact(g1)&fact(h1)&fact(i1) \end{spreadtab} 0 1 4.1.3 1 1 2 2 3 6 4 24 5 120 6 720 7 5040 8 40320 The sumprod macro The function sumprod multiplies the corresponding elements of 2 or more rectangular ranges and then adds these products. It should be used like this: sumprod(<range 1>;<range 2>;...;<range n>). All the ranges must have the same dimensions. In this simple example, the average age of a group of children aged from 10 to 15 years old is calculated: 1 2 3 4 5 \begin{spreadtab}{{tabular}{r*6c}} @\Ages & 10 & 11 & 12 & 13 & 14 & 15\\ @Number & 5 & 8 & 20 & 55 & 9 & 3\\\hline @Average&\multicolumn{6}{l}{:={sumprod(b1:g1;b2:g2)/sum(b2:g2)}} \end{spreadtab} Ages Number Average 10 11 5 8 12.64 12 20 13 55 14 9 15 3 If any cell in the ranges is empty, pure text or merged with \multicolumn, its numeric field is replaced by 0. 4.1.4 Random numbers The macro-functions randint and rand each returns a random number depending on its argument. It should be noted that the seed initializing the random sequence depends on the date and the minute at which the compilation is done. Thus, the random sequence of numbers given by this function will change between two compilations made at different times. If random numbers need to be repeatable, the private macro \ST@seed must be cancelled and a seed should be chosen for fp. Here is the code to do this: 1 2 3 4 \makeatletter \renewcommand\ST@seed{}% redefines the private macro \makeatother \FPseed=27% gives a seed (any integer) to fp. The macro-function randint([<number1>,]<number2>) returns a random integer depending on its arguments: <number1> is an optional integer with default value 0. The random integer returned is in the interval [<number1>; <number2>]. The macro-function rand() returns a random number between 0 and 1. 10 Indeed, for fp the greatest integer is 1018 − 1. The factorial of 19 is greater than this. LATEXed by Christian Tellechea, the November 6, 2014. 13 spreadtab 1 2 3 4 5 6 7 4 MACRO-FUNCTIONS \STautoround{6} \begin{spreadtab}{{tabular}{|l|cccc|}}\hline @numbers in [0;1] &rand() &rand() &rand() &rand() \\ @numbers in [-5;5] &randint(-5,5) &randint(-5,5) &randint(-5,5) &randint(-5,5)\\ @numbers in [0;20] &randint(20) &randint(20) &randint(20) &randint(20) \\ \hline \end{spreadtab} numbers in [0;1] numbers in [-5;5] numbers in [0;20] 4.1.5 0.504219 3 19 0.407512 0 12 0.054756 -3 12 0.278499 4 11 GCD and LCM The macro functions ‘gcd’ and ‘lcm’ compute the Greatest Common Divisor and the Least Common Multiple of the list of numbers in their argument: gcd(number1,number2,...,numberN) lcm(number1,number2,...,numberN) Example : 1 2 3 4 5 6 7 \begin{spreadtab}{{tabular}{|r|r|r||c|c|}}\hline \multicolumn3{|c||}{@Numbers}& @GCD & @LCM \\\hline 24 & 18 & 12 & \STcopy{v}{gcd(a2,b2,c2)} & \STcopy{v}{lcm(a2,b2,c2)}\\ 15 & 10 & 25 & & \\ 16 & 12 & 15 & & \\ \hline \end{spreadtab} Numbers 24 18 12 15 10 25 16 12 15 4.1.6 GCD 6 5 1 LCM 72 150 240 Scientific notation The macro function ‘scitodec’ converts a number written in scientific notation into a decimal number, understandable by spreadtab to achieve its calculations. The syntax is scitodec(<text>), where <text> is: • a sequence of characters with the syntax <mantissa>EE<exponent> where <mantissa> is a decimal number and the <exponent> is an integer. The ‘EE’ may be written uppercase or lowercase. <mantissa>EE<exponent> means the number <mantissa> × 10<exponent> • a reference to the textual field of a cell containing <mantissa>EE<exponent> Example : 1 2 3 4 5 6 7 8 9 \begin{spreadtab}{{tabular}{|r|r|}}\hline @Scientific notations & @Decimal notations \\\hline @4EE2 & \STcopy{v}{scitodec([-1,0])}\\ @-3.1EE-3 & \\ @15ee5 & \\ @-0.025ee7 & \\ @2.125EE0 & \\ @3.1575EE-4 & \\\hline \end{spreadtab} LATEXed by Christian Tellechea, the November 6, 2014. 14 spreadtab Scientific notations 4EE2 -3.1EE-3 15ee5 -0.025ee7 2.125EE0 3.1575EE-4 4.1.7 4 MACRO-FUNCTIONS Decimal notations 400 -0.0031 1500000 -250000 2.125 0.00031575 Identity The simplest macro function is ‘id(<number>)’. It returns the number in its argument. Mathematically, it is not very useful, but with spreadtab, it makes possible the writing of mathematical expressions in arguments of macro functions where they are not otherwise allowed – in the argument of sum for example. In the code below, the id macro function is used to compute the range of cells to add with sum. In this example, the numeric field of the cell ‘a2’ contains 8. Therefore, ‘sum([0,-1]:[id(a2-1),-1])/a2’ is equivalent to sum([0,-1]:[7,-1])/8: 1 2 3 4 \begin{spreadtab}{{tabular}{r*{10}c}} @Integers & 1 & 2 & 3 & 4 & 5 & 6 & 7 & 8 & 9 & 10\\ Mean of the :={8} first integers & sum([0,-1]:[id(a2-1),-1])/a2 \\ \end{spreadtab} Integers Mean of the 8 first integers 4.2 1 4.5 2 3 4 5 6 7 8 9 10 Tests Three macro-functions provide tests: ifeq(number1,number2,number3,number4) ifgt(number1,number2,number3,number4) iflt(number1,number2,number3,number4) number1 and number2 are compared: • for ifeq, is number1 = number2? • for ifgt, is number1 > number2? • for iflt, is number1 < number2? If the test is positive, number3 is returned, otherwise it is number4. if x < 1 10 Here are some values of the function f (x) = 0 if x = 1 −10 if x > 1 1 2 3 4 5 6 7 8 9 10 \begin{spreadtab}{{tabular}{|*2c|}}\hline @$x$ & @$f(x)$ \\\hline -0.5 & iflt([-1,0],1,10,ifeq([-1,0],1,0,-10))\\ [0,-1]+0.5 & iflt([-1,0],1,10,ifeq([-1,0],1,0,-10))\\ [0,-1]+0.5 & iflt([-1,0],1,10,ifeq([-1,0],1,0,-10))\\ [0,-1]+0.5 & iflt([-1,0],1,10,ifeq([-1,0],1,0,-10))\\ [0,-1]+0.5 & iflt([-1,0],1,10,ifeq([-1,0],1,0,-10))\\ [0,-1]+0.5 & iflt([-1,0],1,10,ifeq([-1,0],1,0,-10))\\ [0,-1]+0.5 & iflt([-1,0],1,10,ifeq([-1,0],1,0,-10))\\\hline \end{spreadtab} LATEXed by Christian Tellechea, the November 6, 2014. 15 spreadtab x -0.5 0 0.5 1 1.5 2 2.5 4.3 4 MACRO-FUNCTIONS f (x) 10 10 10 0 -10 -10 -10 Macro-functions manipulating dates 4.3.1 Date to number with engshortdatetonum The macro engshortdatetonum converts a short date like 1789/7/14 to an integer which is the number of days passed since the 1st March of the year 011 . It is important to note that this macro-function requires a textual argument and not a number or the result of a mathematical calculation. Therefore, if the argument of this macro-function refers to a cell, that cell must be a text cell, i.e. a cell containing ‘@’ or ‘:={}’. In the example below, the first two lines show how to refer to a text cell. The third line displays the date 0 on the left, and more interesting on the right, it shows how to calculate the number corresponding to the current date with the use of the TEX counters \year, \month and \day which contain the numbers of the current year, month and day. 1 2 3 4 5 \begin{spreadtab}{{tabular}{cc}} @1789/7/14 & engshortdatetonum(a1)\\ 2001/1/1 :={} & engshortdatetonum(a2)\\\hline engshortdatetonum(0/3/1) & engshortdatetonum(\number\year/\number\month/\number\day) \end{spreadtab} 1789/7/14 2001/1/1 0 653554 730791 735848 Another macro-function provides the same feature but with a long date like ‘December 25, 1789’ or the string contained in \today: 1 2 3 4 \begin{spreadtab}{{tabular}{cc}} englongdatetonum(February 13, 2005) & englongdatetonum(\today)\\ @July 1, 1970 & englongdatetonum(a2) \end{spreadtab} 732295 July 1, 1970 4.3.2 735848 719649 From a number to a date Several macro-functions translate a number into a date. All these macro-functions have in common that their result is text. Therefore, the cells containing such results become cells containing text and if the cell is composed of two fields, the numeric field becomes empty and ‘:={<formula>}’ is replaced by its result in the text field. These macro-functions are: • numtoengshortdate translate a number into a short date like ‘1789/7/14’; • numtoenglongdate translate a number into a long date like ‘July 14, 1789’; • numtoengmonth given a number representing a date, it finds the name of the month; 11 This year 0 does not exist but this should not be a problem with recent dates. LATEXed by Christian Tellechea, the November 6, 2014. 16 spreadtab 4 MACRO-FUNCTIONS • numtoengday same as above but it finds the name of the day. Here is an example in which we consider 1000 days before and 1000 days after 2009/6/1. For each of these 2 dates, we calculate the short date, long date, month and day of the week. 1 2 3 4 5 6 7 8 9 10 11 \begin{spreadtab}{{tabular}{cc}} \hline \multicolumn{2}{|c|}{@2009/6/1} \\\hline\hline 1000 & numtoengshortdate(engshortdatetonum(a1)+[-1,0])\\ 1000 & numtoenglongdate(engshortdatetonum(a1)+[-1,0]) \\ 1000 & numtoengmonth(engshortdatetonum(a1)+[-1,0]) \\ 1000 & numtoengday(engshortdatetonum(a1)+[-1,0]) \\\hline -1000 & numtoengshortdate(engshortdatetonum(a1)+[-1,0])\\ -1000 & numtoenglongdate(engshortdatetonum(a1)+[-1,0]) \\ -1000 & numtoengmonth(engshortdatetonum(a1)+[-1,0]) \\ -1000 & numtoengday(engshortdatetonum(a1)+[-1,0]) \end{spreadtab} 1000 1000 1000 1000 -1000 -1000 -1000 -1000 4.4 2009/6/1 2012/2/26 February 26, 2012 February sunday 2006/9/5 September 5, 2006 September tuesday Coordinate macro functions Rather than referring to a cell by its coordinates which are difficult to remember and change if you insert a row or column, it is sometimes more convenient to give a name to a cell and refer to it later by name. The macro function ‘tag(<name>)’ gives a name to the cell in which it is located. This is not really a macro function like the others, since it returns nothing when put in a formula and disappears without causing any effect on the mathematical result. We can write ‘tag(<nom>)’ anywhere in the numeric field of a cell. The <name> can be any string of alphanumeric characters, but it is not advisable to put a letter and a number that could be understood as a reference to a cell, and would therefore be modified at a copy operation with \STcopy. This macro function has an additional action, it saves via a \def the numeric value of the cell in which it is located in order to be able to use later outside the table via the purely expandable command \STtag{<name>}. Later in the table, instead of writing the coordinates of the cell, we can write ‘cell(<name>)’, which is a macro function that returns the coordinates of the cell named <name>. For example, if ‘tag(<name>)’ is written in the cell ‘B3’ and in a further cell, we write ‘cell(<name>)’, this macro function returns B3. Here is an example where we add cells and the name ‘foo’ is given to the first number and the name ‘bar’ to the last. One can see that tag(foo) is between ‘1’ and ‘9’ but at the end, since this macro function diappears, the numeric field of the cell will be ‘19’: 1 2 3 4 5 6 7 8 \begin{spreadtab}{{tabular}{r@{}r}} & 15tag(foo) \\ @+ & 37 \\ @+ & 13 \\ @+ & 48 \\ @+ & 1tag(bar)9 \\\cline{2-2} & sum(cell(foo):cell(bar))tag(baz) \end{spreadtab} 9 10 foo=\STtag{foo}, bar=\STtag{bar}, baz=\STtag{baz} LATEXed by Christian Tellechea, the November 6, 2014. 17 spreadtab + + + + 5 PARTICULAR CARE 15 37 13 48 19 132 foo=15, bar=19, baz=132 When the environment spreadtab is nested in another environment, the assignments made by the macro funtion tag are local in this environment and could not be accessed outside of this environment via \STtag. In the example below, the table made with spreadtab is in a center environment and we must use \STmakegtag{<name>} to make global the previous saving of the numerical value contained in the cell marked by ‘tag(<name>)’: 1 2 3 4 5 6 7 8 \begin{center} \begin{spreadtab}{{tabular}{cccc}}\hline 6&9&17&21\\\hline \multicolumn{4}{c}{average = :={sum(a1:d1)/4tag(avg)}} \end{spreadtab} \STmakegtag{avg} \end{center} The average is \STtag{avg}. 6 9 17 21 average = 13.25 The average is 13.25. The argument of \STmakegtag can be made of several names, separated with commas. Although at first sight less useful, spreadtab also provides the macro functions ‘row(<name>)’ and ‘col(<name>)’ that return the number of the row or column of the cell tag(<name>). Here is an example of how to calculate the average of a number of values; the first and last values are tagged ‘first’ and ‘last’ and therefore, the number of values is row(last)-row(first)+1: 1 2 3 4 5 7 9 15 6 20 13 11 55 average = 17 average = \begin{spreadtab}{{tabular}[b]{r}} 7tag(first)\\9\\15\\6\\20\\13\\11\\55tag(last)\\ \hline sum(cell(first):cell(last))/(row(last)-row(first)+1) \end{spreadtab} 5 5.1 Particular care Defining new commands with \hline It may be useful to define a new command to produce, for example, a double horizontal line: \newcommand\dline{\hline\hline} and then try to use it in a table as in this simple example that computes the Fibonnacci sequence in the second line: 0 1 1 1 2 2 3 3 4 5 5 8 6 13 But, if you write the following code, there is a problem when compiling: 1 2 3 4 5 \newcommand\dline{\hline\hline} \begin{spreadtab}{{tabular}{*7c}} 0 & 1 & 2 & 3 & 4 & 5 & 6 \\\dline 1 & 1 & a2+b2 & b2+c2 & c2+d2 & d2+e2 & e2+f2 \end{spreadtab} LATEXed by Christian Tellechea, the November 6, 2014. 18 spreadtab 5 PARTICULAR CARE In the log file, you can read that \FPeval fails and complains: ! Improper alphabetic constant. The reason is simple, \dline in line 4 is not recognized by spreadtab as a horizontal rule and therefore, it is placed in the cell in the next line. For spreadtab, the cell b1 contains: \dline 1 Since there is no @ or :={<formula>}, spreadtab considers that the whole cell is a numeric field and \FPeval tries valiantly to calculate this content and obviously fails. To compile without error, the cell a2 must contain a numeric field marker: 1 2 3 4 5 \newcommand\dline{\hline\hline} \begin{spreadtab}{{tabular}{*7c}} 0 & 1 & 2 & 3 & 4 & 5 & 6 \\\dline :={1} & 1 & a2+b2 & b2+c2 & c2+d2 & d2+e2 & e2+f2 \end{spreadtab} 0 1 5.2 1 1 2 2 3 3 4 5 5 8 6 13 The use of \multicolumn and \SThidecol Firstly, in normal use, joint use of \multicolumn and \SThiderow should not happen, and most users should not encounter this situation and should not read this section. For the brave here is the problem: first, a hidden column must not contain a cell with the command \multicolumn! But what happens if a hidden column hides cells merged with \multicolumn? In general, there is no compilation error or error messages, but there are some subtleties about the references that are a bit turned upside down in the line after the \multicolumn command. . . Let’s take an example, and let’s say that, in the following table, we want to merge the cell b2 to h2 and we also want to hide the colomns c, d and f, here in gray: a1 b1 a2 b2 c1 d1 e1 f1 g1 h1 i1 j1 i2 j2 There are 4 visible merged cells, so we write \multicolumn{4} because hidden columns are never taken into account when counting the number of \multicolumn. Then we count 4 letters from b (this letter included): we obtain the letter e. In the range b-e, let’s count: 2 gray hidden columns are included (c and d) and 1 hidden column is not included (f). These numbers are important to understand the following, also let’s call them x and y in the general case. The rule is: • it is necessary to add y signs & after \multicolumn (in the example above, it would be 1); • references to columns of cells after the \multicolumn will be shifted x to the beginning of the alphabet. For the example given, if we want to refer to the cell i2, we should write g2 instead of i2. Here is an example with a similar structure to the previous (x = 2 and y = 1) with simple formulas: add 1 to the number above. 1 2 3 4 5 6 \begin{spreadtab}{{tabular}{|*{7}{c|}}} \hline 1 & 2 & \SThidecol3 & \SThidecol4 & 5& \SThidecol6 & 7& 8& 9 & 10 \\\hline a1+1& \multicolumn4{l|}{:={b1+1}} & & i1+1 & j1+1\\\hline a2+1& b2+1 & & & & & & & g2+1 & h2+1\\\hline \end{spreadtab} LATEXed by Christian Tellechea, the November 6, 2014. 19 spreadtab 1 2 3 2 3 4 5 7 8 5 9 10 11 PARTICULAR CARE 10 11 12 And another example with x = 1 and y = 0 where a single column is hidden d: 1 2 3 4 5 6 \begin{spreadtab}{{tabular}{|*{9}{c|}}} \hline 1 & 2 & 3 & \SThidecol4 & 5 & 6 & 7 & 8 a1+1& \multicolumn6{l|}{:={b1+1}} a2+1& b2+1 & & & & & & \end{spreadtab} 1 2 3 5.3 2 3 4 & 9 & 10 \\\hline & i1+1 & j1+1\\\hline & h2+1 & i2+1\\\hline 3 5 6 7 8 9 10 11 10 11 12 Messages delivered by spreadtab The package delivers error messages and aborts compilation in these cases: • a circular reference is found in a cell. In this case, the dependent cells are displayed; • a cell refers to an empty cell or a text cell when a non-empty numeric field is expected; • a cell refers to an undefined cell (outside the table); • a cell refers to a cell merged by a \multicolumn command; • a relative reference has bad syntax. The package can deliver informative messages (in the log file), which it does by default. If the user wants or not the delivery of informative messages, the syntax is \STmessage{true} or \STmessage{false}. To understand the meaning of these messages, let’s take a simple table: 1 2 3 4 \STmessage{true}% already set by default \begin{spreadtab}{{tabular}{|cccc|c|}}\hline b1+1 & c1+1 & d1+1 & 10 & a1+b1+c1+d1\\\hline \end{spreadtab} 13 12 11 10 46 Here are the messages deliverd by spreadtab: 1 2 3 4 5 6 7 8 9 10 [spreadtab] New spreadtab {tabular}{|cccc|c|} * reading tab: ok * computing formulas: cell A1-B1-C1 cell B1 cell C1 cell D1 cell E1 * building tab: ok [spreadtab] End of spreadtab Preceded by a star, we recognize the 3 steps necessary for spreadtab to complete its task: reading the table, calculation of the formulas and building the final table. For the second step, cells are evaluated from top to bottom, left to right: at line 4 in the code above, spreadtab says that it begins by trying to calculate the first cell A1. After a dash, we see that for this, it must first compute the cell B1, which itself requires that the cell C1 is calculated: the latter can be calculated since it depends only on D1 which is a cell containing the number 10. In the following (lines 5 to 8), there is only one cell per line which means that when spreadtab tries to evaluate the cell, either it contains a number or dependent cells are already calculated. LATEXed by Christian Tellechea, the November 6, 2014. 20 spreadtab 5.4 5 PARTICULAR CARE Debug mode To ease the use of spreadtab, a debug mode is available. It is activated when the command \STdebug is written in the optional argument of the spreadtab environment. This command changes the behavior of spreadtab which, instead of displaying the final table, displays one (or more) table(s) containing debugging information. This display is done just after spreadtab has read all the cells, and no calculating of formulas has yet taken place. There are as many tables as commands \STdebug, provided that their argument is different. Only 3 arguments are possible: • \STdebug{formula}: displays all the numeric fields and the ends of lines; • \STdebug{text}: displays all the textual fields; • \STdebug{code}: displays the internal code of the cells. Indeed, spreadtab assigns a code to every cell when it reads the table. Here are the possible values of this code: • −1 if the cell is merged with \multicolumn; • 0 if the cell is a text cell or is empty; • 1 if the numeric field of the cell contains a formula which will be computed later; • 2 if the numeric field of the cell contains a number. When the ‘debug mode’ is activated, the final table is not displayed. Here is a table which will be used for the next example: 1 2 3 4 5 6 7 8 \begin{spreadtab}{{tabular}{|r|r|r|}}\hline @$x$ &@$y$ & @$x+y$\\\hline\hline 22 & 54 & \STcopy{v3}{a2+b2} \\ 43 & 65 & \\ 49 & 37 & \\\hline $Sx=:={a2+a3+a4}$ & $Sy=:={b2+b3+b4}$ & $Sx+Sy=:={}$\\\hline \multicolumn2{|r|}{$Sy-Sx=:={b5-a5}$} & @\multicolumn1c{}\\\cline{1-2} \end{spreadtab} x y 22 54 43 65 49 37 Sx = 114 Sy = 156 Sy − Sx = 42 x+y 76 108 86 Sx + Sy = 270 Let’s ask spreadtab to show the 3 possible debugging tables for the table above. To do this, just change line 1 in the code above to: \begin{spreadtab}[\STdebug{text}\STdebug{formula}\STdebug{code}]{{tabular}{|rr|r|}}\hline A B C 1 $x$ $y$ $x+y$ 2 := := := 3 := := := 4 := := := 5 $Sx=:=$ $Sy=:=$ $Sx+Sy=:=$ 6 \multicolumn 2{|r|}{$Sy-Sx=:=$} \multicolumn 1c{} A B 1 2 22 54 3 43 65 4 49 37 5 a2+a3+a4 b2+b3+b4 6 b5-a5 1 2 3 4 5 6 LATEXed by Christian Tellechea, the November 6, 2014. A 0 2 2 2 1 1 C a2+b2 a3+b3 a4+b4 a5+b5 B 0 2 2 2 1 -1 \hline \\\hline \hline \\ \\ \\\hline \\\hline \\\cline {1-2} C 0 1 1 1 1 0 21 spreadtab 6 EXAMPLES These 3 debugging tables may help to better understand what happens behind the scene when spreadtab works. We can observe that all cells with a numeric field (see table 2) have an internal code of 1 or 2 (see table 3) and an associated numeric field marker ‘:=’ in table 1. This marker represents the location where (by substitution) the result of the numeric field will be inserted. So from the contents of text fields in table 1 and, once calculated, the numeric fields, by a simple substitution, the cells are reconstituted to give those of the final table. In the debugging tables, cells containing the coordinates are grayed if the package colortbl has been loaded; they are left white otherwise. 6 Examples In the examples of this section, the numbers entered by the user are in red and the calculated numbers are in black In these tables, lots of tricks (struts, \multicolumn commands) and packages (including the numprint package and its columns ‘N’, which aligns the decimal points) were used to obtain a satisfactory result. The code is sometimes cumbersome and difficult to read, but these tables are not basic but well-groomed examples! 6.1 1 2 3 4 5 6 7 8 9 Pascal’s triangle again! \begin{spreadtab}{{tabular}{*7r}} [0,1] & [-1,1]+[0,1] & [-1,1]+[0,1] [0,1] & [-1,1]+[0,1] & [-1,1]+[0,1] [0,1] & [-1,1]+[0,1] & [-1,1]+[0,1] [0,1] & [-1,1]+[0,1] & [-1,1]+[0,1] [0,1] & [-1,1]+[0,1] & [-1,1] [0,1] & [-1,1] & \color{red}:={1}& & \end{spreadtab} & & & & & & & [-1,1]+[0,1] [-1,1]+[0,1] [-1,1]+[0,1] [-1,1] 1 1 1 1 1 1 1 6.2 6 5 4 3 2 1 & [-1,1]+[0,1] & [-1,1]+[0,1] & [-1,1]\\ & [-1,1]+[0,1] & [-1,1] & \\ & [-1,1] & & \\ & & & \\ & & & \\ & & & \\ & & & 15 10 6 3 1 20 10 4 1 15 5 1 6 1 1 The convergence of a series For people familiar with maths, here is the series of the exponential. Indeed, ∀x ∈ R ex = ∞ X xk k=0 k! and this table shows the speed of convergence for x = 0.5 1 2 3 4 5 6 7 8 9 10 11 12 \STautoround{15} \renewcommand\STprintnum[1]{\numprint{#1}} \begin{spreadtab}{{tabular}{cc}} \multicolumn{2}{c}{Convergence at $x=\color{red}:={0.5}$}\\[1.5ex] @$n$ & e^a1\SThidecol & @ $\displaystyle e^{\numprint{<<a1>>}}-\sum_{k=0}^n\frac{\ numprint{<<a1>>}^k}{k!}$\\[3ex]\hline \color{red}:={0}& a1^[-1,0]/fact([-1,0]) & \STcopy{v}{b!2-b3}\\ \STcopy{v}{a3+1}& \STcopy{v}{a!1^a4/fact(a4)+b3}& \\ & & \\ & & \\ & & \\ & & \\ & & \\ LATEXed by Christian Tellechea, the November 6, 2014. 22 spreadtab & & & 13 14 15 16 6 & & & EXAMPLES \\ \\ \\\hline \end{spreadtab} Convergence at x = 0.5 n e 0.5 − n X 0.5k k=0 0 1 2 3 4 5 6 7 8 9 6.3 k! 0.648,721,270,700,128 0.148,721,270,700,128 0.023,721,270,700,128 0.002,887,937,366,795 0.000,283,770,700,128 0.000,023,354,033,461 0.000,001,652,644,572 0.000,000,102,545,366 0.000,000,005,664,166 0.000,000,000,281,877 Convergence to the golden ratio In mathematical terms, the sequence Fn of Fibonacci numbers is defined by the recurrence relation: F0 = 1 F1 = 1 Fn+2 = Fn+1 + Fn The golden ratio is the limit of the ratios of successive terms of the Fibonacci sequence. We show here that the √ quotients Fn+1 /Fn approximate the golden ratio ϕ = 1+2 5 alternately lower and higher than ϕ. 1 2 3 4 5 6 7 8 9 10 11 12 13 14 15 16 17 18 19 20 21 \STautoround{9} $\begin{spreadtab}{{array}{ccN39N{3}{9}}} @n & @F_n & @\hfill{\dfrac{F_n}{F_{n-1}}}\hfill\null& @\hfill{\varphi-\dfrac{F_n}{F_{n -1}}}\hfill\null\\[2ex]\hline \color{red}:=1 & \color{red}:=1 & & \\ \STcopy{v}{a2+1} & \color{red}:=1 & \STcopy{v}{b3/b2} & (1+5^0.5)/2-[-1,0] \\ & \STcopy{v}{b2+b3} & & \STcopy{v}{d!3+1-c4} \\ & & & \\ & & & \\ & & & \\ & & & \\ & & & \\ & & & \\ & & & \\ & & & \\ & & & \\ & & & \\ & & & \\ & & & \\ & & & \\ & & & \\\hline \end{spreadtab}$ LATEXed by Christian Tellechea, the November 6, 2014. 23 spreadtab n Fn 1 1 2 1 3 2 4 3 5 5 6 8 7 13 8 21 9 34 10 55 11 89 12 144 13 233 14 377 15 610 16 987 17 1597 6.4 6 Fn Fn−1 ϕ− 1 2 1.5 1.666,666,667 1.6 1.625 1.615,384,615 1.619,047,619 1.617,647,059 1.618,181,818 1.617,977,528 1.618,055,556 1.618,025,751 1.618,037,135 1.618,032,787 1.618,034,448 EXAMPLES Fn Fn−1 0.618,033,989 −0.381,966,011 0.118,033,989 −0.048,632,678 0.018,033,989 −0.006,966,011 0.002,649,374 −0.001,013,63 0.000,386,93 −0.000,147,829 0.000,056,461 −0.000,021,567 0.000,008,238 −0.000,003,146 0.000,001,202 −0.000,000,459 A billing table Here is a billing table where the decimal points are aligned in columns with the column specifier ‘N’ of the package numprint. This table is generated by the environment tabularx stretched to fit 80% of the width of the line. The command has been widely used for formatting: \multicolumn 1 2 3 4 5 6 7 8 9 10 11 12 13 14 15 \nprounddigits2 \let\PC\% \newcommand\Mystrut{\rule[-1.2ex]{0pt}{4ex}} \newcommand\RED{\color{red}} \begin{spreadtab}{{tabularx}{0.8\linewidth}{|>\Mystrut X>\RED N42>\RED c N42>\RED c<\PC N42|}} \hline @Item &@\multicolumn1c{Price/U}& @\multicolumn1c{Qty} & @\multicolumn1c{Price} & @\multicolumn1c{Reduction} & @\ textbf{Net}\\\hline @Item 1 & 5.99 & 20 & [-2,0]*[-1,0] & $-:={20}$ & [-2,0]*(1-[-1,0]/100)\\ @Item 2 & 12 & 7 & [-2,0]*[-1,0] & $-:={10}$ & [-2,0]*(1-[-1,0]/100)\\ @Item 3 & 4.50 & 40 & [-2,0]*[-1,0] & $-:={35}$ & [-2,0]*(1-[-1,0]/100)\\ @Item 4 & 650 & 2 & [-2,0]*[-1,0] & $-:={15}$ & [-2,0]*(1-[-1,0]/100)\\\hline @\multicolumn6c{}\\[-1.5ex]\cline{4-6}% empty line and raise it a little @\multicolumn1c{\Mystrut}&@\multicolumn2{r|}{\textbf{Total}}& sum(d2:[0,-2]) & \multicolumn1c{$:={round (([1,0]/[-1,0]-1)*100,0)}\PC$} & {\fontseries{b}\selectfont}:={sum(f2:[0,-2])}\\ \cline{4-6} \end{spreadtab} Item Price/U Qty 1 2 Reduction Net Item 1 5.99 20 119.80 −20% 95.84 Item 2 12.00 7 84.00 −10% 75.60 Item 3 4.50 40 180.00 −35% 117.00 Item 4 650.00 2 1,300.00 −15% 1,105.00 1,683.80 −17% 1393.44 Total 6.5 Price A magic square \begin{spreadtab}{{tabular}{|*3{>{\hfill\rule[-0.4cm]{0pt}{1cm}$}m{0.7cm}<{$\hfill\null}|}}} \hline LATEXed by Christian Tellechea, the November 6, 2014. 24 spreadtab 3 4 5 6 6 EXAMPLES \color{red}:=2 & 5*b2-4*a1 & 3*a1-2*b2 \\\hline 2*a1-b2 & \color{red}:={-1} & 3*b2-2*a1 \\\hline 4*b2-3*a1 & 4*a1-3*b2 & 2*b2-a1 \\\hline \end{spreadtab} 6.6 2 −13 8 5 −1 −7 −10 11 −4 A pyramid of additions Each number is the sum of two numbers located below it. 1 2 3 4 5 6 7 8 9 10 \newlength\cellsize \setlength\cellsize{1.5cm} \newcolumntype{K}{@{}>{\rule{0pt}{2.5ex}\centering\arraybackslash$}p{\cellsize}<$@{}} \begin{spreadtab}{{tabular}{*{8}{@{}p{.5\cellsize}@{}}}} \cline{4-5} &&&\multicolumn{2}{|K|}{:={[-1,1]+[1,1]}}&&&\\\cline{3-6} &&\multicolumn{2}{|K}{:={[-1,1]+[1,1]}}&\multicolumn{2}{|K|}{:={[-1,1]+[1,1]}}&&\\\cline{2-7} &\multicolumn{2}{|K}{:={[-1,1]+[1,1]}}&\multicolumn{2}{|K}{:={[-1,1]+[1,1]}}&\multicolumn{2}{|K |}{:={[-1,1]+[1,1]}}&\\\hline \multicolumn{2}{|K}{\color{red}:={-5}}&\multicolumn{2}{|K}{\color{red}:={3}}&\multicolumn{2}{|K}{\color{red }:={-2}}&\multicolumn{2}{|K|}{\color{red}:={-3}}\\\hline \end{spreadtab} −5 −1 −4 −2 −5 −5 1 −2 3 −3 ? ? ? That’s all. I hope you will find this package useful! I thank you in advance for sending by email any bug you find, any macro-function or improvment you would like to be implemented, assuming that it must be realistic. This package has to be modest and spreadtab is not excel or calc: it is impossible to implement some advanced features of these spreadsheets.. . . Christian Tellechea LATEXed by Christian Tellechea, the November 6, 2014. 25