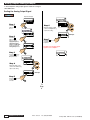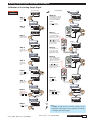
1
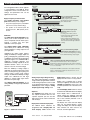
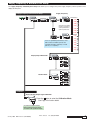
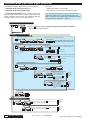
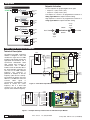
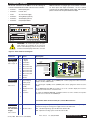
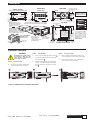
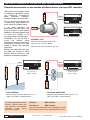
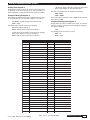
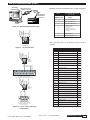
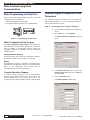
USER MANUAL
DMI-A1 Series
LVDT Indicators
• 1/8 DIN Case
• 3-button Front Panel Operation
• 5-digit, 7-segment 0.56”
(14.2 mm) LED Display
The easiest solution to single input LVDT
display and control applications
Introduction
The DMI-A1 Series are LVDT (Linear Variable Differential Transformer) indicators
that deliver precise measurement and indication for applications using a single
LVDT input.
The 5-digit, 7-segment LED display provides configuration setup prompts for
LVDT parameters using intuitive, easy to follow text menus.
Setup
Options
•
Select 50 or 60 Hz supply frequency.
•
Select decimal point position setting with
resolution to 0.0001 of any engineering unit.
•
Locate the sensor NULL position.
•
Input Signal Calibration:
Perform 2-point zero and span input
signal calibration setting.
Analog Output Signal Calibration:
Calibrate analog output milliamp or
voltage output low and high settings.
Analog Output Scaling
Set the analog output low (zero) and high
(full scale) range settings.
General
Digital Display: 7-segment, 0.56” (14.2 mm) LEDs.
Display Color: Red
Display Range: -19999 to 99999.
Display Update Rate: 10 times per second.
Display Dimming: 8 brightness levels. Front panel selectable.
Polarity: Assumed positive. Displays – negative.
Annunciators: 6 red LEDs on front panel.
Overrange Indication:
Underrange Indication:
Front Panel Controls: PROGRAM, UP, and DOWN buttons.
Power Supplies
Standard high voltage AC / DC power supply 85-265 V
AC / 95-370 V DC.
Optional low voltage AC / DC power supply 18-48 V AC
/ 10-72 V DC.
Environmental
• Analog Output Options
0/4 to 20 mA (or reverse).
Calibration
•
• Relays: Four 5 amp relays.
Specifications
Single 0 to 10 V DC (or reverse).
• Display Zero
Preprogrammed function requires
customer supplied switch to
operate.
• Reset Display Value
Preprogrammed function requires
customer supplied switch to
operate.
Operating Temperature: 0 °C to 50 °C (32 °F to 122 °F).
Storage Temperature: -20 °C to 70 °C (-4 °F to 158 °F).
Relative Humidity: 95% (non-condensing) at 40 °C
(104 °F).
Mechanical
Case Dimensions: 1/8 DIN, 96x48 mm (3.78” x 1.89”).
Case Depth: 137 mm maximum (5.39”).
Case Material:
94V-0 UL rated self-extinguishing
polycarbonate.
Weight: 11.5 oz (0.79 lbs), 14 oz (0.96 lbs) when packed.
Approvals
CE: As per EN-61000-3/4/6 and EN-61010-1.
LVDT Input
Setpoints
Four independent setpoints with individually
configured setpoint actuation values,
preprogrammed for above or below
activation:
• Lo 1, Lo 2 activates below value.
• hi 1, hi 2 activates above value.
Table of Contents
Specifications . . . . . . . . . . . . . . . . . . . . . . . . . . . . . . . . . . . . . . . . . .1
Introduction . . . . . . . . . . . . . . . . . . . . . . . . . . . . . . . . . . . . . . . . . . .1
Configuration Menu . . . . . . . . . . . . . . . . . . . . . . . . . . . . . . . . . . . . .2
Supply Frequency and Decimal Point Setup . . . . . . . . . . . . . . . . . .3
Calibration Mode (LVDT Input Signal Calibration) . . . . . . . . . . . . . .4
Calibration Mode (Zero Options) . . . . . . . . . . . . . . . . . . . . . . . . . . .5
Calibration Mode (Analog Output Signal Calibration) . . . . . . . . . . .5
Analog Output Range Scaling Mode . . . . . . . . . . . . . . . . . . . . . . . .5
Setpoints . . . . . . . . . . . . . . . . . . . . . . . . . . . . . . . . . . . . . . . . . . . . .6
Input Signal Setup Procedures . . . . . . . . . . . . . . . . . . . . . . . . . . . .6
Connector Pinouts . . . . . . . . . . . . . . . . . . . . . . . . . . . . . . . . . . . . . .7
Installation . . . . . . . . . . . . . . . . . . . . . . . . . . . . . . . . . . . . . . . . . . . .9
Analog Output Scaling Example . . . . . . . . . . . . . . . . . . . . . . . . . . . .10
Analog Output Signal Calibration Example . . . . . . . . . . . . . . . . . . . .11
Serial Communications . . . . . . . . . . . . . . . . . . . . . . . . . . . . . . . . .13
31 May, 2006 DMI-A1 Series (ALD-00030)
Macro Sensors
Excitation Voltage:
3 V RMS sine wave, zero DC
component THD <2% (1.2 kHz).
Excitation Frequency: 50 Hz: 3.2 kHz. 60 Hz: 2.88 kHz.
For other excitation frequencies contact Macro Sensors.
Temperature Coefficient: ± 50 ppm/ ° C of full scale (typical).
LVDT Input: 30 k input impedence. Synchronous
demodulation of excitation carrier. >130 db rejection of
excitation carrier.
Frequency Response: 500 Hz (–3 db) low-pass filter.
Analog to Digital: Single channel ΣΔ A/D convertor
approaching 19-bit resolution. Ratiometric operation
relative to excitation voltage magnitude.
Output Rate: 10 Hz averaged response output.
Line Frequency Rejection: 50 / 60 Hz noise rejection.
Relays
Plugs into carrier board from rear:
Four 5 A Form A Relays.
Form A Relay Specifications: 5 A 240 VAC.
Isolation 3000 V. UL and CSA listed.
Tel. (856) 662-8000
www.macrosensors.com
1
Configuration Menu
The Configuration Menu shown opposite
is a flow diagram of the DMI-A1 Series
configuration menus and describes the
settings and parameters that can be
applied in each menu.
OPERATIONAL
DISPLAY
Prog.
SP1
SP2
SP3
SP4
SP5
SP6
Supply Frequency & Decimal Point
P
Start
Prog.
SP1
SP2
SP3
SP4
SP5
SP6
4 Secs
Prog.
Supply Frequency & Decimal Point
The supply frequency and decimal
point menu allows you to configure:
P
SP1
MIN MAX
RANGE
REL
SP2
SP3
SP4
SP5
SP6
SP1
SP2
SP3
SP4
HOLD
Hz
PEAK MIN MAX
mV
V
mA
A
V
µA
Prog.
SP5
SP6
OFF
A
mA µA COM V
+ –
SP5
Prog.
SP6
SP1
SP2
SP3
SP1
SP2
SP3
SP4
SP1
SP5
SP2
Pin 2–
Pin 3+
www.macrosensors.com
SP4
SP5
SP6
P
Takes you into the Setup menu that
provides selection for:
• Supply frequency: 50 or 60 Hz.
• Decimal point position: No dp, 0.1,
0.12, 0.123, 0.1234.
SP6
SP3
SP4
SP5
Prog.
SP6
SP1
SP2
SP3
SP4
SP5
SP6
P
Takes you into the Input Signal
Calibration menu that provides
selection for:
• Locating sensor NULL position.
• 2-point input signal calibration with
zero and span settings.
• Analog output signal calibration that
provides analog output signal 0/4-20
mA or 0-10 V low and high calibration
settings
Analog Output Signal Range Scaling
P
Prog.
SP1
SP2
SP3
Prog.
Prog.
SP1
SP2
SP3
SP4
SP5
SP6
SP4
SP1
SP5
SP2
SP6
SP3
SP4
SP5
Prog.
SP6
SP1
SP2
SP3
SP4
SP5
SP6
P
Takes you into the Analog Output
Signal Range Scaling menu and allows
you to set the low and high range settings
for the calibrated analog output signal.
Setpoints
Start P
Prog.
SP1
SP2
SP3
SP4
SP5
SP6
Together
Prog.
SP1
SP2
SP3
SP4
SP5
SP6
Takes you into the Setpoints menu and allows you to
set the setpoint activation value for the four setpoints.
Setpoint Lo 1 and Lo 2 activate below the setpoint activation
value, so that when the signal falls below the Lo 1 or Lo 2 value
Lo 1 or Lo 2 activates.
Setpoint hi 1 and hi 2 activate above the setpoint activation
value, so that when the signal rises above the hi 1 or hi 2
value,hi 1 or hi 2 activates.
Analog Output Signal Range Scaling
The analog output module is a standard
single channel, programmable, isolated,
16-bit analog output that can be scaled
to any desired span between –19999 to
99999 display counts using the analog
output signal range scaling menu.
Setpoints
The setpoints menu allows you to set
the setpoint activation value for four
separate setpoints (two low and two
high) which can be used to activate the
four 5A relays.
TERMINAL 4
Figure 1 – Multimeter Connections
2
Prog.
Prog.
The analog output signal calibration
menu allows you to calibrate the analog
output’s milliamp or voltage output to suit
your application.
MULTIMETER
SP4
NO changes reqd.
P
Calibration
The LVDT input signal calibration menu
allows you to set the null position of the
sensor, if required, and also allows you to
perform a 2-point zero and span
calibration of the input signal.
See Analog Output Procedures for an
analog milliamp or voltage output calibration
procedure.
SP3
Input & Analog Output Signal Calibration
• The position of the decimal point: No
decimal point, 0.1, 0.12 (default), 0.123,
0.1234.
Once the milliamp or voltage output is
calibrated, the analog output range can be
easily rescaled [An Lo] [An hi] using the
analog output scaling mode without
having to recalibrate the milliamp or voltage
output. The calibrated low and high
milliamp or voltage output signal values
follow the new span range.
SP2
Calibration
• The power supply frequency: 50 or 60 Hz
(60 Hz is the factory default setting).
Calibrating the analog output requires
setting the milliamp or voltage output low
[CAL_L] and high [CAL_h] parameters using
a multimeter connected to the analog output
signal (See Figure 1 for an DMI-A1-100 to
multimeter connection diagram). The
calibrated low and high outputs can be set
anywhere between –0.3 to +21 mA for
current or –0.3 V to +10.5 V for voltage.
SP1
Display Zero and Reset Display Value
The DMI-A1 Series indicators are
programmed with a display zero and
reset display value function. The
Macro Sensors
Tel. (856) 662-8000
display zero function is used to zero the
display when the sensor is in any position.
Display zero is initiated from a remote
switch (not supplied) connected across the
common and hold pins at the rear of the
controller (Terminal 2: Pin 4 Common, Pin 2
Hold).
The reset display value function is used to
restore the true calibrated value on the display.
Reset display value is initiated from a
remote switch (not supplied) connected
across the common and lock pins at the
rear of the controller (Terminal 2: Pin 4
Common, Pin 1 Lock).
The display zero value and reset display
value are not retained during a power
outage. The display zero and reset display
value functions are often used for cut,
measure, and trim applications.
31 May, 2006 DMI-A1 Series (ALD-00030)
Supply Frequency & Decimal Point Setup
The supply frequency & decimal point setup mode allows you to configure the power supply frequency and the position of the
display decimal point.
Supply Frequency & Decimal Point Setup
P
Supply Frequency
60 Hz Selection
Prog.
Prog.
SP1
SP2
SP3
SP4
SP5
Prog.
SP6
4 Secs
Prog.
SP1
SP2
SP3
SP4
SP5
SP6
Prog.
SP1
SP2
SP3
SP4
SP5
SP6
P
SP1
SP2
Prog.
SP3
SP4
SP1
SP5
SP2
SP1
SP3
SP2
SP4
SP5
SP6
SP6
SP3
SP4
SP5
[ 1.92]
P
YES
SP6
Prog.
SP1
SP3
SP2
SP4
SP5
SP6
[ 2.88]
[ 3.84]
Select sensor excitation
frequency according to
sensor specification to
optimize performance.
OR
[ 5.76]
[ 7.68]
[ 9.60]
[ 11.52]
50 Hz Selection
Prog.
Prog.
YES
SP1
SP2
SP3
SP4
SP5
YES
SP6
SP1
P
SP3
SP2
SP4
Prog.
SP5
SP1
SP6
SP3
SP2
SP4
SP5
SP6
[
1.6]
[
2.4]
Note: For optimum performance, most
[
3.2]
Macro Sensors LVDTs operate at a
standard excitation frequency of 2.88
(60 Hz) or 3.2 (50 Hz)
[
4.8]
[
6.4]
[
8.0]
[
9.6]
Display Output Rate Filter
Prog.
SP1
SP2
SP3
SP4
SP5
SP6
P
Prog.
SP1
SP2
SP3
SP4
SP5
SP6
Prog.
SP1
SP2
SP3
SP4
SP5
SP6
Prog.
SP1
SP2
SP3
SP4
SP5
SP6
Prog.
SP1
SP2
SP3
SP4
SP5
SP6
OR
OR
Prog.
Decimal Point
P
Prog.
SP1
SP2
Prog.
SP3
SP4
SP1
SP5
SP2
SP1
SP2
SP3
SP4
SP5
SP6
SP6
SP3
SP4
SP5
Prog.
SP1
SP2
SP3
SP4
SP5
SP6
Prog.
SP1
SP2
SP3
SP4
SP5
SP6
SP6
Default
Prog.
SP1
SP2
SP3
SP4
SP5
SP6
Calibration
Input & Analog Output Signal Calibration
P
Prog.
SP1
SP2
Prog.
SP3
SP4
SP1
SP5
SP2
YES
SP6
SP3
SP4
SP5
SP6
Press the button to enter the Calibration Mode
See Page 4 for further details
P
Or press the P button 2 times to
EXIT (bypassing the analog setup)
and return to the Operational Display
31 May, 2006 DMI-A1 Series (ALD-00030)
Macro Sensors
Tel. (856) 662-8000
www.macrosensors.com
3
Calibration Mode (LVDT Input Signal Calibration)
The Calibration Mode is divided into two separate sections;
These are:
a) calibration of the LVDT input signal and
b) calibration of the analog output signal
• Adjusting the LVDT to a null position.
• A dual position, zero and span calibration procedure.
The Input Signal Calibration mode is used to calibrate the
physical position of the sensor to the meter display. The Input
Signal Calibration mode provides two individual calibration
techniques which are shown in the diagram below.
Note: Calibration procedures can not be carried out on a
signal if the signal has an active linearization table. The
table or tables must be disabled before calibration and then
re-activated when calibration is complete.
Supply Frequency & Decimal Point Setup
P
Prog.
SP1
SP3
SP2
SP4
SP5
Press the button to enter the Supply Frequency & Decimal Point Setup
See Page 3 for further details
SP6
4 Secs
Prog.
SP1
SP3
SP2
SP4
SP5
SP6
P
Calibration
CAUTION: Do not enter the Calibration menu unless you are sure you want to change the calibration parameters.
Input Signal Calibration
P
Prog.
SP1
SP3
SP2
Prog.
SP4
SP1
SP5
SP3
SP2
Prog.
SP6
SP4
SP5
Prog.
SP6
SP1
SP3
SP2
SP4
SP5
SP6
P
SP1
SP2
SP3
Prog.
SP4
SP1
SP5
SP2
Adjust the sensor to locate the NULL position.
Example Sensor
LVDT Sensor NULL position must be located
before calibration to ensure correct operation.
NULL POSITION
SP6
SP3
SP4
SP5
SP6
Example
P
Prog.
SP1
SP3
SP2
Prog.
SP4
SP1
SP5
SP3
SP2
Prog.
SP6
SP4
SP5
Prog.
SP6
SP1
SP2
SP3
SP4
SP5
SP6
P
SP1
SP2
SP3
Prog.
SP4
SP1
SP5
SP2
Adjust the sensor to the required zero position. Adjust the display value
using the
buttons. Press the P button to accept the sensor's new
zero value.
Example Sensor
SP6
SP3
x2
SP4
SP5
SP6
Max counts 99999
Example
Min counts –19999
ZERO POSITION
P
Prog.
SP1
SP2
SP3
Prog.
SP4
SP1
SP5
SP2
Adjust the sensor to the required span position. Adjust the display value
using the
buttons. Press the P button to accept the sensor's new
span value.
Example Sensor
Max counts 99999
SP6
SP3
SP4
SP5
SP6
Example
P
Prog.
SP1
SP3
SP2
Prog.
SP4
SP1
SP5
SP2
Prog.
SP6
SP3
Min counts –19999
SPAN POSITION
Analog Output Signal Calibration
SP4
SP5
Prog.
SP6
x3
SP1
SP2
SP3
SP4
SP5
SP6
P
P
[ PrESS P And uP]
Prog.
Scrolls across display
SP1
SP2
SP3
SP4
SP5
SP6
SP1
SP2
Prog.
SP3
SP4
SP1
SP5
SP2
SP6
SP3
SP4
SP5
SP6
Together
DMI-A1 Connected to Multimeter
Prog.
P
SP1
SP2
Prog.
SP3
SP4
SP1
SP5
SP2
Prog.
SP6
SP3
SP4
SP5
SP6
P
SP2
SP3
Prog.
Prog.
P
SP1
SP1
SP2
Prog.
SP4
SP1
SP3
SP4
SP1
SP5
SP2
SP5
SP2
Ensure the correct low analog
output signal reading [CAL_L] is
shown on the multimeter.
SP6
SP3
SP4
SP5
SP6
Ensure the correct high analog
output signal reading [CAL_h] is
shown the multimeter.
SP6
SP3
If not correct, press the
OR
button on the DMI-A1 until
the reading on the multimeter
display is correct.
SP4
SP5
SP6
If not correct, press the
OR
button on the DMI-A1 until the
reading on the multimeter display
is correct.
Max counts
99999
Min counts
–19999
Max counts
99999
Min counts
–19999
Together
Prog.
SP1
P
SP2
SP3
Prog.
SP4
SP1
SP5
SP2
SP6
SP3
SP4
SP5
SP6
P
Analog Output Range Scaling
Prog.
P
SP1
SP2
Prog.
SP3
SP4
SP1
SP5
SP2
Prog.
SP6
SP3
SP4
SP5
SP6
P
SP1
SP2
SP3
Prog.
SP4
SP1
SP5
SP2
Set the counts required to be displayed for the calibrated
low analog output value using the
buttons. Press the
P button to accept the new low value.
SP6
SP3
SP4
SP5
Max counts
99999
Min counts
–19999
SP6
Default
Prog.
P
SP1
SP2
Prog.
SP3
SP4
SP1
SP5
SP2
Set the counts required to be displayed for the calibrated
high analog output value using the
buttons. Press the
P button to accept the new high value.
SP6
SP3
SP4
SP5
SP6
Max counts
99999
Min counts
–19999
Default
4
www.macrosensors.com
Macro Sensors
Tel. (856) 662-8000
31 May, 2006 DMI-A1 Series (ALD-00030)
Calibration Mode (Zero Options)
NULL
The NULL position allows the user to adjust the LVDT core until
the LVDT output is zero. The sensor must be brought to NULL
position before calibrating. The "NULL" position is the physical
point at which the LVDT output is "electrically centered" (neither
positive or negative). This corresponds roughly to the mechanical
center of the unit. Please refer to the "N" dimension on the line
drawing of your particular LVDT at www.macrosensors.com.
The display zero function is used to zero the display. Display zero
is initiated from a remote momentary switch (not supplied)
connected across the common and hold pins at the rear of the
controller (Terminal 2: Pin 4 Common, Pin 2 Hold).
Display Zero and Reset Display Value Function
The reset display value function is used to restore the true
calibrated value on the display. Reset display value is initiated from
a remote momentary switch connected across the common and
lock pins at the rear of the controller (Terminal 2: Pin 4 Common,
Pin 1 Lock).
The controller has been programmed with a display zero and
reset display value function that operates on the selected primary
display reading only.
The display zero value and reset display value are not retained
during a power outage. The display zero and reset display value
functions are often used for cut, measure, and trim applications.
Calibration Mode (Analog Output Signal Calibration)
Calibrating the analog output means ensuring the LOW and
HIGH analog output signals are correct using a calibration
device such as a multimeter. This should not be confused
with calibrating the physical position of the sensor to
the meter (see page 4)!
Calibration requires setting the [CAL_L] and [CAL_h]
parameters. [CAL_L] is used to set the calibrated low analog
output, and [CAL_h] is used to set the calibrated high analog
output. The calibrated low and high outputs can be set
anywhere between –0.3 to 21 mA for current, or –0.3 to 10.5
V for voltage.
• Check the analog output scaling (zero and full scale display
settings) and if necessary, carry out the analog output
scaling procedure to set zero and full scale settings.
• Check the analog output on the multimeter at the zero and
full scale display settings and, if required, carry out the
analog output calibration procedure to calibrate the millamp
(or voltage) output low and high settings.
A step by step procedure that shows an actual example of
how to calibrate the analog output signal is shown on page
11 of this manual.
Before calibrating the analog output:
• See Figure 1. Connect a multimeter to the analog output
connector at the rear of the meter (Terminal 4: Pin 3 positive,
Pin 2 negative).
• Make sure the multimeter is set to read the appropriate
signal type: volts or milliamps.
Note: Calibration procedures can not be carried out on a
signal if the signal has an active linearization table. The
table or tables must be disabled before calibration and then
re-activated when calibration is complete.
Analog Output Range Scaling Mode
The analog output module is a standard single channel,
programmable, isolated, 16-bit analog output that can be
scaled to any desired span between –19999 to 99999
display counts using the analog output scaling mode.
Range Scaling
Range scaling requires setting the low analog output value
[Ao_Lo] and high analog output value [Ao_hi] of the analog
output.
The low value is the display setting at which the analog
output is required to be at its calibrated low output. The high
value is the full scale display setting at which the analog
output is required to be at its calibrated high output.
There are no limits to the difference between the zero and
full scale settings. The difference can be anywhere between
1 count and the entire display range of the meter.
A step by step procedure that shows an actual example of
how to scale the analog output is shown on page 10 of this
manual.
31 May, 2006 DMI-A1 Series (ALD-00030)
Macro Sensors
Tel. (856) 662-8000
www.macrosensors.com
5
Setpoints
Setpoint Activation
Setpoints
The four setpoints are grouped together in two pairs:
START
P
Prog.
SP1
SP2
SP3
SP4
SP5
Max counts
99999
SP6
Together
Prog.
SP1
SP2
SP3
SP4
SP5
SP6
Default
P
Prog.
SP1
SP2
SP3
Prog.
SP4
SP1
SP5
SP2
Max counts
99999
SP6
SP3
SP4
SP5
SP6
Default
P
• Setpoint Lo 2 (SP3) and hi 2 (SP4).
Low setpionts Lo 1 and Lo 2 are programmed to activate on a
falling signal below the setpoint activation setting.
High setpionts hi 1 and hi 2 are programmed to activate on a
rising signal above the setpoint activation setting.
Min counts
–19999
ABOVE
Prog.
SP1
SP2
SP3
Prog.
SP4
SP1
SP5
SP2
Max counts
99999
SP6
SP3
SP4
SP5
SP6
Default
P
Min counts
–19999
• Setpoint Lo 1 (SP1) and hi 1 (SP2).
Prog.
SP1
SP2
Prog.
SP3
SP4
SP1
SP5
SP2
Falling
LVDT
Signal
hi 1 / hi 2
BELOW
Max counts
99999
SP6
SP3
ACTIVATION SP
Lo 1 / Lo 2 SP
Min counts
–19999
Rising
LVDT
Signal
SP4
SP5
SP6
Default
Min counts
–19999
Input Signal Setup Procedures
Technical Description
LVDT 1
See Figure 2. The LVDT smart input
module is designed to drive and
condition the signal from an LVDT
transducer. The module contains two
high-speed microcontrollers and a
synchronous demodulator 16-bit
dual channel A/D convertor. It
communicates with a DMI-A1
indicator via the I2C data bus. One of
the microcontrollers generates the
sine wave for the LVDT excitation
frequency. The frequency is
produced as multiples of the line
frequency (either 50 Hz or 60 Hz).
The output to the primary coil of the
LVDT is a 3 V RMS sine wave. The
received
LVDT
signal
is
synchronously demodulated and
filtered to remove the carrier
frequency. The Σ Δ 16-bit A/D
convertor has over 130 dB noise
rejection at the excitation frequency.
+ 5V
— 5V
GND
500 Hz
LPF
+ SIGNAL 1
+ 24 V
—SIGNAL 1
16-Bit
ATD
Synchronous
Demodulator
SHIELD
3 V RMS
Audio
Sine wave
Generator
16 Programmable
Excitation Frequencies
Microcontroller
I2C Bus
DMI-A1
Interface
+24V
PCB 345
Figure 2 – LVDT Smart Input Module Functional Schematic
LVDT
+ SIGNAL
— SIGNAL
PIN 1
— EXC
+ EXC
PIN 3
PIN 2
PIN 4
Not Connected
Not Connected
Not Connected
Not Connected
PIN 5
Not Connected
GND
SHIELD
PIN 9
PIN 6
PIN 7
PIN 8
PIN 10
PIN 11
34
Figure 3 – Example LVDT Input Connection to LVDT Smart Input Module
6
www.macrosensors.com
Macro Sensors
Tel. (856) 662-8000
31 May, 2006 DMI-A1 Series (ALD-00030)
Connector Pinouts
All external connections to the DMI-A1 is via the following six
connector terminal blocks located at the rear of the controller:
• Terminal 1:
LVDT Input Signals.
• Terminal 2:
Function Pins.
• Power:
AC / DC Power Supply.
• Terminal 4:
Analog Output (optional).
• Terminal 5:
Serial Output (optional).
• Terminal 6:
Relay Output Module.
TERMINAL 5
Serial Output
TERMINAL 6
Output Module
TERMINAL 4
Analog Output
1 2 345 6
2
1
5
4
3
6
6 7 8
Dual Analog
Output ONLY
2
1
8
7
TERMINAL 2 Function Pins
TERMINAL 1 Input Module
1 2 3 4 5
DMI-A1 indicators use plug-in type screw terminal connectors
for most input and output connections, an RJ-11 phone
connector for the optional RS-232 serial output, and an RJ-45
phone connector for the optional Ethernet output.
9 10 11
1
2
3
LOCK
HOLD
TEST
POWER
1
5
4
3
2
COM CAPTURE
WARNING:
AC and DC input signals and power
supply voltages can be hazardous. Do not connect live
wires to screw terminal plugs, and do not insert, remove,
or handle screw terminal plugs with live wires connected.
Figure 4 – Rear Panel Pinout Diagram
Connector
TERMINAL 1
Input Signals
Pins 1 up to 11
TERMINAL 2
Pin
Description
1
2
3
4
5
6
7
8
9
10
11
+ Signal
– Signal
–Excitation
+Excitation
Not Connected
Not Connected
Not Connected
Not Connected
Not Connected
Ground
Shield
LVDT Smart Input Module
1
Reset Display
Value (Lock)
By connecting Pin 1 (lock) to Pin 4 (common) with a remote spring-return switch restores the
display to the true calibrated value.
2
Display Zero
(Hold)
By connecting Pin 2 (hold) to Pin 4 (common) with a remote spring-return switch zeroes the
display.
3
Display Test and
Reset
Pin 3 (display test and reset pin) provides a test of the controller’s display and resets the
microprocessor when Pin 3 is connected to Pin 4.
4
Common
To activate the hold, test and reset, or lock pins from the rear of the controller, the respective
pins have to be connected to the common pin.
5
-
-
Function Pins
Pins 1 to 5
Name
+ SIGNAL
— SIGNAL
PIN 1
PIN 2
— EXC
+ EXC
PIN 3
PIN 4
Not Connected
Not Connected
Not Connected
Not Connected
PIN 5
Not Connected
GND
SHIELD
PIN 9
PIN 6
PIN 7
PIN 8
PIN 10
PIN 11
345
For further details on the function pins, contact Macro Sensors.
POWER
1
AC Neutral / DC –
Auto Sensing
AC / DC Power
Supply
2
AC Line / DC +
The power connector supplies AC / DC power to the controller via a standard high voltage or
optional low voltage auto-sensing power supply mounted on the main board.
PS1:
Standard High Voltage option. 85-265 V AC / 95-370 V DC.
PS2:
Optional Low Voltage option. 14-48 V AC / 10-72 V DC.
Pins 1 and 2
31 May, 2006 DMI-A1 Series (ALD-00030)
Macro Sensors
Tel. (856) 662-8000
www.macrosensors.com
7
Pin
Connector
TERMINAL 4
Analog Outputs
Pins 1 to 3
Name
Description
TERMINAL 4 connects the analog output module to external devices. A single 0~4 to 20 mA (standard) or (optional) 0 to 10 V DC is
supported on the standard or Ethernet carrier board.
1
-
-
2
Negative (–)
Negative for Analog Output.
3
Positive (+)
Positive for Analog Output .
TERMINAL 5
TERMINAL 5 connects an optional serial output module to external devices.
Serial Outputs
The standard carrier board supports a single or dual RS-232 ASCII or Modbus serial
card connected thru an RJ-11 socket.
Pins 1 up to 8
STANDARD CARRIER BOARD
Pin No.
RJ-11
1 2 3 4 5 6
1
2 3 4 5 6 7
RJ-45
TERMINAL 6
Relay Outputs
Pins 1 up to 8
8
ETHERNET CARRIER BOARD
RS-232 (ASCII or Modbus) RJ-11 Socket
Single Output
RJ-45 Socket
(10/100 Base-T)
Dual Output
1
Reserved for future use
RXD1
White/Orange
TXD+
2
Isolated Ground
0V
Orange
TXD–
3
+5 VDC to power external converters 0 V1
White/Green
RXD+
4
TXD. Transmitted Serial
Blue
–
5
RXD. Received Serial
RXD
White/Blue
–
6
Reserved for future use
TXD1
Green
RXD–
7
Not applicable
Not applicable White/Brown
–
8
Not applicable
Not applicable Brown
–
TXD
The Ethernet carrier
board uses an RJ45 socket at 10/100
Base-T.
8
TERMINAL 6 connects electromechanical
relays to external applications.
1
2
3
4
5
6
7
8
Normally Open
Common SP4
Normally Open
Common SP3
Normally Open
Common SP2
Normally Open
Common SP1
www.macrosensors.com
SP4
With 4 relays installed, an 8-pin connector block is used.
Relay Modules with
Four 5 A Form A Relays
SP4
SP3
SP2
SP1
SP3
SP2
1
2
3
4
5
6
7
8
SP4
SP3
SP2
SP1
5A
5A
5A
5A
SP1
Macro Sensors
Tel. (856) 662-8000
31 May, 2006 DMI-A1 Series (ALD-00030)
Installation
PANEL CUTOUT
FRONT VIEW
Case will mount in standard 1/8 DIN coutouts
1/8 DIN 96x48mm
4 mm
(0.16")
8 places
Mosaic Fitting 87.4 mm
(3.45") 43.4 mm
40.8 mm
(1.71")
(1.61")
91.6 mm Snug Fitting
(3.6")
3 12")
8 places
1/8 DIN
Cutout spacers
92 mm
(3.62")
Prog.
Loose Fitting
Metal Surround Case uses
Metal Screw Mount Clips and
has a max. panel thickness
mounting of 15.5 mm
(0.61").
48 mm
(1.89")
45 mm
(1.77")
SP1
SP2
SP3
SP4
SP5
96 mm
(3.78")
Metal Surround Case: These dimensions are increased
by 1.6 mm (0.06") when the metal surround case is installed.
Removable
Key-lock
Cam
Opening
When extra panel
mounting tightness is
required, order the
optional screw mount clip.
P/N:(OP-MTLCLIP)
117 mm
(4.61")
5.3 mm
(0.21")
g.
Pro
(1.61")
SP6
Metal Surround Case
(P/N: OP-MTL96X48)
NOTE: The Metal Surround Case
is pre-installed at the factory and cannot
be removed without damage to the case.
Safety
Catch
Panel adaptor plates are
available to retrofit most
40.8 mm existing panel cutouts.
43.4 mm
(1.71")
DIN Cutout spacers
3.9 mm
(0.15") typical
Clear Lockable NEMA 4X
Splash Proof Cover
P/N:(OP-N4/96x48)
Straight-thru Connector for
meters with output board
20 mm (0.79")
SIDE VIEW
3.7 mm
(0.15")
SP1
Max. panel thickness
50mm
(1.97")
SP6
SP5
SP4
SP3
SP2
96 mm
(3.78")
TOP VIEW
To open rear cover,
use a small flat
blade screw driver.
Press down lightly to
release catch on top
or bottom of case
and lever outwards.
91.6 mm
(3.6")
DIN
Cutout
Spacer
Various bezel
colors are available.
Black is standard.
4.7 mm
(0.19")
DIN Cutout Spacer
Right-angled Connector
11.8 mm (0.47")
Prog.
SP1
SP2
SP3
SP4
SP5
SP6
Prog.
SP1
SP2
SP3
SP4
SP5
SP6
95.4 mm
(3.77") Macro Sensor's 96x48 mm
87.4 mm
(3.45")
mosaic
fitting
For additional strength, extra Mounting
Slide Clips can be ordered and doubled up
one behind the other. P/N: (75-DMTCLIPF)
case is particularly suitable
for mounting in mosaic
panels or insulative panels
up to 2" thick. They can
also stack mount, 2 up in
existing cutouts for 1/4 DIN
(96x96 mm) or 4 up in 1/2
DIN (96X192 mm).
2 mm
(0.08")
Connector
Socket
Installation Procedure
WARNING
AC and DC power supply voltages
are hazardous. Make sure the
power supply is isolated before
connecting to the meter.
STEP A
1)
Prepare the Panel
STEP B
STEP C
Connect the Cables
1)
Remove both mounting clips from the meter. 1
1)
Connect all input and output signal cables to the
connector pins (See Connector Pinouts for details).
2)
Push the meter into the panel cutout from the
front of the panel. 2
2)
Connect the power cables to the connector pins
(See Connector Pinouts for details).
3)
Cut a hole in the panel to suit the panel
cutout. See panel cutout sizes above.
1
Install the Meter
Attach both mounting clips to the meter from
the rear of the panel and push them towards
the front of the panel until the meter is firmly
held. 3
2
3
Figure 5 – DMI-A1 Series Installation Sequence
31 May, 2006 DMI-A1 Series (ALD-00030)
Macro Sensors
Tel. (856) 662-8000
www.macrosensors.com
9
Analog Output Scaling Example
In this example the analog output signal is scaled over a range of
50 to 3000 counts.
Scaling the Analog Output Signal
STAR
T HERE
START
Operational Display
Prog.
Prog.
Step 1
SP2
SP3
SP4
SP5
SP1
SP2
SP3
SP4
SP5
SP6
SP6
Press
for 4
secs
Press the P
button for
4 secs
Step 6
Prog.
SP1
SP3
SP2
SP4
SP5
SP6
OR
Adjust the display to 3000
counts for the high analog
output scale setting
Prog.
SP1
SP2
Prog.
Step 2
SP3
SP4
SP5
SP6
Example
SP1
SP2
SP3
SP4
SP5
SP6
Prog.
Press
Press the P
2
button two
times to skip the
Supply Frequency
and Decimal Point
Setup and Calibration
modes and enter the
Analog Output mode
Step 3
SP1
Step 7
Press the P button to
accept the new
high value
Prog.
SP1
SP3
SP2
SP4
SP5
SP1
SP2
SP3
SP4
SP5
SP6
Press
1
Scaling of the analog output
signal is now complete!
SP6
Press
1
Press the P button to
confirm the Analog
Output Selection.
Prog.
Prog.
Step 4
SP1
SP2
Prog.
SP3
SP4
SP1
SP5
SP2
SP1
SP2
SP3
SP4
SP5
SP6
SP6
SP3
SP4
SP5
SP6
OR
Adjust the display to 50
counts for the low analog
output scale setting
Example
Prog.
Step 5
Press the P button to
accept the new
low value
SP1
SP2
SP3
SP4
SP5
SP6
Press
1
To
Step
6
10
www.macrosensors.com
Macro Sensors
Tel. (856) 662-8000
31 May, 2006 DMI-A1 Series (ALD-00030)
Analog Output Signal Calibration Example
Calibration of the Analog Output Signal
From Step 9
Operational Display
STAR
T HERE
START
Prog.
Step 1
Press the P
button for
4 secs
SP1
SP2
SP3
SP4
SP5
With the DMI-A1 connected
to a multimeter, the DMI-A1
displays [CAL] [151]. This
is the setting for analog
output 1.
Press
for 4
secs
Prog.
Step 2
X
Select Enter
Prog.
Step 10
SP6
SP1
SP2
SP3
SP4
SP5
SP1
SP2
SP4
SP3
SP4
SP1
SP5
SP2
SP6
SP3
SP4
SP5
SP6
DO NOT CHANGE
THIS SETTING.
Press
1
Press P to start the
calibration procedure
SP6
SP3
SP2
Prog.
MULTIMETER
Prog.
SP1
SP5
Prog.
SP1
SP2
SP3
SP4
SP5
SP6
SP6
MIN MAX
RANGE
REL
HOLD
Hz
PEAK MIN MAX
Prog.
mV
Step 11
Step 3
Enter the Supply
Frequency menu
Prog.
X
Step 4
X
Pass thru the
Decimal Point
menu
SP3
SP4
SP5
SP1
SP2
SP3
SP4
SP5
If not correct, press the
OR
button on the
DMI-A1 until the reading
on the multimeter
display is correct.
SP6
µA
SP1
SP2
SP3
SP4
SP5
SP6
OR
TERMINAL 4
Pin 2–
A
mA µA
Pin 3+
COM V
X
+ –
MULTIMETER
MIN MAX
RANGE
REL
Example
HOLD
Hz
PEAK MIN MAX
mV
V
mA
A
V
µA
Prog.
Prog.
SP1
SP2
SP3
SP4
SP5
Step 12
SP6
SP2
Prog.
SP3
SP4
SP1
SP5
SP2
SP3
SP4
Press
1
+ –
Step 13
SP6
SP5
MIN MAX
SP2
SP3
SP4
SP5
SP2
SP4
SP5
SP6
SP2
SP3
SP4
Pin 3+
SP5
SP6
Hz
Prog.
mA
A
V
µA
A
mA µA
COM V
SP1
SP2
SP3
SP4
SP5
SP6
OR
TERMINAL 4
X
Pin 2–
Pin 3+
+ –
MULTIMETER
SP6
SP3
SP4
HOLD
V
OFF
RANGE
REL
SP1
SP3
PEAK MIN MAX
MIN MAX
Prog.
RANGE
REL
SP1
mV
If not 10.00 V DC, press
the
OR
button on
the DMI-A1 until the
reading on the multimeter
display is correct.
SP1
SP2
Pin 2–
Prog.
MULTIMETER
Ensure the high analog
output signal reading
[CAL_h] on the multimeter
display is 10.00 V DC.
SP6
SP1
COM V
TERMINAL 4
Save the low analog
output signal setting.
Enter analog output
high signal calibration
SP1
mA µA
A
Step 6
Press the button
3 times to jump to the
Output menu
V
OFF
Press
1
Prog.
mA
A
OFF
Ensure the low analog
output signal reading
[CAL L] on the multimeter
display is 0.00 V DC.
SP6
Press
1
Prog.
Step 5
SP2
Press
1
Prog.
Pass thru the
Supply Frequency
menu
SP1
V
SP5
SP6
HOLD
Hz
PEAK MIN MAX
Press
x3
mV
V
mA
A
V
µA
OFF
A
Prog.
Step 7
Enter the Analog
Output menu
Step 14
SP1
SP2
SP3
SP4
SP5
Press P button
to leave the CAL
menu
SP6
Press
1
mA µA
COM V
X
Step 8
X
Display scrolls
[PrESS P and uP]
Press
Press P and
at same
time
buttons at the
same time
Prog.
Step 9
X
Press P to enter the
Calibration menu
Press
SP1
SP2
Prog.
SP1
SP2
Prog.
SP3
SP4
SP1
SP3
SP2
SP4
SP1
SP5
SP2
SP4
SP5
SP6
Press
1
SP6
SP3
SP4
SP5
SP6
Step 15
Press
at same
time
Press P and buttons at
the same time to return to
the operational display
To
Step
10
1
31 May, 2006 DMI-A1 Series (ALD-00030)
SP2
SP3
SP4
SP5
SP6
Pin 2–
SP1
SP2
SP3
SP4
SP5
Pin 3+
SP6
SP6
SP3
SP5
SP1
TERMINAL 4
Prog.
Prog.
Prog.
+ –
Macro Sensors
Prog.
SP1
SP2
SP3
SP4
SP5
SP6
Prog.
SP1
SP2
SP3
SP4
SP5
SP6
Press
at same
time
Press
at same
time
Operational Display
Note:
In Steps 11 and 13 the 0-10 V DC settings can be
replaced by other ranges such as 0-20 mA or 4-20 mA,
or settings within these ranges.
Tel. (856) 662-8000
www.macrosensors.com
11
Application Examples for the DMC-A2 Dual Input Controllers
Differential measurements are now available with Macro Sensors’ dual input LVDT controllers
LVDT sensors can be applied in almost
all engineering applications covering
civil, mechanical, petrochemical,
power
generation,
production,
aerospace, defence, and much more.
LVDT 1
1
LVDT 2
They can be used on production lines
to automatically gauge products for
quality control and product sorting.
Prog.
SP1
SP2
SP3
SP4
SP5
SP6
Operational Display (CH1)
In the power generation and
petrochemical industries they can be
used, for example, as servo position
feedback on actuated equipment such
as valves and dampers, or for
measuring turbine casing expansion.
2
Prog.
SP1
SP2
SP3
SP4
SP5
SP6
CH2 View Mode
Submersible units can be used in
marine
and
offshore
mining
applications. Sensors that meet military
environmental standards have been
applied to defence and aerospace
applications.
ALIGNMENT TOOL
Measured using two LVDT sensors at 90°
LVDT 1 to CH1 = Shown on Display
LVDT 2 to CH2 = Use View Mode to view CH2
Following are applications that show
the power and versatility of Macro
Sensors’ DMC-A2 Series dual input
differential measurement controllers.
LVDT 1
LVDT 1
1
LVDT 2
Prog.
SP1
SP2
SP3
SP4
SP5
LVDT 2
Prog.
SP6
Operational Display
1
2
SP1
SP2
SP3
SP4
SP5
SP6
Operational Display
showing result of
LVDT 1 – LVDT 2
showing result of
LVDT 1 + LVDT 2
2
SLOPE INDEXING
Measured using two opposed LVDT sensors (1 + 2)
LVDT 1 minus LVDT 2 = Displayed Result
LVDT 1 plus LVDT 2 = Displayed Result
For further information on Macro
Sensor’s DMC-A2 Series dual
input differential measurement
controllers
contact
Macro
Sensors and request:
12
THICKNESS MONITORING
Measured using two parallel LVDT sensors (1 – 2)
www.macrosensors.com
Brochure:
DMC-A2 Series
User Manual:
DMC-A2 Series
Or go to www.macrosensors.com and download a pdf of
either document from our free downloadable literature.
Macro Sensors
Tel. (856) 662-8000
31 May, 2006 DMI-A1 Series (ALD-00030)
Serial Communications
Table 1
The ASCII mode is a simple, isolated ASCII communication
protocol using the standard ASCII character set. This mode
provides external communication between the meter and a PC
allowing remote programming to be carried out.
DMC-A2 Series meters use a serial communication channel to
transfer data from the meter to another device. With serial
communications, data is sent one bit at a time over a single
communications line. The voltage is switched between a high
and a low level at a predetermined transmission speed (baud
rate) using ASCII encoding. Each ASCII character is transmitted
individually as a byte of information (eight bits) with a variable
idle period between characters. The idle period is the time
between the receiving device receiving the stop bit of the last
byte sent and the start bit of the next byte. The receiving device
(for example a PC) reads the voltage levels at the same interval
and then translates the switched levels back to an ASCII
character. The voltage levels depend on the interface standard
being used.
A start bit.
An optional error detection parity bit.
And one or more ending stop bits.
Start Bit and Data Bits
Data transmission always begins with the start bit. The start bit
signals the receiving device to prepare to receive data. One bit
period later, the least significant bit of the ASCII encoded
character is transmitted, followed by the remaining data bits.
The receiving device then reads each bit position as they are
transmitted and, since the sending and receiving devices
operate at the same transmission speed (baud rate), the data
is read without timing errors.
Sending Device (Meter)
For communication to take place, the data format and baud rate
(transmission speed) must match that of the other equipment in
the communication circuit. Figure 6 shows the character frame
formats used by the meter.
Character Frame Formats
TXD, RXD: -3 to -15 V
0
S pace (active)
TXD, RXD: +3 to +15 V
Common ASCII Registers (32-bit Registers)
1
Each ASCII character is 'framed' with:
•
Mark (idle)
ASCII Reg. #
See Table 2 for a list of the most commonly accessed ASCII
mode registers.
RS-232
1
Table 2
Table 1 lists the voltage level conventions used for RS-232. The
voltage levels listed are at the receiver.
•
Interface State
Logic
ASCII Mode
•
Interface Voltage Level Conventions
Function
Modbus Reg. #
Alarm Status
40000
2
Display Register
40513
3
Processed Data Result
40515
4
Processed Data – Channel 1
40517
5
Processed Data – Channel 2
40519
39
Processed Data – Channel 3
40521
40
Processed Data – Channel 4
40523
6
Setpoint 1
40535
7
Setpoint 2
40537
8
Setpoint 3
40539
9
Setpoint 4
40541
10
Setpoint 5
40543
11
Setpoint 6
40545
12
Peak
40525
13
Valley
40527
14
Tare
40533
15
Reserved for Texmate Use
16
Total 1
40529
17
Total 2
40531
Start
Bit
Idle
Data Bits
–
Stop
Bit
0 b0 b1 b2 b3 b4 b5 b6 b7 1
Idle
8 data, no parity, 1 stop
Idle
0 b0 b1 b2 b3 b4 b5 b6 b7 P 1
Idle
8 data, parity, 1 stop Parity Stop
Bit Bit
Note: b0 to b7 is ASCII data.
Receiving Device (PC)
Communication Formats
Parity Bit
To prevent errors in communication, the sum of data bits in
each character (byte) must be the same: either an odd amount
or an even amount. The parity bit is used to maintain this
similarity for all characters throughout the transmission.
It is necessary for the parity protocol of the sending and
receiving devices to be set before transmission. There are three
options for the parity bit, it can be set to either:
•
None – which means there is no parity.
•
Odd – which means the sum of bits in each byte is odd.
•
Even – which means the sum of bits in each byte is even.
After the start and data bits of the byte have been sent, the
parity bit is sent. The transmitter sets the parity bit to 1 or 0
31 May, 2006 DMI-A1 Series (ALD-00030)
Macro Sensors
Figure 6 – Character Frame Formats
making the sum of the bits of the first character odd or even,
depending on the parity protocol set for the sending and
receiving devices.
As each subsequent character in the transmission is sent, the
transmitter sets the parity bit to a 1 or a 0 so that the protocol of
each character is the same as the first character: odd or even.
The parity bit is used by the receiver to detect errors that may
occur to an odd number of bits in the transmission. However, a
single parity bit cannot detect errors that may occur to an even
number of bits. Given this limitation, the parity bit is often
Tel. (856) 662-8000
www.macrosensors.com
13
Serial Communications (cont.)
ignored by the receiving device. The user sets the parity bit of
incoming data and sets the parity bit to odd, even or none (mark
parity) for outgoing data.
dependent on the number of characters and baud rate of the
channel:
t3 = (10 * # of characters) / baud rate
The parity bit is set in the Calibration Mode.
Stop Bit
At the end of t3 the meter is ready to receive the next command.
The stop bit is the last character to be transmitted. The stop bit
provides a single bit period pause to allow the receiver to
prepare to re-synchronize to the start of a new transmission
(start bit of next byte). The receiver then continuously looks for
the occurrence of the start bit.
The maximum throughput of the meter is limited to the sum of
the times: t1, t2, t3.
Response From The Meter
Ready
Note: DMI-A1Series meters use only one stop bit.
t2
t1
First
Character
of Reply
Command
Terminator
Received
Command Response Time
The meter uses half-duplex operation to send and receive data.
This means that it can only send or receive data at any given
time. It cannot do both simultaneously. The meter ignores
commands while transmitting data, using RXD as a busy signal.
When the meter receives commands and data, after the first
command string has been received, timing restrictions are
imposed on subsequent commands. This allows enough time
for the meter to process the command and prepare for the next
command.
See Figure 7. At the start of the time interval t1, the sending
device (PC) prints or writes the string to the com port, thus
initiating a transmission. During t1 the command characters are
under transmission and at the end of this period the command
terminating character is received by the meter. The time
duration of time interval t1 is dependent on the number of
characters and baud rate of the channel:
t1 = (10 * # of characters) / baud rate
At the start of time interval t2, the meter starts to interpret the
command, and when complete performs the command
function.
After receiving a valid command string, the meter always
indicates to the sending device when it is ready to accept a new
command. After a read command, the meter responds with the
requested data followed by a carriage return (øDH) and a line
feed (øAH) character. After receiving a write command, the
meter executes the write command and then responds with a
carriage return/line feed.
The sending device should wait for the carriage return/line feed
characters before sending the next command to the meter.
If the meter is to reply with data, time interval t2 is controlled by
using the command terminating character: $ or *. The $
terminating character results in a response time window of 50
ms minimum and 100 ms maximum. This allows enough time to
release the sending driver on the RS-485 bus. Terminating the
command line with the * symbol, results in a response time
window (t2) of 2 ms minimum and 50 ms maximum. The faster
t3
Reply
Transmission
Time
Ready
Figure 7 – Timing Diagram
ASCII Serial Mode Read/ Write
Information
ASCII Command Character Descriptions
Table 3 describes the functions of the command string
characters. Table 4 shows examples of how the command string
is constructed.
Command String Construction
When sending commands to the meter using a Terminal
emulation program, a string containing at least one command
character must be constructed. A command string consists of
the following characters and must be constructed in the order
shown:
1)
A start character.
2)
The meter (node) address (optional).
3)
The read/write command.
4)
The register address.
5)
A separator character.
6)
The data value.
7)
The message terminator.
Figure 8 shows an example of a command string.
Start
Character
Meter
Address
Read/Write
Command
Register
Address
Separator
Character
Data
Value
Message
Terminator
Sr130*
Figure 8 – Example of a Command String
response time of this terminating character requires that
sending drivers release within 2 ms after the terminating
character is received.
At the start of time interval t3, the meter responds with the first
character of the reply. As with t1, the time duration of t3 is
14
www.macrosensors.com
Macro Sensors
Tel. (856) 662-8000
31 May, 2006 DMI-A1 Series (ALD-00030)
Serial Communications (cont.)
Table 3
C ommand
S or s
0 to 255
Command Character Descriptions
Function
Description
Start
Character
The start character must be the first character in the string.
Meter (Node)
Address
Specifier
The next character assigns an address to a specific meter. If the character following the start character is
not an ASCII number, then address 0 is assumed.
All meters respond to address 0.
R or r for
read
Read/Write
Command
The next character is the read/write command character.
The read command reads a register from the meter.
W or w for
write
The write command writes to a register of the meter.
Using any other character for the read or write character will abort the operation
ASCII
number 1 to
65535
Register
Address
The register address for the read/write operation is specified next. It can either be an ASCII number from
1 to 65535 or register 1 to 18 can be accessed by entering an ASCII letter from A to R (not case sensitive).
If the address character is omitted in a read command, the meter will always respond with the data value
currently on the display.
The register address must be specified for a write command.
Space or
","
Separator
Character
After the register address in a write command, the next character must be something other than an ASCII
number. This is used to separate the register address from the data value. It can be a space or a "," or any
other character except a "$" or a "*".
Range
between
–9999999
to 9999999
Data Value
After theeseparator character, th data value is sent. It must be an ASCII number in the range of –9999999
to 9999999 (Fixed Point Register).
$ or *
Message
Terminator
Note: The range will vary depending on which register is accessed.
The last character in the message is the message terminator. This must be either $ or *.
If the $ is used as a terminator, a minimum delay of 50 ms is inserted before a reply is sent.
If the * is used as a terminator, a minimum delay of 2 ms is inserted before a reply is sent.
The $ and * characters must not appear anywhere else in the message string.
CR/LF
Meter
Response
After the meter has completed a read or write instruction, it responds by sending a carriege return/ line feed
back to the host. If the instruction was a read command, the CR/LF follows the last character in the ASCII
string. If it was a write command, the CR/LF is the only response sent back to the host. The host must wait for
this before sending any further commands to the meter.
A read or write to a not valid or non-existant register, produces a null character followed by a CR/LF.
Table 4
Command String
ASCII Command String Examples
Command String Description
SR$
Read display value, 50 ms delay, all meters respond.
s15r$
Read display value, 50 ms delay, meter address 15 responds.
SR12*
Read peak value, 2 ms delay, all meters respond.
Sr130*
Read Code 1 setting, 2 ms delay, all meters respond.
s2w2 -10000$
Write 10 000 to the display register of meter address 2, 50 ms delay.
SWT Chan_1$
Write ASCII text string Chan_1 to text register T, 50 ms.
S10w148,7*
Change brightness to 7 on meter address 10, 2 ms delay.
31 May, 2006 DMI-A1 Series (ALD-00030)
Macro Sensors
Tel. (856) 662-8000
www.macrosensors.com
15
Serial Communications (cont.)
Multiple Write
Registers H to W – Display Customizing
The multiple write feature of the DMC-A2 meter allows multiple
registers to be written to in a single ASCII command string. It is
similar to a normal write command but with the following
differences:
Text can be customized on the following text displays to suit a
particular application:
• Register H – Text display for peak.
• Register I – Text display for valley.
• Register J – Text display for total.
• Register K – Text display for sub-total.
• Register L – Text display for setpoint 1.
• Register M – Text display for setpoint 2.
• Register N – Text display for setpoint 3.
• Register O – Text display for setpoint 4.
• Register P – Text display for setpoint 5.
• Register Q – Text display for setpoint 6.
• Register R – Text display for overrange.
• Register S – Text display for underrange.
• Register T – Text display for channel 1.
• Register U – Text display for channel 2.
• Register V – Text display for channel 3.
• Register W – Text display for channel 4.
• After the first data value, a separator character is inserted
instead of the message terminator. The next register address is
then specified, followed by another separator character and the
next data value. This procedure is repeated for each new
register. The message terminator is added after the last data
value in the string.
• Any number of registers can be written to using the multiple write
feature, as long as the total length of the command string does
not exceed 73 ASCII characters, including spaces and the
message terminator.
Figure 9 shows two examples of the multiple write command.
Note: The multiple write feature cannot be used with special
ASCII registers (H to X).
Start
Character
Meter
Address
Read/Write
Command
Register
Address
Separator
Character
Data
Value
Message
Terminator
SW6,10000,7,20000,8,30000$
Start
Character
Meter
Address
Read/Write
Command
Register
Address
Separator
Character
Data
Value
Message
Terminator
The text string displayed by the meter can be 6 ASCII characters
long.
If a text string is read in the usual manner. For example, SRT$,
where:
• S for the start character.
• R for the read character.
• T for the text display for Channel 1.
• $ for the message terminator.
The meter responds by displaying the stored string: CH_1.
To customize the text string of the text display for Channel 1,
from CH_1 to Hello, issue the following command:
S6wL -32766 M 32766*
SWT Hello$
Start
Character
Meter
Address
Read/Write
Command
Register
Address
Separator
Character
Data
Value
Message
Terminator
Figure 9 – Examples of Multiple Write Command
DMI-A1 Series meters have 5-digit displays using 7-segment
display LEDs. Table 5 shows which characters can be used with
a 7-segment display LED along with the associated ASCII
value.
7-Segment ASCII Characters
Some characters, such as Kk, Mm, Qq, Ww, Zz, can not be
displayed correctly on a 7-segment LED display. For these
characters the closest possible display has been chosen. The
letters M and W can only be represented by using two digits of
the display. This means that each time an M or W is used, the
maximum amount of characters to be displayed is reduced by
one (e.g. Power would be displayed as Powr). If both letters are
used, for example in the abbreviation MW for megawatt, the
amount of characters to be displayed is reduced by two. Upper
or lower case letters are accepted by the meter but the resulting
display is set to the standard 7-segment character map. See
Table 5.
www.macrosensors.com
Register X – Print String
The print mode allows the meter to print data from any meter
register directly to a serial printer, or to a PC where it can be
imported into a spreadsheet.
Special ASCII Registers
16
When the text display for Channel 1 is displayed on the meter,
instead of CH_1 being displayed, Hello is now displayed.
Macro Sensors
Register X is a special register that allows you to specify the text
and data stored in specific registers to be printed out when a
print command is issued by the meter while in the print mode.
Through the serial port, register X can be either written to or
read from using a terminal program on a PC.
Writing To Register X
Writing to register X tells the meter to print the data stored in one
or more of the meter's registers when the print command is
issued. To get the meter to print, the printer must be connected
to the meter through the serial port and the meter must be
programmed to [XX3] in Code 3. The data to be printed depends
on how the meter has been programmed, for example, to display
a flow rate and total.
The total length of a write string can be up to 30 ASCII
characters long
See Printing Restrictions below.
Tel. (856) 662-8000
31 May, 2006 DMI-A1 Series (ALD-00030)
Serial Communications (cont.)
Reading From Register X
~16: Tells the meter to print the current total flow (stored
data), held in register 16, after the word Flow =.
Reading from register X allows you to check your settings prior
to removing the PC from the serial port and connecting to a
printer. Register X can be read in the normal manner (i.e. SRX$).
The printer would then print, for example, the following:
Rate = 2000
Example of Writing To Register X
Total = 25000
The following example shows a write to register X with the meter
set to display flow rate and total flow of channel 1 in Code 2.
This means that the current flow rate is 2000 and the total flow
at this point is 25000.
swx Rate = ~2 (add carriage return and line feed)
Example of Reading From Register X
Total = ~16$
Having written the above example to the meter, to check the
contents of register X using the terminal program through the
PC, type the following:
The above write to register X means the following:
swx: Start writing to register X.
srx$
Rate =: Tells the meter to print the word Rate =.
The following is shown on the PC screen:
~2: Tells the meter to print the current flow rate (display
data), held in register 2, after the word Rate =.
Rate = ~2
Total = ~16$
Total =: Tells the meter to print the word Total =.
Table 5
ASCII Characters for 7-Segment Display
Character
Space
Register Control value (Decimal )
Character
Register Control value (Decimal )
32
@
64
!
33
A
65
"
34
b
66
#
35 (not supported)
C
67
$
36 (not supported)
d
68
%
37 (not supported)
E
69
&
38 (not supported)
F
70
'
39
G
71
(
40
H
72
)
41
i
73
*
42 (not supported)
J
74
+
43 (not supported)
k
75
,
44 (displayed as decimal point)
L
76
-
45
M
77 (supported, but requires two digits)
.
46
n
78
/
47
o
79
0
48
P
80
1
49
q
81 (not supported)
2
50
r
82
3
51
S
83
4
52
t
84
5
53
u
85
6
54
V
86
7
55
W
87 (supported, but requires two digits)
8
56
X
88
9
57
Y
89
:
58 (displayed as decimal point)
Z
90 (same as "2")
;
59 (displayed as decimal point)
[
91 (same as "C")
<
60
\
92
=
61
]
93
>
62
^
94
?
63
_
95
31 May, 2006 DMI-A1 Series (ALD-00030)
Macro Sensors
Tel. (856) 662-8000
www.macrosensors.com
17
Serial Communications (cont.)
Printing Restrictions
Serial Output Module Settings
When printing, any alphanumeric ASCII character can be used
within the following restrictions:
Setting the 1st digit to 2 and the 2nd digit to 0 [CAL] [20X]
accesses the serial communications output module properties:
baud rate, parity, transmit time delay, and address settings.
•
The $ and * characters are reserved for the terminating
character at the end of the string and cannot be used as part
of the text string.
•
The total string length must be no greater than 30 bytes long.
This includes spaces, tabs, carriage returns, line feeds, and
the terminating character. There must be a separator space
between the register address X and the start of the string.
This separator space does not have to be included in text
string length calculations.
•
Any number following a ~ character will be interpreted as a
register address. During a printout the register's current value
will be printed out in this position.
•
The ASCII character \ is treated as a special character in the
print string. When a \ is encountered, a * is printed in its place
(* is reserved as a terminating character and normally can
not appear anywhere in the text string). This allows the print
output of one meter to be connected to another meter that is
operating in the ASCII mode.
For example, if the print string reads:
swx sw3 ~5\ sw4 ~12\ sw6 ~2\$
Baud Rate
The baud rate range is selectable from 600 to 38400 baud. The
default baud rate is 9600.
• 600.
• 9600.
• 1200.
• 19200.
• 2400.
• 38400.
• 4800.
Parity
The default parity setting is [oFF]. Parity [odd] or [EVEn] can
also be selected.
Transmit Time Delay
The transmit time delay restricts the meter from transmitting
a reply to a slow or busy master device (PC, PLC, etc.) by
providing time delays of 2, 20, 50, or 100 milliseconds for all
serial modes except ASCII (Code 3 set to XX0).
The ASCII Mode uses message terminating characters:
The printer prints the following:
sw3 (current register value)* sw4 (current register
value)*
sw6 (current register value)*
•
* = 2 milliseconds.
•
$ = 50 milliseconds.
Address
Note: As a new line is usually represented by a carriage
return and a line feed, two bytes should be added for each
new line in text string length calculations.
Up to seven different registers can be specified in one text
string, provided that the total string length is no greater than 30
bytes long and the total length of the resulting printout is less
than 100 bytes long (including time stamp if selected).
For example, the following tab delimited output could be
specified to input display data, processed result, processed
channel 1, processed channel 2, peak, valley, and total, directly
into a spreadsheet:
swx~2(tab)~3(tab)~4(tab)~5(tab)~12(tab)~13(tab)~p$
When calculating the length of the printout, an allowance of 7
bytes for each register address should be used, plus any extra
text or separating characters such as tabs or spaces.
The default address setting is 1, but can be set to anywhere
between 1 and 255.
Serial Communications Hardware
Pinouts & Interconnections
RS-232 Interconnections
Hardware Requirements
The following hardware is required to set the meter up for
simple RS-232 communications (see Figure 10):
• DMC-A2 Series meter with RS-232 serial output module option
installed.
• RJ-11 to DB-25 interface connector (and possibly a DB-25 to
DB-9 interface connector depending on PC serial port).
• Standard 4-wire cable with male RJ-11 connectors (see Figure
11 and 12, and Tables 6 and 7 for a wiring diagram and pin
descriptions).
• PC running a terminal program.
18
www.macrosensors.com
Macro Sensors
Tel. (856) 662-8000
31 May, 2006 DMI-A1 Series (ALD-00030)
Serial Communications (cont.)
PC Running
Terminal Program
DB-9 Female to RJ-11
Interface Connector
Table 6 lists the pinouts for an RS-232 to RJ-11 socket configuration.
Table 6
4-wire Telephone
Cable with RJ-11
Connectors
Serial Communication Pinouts
(RJ-11 Socket)
TERMINAL PINS
RS-232
21 20 19 18
30
29
28
27
26
25
17
23
24
16
1
Reserved for future use
15
2
RXD. Received Serial
3
TXD. Transmitted Serial
Input Module
(See specific input module data
sheet for connection details)
1
2
3
4
5
6
8
9
10
11
14
Rear of DMC-A2 Meter
RXD
Optional +5 VDC to
power external
converters
(jumper on RS-232 or
RS-485 boards must be
soldered)
4
Reserved
TXD
Reserved
Isolated
GND
Optional
+5 VDC
Figure 10 – RS-232 Hardware Connections
5
Isolated Ground
6
Reserved for future use
RJ-11
Socket
Table 7 lists the pinouts for an RS-232 to 9-pin or 25-pin D
connector.
6 5 4 3 2 1
See Table 6
Figure 11 – RJ-11 Connections
Table 7
RS-232 to 25-Pin & 9-Pin D Connectors
Pin Name
Reserved
RXD
TXD
Reserved
Isolated
GND
Optional
+5 VDC
25-Pin
RJ-11
Connector
Socket
13 12 11 10
8
9
7
6
5
4
3
2
Reserved
RXD
TXD
Reserved
Isolated
GND
Optional
+5 VDC
25-Pin D Connector
(See Table 8 for pin descriptions)
(Viewed from the pin side of a female connector)
RJ-11
Connector
Socket
4
9
3
8
2
7
1
Frame Ground
-
2
Receive Data
3
3
Transmit Data
2
4
Request to Send
7
5
Clear to Send
8
6
Data Set Ready
6
7
Signal Ground
5
8
Data Carrier Detect
1
9
Reserved
-
10
Reserved
-
11
Unassigned
-
12
Sec. Carrier Detect
-
13
Sec. Carrier Send
-
14
Sec. Transmit Data
-
15
Transmitter Clock
-
16
Sec. Receive Data
-
17
Receiver Clock
-
18
Local Loopback
-
19
Sec. Request to Send
-
20
Data Terminal Ready
4
21
Remote Loopback/Signal Quality Detect
1
25 24 23 22 21 20 19 18 17 16 15 14
5
9-Pin
1
22
Ring Indicator
9
23
Data Rate Select
-
24
Transmitter Clock
-
25
Test Mode
-
6
9-Pin D Connector
(See Table 8 for pin descriptions)
(Viewed from the pin side of a
female connector)
Figure 12 – RJ-11 to 9-pin and 25-pin
D Connectors
31 May, 2006 DMI-A1 Series (ALD-00030)
Macro Sensors
Tel. (856) 662-8000
www.macrosensors.com
19
Serial Communications (cont.)
Meter Functions using Serial
Communications
Meter Programming via Serial Port
With a serial output module installed, the meter can be fully
configured using a PC and either:
• The Meter Configuration Utility Program.
• Or a terminal emulation program such as HyperTerminal.
Terminal Program Configuration & Use
Procedures
The following procedures describe how to set the Microsoft
HyperTerminal properties, as well as using HyperTerminal to
write to and read from the meter:
STEP A
Prog.
SP1
SP2
SP3
SP4
SP5
Set the HyperTerminal Program Properties
1)
Start the Microsoft HyperTerminal program on
the PC.
2)
On the File menu, click Properties.
SP6
The New Connection Properties dialog box
opens.
Figure 13 – Programming via Serial Port
Meter Configuration Utility Program
The meter configuration utility program is an intuitive, user
oriented Windows based interface between the PC and the
meter. In addition to all application function settings, the
configuration program also provides access to the following
additional features.
Configuration Data Copying
This function allows the current meter configuration settings to
be copied and saved for later referral or for restoration.
Macros
A growing library of macros is available to suit a wide range of
standard customer applications. Macros can be installed in the
meter, via the configuration utility program and run
automatically when the meter is powered up.
3)
In the Connect To dialog click the arrow on the
Connect using window and click a COM port
(usually COM2).
4)
Click the Configure button.
Terminal Emulation Program
A terminal emulation program, such as HyperTerminal,
provides another interface between a PC and the meter. The
terminal program allows you to read from or write to any
register in the meter using an ASCII character command string.
20
www.macrosensors.com
Macro Sensors
The COM2 Properties dialog opens.
Tel. (856) 662-8000
31 May, 2006 DMI-A1 Series (ALD-00030)
Serial Communications (cont.)
5)
In the Port Settings dialog click the arrow on the
Bits per second window and click 9600.
14) In the ASCII Sending group box, click the Echo
typed characters locally check box.
6)
Click the arrow on the Data bits window and click
8.
The other settings are not relevant to this
procedure and can be left as they are.
7)
Click the arrow on the Parity window and click
None.
15) In the ASCII receiving group box, make sure the
Append line feeds to incoming line ends check
box is not checked.
8)
Click the arrow on the Stop bits window and click
1.
16) Click OK.
9)
The ASCII Setup dialog closes.
Click the arrow on the Flow control window and
click None.
17) Click OK on the New Connection Properties
dialog.
10) Click OK.
The HyperTerminal
appears.
Properties
The New Connection Properties dialog closes.
dialog
STEP B
Check Communications Between the Meter and
the PC
1)
Type the following in the terminal program:
SR*
The current meter reading is displayed on the
PC screen.
STEP C
Configure the Print String by Writing to
Register X
1)
Set the print string by selecting the register
data to be downloaded by writing to register X.
For example, to set the print string to download
the current display value (from display register
2) and peak value (from peak register 12), type
the following:
SWX ~2 ~12* (the spaces must be included).
This means that the data from the meter will
display on the PC screen when the PRINT
trigger is activated.
11) Click the Settings tab.
12) In the Emulation list box, click Auto detect.
The other settings are not relevant to this
procedure and can be left as they are.
STEP D
Set the Meter to the PRINT Mode
1)
13) Click on the ASCII Setup button.
The ASCII Setup dialog opens.
Set Code 3 to [XX3] in the meter’s main
programming mode.
This allows the meter to send the measurement
data to the PC.
STEP E
Download the Data from the Meter to the PC
1)
Type the following in the terminal program:
P
The P requests the meter to download the
configured print string.
STEP F
Capture the Meter Measurement Data on the
PC
1)
On the Transfer menu, click Capture Text.
The Capture Text dialog opens.
31 May, 2006 DMI-A1 Series (ALD-00030)
Macro Sensors
Tel. (856) 662-8000
www.macrosensors.com
21
Serial Communications (cont.)
2)
In the File window, type the destination for the
capture text file, or click the Browse button and
select the destination.
3)
Name the file with .txt file extension, or leave it
as CAPTURE.TXT.
4)
Click the Start button.
3)
In the Open dialog, click on the arrow in the Files
of type window and select the All Files (all files)
file type.
4)
Find your captured text file and click the Open
button.
The Text Import Wizard – Step 1 of 3 dialog
opens.
This opens the file.
5)
Type the following in the terminal program:
SR727*
The data saves to a text file in the destination
you selected. It can be opened and printed, or
loaded into a word processing or spreadsheet
program for further processing.
STEP G
6)
When the download is complete, on the
Transfer menu, click the Capture Text menu,
and then click Stop.
7)
When the data logging operation is complete, exit
the HyperTerminal program.
To Open the Captured Text in Microsoft Excel
1)
Open Microsoft Excel.
2)
Select Open in the File menu.
5)
Click the Delimited radio button in the Original
data type section.
6)
Select the row you wish to start from in the
Start import at row window.
7)
Click the Next button.
The Text Import Wizard – Step 2 of 3 dialog
opens.
The Open dialog opens.
Note: When loading the text file into a spreadsheet like MS
Excel, it should be opened as a space delimited file.
22
www.macrosensors.com
Macro Sensors
Tel. (856) 662-8000
31 May, 2006 DMI-A1 Series (ALD-00030)
Serial Communications (cont.)
8)
Check the Space check box in the Delimiters
section.
9)
Check the Treat consecutive delimiters as
one check box.
10) Click the Finish button.
Excel will import your data and display it in four
columns:
Column A: Date.
Column B: Time.
Column C: Register #2 – Rate.
Column D: Register #12 – Total.
Note: If you want, you can also set the format of the data in
the columns in Text Import Wizard – Step 3 of 3.
You can now use your text file data to compile graphs, etc.
Figure 13 is an example of a graph constructed from captured text
in Microsoft Excel.
Figure 13 – Example Graph in Microsoft Excel
31 May, 2006 DMI-A1 Series (ALD-00030)
Macro Sensors
Tel. (856) 662-8000
www.macrosensors.com
23
Notes
Frequency Range:
Prog.
SP1
SP2
SP3
SP4
SP5
SP6
Decimal Point Position:
Prog.
SP1
SP2
SP3
SP4
SP5
SP6
Input Signal
ZEro:
Prog.
SP1
SP2
SP3
SP4
SP5
SP6
Prog.
SP1
SP2
SP3
SP4
SP5
SP6
Prog.
SP1
SP2
SP3
SP4
SP5
SP6
CAL_h:
Prog.
SP1
SP2
SP3
SP4
SP5
SP6
Scale Range
An_Lo:
Prog.
SP1
SP2
SP3
SP4
SP5
SP6
Prog.
SP1
SP2
SP3
SP4
SP5
SP6
SPAn:
Analog Output Signal
Calibration
CAL_L:
An_hi:
Setpoint Activation Values
Lo 1:
hi 1:
Lo 2:
hi 2:
24
www.macrosensors.com
Prog.
SP1
SP2
SP3
SP4
SP5
SP6
Prog.
SP1
SP2
SP3
SP4
SP5
SP6
Prog.
SP1
SP2
SP3
SP4
SP5
SP6
Prog.
SP1
SP2
SP3
SP4
SP5
SP6
Macro Sensors
Tel. (856) 662-8000
31 May, 2006 DMI-A1 Series (ALD-00030)
Notes
31 May, 2006 DMI-A1 Series (ALD-00030)
Macro Sensors
Tel. (856) 662-8000
www.macrosensors.com
25
WARRANTY
USER’S RESPONSIBILITY
Macro Sensors warrants that its products are free from defects in material and workmanship
under normal use and service for a period of one year from date of shipment. Macro Sensors’
obligations under this warranty are limited to replacement or repair, at its option, at its factory,
of any of the products which shall, within the applicable period after shipment, be returned to
Macro Sensors’ facility, transportation charges pre-paid, and which are, after examination,
disclosed to the satisfaction of Macro Sensors to be thus defective. The warranty shall not apply
to any equipment which shall have been repaired or altered, except by Macro Sensors, or which
shall have been subjected to misuse, negligence, or accident. In no case shall Macro Sensors’
liability exceed the original purchase price. The aforementioned provisions do not extend the
original warranty period of any product which has been either repaired or replaced by Macro
Sensors.
We are pleased to offer suggestions on the use of our various products either by way of printed
matter or through direct contact with our sales/application engineering staff. However, since we
have no control over the use of our products once they are shipped, NO WARRANTY
WHETHER OF MERCHANTABILITY, FITNESS FOR PURPOSE, OR OTHERWISE is made
beyond the repair, replacement, or refund of purchase price at the sole discretion of Macro
Sensors. Users shall determine the suitability of the product for the intended application before
using, and the users assume all risk and liability whatsoever in connection therewith, regardless
of any of our suggestions or statements as to application or construction. In no event shall
Macro Sensors’ liability, in law or otherwise, be in excess of the purchase price of the product.
Macro Sensors cannot assume responsibility for any circuitry described. No circuit patent or
software licenses are implied. Macro Sensors reserves the right to change circuitry, operating
software, specifications, and prices without notice at any time.
For product details visit www.macrosensors.com
7300 U.S. Route 130 North Bldg. 22 • Pennsauken, NJ 08110-1541
Tel: 1-856-662-8000 • Fax: 1-856-317-1005 • Email: [email protected]
Web: www.macrosensors.com
© Macro Sensors, 2006. All rights reserved.
26
www.macrosensors.com
Macro Sensors
Tel. (856) 662-8000
31 May, 2006 DMI-A1 Series (ALD-00030)