1
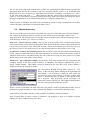
International Council for the Exploration of the Sea
Conseil International pour l’Exploration de la Mer
ICES CM 2001 / P : 23
VPABASE: A PROTOTYPE OF DATABASE FOR STORAGE
AND PROCESSING OF VPA-INPUT DATA
by
Per Sparre, Ole Folmer and Clara Ulrich
Danish Institute for Fisheries Research,
Charlottenlund Castle, DK 2920 Charlottenlund, Denmark.
email: [email protected], [email protected] and [email protected]
Abstract
The paper describes a prototype of database for storage and processing of Working Group input
for fish stock assessment. Input data are total catches by fleet and country combined with age
distribution samples (when available). The processing of data applies the available age
distribution samples to convert the national catches (landings and discards) into age
compositions and sum the national data to total stock age composition, which is the input to the
VPA. The database will maintain records on the processing of data, as well as records on
misallocated and unreported catches, explaining differences between official data and so-called
“WG-data”. The database is implemented in ACCES/EXCEL, using a user-friendly interface,
including a user’s manual. Data may be entered through userforms or transferred from other
databases through a file with a specified exchange format. The database was developed as a
part of the EU funded project EMAS (Evaluation of MArket Sampling strategies for a number of
commercially exploited stocks in the North Sea and development of procedures for consistent
data storage and retrieval, CFP Study Project 98/075).
List of contents
1.
2.
2.1.
2.2.
3.
3.1.
3.2.
3.3.
3.4.
4.
4.1.
4.2.
4.3.
5.
5.1.
5.2.
5.3.
5.4.
5.5.
5.6.
5.7.
6.
7.
8.
9.
10.
11.
Introduction .......................................................................................................................................1
Inputs to stock assessment .................................................................................................................2
Catch at age....................................................................................................................................3
Weight at age .................................................................................................................................3
Estimation of catch and weight at age ...............................................................................................4
Biological sampling .......................................................................................................................4
Sampled vs. unsampled strata ........................................................................................................4
Estimating catch at age in unsampled strata ..................................................................................5
SOP-correction...............................................................................................................................6
National data and ICES Working group data ....................................................................................6
Official statistics and working group data .....................................................................................6
Discards and landings ....................................................................................................................7
Misreported and unallocated catch.................................................................................................7
(Prototype-) software.........................................................................................................................8
Tables and relations .......................................................................................................................9
User-interface.................................................................................................................................9
Manual data entry.........................................................................................................................10
Automatic data Input....................................................................................................................11
Processing of data ........................................................................................................................11
Reports in Access format .............................................................................................................12
Reports in Excel format ...............................................................................................................12
Data-storage and data-exchange ......................................................................................................13
Discussion and conclusions .............................................................................................................14
References .......................................................................................................................................15
LIST OF Symbols............................................................................................................................15
Tables...............................................................................................................................................16
Figures .............................................................................................................................................21
List of Figures.
Figure 1. Illustration of the gap-filling-process..........................................................................................21
Figure 2. The basic hierarchy of tables in VPABase..................................................................................21
Figure 3. Data Tables and relations of the ACCESS implementation of VPABase..................................22
Figure 4. Data-tables, Look-Up-tables and relations of the ACCESS implementation of VPABase , .....23
Figure 5. Main menu of VPABase. ............................................................................................................24
Figure 6. Data entry form of VPABase. .....................................................................................................25
Figure 7. Menu for data processing. ...........................................................................................................26
Figure 8. Data entry form for the selection of age compositions to be used to fill-in unsampled catches .26
Figure 9. EXCEL worksheet used by the ICES Herring WG and the Mackerel, Horse mackerel, Sardine
and Anchovy WG. ..............................................................................................................................27
Figure 10. Example of report in EXCEL format. .......................................................................................27
ii
1. Introduction
Biological advice on many commercially exploited stocks in the ICES area relies to a large extent on
commercial catch-at-age. The quality of the biological advice is dependent on the quality of the
underlying data. However, for most stocks there is hardly any insight into measures of uncertainty
associated with the catch-at-age data. Furthermore, for the stocks exploited by various countries, the
sampling and raising procedures to estimate national age-composition of catches might differ from one
country to another. The methods used for combining national catch statistics into international catch at
age are not uniform. The historical disaggregated national catch data are not always accessible, and thus
the consistency of data series is not warranted. Thus the whole procedure of estimating international
catch at age would gain in efficiency and transparency if a uniform method of aggregation was developed
and applied, and if all data used in the estimation were gathered and centralised in one single database.
The objective of this paper is to present a prototype of such a database for the storage and the processing
of ICES Working Group input for fish stock assessment. Input data are total catches by fleet (and
country), area and time period combined with age distribution samples (when available). It was
developed as a part of the EU funded project EMAS (Evaluation of MArket Sampling strategies for a
number of commercially exploited stocks in the North Sea and development of procedures for consistent
data storage and retrieval, CFP Study Project 98/075; Pastoors et al., 2001). This project intended to
evaluate the adequacy of the international market sampling effort for a limited number of commercially
exploited fish stocks in the ICES area, to quantify the uncertainties in estimated catch in numbers and
mean weight at age, to advise on appropriate sampling levels and methods and to define protocols and
develop prototype software to store and aggregate national sampling data.
The data processing uses the available age distribution samples to convert the national catches (landings
and discards) into age compositions, and sums the national data to total stock age composition, which are
the main input to the VPA (Virtual Population Analysis). The processing of data implies filling in gaps in
data, caused by some countries not supplying full sets of input data. The gaps are filled in by
extrapolating samples data to non-sampled catches data (Figure 1).
The database is a relational database implemented in ACCESS, chosen for its simplicity of use and
because it is a standard software commonly used in fisheries institutes. Although ACCESS might not be
designed for storing and manipulating large-scale databases, it was considered a suitable tool for the
present application. It allows having a user-friendly interface. Data may be entered through user-forms or
transferred from other databases through a file with a specified exchange format. Reports from the
database are made in EXCEL sheets. A user’s manual is available.
A number of software tools were already developed for data storage and combination of national catch
information to the international level:
(a) In the ICES Herring Assessment Working Group for the Area South of 62° N (HAWG) national
data are submitted on agreed spreadsheet forms. The software called SALLOC is used to raise
national data to the international level (Patterson 1998). This Fortran program provides a log
listing the actual fill-ins used to cover all landings with missing biological information, but this
list is not given in the WG report. Also, no list is available in the WG report giving the
extrapolations made of each national data set before submitting the data to ICES. The Working
Group provides a well-documented overview of the sampling coverage from each country in the
report.
(b) The Working Group on the Assessment of Demersal Stocks in the North Sea and Skagerrak
(WGNSSK) keeps a database system to store and aggregate data on the flatfish species in the
North Sea. The database system (FISHBASE) consists of a user interface programmed in Pascal
and a specific datafile format. Data are stored in separate datafiles by country, gear, area, sex (if
available) and year. Different levels of aggregations may be used in the datafiles ranging from
files, which have catch-numbers, weights at age and lengths at age by quarter, sex, gear, area and
1
country to files, which only have total landings, by country and year. Raising is performed from
the lowest level aggregation upwards. The strong points of Fishbase are that it forces the user to
correctly specify the input data and that data can be exchanged in separate datafiles, so that
national institutes can submit their data in those files. Also it allows a historical access to the
underlying data and other arrangements may be implemented to raise the data. Negative points
are that no manual is available, that the program does not allow combination of areas, that the
input format is very difficult to generate with any other software than Fishbase itself and that
there is no specification of reallocation rules.
(c) A series of basic programs are used to collect national age compositions and weights at age for
roundfish stocks in the North Sea and west of Scotland. The programs were developed in the
1980s in the Marine Laboratory (Aberdeen) and are operated from the dos-prompt by invoking
QBASIC. All data is stored in a common format. An exchange format is used for exchange of
data. Strong points of the Aberdeen programs are that a rigid file structure is defined and that the
raising procedure is carried through to generating the input files for stock assessment. Negative
points are that there is a whole suite of programs, which should be used, in a specific order and
that there are no explicit reallocation rules.
In the software presented here, the raising of catch-at-age distributions to non-sampled data is done
automatically, with the same algorithm as in Patterson (1998). But improvements of the current work are
threefold: Firstly, this algorithm is combined directly with the database, simplifying the manipulation and
processing of data. Secondly, it is aimed to be a more generic and flexible tool that could be used for a
number of different fisheries. Thirdly, it includes a higher level of data-disaggregation to the fleet level.
This disaggregation is useful for improving the estimation of total catches at age, by taking into account
the differences of exploitation pattern arising from differences in fishing practices.
The database is thus intended to output the inputs to the VPA. We consider here only the usual singlespecies VPA used in most ICES Working Groups. Multi-species VPA, although used for the assessment
of some specific stocks, is not considered at this stage of the database elaboration. We do not consider the
VPA tuning process, which involves further specifications of time series of effort and catches for some
commercial and surveys tuning fleets. However, it is worth noting that as the database is implemented at
the fleet level so that future improvements could easily be provided to store tuning data as well in the
database.
In this paper we firstly summarise briefly the main inputs to be used in the VPA, and how they can be
calculated from sampling data. We then summarise how and why these inputs are modified during
working groups before being used in assessment. This aims to present the full set of parameters that
should be included in the database. The database itself is presented afterwards.
2. INPUTS TO STOCK ASSESSMENT
The VPA compute stock numbers and fishing mortality coefficients by age and year, from data of total
catches in number and estimates of natural mortality coefficients, by age and year (although natural
mortality is most often considered as constant over years). Biomass is thus calculated by multiplying
stocks numbers by weight at age.
To facilitate the notation, we introduce the “Stratum”. By a stratum is meant a combination of a stock St,
a country Ct, a fleet Fl, an area Ar and a quarter q in a year y. We use the symbol “W” for a stratum:
W = (St, y, Ct, Fl, Ar, q).
The symbol “S”, represent a set of strata: S = {W1 , W 2 ,...., W m } , where m is the number of elements in
the set S. Appendix 1 contains a complete list of symbols used in the formal description.
2
2.1.Catch at age
The input to single species VPA without tuning, are the numbers caught (landed and discarded) of stock
St by age group a and during quarter q in year y, from the total area of distribution of the stock, caught by
all fleets exploiting the stock.
CVPA(St, y, q, a)
We use here the quarter as the time step by default, as it is commonly used in the ICES area (although
assessments are afterwards conducted on an annual basis). Any other division of the year, for which data
are available, could be used. The age index is comprised in the range [aMin(St), aMax(St)], where aMin(St)
(>0) is the youngest age group considered in the VPA and aMax(St) is the oldest age group considered in
the VPA. The oldest age group may or may not be a plus-group.
The catch is taken by a number of fleets in a number of sub-areas of the total stock area, so that
C VPA (St , y, q, a ) =
Ct Max Fl Max ( Ct ) ArMax
å å å
Ct =1
Fl=1
Catch (St , y, q, a , Ct , Fl, Ar) =
Ar =1
Ct Max Fl Max ( Ct ) ArMax
å å å Catch(W , a )
Ct =1
Fl =1
(1)
Ar =1
where Catch(W,a) = Catch (Landings + discards) in numbers of age group a in a stratum W.
Fl = 1,2,…,FlMax(Ct), Ar = 1,2,…,ArMax ,where FlMax(Ct) = Number of fleets in country Ct and ArMax =
Number of areas.
The area can be ICES sub-division, ICES division or ICES area. In a later version of the database, the
area concept could be generalized to include ICES rectangles, and/or specific areas defined by working
groups. Fleets are given homogeneous subsets of boats, whose definition is made externally by the
Working Group (e.g. by fishing gear and/or boat length class…)
In general the dot “·” is used to indicate summation over one index, e.g. when data are not disaggregated
by quarter but are available only on an annual basis :
4
Catch (St , y,·, a , Ct , Fl, Ar) =
å Catch(St , y, q, a, Ct, Fl, Ar)
q =1
2.2.Weight at age
Estimated stock numbers are converted into stock and spawning stock biomasses by using weight and
maturity coefficients by age and year. Predictions of yield are made from mean fishing and natural
mortality at age and mean weight at age. The weight at age is thus a major parameter of the assessment
procedure. It relates to a specific time, e.g. the beginning, middle, or mean over the time period. In
subsequent equations the weight at age is noted :
WC(St, y, q, a, Ct, Fl, Ar) = WC(W, a) = Mean body weight in Catch of age group a in a stratum.
Number of fish caught is calculated as :
Catch (W , a ) =
Yield(W , a )
Wc(W , a )
(2)
Where Yield(W, a) is the catch in weight of stock St and age a, in a stratum. The total yield Yield(W)
must be available for all strata, to make the following estimation feasible..
3
3. ESTIMATION OF CATCH AND WEIGHT AT AGE
3.1.Biological sampling
Catch and weight at age are estimated from biological sampling data, which provide detailed information
on length and/or age composition of the landings in a stratum. Data include the number of otoliths read
and the number of fish measured by age. The associated coefficients of variation may be available.
Sampling data by age and stratum in the database are thus :
na(W, a) = Number of age measurements (otoliths);
nl(W, a) = number of length measurements;
CVC (W, a) = Coefficient of variation of the estimate of Catch(W, a);
CVwC (W, a) = Coefficient of variation of the estimate of wC(W, a)
3.2.Sampled vs. unsampled strata
A sampled stratum is a stratum in which biological sampling was conducted. The catch numbers at age
and the weights at age could be directly estimated. The total yield is also available. An un-sampled
stratum is a stratum where only the total yield is known, and no sampling data are available. The
estimation of age composition and weight-at-age for un-sampled strata has thus to be done using
information from the sampled strata.
The set of all strata may be split into two, the sampled strata (Ssampled) and the un-sampled strata, (SUn). The number of sampled and unsampled strata are noted mS and mU respectively. A sampled and
unsampled stratum is noted WS and WU respectively. Thus, the set of all strata, can be partitioned as (“∪”
indicates the union of two sets):
sampled
S Sampled = ìíW1S , W S2 ,...., W mS üý
S þ
î
SAll = Ssampled ∪ SUn-sampled
S Un- Sampled = ìíW1U , WU2 ,...., WUm üý
U þ
î
In a sampled stratum W S , the total number caught of all age groups is:
Catch(W S ,·) =
a Max ( st )
å Catch(W
S
, a)
(3)
a = a Min ( st )
The proportion of each age group in the total catch number in the stratum is:
PrCatch (W S , a ) = Catch (W S , a ) / Catch (W S ,·)
(4)
The mean weight of all fish in the catch is
WCMean (W S ) =
a Max (St )
å
PrCatch (W S , a ) *W C (W S , a )
(5)
a = a Min ( st )
The computed total weight of the catch (SOP, Sum Of Products) is:
S
SOPCatch (W ) =
a Max (St )
å Catch(W
S
, a ) * WC (W S , a ) = WCMean (W S ) * Catch (W S ,·)
a = a Min ( st )
4
(6)
3.3.Estimating catch at age in unsampled strata
The age composition within an unsampled stratum can be estimated using the age distribution of other
strata, which can be assumed to have a comparable pattern.
Let W iU be an un-sampled stratum, and let W jS be a sampled stratum. If we assume that weight-at-age
and relative catch-at-age are the same for W iU and W jS , then we can estimate the total number caught in
the unsampled stratum as:
Catch (W iU ,·) = Yield(W iU ) / WCMean (W jS )
(7)
and
Catch (W iU , a ) = Catch(W iU ,·) * Prcatch (W jS , a )
(8)
It may also be preferable sometimes to use a subset of various sampled strata to estimate catch
distribution in an unsampled stratum, instead of only one as described in the previous equations. The
estimated distribution is thus a weighted mean of the age distributions in sampled strata. The weighting
coefficients might be uniform (equal weight for all strata), or linked to the importance of each stratum
(total yield, number of fish measured/aged, inverse of variance…etc…).
(
)
The subset of sampled strata used for the estimation is denoted Sk S k Ì SSampled and has k elements,
Sk =
{
W 1S , W 2S ,..., W kS
we define:
}.
{
}
SWMt (S k , a ) = v Mt (W 1S , a ), v Mt (W 2S , a ),..., v Mt (W kS , a )
where SW is a set of weights (vMt(W,a)) associated with the set of sampled strata and age group a,
selected by a weighting method Mt.
The weighted mean proportion at age in the unsampled strata is then:
å Pr
Catch (W
Mean
PrCatch
(W iU , a , Sk , Mt ) =
S
, a ) * v Mt (W S , a )
S
W ÎS k
a Max (St )
å
a = a Min (St )
(9)
å Pr
Catch (W
S
S
, a ) * v Mt (W , a )
W S ÎS k
The calculation of a weighted mean proportion at age is only possible when the weighting factors are
available for all strata in Sk. The methods Mt = equal weight (all v = 1.0) or Mt = yield are applicable for
any set of strata. The method Mt = number of otoliths requires having an associated number of otolith
measurements for all strata.
Note that the procedure to calculate weighted mean proportions at age may also be applied to sampled
strata. The otolith samples taken from a catch stratum are usually used to estimate the age composition of
that stratum. However, if the sample is very small or for some other reason suspicious, it may be better to
use alternative otolith samples, or to combine the suspicious sample with samples of other strata.
The weighted mean body weight in the catch is then :
5
å W (W
C
WCMean (W iU , a , Sk , Mt ) =
S
, a ) * v Mt (W S , a )
S
W ÎS k
åv
Mt (W
S
(10)
, a)
W S ÎS k
Then we can calculate the total number of individuals caught (using Eq. 7) and then the number of
individuals per age group (using Eq. 8).
A list of possible weighting options for the calculations of proportions at age and mean weights in the
catch is presented in Table 1. The list of options for weighting factors may be extended in future versions
of VPABase. Obvious extensions of the list includes characteristics of ALKs (Age length keys), such as
number of length measurements and number of ALKs.
3.4.SOP-correction
The SOP is the sum of the products of catch numbers at age times the weights at age:
a Max ( St )
SOP Catch ( W ) =
å Catch (W , a ) * w
C (W
,a)
(11)
a = a Min ( St )
Ideally, the SOP should be equal to the Yield(W) which was given as input. If that is not the case, the
equality can be achieved by applying a “SOP-correction”, either to the catch or to the weight
Yield(W ) =
a Max (St )
å Catch(W , a ) * Correction(W ) * W (W , a )
C
a = a Min (St )
where
Yield(W )
Correction(W ) =
SOPCatch (W )
(12)
The SOP correction was discussed by Lewy & Lassen (1997), who concluded that the SOP is an
unbiased estimate of the total catch, and that SOP corrections should not be made. We consider four
options in the case of SOP discrepancies:
1)
2)
3)
4)
Correct the catch-at-age,
Correct the weight-at-age,
Correct the input Yield (replace the value of input Yield by the value of SOP),
Do nothing.
According to Lewy and Lassen, option 3 is recommended. In the following, it is assumed that any SOPproblem has been resolved before the data are entered into the database. If however, there is a
discrepancy, the value Yield will be automatically changed to the SOP (Option 3).
4. NATIONAL DATA AND ICES WORKING GROUP DATA
The annual yield by country (summed over fleets) and ICES area are reported by member governments to
ICES as the Official statistics. These statistics are however sometimes modified by members of
assessment working groups. This section discusses the discrepancies between official statistics and the
so-called “working group data”, as all the data included in the “working group data” have to be included
in the database.
4.1. Official statistics and working group data
Let LandingsWOfficial(St, Ct, Ar) be the official statistics, i.e. the weight of the annual landings of stock St
by country Ct in ICES area (sub-area or division) Ar. Members of ICES working groups deliver the so-
6
called working group data, which may be more disaggregated than the official data and which may also
be different. The question is whether the official data are consistent with the working group data, that is
LandingsWOfficial (St , Ct , Ar)
=?=
Fl Max (St )
å
Fl =1
4
å
å
(13)
Yield(St , Fl, Ar, q )
Ar Î ICES- Div. q =1
Reasons for discrepancies might include the non-integration of discards data, as well as corrections made
on misreported data.
The following fields are used by the Working Groups (ICES, 2000), and are integrated in the VPABase :
Official Catch
Unallocated
Catch
Area
misreported
Catch
Discarded Catch
WG Catch
Catches as reported by the official statistics to ICES
Adjustments to the official catches made for any special knowledge
about the fishery, such as under- or over-reporting for which there is firm
external evidence. (can be negative)
Used only to adjust official catches which have been reported from the
wrong area. (can be negative). For any country the sum of all the area
misreported catches should be zero
Catch which is discarded
The sum of the 4 categories above
4.2. Discards and landings
Estimated catches (in numbers) and yield (in weight) is composed of landings and discards:
Catch(W, a) = LandingsN(W, a) + DiscardN(W, a),
Yield(W) = LandingsW(W) + DiscardW(W)
The weight at age of discards and landings are usually different, the discard weight-age-age being smaller
than the landings weight-at-age:
WD (W, a) = average body weight of discards.
WL (W, a) = average body weight of landings.
The body weights relate to the body weight-at-age in the catch by:
WC (W , a ) =
WL (W , a ) * LandingsN(W , a ) + w D (W , a ) * DiscardsN(W , a )
LandingsN(W , a ) + DiscardsN(W , a )
(14)
whereby:
LandingsW (W) =
a Max ( St )
åw
L
(W, a ) * LandingsN (W, a )
D
(W, a ) * DiscardsN (W, a )
a = a Min ( st )
and:
DiscardsW (W) =
a Max ( St )
åw
a = a Min ( st )
4.3. Misreported and unallocated catch
When including the terms for unallocated and misreported landings as defined in the text table above, the
following equations should always hold.
7
LandingsWOfficial ( St , Ct , Ar ) +
CatchWWG ( St , Ct , Ar ) =
UnallocatedW ( St , Ct , Ar ) +
(15)
MisreportedW ( St , Ct , Ar ) +
DiscardW ( St , Ct , Ar )
where
å
Misreported ( St , Ct , Ar ) = 0
ArÎICES - Div.
and
CatchWWG ( St , Ct , Ar ) =
å
å
4
å Yield ( St , Fl , Ar , q)
(16)
FlÎFleets ( Ct ) ArÎICES - Div. q =1
This equation must be met by all input data of each country. If it is not met, the Yield(St, Fl, Ar, q) will
be corrected by the database system, using the country and area specific correction factor:
LandingsWWorking Group ( St , Ct , Ar )
CorrectionWG ( St , Ct , Ar ) =
å
4
å
å Yield
BeforeCorrection
(17)
( St , Fl , Ar , q)
FlÎFleets ( Ct ) ArÎICES - Div. q =1
where Yield BeforeCorrection ( St , Fl , Ar , q ) and Yield AfterCorrection ( St , Fl , Ar , q ) stand for Yield before and
after correction, respectively.
Yield AfterCorrection ( St , Fl , Ar , q ) = Yield BeforeCorrection ( St , Fl , Ar , q ) * CorrectionWG ( St , Ct , Ar ) (18)
However, basically, working group members should supply the data, so that no correction would be
necessary. The program will always compute the correction factor, and the user should check the value.
The database will keep the original value (before correction), for the purpose of documentation.
5. (PROTOTYPE-) SOFTWARE
A prototype database system was developed under the working title of “VPABase”. The prototype
version of VPABase was implemented in Microsoft ACCES and EXCEL (version 2000).
The term “Prototype” means a “Working model in the early stage of the design process”. The prototype
does run and executes some of the tasks specified in the foregoing sections. The prototype, however, is
far from the stage where it is safe to distribute to ICES WGs. It has not yet been conscientiously tested,
and so far no feedback has been received from the potential users, the ICES WGs. Thus, an unknown
number of man-months of development, testing and consultations with the clients are still pending,
before public distribution should be made.
A high degree of user-friendliness is aimed at in the design of user-interface and the output-options of
VPABase. This feature has been attempted from the early stage of the development. Primary versions of
a user’s manual and a reference manual of the VPABase has been prepared. This Section summarizes
the two manuals.
The database can read input data from Excel-formats and also produce reports in Excel format. The
example of EXCEL work sheet used in the present version of VPABase, has been adopted from the
spreadsheets used by the Herring WG, and the Mackerel, Horse Mackerel, Sardine and Anchovy WG
(ICES, 2000).
Input and output can also be handled out with plain ASCII text files (comma separated).
8
The VPAbase is constructed as a relational database according to the standard database-design rules
(normalization rules).
5.1.Tables and relations
The tables and the relations of VPABase consist of: “Input-data-tables”, “Look-up tables” and “Auxiliary
tables”. The look-up tables are used to select standard input values, whenever possible, as that will
reduce the risk of mistakes on data entry.
The principal data-tables of VPABase, contains the numbers at age and weight at-age distributions and
the yields (weight of catches). The three principal data-tables of VPABase are:
1.
2.
3.
Country record
Fleet record
Age composition record
In addition there is the auxiliary data tables, containing information on the data-processing:
4.
5.
All combinations of catch and samples for estimation of age composition.
Selected samples for estimation of age composition.
The tables are linked in a hierarchy of “one-to-many” relationships. Table 2 shows the fields in the input
data-tables and the auxiliary tables. The first fields in the tables, e.g. “Key_Country_Catch” in the table
“T_Country_Catch”) are the keys linking the tables in the hierarchy.
Table 2 indicates the relationships between the tables, which is also illustrated by Figyre 3, which by
arrows indicates the relations of the three principal data-tables, and the auxiliary tables.
Figure 4 shows the complete set of look-up tables together with the three principal input data tables.
A complete description of all fields, keys and relations of VPABase is rather voluminous. The reader
interested in further details is referred to the reference manual of VPABase.
The auxiliary tables “T_Use_of_Samples” and “T_Use_Of_samples_Saved” contain the input, which
specifies the processing of data. It contains information on which sampled records were used to estimate
age-compositions of the un-sampled records. They also contains information on the methodology of data
processing as well as the time of (last) processing. This part of the database is perhaps the most
complicated part of it, as the number of choices for combination of sample and processing method is
usually large. A major objective of VPABase is to store the information on data-processing in an
unambiguous way.
5.2. User-interface
The purpose of the user interface is to guide the user through three steps:
1.
2.
3.
Input data;
Make decisions on estimation of age-compositions for un-sampled strata by selecting
age-compositions among samples strata;
Generate output tables.
The user interface implemented through user-forms that are of two types:
1.
2.
Menus (selection of options)
Data entry form;
9
The five first items of the main menu (Figure 5) guides the user through the different steps to produce the
aggregated input data for VPA. Options 1 and 2 are alternative options, namely (1) to “Enter data from
the keyboard” (se next section) or (2) “Enter data from an EXCEL worksheet” (see Section 5.4). Item 1
in the main menu ends with “……” which indicates that this option leads to another user-form (see
Figure 6). Item 3 activates the user-form for data processing. Items 5 and 6 deal with the reports, that is
the output. Output can be in ACCESS-format (Item 4) or in EXCEL-format (Item 5).
In later versions of VPABase, the main menu will contain an option for entry of tuning data (survey data,
commercial fishery effort data or commercial fishery CPUE.
5.3. Manual data entry
The first item in the main menu opens a data input form (Figure 6) where data can be filled in manually.
One country record might contain several fleet records and one fleet record might contain several
sampling records. The form in Figure 6 is actually composed of three forms, which correspond to levels
of the hierarchy of tables (see Figure 6 or Table 2)
First level – Annual catch by country: The top part of the data-entry-form is related to the country
catch record and the record selector in the bottom of the form tells the user which country catch record is
current. The record selector is the field called “Record:” and the arrow buttons gives the user a way to go
the first record, move one step back, move one step forward, to the last record and to a new record.
Second level - Catch by fleet and time period: The second part of the data-entry-form contains the fleet
record, with fleet related information. The fleet information in question relates to the country record, in
which the fleet record is embedded. Ideally, the sum of the fleet records over time periods of a country
should sum up to the value of the country record.
Third level – Age composition sample: The third part of the form contains the age composition data
(samples), relating to the fleet record in which it is embedded. The sample is automatically given a
unique “sample number”. This number cannot be changed by the user and is only used to identify a
sample for the later processing of samples.
The data entered through look-up tables, appear as “listboxes” in the user-form. When clicking on the right hand side
arrow-button, a list of options is displayed, from which you
can select the input. (The example given here is taken from
Figure 6, showing the entry of “Stock”). Only input from the
list is accepted. Only users with special “privileges” can
change the content of the list box. This approach should reduce
the risk of mistyping and ambiguities in data.
In later versions of VPABase, the data entry form will contain a number of additional facilities, such as
production of graphs and tables as well as facilities for “finding” records and for deleting records.
Later versions of VPABase will also be able to handle catch data by statistical rectangle.
Entry of tuning data in future versions of VPABase, will probably be done in a separate userform,
allowing for entry of catch and effort or CPUE.
10
5.4. Automatic data Input
The second item on the main menu lets the user import data from a predefined EXCEL format or a text
file (see example of EXCEL input in Figure 9). The present version of VPABase can read the EXCEL
sheets currently used by the Herring WG and the Mackerel, Horse mackerel, Sardine and Anchovy WG
(ICES, 2000).
In later version of VPABase, input data may also be transferred in ACCESS table formats from one
replicate of VPABase to the master version of VPABase, which operation should be managed by an
international data-coordinator.
5.5. Processing of data
The third item in the main-menu, “Select samples from un-sampled catch, and process data ….” opens a
submenu (Figure 7) for data processing.
If a fleet-record has an age composition sample attached to it (is a “sampled catch”), the user does not
need to take further action as far as processing is concerned. In that case the VPABase will make the
estimation of the age composition of the total catch from that sample. The user need only take action in
the two cases:
1) When no age composition samples is available,
2) When the user wants to use additional age composition samples, for a sampled catch.
The action to take is to select one or more samples to represent the unsampled catch. If more than one
sample is selected, the user will also have to specify which method should be used to pool the selected
samples (how the weighted average should be calculated).
Before any actual selection of samples can be made, the user has to create a table to hold the tables of
potential selections (the data-table “T_Use_Of_Samples, See Figure 3).
After having created the table of potetial samples the user can move to the next item on the processingmenu and start making selection for un-sampled strata (Item 2: “Select samples for unsampled catch”).
The userform for selction of samples is shown in Figure 8.
The upper left part of this form contains a number of fields (headed “Catch record”) showing the
particulars of the catch record to be processed. These fields are shown only for information. The fields
are “locked”, so that the data cannot be entered or modified through this form.
There is a field in the centre of the form, which in the example of Figure 8 contains the information “No
age distribution for this catch”
(written in red). This means
that the catch of the current
record is un-sampled, and you
need to select samples, for
estimation of age composition. If there is a an age
composition sample, the field will be empty.
The form has a check field in the right column to indicate which sample is selected for a given catch
presented in the top portion of the form. The user can change the selection by removing or adding check
marks on the form.
11
In the hypothetical example of Figure 8 ,two samples (no. 138 and 139) originating from “United States
industrial fishery” is used to represent Danish industrial fishery.
In the upper right hand corner of the form it is possible to change weighting method, for pooling of
samples. In the example of Figure 8, the samples have been weighted by the “Sampled catch”. The
weighting methods only applies if more than one sample is selected for a given catch. The default method
is to give equal weight to each sample, but if additional information, i.e. numbers of otoliths, is present
this can be used when the samples are combined.
After the selection has been made, the user moves back to the processing menu where she/he can save the
selection to a permanent table (data table “T_Use_Of_Samples_Saved”, see Figure 3) so the selection
scheme is stored for later documentation of the process.
Default for the creation of the table is that if a catch record has a sample, this sample will be used for this
catch (but there is the option not to use the default: Option 2 above).
5.6.Reports in Access format
The ACCESS system can create reports (or “output-tables) on its own. The ACCESS-format tables,
however, are not very flexible with respect of additional processing, and change of style (see example in
Table 4). Tables in EXCEL format is believed to be more attractive for members of ICES working
groups.
Reports in Access format are inventory reports of the database. They contain information on the number
of records and other features of the input data and the national sampling programs. Prototypes of the
inventory reports are given in Table 4 (country records) and Table 5 (fleet records).
5.7.Reports in Excel format
These are the standard tables suggested for (potential) inclusion in the ICES Assessment working group
reports. Ideally, the assessment-software should be able to take its input directly from these tables. The
present proto-type version of VPABase, actually contains very few table. Most of the tables listed here
cannot be produced by VPABase as the system is now. The authors of the present paper, await the
reaction and the wishes from the possible “costumers” of VPABase, before they will start the work of
designing output tables. So what follows is what the present authors expect will become the requirements
from ICES WGs, but this still has to be tested by consultations.
The Excel reports of VPABase can be grouped as:
1) Input data, as provided by WG-members and governments.
a. Country records (before processing)
b. Fleet records (before processing)
2) Processing: Tables showing the methods and input
3) Results of processing
a. Country records (after processing)
b. Fleet records (after processing)
4) VPA input (Landings, Discards and Catch)
In principle, the database can display the data with any sorting or any grouping on the user choice. Some
tables, however, are expected to be in demand and for these there will be pre-prepared routines to
produce them.
These reports will comprise the traditional tables for official statistics of ICES working group reports, as
well as the “non-official” data. The example in Table 6 shows a table for all country-records of a given
12
ICES area. The system will be able to rearrange the tables on the users choice, for example to give a
report by country with each row representing an ICES area.
Table 7 shows a proto-type of fleet-record table. There may or may not be age/weight-composition data
available for a stratum. If age/weight-composition data are not available, then total catch (or landings)
mat be available, in which case only the last line in the table will be filled. The fleet records have unique
samples numbers (Sample No. y), which are used for of identification of the fleet-records when used for
estimation of non-sampled strata.
An important requirement for the database system is to document the age composition estimation
procedure. To document the process of using age compositions from other strata, means to record from
where the “borrowed” information originates, and which method of weighting was applied. Table 8
shows a report which for each fleet record contains a log of its processing. Each row in the table
represents a stratum. The first column gives the unique index of the stratum. The following 5 columns
gives the particulars of the sampled stratum. The columns Landing Samp. and Discard Samp. Indicates if
these catches were covered by the sampling program. The following columns contain the selection of
“borrowed” samples used for estimation of landings- and discards age compositions. The first line
contains the methods of weighting the data, if average values of several strata were used.
For the processed fleet records, the output will be a table similar to the output table for the sampled strata
(Table 7). The table will contain information on the processing, extracted from Table 9 The results for
the country, is either the sum over fleets or the estimation based on “borrowed” catch-distributions (Table
10).
The input to the stock assessment process, is the summation over country-records (Table 11). The only
EXCEL report produced by the proto-type version of VPABase is the VPA-input as shown in Figure 10.
6. DATA-STORAGE AND DATA-EXCHANGE
Data are stored in tables and relations in the relational database, as described above. It is tradition in
ICES to store data in so-called flat-files, that is a data-storage where each data record can be read
independently, and where no relations between data are specified.
Data stored as flat-files usually takes up much more space than data stored as tables with relations.
Should a flat-file be required, for example for analysis by the SAS, the database can easily produce such
a flat-file.
Data can be submitted from countries to the central database in three ways.
1.
2.
3.
Entry of data in replicate database
Entry of data in EXCEL format (Using a fixed standard set-up)
Entry of data from screen through the data entry forms
The data that is presented in Excel format, will be imported by the data base and added to the data
already on the system. Alternatively, the database could have been implemented on the internet, and data
could be entered directly in the central database. This solution is rather straight forward to implement.
The supply of data in a traditional “flat-file” format (e-g- SAS files) will be accommodated in the future.
The proto-types of the Excel data-exchange formats corresponds to the tables of VPABase: Country file
(Table 12) and Fleet/age file (Table 13)
The fleet-table and the age-distribution table of VPABase have been combined into one exchange file.
The fields in this table may not all be filled in. For example, if catch-at-age and weight-at-age are given,
the landings (or discards) are given as the sum of products, and these cells do not have to be filled in. If
they are, the SOP will have priority over the landings (discards) in tonnes.
This version of VPABase is not an “online-system”, and when a record is updated, it is not immediately
updated in the international network. Each institute of participating in the ICES assessment working
13
group will get a replica of the VPABase. A replica is simply a copy of VPABase, for which the design
cannot be modified. Before the annual WG meeting, the master VPABase will be synchronised with all
the replicas. To “synchronise” two replicas of a database, means to exchange all new records and updates
of records. This task could be carried out by a data coordinator.
7. DISCUSSION AND CONCLUSIONS
A general conclusion from the whole project EMAS (Pastoors et al., 2001), was that the sampling
procedures in the different countries have very different characteristics, adapted to the local
circumstances, the availability of sampling options and the behaviour of the fishery. There is no obvious
method for standardization of sampling procedures available. The implications of this uncertainty on
stock assessment results are relatively minor when considering only the total catch at age matrix, but are
larger when using commercial CPUE to tune the assessment model.
The storage of all basic data used in the estimation of catch at age is of great importance to keep track of
the procedures used and record the consistency of sampling data. This is not yet the case in ICES, where
different working groups use different methods and software, and where catch data are exchanged only at
the national level of aggregation and with different format. The database presented here should therefore
improve the homogeneity, standardisation, centralisation, transparency and flexibility of data used in
assessment. It is generic and thus suitable for a great variety of fisheries. It allows accounting for various
levels of aggregation and various scales of basic data. It gathers both the database and the program
performing all calculations until the final VPA-input within one single software, with a great level of
specification provided by the user. It has been designed with a great user-friendliness and easiness to use.
It is not a rigid structure, as all user can have access to the programming code and, possibly, improve it
for his own use.
However, VPABase is, at this stage of implementation, only a prototype, that requires both
improvements and testing before being considered as possible standard software in ICES. The first
improvement would be the ability to output not only the matrices of catches and weight at age, but also
the tuning files. That would require extending the fleet record level to account for effort data, and also
integrating survey data.
The second improvement would be to develop VPABase into a fully-integrated software that would
perform the whole assessment procedure, instead of producing only input files to be used in existing
software. That would avoid all problems due to format specifications and changes from one software to
another, as it is currently the case in ICES working groups. The usual software used in fish stock
assessment could be rewritten in a module in VPABase (e.g. in Visual Basic), which would become a full
assessment package. Here again, the advantage of using ACCESS is the possibility for the user to see and
modify the programming code, and thus to use the database and assessment programs with high
flexibility and transparency.
The third improvement would be to add a plat-form independent module to the database, and to improve
its access and use. Although ACCESS is widely used by a number of institutions, problems arise when
using another operating system, or when updating the database (then a replica has to be sent to each
individual partner each time). The best solution would be to provide an Internet access to VPABase,
allowing using it from any kind of remote computer.
Finally, the database should be extensively tested by a number of working groups and fisheries research
institutes before being validated as a standard tool. So far, the database has been tested only at DIFRES
(Danish Institute for Fisheries Research). We believe that this tool could be of great help within ICES
working groups, and we hope that it will encounter interest enough to be tested and used.
14
8. REFERENCES
ICES, 2000 a). Report of the working group on the assessment of mackerel, horse mackerel, sardine and
anchovy. ICES C.M. 2000 / ACFM:5.
ICES 2000 b). Report of the Herring Assessment Working Group for the Area South of 60oN.
ICES CM 2000/ACFM:10.
Lewy, P., Lassen, H., 1997. Should total landings be used to correct estimated catch in numbers or mean
weight-at-age? ICES J. Mar. Sci., 54: 462-470.
Pastoors, M.A., O’Brien, C.M., Flatman, S., Darby, C.D., Maxwell, D., Simmonds, E.J., Degel, H.,
Vinther, M., Sparre, P., Vanderperren, E., 2001. Evaluation of MArket Sampling strategies for a
number of commercially exploited stocks in the North Sea and development of procedures for
consistent data storage and retrieval (EMAS). Final Report of the EU study no. 98/075. RIVO (The
Netherlands), CEFAS (UK), DFU (Denmark), SOAEFD (Scotland), CLO-DZ (Belgium).
Patterson, K. R. (1998). A Programme For Calculating Total International Catch-at-age and Weight at
Age.
9. LIST OF SYMBOLS
a
aMax(St)
aMin(St)
Ar
ArMax
Catch(W,·)
Catch(W, a)
Ct
CVC (W, a)
Age group
Oldest age group of stock St, which may be a plus group
Youngest age group of stock St (> 0)
Area index, Ar = 1,2,…,ArMax
ArMax = Number of areas.
The total number caught of all age groups in stratum W.
Catch (Landings + discards) in numbers of age a in stratum W
Country
Coefficient of variation of the estimate of Catch(W, a)
CVwC (W, a)
Coefficient of variation of the estimate of WC(W, a)
CVPA(St, y, q, a)
Input to VPA (Working group data)
DiscardN(W, a)
DiscardW(W, a)
Fl
FlMax(Ct)
LandingsN(W, a)
LandingsW(W, a)
LandingsWOfficial(St, Ct, Ar)
Numbers discarded in stratum W, age group a (Working group data)
Yield discarded in stratum W (Working group data)
Fleet index, Fl = 1,2,…,FlMax
FlMax = Number of fleets of country Ct
Numbers landed in stratum W, age group a (Working group data)
Yield landed in stratum W, age group a (Working group data)
Weight of annual landings by country Ct. Official statistics delivered from
governments to ICES.
Number of sampled strata
Method of weighting sampled strata to estimate unsampled distributions
Number of un-sampled strata
Number of age measurements (otoliths)
Number of length measurements
The proportion made of age group in the total number
mS
Mt
mU
na (W, a)
nl (W, a)
PrCatch (W, a )
Mean
PrCatch
(W1U , a, S1 , Mt )
Weighted mean, using the set of samples S, and the weighting method Mt :
q
S
Quarter (or index of any other division of the year)
All
S
SSampled
S = {W1 , W 2 ,...., W m } , set of m strata.
Set of all samples. SAll = Ssampled ∪ SUn-sampled
Set of sampled strata.
15
Sun-Sampled
Set of un-sampled strata.
Computed weight of the catch in a stratum W (Sum Of Products)
SOPCatch (W)
St
Stock (a sub-set of a species)
Set of weights associated with the set of sampled strata, selected by method Mt.
SWMt (S k )
{
}
SWMt (S k ) = v Mt (W 1S ), v Mt (W 2S ),..., v Mt (W kS )
Mean body weight in Catch of age group a in stratum W.
The mean weight of all fish in the catch in stratum
WC(W, a)
w CMean (W )
y
Yield(W)
W
Year
Yield, Catch in weight in stratum W, (Working group data)
Stratum: W = (St, Ct, Fl, Ar, y, q). combination of Stock St, Country Ct, Fleet Fl,
Area Ar, year y and quarter q.
WS
WU
vMt(W,a),
Sampled stratum .
Un-sampled stratum.
Weighting factor for weighted mean of age group a, using method Mt
10. TABLES
Table 1. List of options for weighting the calculation of mean proportions at age and mean weight in the
catch.
Comment
Mt Method
VMt(W,a)
Equal weight
1.0
No weighting
1
Catch
Numbers caught (Cannot be used if “own”
2
Catch(W, a)
sample is used)
Landings
Numbers landed
3
LandingsN(W, a)
Discards
Numbers discarded
4
DiscardsN(W, a)
Yield (Landings
5
Yield(W) (LandingsW(W,) Weight of catch (Landings or discards)
6
7
8
or discards)
or DiscardsW(W,)
Number of otoliths
Inverse CV (Age)
Inverse CV(weight)
nC (W, a)
1/CVC (W, a)
1/CVwC (W, a)
Problematic (see below)
Only for catch-at-age (e.g. from Bootstrap)
Only for weight-at-age (e.g. from Bootstrap)
Table 2. Fields in input-data-tables of VPABase.
COUNTRY CATCH RECORD (Name in ACCESS: T_Country_Catch, see Fig. 3)
Name of Field
Key_Country_Catch
Country
Species
Year
ICES Sub division
ICES Division
ICES Area
Official Landings
Unreported landings
Misallocated landings
Discards
Sampled Catch
Comment
Unique key of country record
Look-up, name of country
Look-up (A species can be separated into "Stocks")
…, 1999,2000,2001,….
Look-up, name of ICES subdivision
Look-up, Not filled in if above filled in
Look-up, Not filled in if above filled in
As reported to ICES by governments
WG members estimate of unreported landings
WG members estimate of landings
WG members estimate of discards
The weight of the catch covered by samples
(Continued…)
16
Table 3.(Continued) Fields in input-data-tables of VPABase.
FLEET CATCH RECORD (Name in ACCESS: T_Fleet_Catch, see Fig. 3)
Name of Field
Comment
Unique key of fleet record. Also Pointer to sample (if existing) which was taken from
this catch.
Pointer to country record (one-to-many)
Part of country where home ports of fleets are (optionally)
Look-up
Look-up, Not filled in if month filled in
Look-up, Sub set of fishing harvesting sector of country
Look-up, Subset of "Species"
Look-up, Discards/Landings
The date the record was entered (or modified) in the database
Weight of landings or discards (catch = landings + discards is not input)
Number of age composition samples (=0 if no samples available)
Index for weighing method. Default value = 1 for equal weight for each sample,
updated when new selection is made
Sum of number of otoliths, updated when new selection is made
Sum of numbers of length measurements, updated when new selection is made
Key_Catch
Key_Country_Catch
Region (of country)
Month
Quarter
Fleet
Stock
Use of Catch
Date or recording
Weight of Catch
Number of samples
Method of weighing
Otoliths
length_measurements
AGE COMPOSITION RECORD (SAMPLE) (Name in ACCESS: T_Age_Distribution, see Fig. 3)
Name of Field
Key_Age_Distribution
Key_Catch
Age group
Coefficient of variation
Number of otoliths
Total number in catch
Mean weight
Comment
Unique key of age sample record
Pointer to fleet record (one-to-many)
0,1,….
Variation of estimate of this age group (e.g. From bootstrapping)
Number of otoliths in age composition sample in this age group
In discards or landings (raised numbers)
Mean weight of age group during time period in question
POTENTIAL USE OF SAMPLES FOR ESTIMATION OF AGE COMPOSITION Auxiliary datatable, to contain information on the potential selection of samples to represent fleet records (catches). Contains all
combinations of fleet-record and Age-composition-Record, whether selected or not.
Name in ACCESS: T_Use_of_Samles,(see Fig. 3)
Name of Field
Key_Catch_Age
Key_Catch
Sample selected
No sample
Comment
Pointer to age composition record (sample)
Pointer to fleet record
Yes/No Yes: If a sample is selected to represent a catch, that is if the record
“Key_Catch_Age” is selected to represent the fleet record “Key_Catch”
Yes/No. No: If no sample (age composition record) has been selected for the fleet
Record “Key_Catch”
ACTUAL USE OF SAMPLES FOR ESTIMATION OF AGE COMPOSITION
Data-table, containing information on the actual selection of samples to represent fleet records (catches). Contains only
combinations of fleet-record and Age-composition-Record, which are selected for estimation of age composition.
Name in ACCESS: T_Use_of_Samles_Saved,(see Fig. 3)
Name of Field
Key_Catch_Age
Key_Catch
Sample selected
Weighting method
Time for selection
Comment
Pointer to age composition record (sample)
Pointer to fleet record
Yes/No Yes: If a sample is selected to represent a catch, that is if the record
“Key_Catch_Age” is selected to represent the fleet record “Key_Catch”
Look-up. Method used to compute weighted average of two or more samples.
The time and date the selection was made (in the database)
17
Table 4. Inventory of Country records (Example of report in ACCESS-format).
Table 5. Inventory of fleet records
LANDINGS
Total yield Number of Coeff.of
otoliths
Vari-ance
Country A
Country B
Total
discards
DISCARDS
Number of Coeff.of
otoliths
Vari-ance
Fleet 1
Fleet 2
…
Fleet x
Fleet 1
Fleet 2
…
Fleet x
Yes/No
Yes/No
…
Yes/No
n
n
…
n
Yes/No
Yes/No
…
Yes/No
Yes/No
Yes/No
…
Yes/No
n
n
…
n
Yes/No
Yes/No
…
Yes/No
Yes/No
Yes/No
…
Yes/No
n
n
…
n
Yes/No
Yes/No
…
Yes/No
Yes/No
Yes/No
…
Yes/No
n
n
…
n
Yes/No
Yes/No
…
Yes/No
Fleet 1
Fleet 2
…
Fleet x
Yes/No
Yes/No
…
Yes/No
n
n
…
n
Yes/No
Yes/No
…
Yes/No
…………………………….
Country X
n
n
…
n
Yes/No
Yes/No
…
Yes/No
Yes/No
Yes/No
…
Yes/No
Table 6. Report (proto-type): Country records. Official and non-official catch data.
Country records of ICES Division No. X
Country 1
Country 2
....
Country X
Total
Official Landings
Unreported
Mis-allocated
Discards
Total
....
...
....
....
....
18
Table 7. Report (proto-type): Fleet record (sample). Catch-at-age, weight-at-age and additional
information on sampling (number of otoliths and coefficients of variation).
Country A
Fleet a
ICES Division No. x
LANDINGS
Body wgt Number of Coefficient
Landings
otoliths of variation
(sample No. y)
DISCARDS
Number
Discards
Body wgt
Discards
Number of
otoliths
Coefficient
of variation
TOTAL
Number
caught
Age gr.
Number
landed
0
1
...
....
....
....
....
...
....
....
....
....
SOP
Mean Wgt
Total
-
SOP
Mean Wgt
Total
-
SOP
Max a
TOTAL
If data above are not available, then total catc, landings or discards (in weight) may be available:
Yield
Not avail.
Not avail.
Not avail.
Not avail.
Not avail.
Not avail.
Table 8. Report (proto-type): Processing of fleets records or country records with incomplete samples.
Sample Ct
Method of weighting
ICES- Land, Disc.
Fleet Div. Samp. Samp.
Fleet record No. X
........
Fleet record No. Y
Method no. Method no.
Landings
Discards
Samp. Used Sampl. Used
........
Method no. Method no.
Landings
Discard
Samp. Used Sampl. Used
........
1
Yes/No Yes/No
Yes/No
Yes/No
........
Yes/No
Yes/No
2
Yes/No Yes/No
Yes/No
Yes/No
........
Yes/No
Yes/No
.........
.........
........
.......
.......
Yes/No
Yes/No
........
Yes/No
Yes/No
......
...... ......
......
......
.......
Yes/No Yes/No
Z
Table 9. Report (proto-type): Results of processing of fleet-records and country-records.
Country A
Age gr.
0
1
...
Max a
TOTAL
Estimation
Sample
1
2
......
Z
Fleet a
ICES Division No. x
LANDINGS
DISCARDS
Number
landed
Body wgt
Landings
Number
Discards
Body wgt
Discards
TOTAL
Number
caught
....
....
...
....
....
SOP
Method no.
Landings Samp.
Used
Yes
Yes
.........
Yes
Mean Wgt
Method no.
Discards Sampl.
Used
Yes
No
.........
Yes
SOP
Mean Wgt
SOP
19
Table 10. Report (proto-type): Country total of fleet records.
Country A
LANDINGS
Age gr.
Number
landed
0
1
...
Max a
TOTAL
S
S
....
S
SOP
All Fleets
Body wgt Number of
Landings
otoliths
S
S
....
S
Mean Wgt
S
S
....
S
-
All ICES Divisions
DISCARDS
Number
landed
Body wgt
Discards
Number of
otoliths
TOTAL
Number
caught
S
S
...
S
SOP
S
S
....
S
Mean Wgt
S
S
....
S
Total
S
S
....
S
SOP
Table 11. Input table to stock assessment (last column).
Age gr. Number Landed
Number Discarded
TOTAL INPUT TO VPA
0
S
S
S
1
S
S
S
...
....
...
....
Max a
S
S
S
Table 12. Proto-type of Country record for data exchange.
COUNTRY RECORD
Country
Denmark
Area
IV
(Given only if Div or sub-div not filled in)
Division
IVc
(Given only if sub-div not filled in)
Sub-division
IVc East
Year
2001
Official Landings
9000
Unreported
7000
Misallocated
3000
Discards
5000
Table 13. Proto-type of fleet record for data exchange.
FLEET RECORD
Country
Denmark
Fleet
Trawlers
(Can be all Fleets, or set of fleets)
Area
IV
(Given only if Div or sub-div not filled in)
Division
IVc
(Given only if sub-div not filled in)
Sub-division
IVc East
Year
2001
Time period
Q1
Land. (tons )
29135
(when SOP available, this field need not be filled in)
Disc. (tons )
38692
(when SOP available, this field need not be filled in)
Total number
Average Body Weight
landed/ discarded Number of Otoliths
(during period)
Land Age 1
564
6
1.10
Land Age 2
1128
12
1.50
Land Age 3
1034
11
2.00
Land Age 4
282
3
2.20
Discard Age 1
2883
12
0.95
Discard Age 2
512
8
1.15
Discard Age 3
0
0
Discard Age 4
0
0
20
Coefficient of
Variation %
12
5
8
15
16
25
11. FIGURES
Figure 1. Illustration of the gap-filling-process.
The “borrowing” of samples is illustrated in the figure by the broken lines from a sample to a catch-agecomposition.
Figure 2. The basic hierarchy of tables in VPABase
Age Comp.
record
FLEET
RECORD
COUNTRY
RECORD
Age Comp.
record
FLEET
RECORD
Age Comp.
record
Age Comp.
record
FLEET
RECORD
FLEET
RECORD
21
Figure 3. Data Tables and relations of the ACCESS implementation of VPABase
(Compare Table 1)
Note that the two tables “T_Use_Of_Samples” and “T_Use_Of_Samples_Saved”, are the tables containing information on the data-processing, whereas the other
tables contain “observations” from fishery.
22
Figure 4. Data-tables, Look-Up-tables and relations of the ACCESS implementation of VPABase ,
(omitting here the two auxiliary tales “T_Use_Of_Samples” and “T_Use_Of_Samples_Saved”).
23
Figure 5. Main menu of VPABase.
24
Figure 6. Data entry form of VPABase.
25
Figure 7. Menu for data processing.
Figure 8. Data entry form for the selection of age compositions to be used to fill-in unsampled catches
(hypothetical example).
26
Figure 9. EXCEL worksheet used by the ICES Herring WG and the Mackerel, Horse mackerel, Sardine
and Anchovy WG.
(The figure shows only a part of the worksheet)
Figure 10. Example of report in EXCEL format.
27