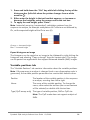
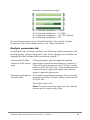
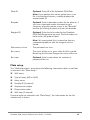
1
January 2009 PyroMark Q24 Analysis Software User Guide For use with the PyroMark Q24 Sample & Assay Technologies QIAGEN Sample and Assay Technologies QIAGEN is the leading provider of innovative sample and assay technologies, enabling the isolation and detection of contents of any biological sample. Our advanced, high-quality products and services ensure success from sample to result. QIAGEN sets standards in: Purification of DNA, RNA, and proteins Nucleic acid and protein assays microRNA research and RNAi Automation of sample and assay technologies Our mission is to enable you to achieve outstanding success and breakthroughs. For more information, visit www.qiagen.com. Contents Product Use Limitations 5 Product Warranty and Satisfaction Guarantee 5 Technical Assistance 5 Introduction 6 About this user guide 6 PyroMark Q24 Analysis Software 7 Analysis Modes 7 Shortcut Browser 8 Main Menu and Toolbars 9 General Hints and Tips 12 Protection of files 12 Validation of assays 13 Assay Setup 13 Workflow 13 Sequence to analyze 14 Variable positions tab 19 Analysis parameters tab 21 Run setup 24 Workflow 24 Run parameters 24 Plate setup 25 Run Workflow 30 30 Analysis 30 Workflow 30 Overview tab 31 Analysis setup tab 34 Color legend 35 Reports 40 Analysis statistics report 41 Analysis results report 42 PyroMark Q24 Analysis Software User Guide 01/2009 3 Pyrogram report 44 Full report 45 SNP overview report 46 Manage Instrument Methods 47 Method parameters 47 Troubleshooting Guide 48 References 48 4 PyroMark Q24 Analysis Software User Guide 01/2009 Product Use Limitations Use the PyroMark Q24 Analysis Software only with the PyroMark Q24. Product Warranty and Satisfaction Guarantee QIAGEN guarantees the performance of all products in the manner described in our product literature. The purchaser must determine the suitability of the product for its particular use. Should any product fail to perform satisfactorily due to any reason other than misuse, QIAGEN will replace it free of charge or refund the purchase price. We reserve the right to change, alter, or modify any product to enhance its performance and design. If a QIAGEN product does not meet your expectations, simply call your local Technical Service Department or distributor. We will credit your account or exchange the product — as you wish. Separate conditions apply to QIAGEN scientific instruments, service products, and to products shipped on dry ice. Please inquire for more information. A copy of QIAGEN terms and conditions can be obtained on request, and is also provided on the back of our invoices. If you have questions about product specifications or performance, please call QIAGEN Technical Services or your local distributor (see back cover or visit www.qiagen.com). Technical Assistance At QIAGEN, we pride ourselves on the quality and availability of our technical support. Our Technical Service Departments are staffed by experienced scientists with extensive practical and theoretical expertise in sample and assay technologies and the use of QIAGEN products. If you have any questions or experience any difficulties regarding the PyroMark Q24 or QIAGEN products in general, please do not hesitate to contact us. QIAGEN customers are a major source of information regarding advanced or specialized uses of our products. This information is helpful to other scientists as well as to the researchers at QIAGEN. We therefore encourage you to contact us if you have any suggestions about product performance or new applications and techniques. For technical assistance and more information, please see our Technical Support Center at www.qiagen.com/Support or call one of the QIAGEN Technical Service Departments or local distributors (see back cover or visit www.qiagen.com). PyroMark Q24 Analysis Software User Guide 01/2009 5 Introduction About this user guide This user guide provides information about the functions and features of the PyroMark Q24 Analysis Software. Please refer to the PyroMark Q24 User Manual for complete information about the proper care, maintenance, and use of the instrument. This user guide describes the features of the software and associated tools and enables the user to manage and modify files and analyses. This user guide provides information about the PyroMark Q24 Analysis Software in the following sections: Introduction PyroMark Q24 Analysis Software Analysis modes Shortcut browser Main menu and toolbars General hints and tips Assay setup Run setup Run Analysis Reports Manage instrument methods 6 PyroMark Q24 Analysis Software User Guide 01/2009 PyroMark Q24 Analysis Software The PyroMark Q24 system is a complete solution comprising instrument, chemistry, and software. The integrated software is designed with two analysis modes: AQ for a variety of quantification studies and SNP analysis, and CpG for methylation analysis. AQ and CpG assays can be performed on the same plate. The main advantages of PyroMark Q24 are: High-resolution quantification of individual sites Built-in quality control for bisulfite treatment in methylation assays Analysis of methylation in the presence of SNPs Quantification of di-, tri-, or tetra-allelic mutations All assays use sequence context as built-in quality control Analysis Modes PyroMark Q24 Software has two analysis modes: AQ: A variety of quantification studies and SNP analysis. CpG: Methylation analysis of multiple consecutive CpG sites. AQ assays and CpG assays can be performed on the same PyroMark Q24 Plate. To toggle between the analysis modes in the analysis view, select “AQ” or “CpG” in the toolbar. PyroMark Q24 Analysis Software User Guide 01/2009 7 Shortcut Browser The shortcut browser provides a quick and easy way to access folder contents and commonly used files. Add a shortcut to a folder or drive by clicking “Add Folder Shortcut” or right-click the “Shortcuts” folder and select “Add Folder Shortcut” from the context menu. Add a shortcut to a file by clicking “Add File Shortcut” or right-click the “Shortcuts” folder and select “Add File Shortcut” from the context menu. Remove a shortcut by right-clicking the shortcut and selecting “Remove Shortcut” from the context menu. (A folder shortcut's files and subfolders cannot be removed separately.) Update the contents of a folder by right-clicking it and selecting “Refresh” from the context menu. View file or folder properties (e.g., run parameters) by right-clicking the file or folder and selecting “Properties” from the context menu. Creating, opening and copying files: Create a new assay file by right-clicking the desired folder. Select “New Assay” and then “AQ Assay” or “CpG Assay” from the context menu. Enter the filename and press “Enter”. To set up the assay, see Assay Setup, page 13. Create a new run file by right-clicking the desired folder. Select “New Run” from the context menu. Enter the filename and press “Enter”. To set up a run, see Run Setup, page 24. Copy a processed run file and rerun it by right-clicking the run file and selecting “Copy and Rerun” from the context menu. The process and analysis data will not be copied. 8 PyroMark Q24 Analysis Software User Guide 01/2009 Copy a file using Windows Explorer by right-clicking the folder containing the file and selecting “Explore” from the context menu. Windows Explorer opens. For more information, press the F1 key to open the online help. Note: To avoid losing data, do note copy a file that is open in PyroMark Q24 Software. Open a file by double-clicking it or right-click the file and select “Open” from the context menu (to open a processed run file, select “Open with” and then select the analysis mode, “AQ” or “CpG”). The following icons are used to display information about the files: AQ assay file CpG assay file A run file that has not been processed A run file that has been processed Broken shortcut. This may be due to a network server that is temporarily inaccessible or that the file or the folder has been moved, renamed, or deleted outside the software. Main Menu and Toolbars File menu and toolbars Select “AQ Assay” or “CpG Assay” from the “New Assay” submenu, or click in the toolbar and select “New AQ Assay” or “New CpG Assay”, to create a new AQ or CpG assay (see Assay Setup, page 13). Select “New Run” or click the green icon in the toolbar to create a new run file (see Run Setup, page 24). Select “Open” or click in the toolbar to open a saved assay or run file. Select “Create New Run from Sample Layout File” from the Import submenu to create a new run using a plate layout for Sample IDs and notes (optional) defined in a tab- or comma-delimited text file (*.tsv or *.csv). Select “Create New AQ/CpG Assay from Assay Design File” from the “Import” submenu to create a new AQ or CpG assay based on an assay file (*.xml) created with Pyrosequencing Assay Design Software. The software will import the sequence to analyze and the names of the variable positions. PyroMark Q24 Analysis Software User Guide 01/2009 9 Select “Save” or click in the toolbar to save the changes in the current file. If the file has never been saved, select the location and name of the file in the dialog box. Select “Save As” to save a copy of the current file. Select location and name of the file in the dialog box. Select “Exit” to shut down the software. Tools menu for unprocessed run files Select “Instrument Methods” to view the settings for the instrument methods and, if necessary, import or set up new methods according to settings supplied by Pyrosequencing (see Manage Instrument Methods, page 47). Select “Pre Run Information” to view the required volumes of the enzyme mix, substrate mix, and nucleotides, and the plate setup for the current run file. To print the report, click . Note: To print the report in color, turn on the “Print background colors and images” option in the Internet Explorer (Tools/Internet Options/Advanced/Printing). Tools menu for processed run files Select “Run Information” to view and print the run parameters and a run log for the current run file. To print the report, click . Select “Export Peak Heights” to save the peak heights of all used wells as a text file. Select “Export Environment Data” to save the mixer, block temperature, and pressure readings as a text file. The temperatures of the environment, the process chamber lid, and the cooler are also listed. Select “Export Raw Data” to save the intensities and dispensation substances and moments as a text file. Select “Analysis Log” to save the log with all (saved) analyses performed on the selected well as a text file or an HTML file. Each analysis is logged with the used analysis settings, analysis mode (AQ or CpG) and analysis version, results (including any warnings), date and time, and the Windows user account used to perform the analysis (see the General Hints and Tips section). Text files (*.tsv or *.csv) can be imported into Microsoft Excel or other applications that can handle 10 PyroMark Q24 Analysis Software User Guide 01/2009 data that is separated by semicolons (;) or tabs. This is useful when doing further calculations on the data. Reports menu for CpG runs The “Analysis Statistics” report includes analysis statistics for all or selected wells. The “Analysis Results” report includes well information and analysis results for all or selected wells. Reports menu for AQ runs The “Pyrogram Report” includes well information and Pyrogram for all or selected wells. The “Full Report” includes run parameters, run log, and well information and analysis results (including Pyrogram) for all or selected wells. The “SNP Overview Report” includes genotypes and quality assessments for all SNPs. The information is presented in plate overviews with one plate per position number. The report options are only available for processed runs. For more information on the reports, see the “Reports” section. Note: In order to view the Full Report, Pyrogram Report, and SNP Overview Report, you must have Adobe Acrobat Reader installed on your computer. Adobe Acrobat Reader is available on the PyroMark Q24 Software CD but can also be downloaded at www.adobe.com. Window menu Toggle between open files in the software using the “Window” menu. Help menu Select “PyroMark Q24 Software Help” or press the F1 key to open the online help. PyroMark Q24 Analysis Software User Guide 01/2009 11 Analysis toolbar Click and select “Analyze All Wells” or “Analyze Selected Wells” (see Select Wells, page 36) for the current run file. Click to view and print the run parameters (run name, instrument method, plate ID, barcode, reagent ID, and run note) and a run log for the current run file. To print the report, click . Select “AQ” or “CpG” in the toolbar to toggle between the analysis applications. General Hints and Tips All (saved) analyses performed are logged with analysis settings used, analysis mode (AQ or CpG) and analysis version, results (including any warnings), date and time of the analysis, and who performed the procedure. For information on who performed an analysis and who created an assay or run file to be correct, all users must log on to Windows using their own user accounts. For more information about user accounts and logging on and off, see Windows online help or contact your system administrator. Protection of files If you want to protect a file from being edited by another user, save the file in a folder that can only be accessed by you (contact your system administrator for more information). If you want to protect a file from being accidentally overwritten by you or another user, set the read-only attribute for the file using Windows Explorer: 1. Close the file in PyroMark Q24 Software. 2. Open Windows Explorer and locate the file. This can be done by right-clicking the folder (containing the file) in the shortcut browser. 3. In Windows Explorer, right-click the file and select “Properties” from the context menu. 4. When the “Properties” dialog box appears, turn on ( ) the Read-only attribute and click “OK”. A backup should be performed frequently. The more frequently a file is saved, the more information is recovered if there is a power failure or similar problem while the file is open. To save a file, click in the toolbar. If the file has never been saved, select location and name of the file in the dialog that appears. 12 PyroMark Q24 Analysis Software User Guide 01/2009 Validation of assays Validate your assays using reference samples, see Appendix B of the PyroMark Q24 User Manual, page B-1. Assay Setup Workflow 1. Click in the toolbar and select “New AQ Assay” or “New CpG Assay”. A new assay file is created. 2. Enter the sequence to analyze (see Sequence to Analyze, page 14). 3. Click the “Generate Dispensation Order” button (see Dispensation Order, page 15). 4. Optional: If creating a CpG assay, enter the “Sequence Before Bisulfite Treatment”. This information is useful when adding bisulfite treatment controls. 5. Recommended: If creating a CpG assay, add bisulfite treatment controls, preferable in the beginning of the sequence (see Histogram, page 17). 6. Optional: Enter information about the assay in the “Note” text box. 7. Optional: Set up the variable positions (see Variable Positions Tab, page 19). 8. Before running your samples, validate your assay using reference samples (see Appendix B of the PyroMark Q24 User Manual, page B-1). Note: In the shortcut browser, you can create a new assay file by right-clicking the folder you wish to place it in and selecting “New Assay” and then “AQ Assay” or “CpG Assay” from the context menu. Enter the filename and press “Enter”. (To add a shortcut to a folder or drive, click “Add Folder” Shortcut.) Note: An assay note can be displayed in the shortcut browser by positioning the mouse pointer over the assay file. Note: The more frequently the file is saved, the more information is recovered if there is a power failure or similar problem while the file is open. To save the file, click in the toolbar. If the file has never been saved, select location and name of the file in the dialog that appears. PyroMark Q24 Analysis Software User Guide 01/2009 13 Sequence to analyze Type or paste (“Ctrl+V”) the sequence to analyze into the “Sequence to Analyze” text box. (If creating a CpG assay, enter the sequence after the bisulfite treatment.) Variable positions can be entered using either IUPAC codes or a forward slash (/) as a separator between the two potential bases, for example C/T. If the sequence to analyze contains an error, this is displayed by a red exclamation mark at the end of the text box. Position the mouse pointer over the exclamation mark and a tooltip will display an explanation of the error. The character or characters that caused the error will be red. As T/T is not a valid variable position, it causes an "Invalid sequence" error. Note: If you are analyzing "nonstandard" methylation patterns, for example methylations of Cs that are not followed by Gs, these patterns can be analyzed in the AQ mode. If you still want to analyze in the CpG mode, enter extra Gs in the “Sequence to Analyze” text box and set the expected heights of the extra Gs to zero (0); see Adjust Heights of Histogram Bars, page 18. Code Description Code Description A Adenine K T or G C Cytosine W T or A G Guanine S C or G T Thymine B C, T, or G (not A) U Uracil D A, T, or G (not C) R Purine (A or G) H A, T, or C (not G) Y Pyrimidine (C or T) V A, C, or G (not T) M C or A N Any base (A, C, G, or T) Note: S, B, V and N are not valid after bisulfite treatment. Valid patterns in a CpG assay Patterns that cannot exist after bisulfite treatment are not valid in a CpG assay, for example, GC/TGAC/G as C/TG is a forward CpG site and C/G cannot exist after bisulfite treatment. 14 PyroMark Q24 Analysis Software User Guide 01/2009 The following CpG site and SNPs can be included in a forward sequence: CpG site: C/TG SNPs: A/T, A/G, G/T, and A/T/G (i.e. C cannot be included). The following CpG site and SNPs can be included in a reverse sequence: CpG site: CG/A SNPs: A/T, A/C, C/T, and A/T/C (i.e. G cannot be included). Note: The software does not support analysis of CpG sites that include an additional variable position, for example A/C/TG. Note: A/CG before bisulfite treatment can be analyzed by typing C/TG in the “Sequence to Analyze” text box and “ATCG” in the “Dispensation Order” text box. Proceed with the run as usual. After analysis of the CpG sites, switch to the AQ mode and change C/TG to A/C/TG (in the “Sequence to Analyze” text box) and analyze the variable position. In the same way, C/TG/A can be analyzed by typing C/TG in the “Sequence to Analyze” text box and TCGA in the “Dispensation Order” text box. After analysis of the CpG sites, switch to the AQ mode and change C/TG to C/TG/A (in the “Sequence to Analyze” text box) and analyze the variable position. Dispensation order A dispensation order for the entered sequence to analyze is generated by the software by clicking the “Generate Dispensation Order” button. The generated dispensation order includes blank dispensations to ensure that the correct sequence has been obtained. When creating CpG assays, the dispensation order should also include bisulfite treatment controls. These controls have to be added manually, by the user, after the dispensation order has been generated, see Histogram, page 17. PyroMark Q24 Analysis Software User Guide 01/2009 15 If desired, the dispensation order can be entered manually. Note: When clicking “Generate Dispensation Order”, any existing dispensation order will be overwritten. Note: When a base position is selected in the sequence to analyze, the corresponding dispensation is highlighted with a gray background color, and vice versa. Dispensation warnings If the dispensation order contains a warning, this is displayed by a red exclamation mark at the end of the text box. It is possible to run an assay with a dispensation warning, but the warning must be considered when evaluating the analysis result. If you position the mouse pointer over the exclamation mark, a tooltip will display an explanation of the warning. Warning Suggested action Sequence uncertain due The problem may be resolved by either entering to lack of terminal more sequence information or reducing the sequence information. number of dispensations. Sequence not in phase at the end of the dispensations. The problem may be resolved by adjusting the dispensation order (manually or by clicking “Generate Dispensation Order”) or entering more sequence information. Note: If the problem is not resolved, the out-of phase stretch will not be analyzed. The generated dispensation order contains less reference peaks than required. 16 If possible, enter more sequence information and increase the number of dispensations. For the best possible quality assessment of the results, we recommend five or more reference peaks. PyroMark Q24 Analysis Software User Guide 01/2009 Histogram The following icons and colors are used in the histogram: Variable positions are highlighted with a blue-gray background color Reference peaks are marked with blue diamonds over the histogram bars Bisulfite treatment controls are marked with orange diamonds over the histogram bars and highlighted with a yellow background color (CpG assays only). Add or remove bisulfite treatment controls CpG assays should contain at least one internal control to assess successful bisulfite treatment, preferably at the beginning of the sequence. C bases that are not followed by G in the sequence are usually not methylated, and should therefore be fully converted to T after bisulfite treatment and PCR. As a result of successful bisulfite treatment, all templates should show only Ts and no Cs in these positions. For reverse assays, all templates should show only As and no Gs in these positions. The potential positions for bisulfite treatment controls are illustrated with a bold, orange letter: T in a forward assay and A in a reverse assay. A bisulfite treatment control can be added by left-clicking the bold, orange T or A and selecting the desired option from the context menu. A bisulfite treatment control can be removed by left-clicking the control (C in a forward assay or G in a reverse assay) and selecting “Remove Bisulfite Control” from the context menu. Note: In the sequence before bisulfite treatment, check whether the suggested bisulfite controls are Cs converted to Ts (read as Gs and As in a reverse assay) or not. PyroMark Q24 Analysis Software User Guide 01/2009 17 View reference peaks Non-variable peaks, i.e. peaks that are not a part of a variable position (including blank dispensations), are referred to as "reference peaks". Reference peaks are used in the analysis both as references when calculating the single peak height and as internal controls when assessing the quality. To toggle between viewing and hiding reference peaks in the histogram, rightclick the histogram and select “Show Reference Peaks” from the context menu. Enable or disable reference peaks and controls By left-clicking a reference peak diamond, the peak is either enabled or disabled as a reference peak, depending on the previous state. The diamond displays the status: Filled blue diamond: Enabled as a reference peak. Hollow blue diamond: Disabled as a reference peak. By left-clicking a bisulfite treatment control diamond (CpG assays only), the control is either enabled or disabled as a control and/or a reference peak, depending on the previous state. The diamond displays the status: Filled orange diamond: Enabled both as a bisulfite treatment control and a reference peak. Filled blue diamond: Enabled as a reference peak but disabled as a bisulfite treatment control. Hollow orange diamond: Disabled both as a bisulfite treatment control and a reference peak. Position the mouse pointer over the diamond and a tooltip will describe the consequence of a click. Zoom histogram It is possible to zoom in on the histogram by selecting an aspect of it with the left mouse button. Zoom out either by right-clicking the histogram area and selecting “Zoom Out” from the context menu (the zoom is set to the previous level) or by doubleclicking the histogram area (the zoom is set to 100%). Adjust heights of histogram bars This feature is normally not used, but can be used when previous experiences have shown a reproducible deviation in the measured pattern from the theoretical pattern. 18 PyroMark Q24 Analysis Software User Guide 01/2009 1. Press and hold down the “Ctrl” key while left-clicking the top of the histogram bar (left-click when the pointer changes from a white arrow to ). 2. Either enter the height in the text box that appears, or increase or decrease the height by using the arrows next to the text box. 3. To apply the new height, press “Enter”. Note: Instead of removing "nonstandard" methylation patterns from the sequence to analyze, for example methylations of Cs that are not followed by Gs, set the expected heights of the Gs to zero (0). Orange = decreased height Blue = increased height Export histogram as image The histogram can be copied as an image to the clipboard by right-clicking the histogram and selecting “Copy as Image” from the context menu. The image can be pasted into applications that support Enhanced Metafile (EMF) images. Variable positions tab The “Variable Positions” tab contains information about the variable positions. Note: If the sequence to analyze is changed (and a new dispensation order is generated), the variable position parameters are reset to their default values. Position The location of the variable position in the sequence to analyze, counting from left to right. Name The name of the variable position. To change the name, either select the text box (the current contents will be selected) or double-click the text box. Type (CpG assays only) The type of variable position; SNP or CpG site. Note: The CpG mode does not support analysis of SNPs. PyroMark Q24 Analysis Software User Guide 01/2009 19 Analyze If this option is checked, the variable position will be analyzed. Note: This option is not available for variable positions that cannot be analyzed using the selected analysis mode. Methylation ranges The expected CpG methylation. Setting this parameter for all the CpG sites allows easy identification of sites (in the analysis results) that are outside the expected methylation range. Note: The expected methylation cannot be set for CpG sites with the Analyze option cleared. The light green area is below the expected range. The green area is within the expected range. This area can be moved to the left or to the right by holding down the left mouse button while moving the area with the mouse. The dark green area is above the expected range. The arrows can be used to increase or decrease the expected range. Note: You can also increase or decrease the expected range by: Positioning the mouse pointer over the left or the right end of the green area, so that the pointer changes from a white arrow to Moving the mouse to the left or the right while holding down the left mouse button. To edit all methylation ranges simultaneously, hold down the “Shift” key while changing one of the ranges. 20 PyroMark Q24 Analysis Software User Guide 01/2009 Example of methylation ranges Ex 1. Expected methylation = 100%. Ex 2. Expected methylation = 0–100%. Ex 3. Expected methylation = 30–70% (default). Ex 4. Expected methylation = 0% To reset the parameters at the “Variable Positions” tab and the “Analysis Parameters” tab to their default values, click “Revert to Default”. Analysis parameters tab If applicable, after the assay validation, the following analysis parameters can be edited at the “Analysis Parameters” tab. Ensure changes are validated, see Appendix B of the PyroMark Q24 User Manual, page B-1. Unsuccessful bisulfite treatment (CpG assays only) These parameters state the highest acceptable percentages of unconverted sequence to achieve 1) “Passed” quality assessment and 2) “Check” quality assessment for the CpG sites. The entered values are compared to the single peak height value that the analysis algorithm determines. Allowed percentage for The highest acceptable percentages of unconverted passed quality sequence to achieve “Passed” quality assessment for the CpG sites. The default value is 5%. Note: The value cannot be higher than the allowed percentage for check quality value. PyroMark Q24 Analysis Software User Guide 01/2009 21 Allowed percentage for The highest acceptable percentages of unconverted check quality sequence to achieve “Check” quality assessment for the CpG sites. (The warning “Uncertain bisulfite conversion at dispensation” is triggered during the analysis.) Note: This rule is only used if the rule for “Passed” quality is not met. A higher percentage of unconverted sequence than the set value will result in a “Failed” quality assessment for all CpG sites. (The warning “Failed bisulfite conversion at dispensation” is triggered during the analysis.) The default value is 7%. Note: The value cannot be lower than the allowed percentage for passed quality value. Peak height threshold These parameters set the lower intensity limit for the single peak level of Pyrogram. Required peak height for passed quality The minimum signal value for a peak to achieve “Passed” quality assessment for the variable positions. The default value is 20. Note: The value cannot be lower than the required peak height for check quality value. Required percentage for check quality The minimum signal value for a peak to achieve “Check” quality assessment for the variable positions. (The warning “Uncertain due to low peak height” is triggered during the analysis.) Note: This rule is only used if the rule for “Passed” quality is not met. The default value is 10. A signal value for a peak that is lower than the set value will result in a “Failed” quality assessment for the variable positions. (The warning “Failed due to low peak height” is triggered during the analysis.) Note: The value cannot be higher than the required peak height for passed quality value. 22 PyroMark Q24 Analysis Software User Guide 01/2009 Stringency levels The stringency of the warnings for Pattern deviation in variable positions and Sum deviation in variable positions can be set to Low, Normal (default), or High. A high stringency level narrows the allowed deviation. Pattern in deviation in variable positions The deviation between the measured peak pattern in the variable position and the theoretical peak pattern. If the deviation is higher than the set stringency level allows, the warning “Uncertain/Failed due to high pattern deviation” in variable position is triggered during the analysis. Whether the warning will yield a “Check” or “Failed” quality assessment for the analysis result depends on the magnitude of the deviation. Sum deviation in variable positions The deviation between the measured sum of all the peaks in the variable position and the theoretical sum (based on the single peak height). If the deviation is higher than the stringency level allows, the warning “Uncertain/Failed due to high sum deviation in variable position” is triggered during the analysis. Whether the warning will yield a “Check” or “Failed” quality assessment for the analysis result depends on the magnitude of the deviation. Parameters: A-peak reduction factor The factor by which the A-peak intensities are multiplied by to account for the fact that A-peaks are higher than other peaks. The default value is 0.86. For more information, Appendix B of the PyroMark Q24 User Manual, page B-1. To reset the parameters at the Variable Positions tab and the “Analysis Parameters” tab to their default values, click “Revert to Default”. PyroMark Q24 Analysis Software User Guide 01/2009 23 Run setup Workflow 1. Click in the toolbar. A new run file is created. Note: If you wish to base your run on a previous run, right-click the processed run file in the shortcut browser and select “Copy and Rerun” from the context menu. The process and analysis data will not be copied. 2. Enter the run parameters (see Run Parameters, page 24). 3. Set up the plate (i.e. add an assay and, if desired, enter a sample ID and note for each used well). 4. When the run is set up and ready to run on the PyroMark Q24: Print a list of required volumes of enzyme mix, substrate mix, and nucleotides, and the plate setup. Select “Pre Run Information” from the “Tools” menu and, when the report appears, click . Close the run file and copy it to one of the USB sticks (supplied with the system) using Windows Explorer. To open Windows Explorer, right-click the folder (containing the run file) in the shortcut browser and select “Explore” from the context menu. For more information, press the F1 key to open Windows online help. To run the plate on the PyroMark Q24, see Run, page 30. Note: In the shortcut browser, you can create a new run file by rightclicking the desired folder and selecting “New Run” from the context menu. Enter the filename and press “Enter”. (To add a shortcut to a folder or drive, click “Add Folder Shortcut”.) Note: The more frequently the file is saved, the more information is recovered if there is a power failure or similar problem while the file is open. To save the file, click in the toolbar. If the file has never been saved, select location and name of the file in the dialog that appears. Run parameters Run name The name of the run is given when the file is saved. Renaming the file also changes the name of the run. Instrument method Select instrument method according to the reagents and cartridge that will be used for the run; see the instructions supplied with the products. Note: We recommend that only methods supplied by QIAGEN are used. 24 PyroMark Q24 Analysis Software User Guide 01/2009 Plate ID Optional: Enter ID of the PyroMark Q24 Plate. Note: If you position the mouse pointer over a run file in the shortcut browser, a tooltip displays the entered plate ID. Barcode Optional: Enter a barcode number for the plate or, if you have a barcode reader connected to your computer, place the mouse cursor in the “Barcode” text box (by clicking the box) and scan the barcode. Reagent ID Optional: Enter the lot number for the PyroMark Q24 Gold Reagents to be used. The lot number can be found on the product label. Note: We recommend this is entered so that any unexpected problems with the reagents can be traced. Estimated run time The estimated run time. Run name The name of the run is given when the file is saved. Renaming the file also changes the name of the run. Run note Optional: Enter a note about the contents or purpose of the run. Plate setup The “Well Information” area shows the following information about a well that is selected in the “Plate Setup”: Well name Type of assay (AQ or CpG) Assay name Sample ID (if entered) Sequence to analyze Dispensation order Well note (if entered). If several wells are selected in the “Plate Setup”, the information for the first selected well is shown. PyroMark Q24 Analysis Software User Guide 01/2009 25 Add assay files To add an assay to a well, you can either: Right-click the well and select “Load Assay” from the context menu Select the assay in the shortcut browser and press and hold down the left mouse button while you drag the assay to the well. Note: If you wish to add an assay to several wells, select the wells (see Select Wells, page 36) and drag the assay to the selection. Note: It is not possible to add an assay with no dispensation order or add two or more assays that share the same assay name but have different dispensation orders. A well is colored according to the assay loaded to the well. Enter sample IDs and notes To enter a sample ID or note, select the cell and enter the text. To edit a sample ID or note, either select the cell (the current contents will be selected) or double-click the cell. To import a sample and note layout defined in a text file (*.tsv or *.csv), right-click a well and select “Insert Sample Layout File” from the context menu. For more information, see Define Sample ID ad Note Externally, page 28. To paste a sample layout from the clipboard, right-click a well and select “Paste Sample Layout” from the context menu. For more information, see Define Sample ID ad Note Externally, page 28. A selected cell is highlighted with a blue background color. 26 PyroMark Q24 Analysis Software User Guide 01/2009 Copy or delete contents from cells To cut the contents of a cell to the clipboard, right-click the cell and select “Cut” from the context menu. To copy the contents of a cell to the clipboard, either right-click the cell and select “Copy Cell” from the context menu or select the cell and press “Ctrl+C”. To paste the clipboard to a cell or a selection of cells (see Select Wells, page 36), either right-click the cell or the selection and select “Paste” from the context menu or select the cell(s) and press “Ctrl+V”. To delete one or more assays, sample IDs, or notes, either right-click the cell or the selection and select “Delete” from the context menu or select the cell(s) and press “Delete”. Drag-copy To drag-copy the contents of a cell to other wells: 1. Select the cell that you wish to copy. 2. Position the mouse pointer over the lower right square of the selection, and press and hold down the left mouse button while you move the mouse to change the selection. 3. When the left mouse button is released, the contents of the first selected cell are pasted into the selected cells. Drag-copy of the note "25 μl PCR prod". Drag-copy and increment sample ID If the last part of an entered sample ID is a number, the number can be incremented when drag-copying the sample ID: 1. Select the sample ID cell. 2. To increment by row: Position the mouse pointer over the lower right square of the selection. Press and hold down the “Ctrl” key + the left mouse button while moving the mouse to change the selection. First, release the left mouse button, then the “Ctrl” key. When the left mouse button is released, the sample ID of the first selected cell is incremented and pasted into the selected cells. PyroMark Q24 Analysis Software User Guide 01/2009 27 3. To increment by column: Position the mouse pointer over the lower right square of the selection. Press and hold down the “Shift” and “Ctrl” keys + the left mouse button while moving the mouse to change the selection. First, release the left mouse button, then the “Shift” and “Ctrl” keys. When the left mouse button is released, the sample ID of the first selected cell is incremented and pasted into the selected cells. The sample ID "Sample 1" is copied and incremented by column. Print or export plate setup as image The “Plate Setup” can be printed or copied as an image (to the clipboard) by right-clicking the plate and selecting “Print” or “Copy as Image” from the context menu. The image can be pasted into applications that support Enhanced Metafile (EMF) images. To print a list of required volumes of reagents (enzyme mix, substrate mix, and nucleotides) and the plate setup, select “Pre Run Information” from the “Tools” menu and, when the report appears, click . Note: If you want to print the report in color, turn on the “Print background colors and images” option in the Internet Explorer (Tools/Internet Options/Advanced/Printing). Define sample ID and note externally By using the “Import/Insert Sample Layout File” or “Paste Sample Layout” feature, you can easily use the same layout in several runs and reuse information available in existing documentation. Using the import/insert sample layout file feature You can, for example, generate layout files from your Laboratory Information Management Systems (LIMS). Sample and note layout files can also be created in Microsoft Excel, Notepad and similar applications. The layout file must have two or three columns: "Well", "Sample ID", and "Note" (optional). Each column must be separated by a tab, comma, or semicolon, and each line must be delimited by a line break. Save the file as a tab- or comma-delimited text file (*.tsv or *.csv). 28 PyroMark Q24 Analysis Software User Guide 01/2009 The sample and note layout file can be imported into: An existing run file by right-clicking a well in the “Plate Setup” and selecting “Insert Sample Layout File” from the context menu A new run file by selecting Import and then “Create New Run” from “Sample Layout File” from the “File” menu. An example of a sample and note layout file created in Microsoft Excel. The result when importing the sample and note layout file above. Using the paste sample layout feature You can, for example, generate and copy layouts from your LIMS. Sample layouts can be copied from Microsoft Excel, Word, Notepad, and similar applications. In the source file, each column of sample IDs must be delimited by a tab and each row of sample IDs must be delimited by a line break. The sample layout can be pasted into an existing run file by copying all the information in the source file, and right-clicking a well in the “Plate Setup” and selecting “Paste Sample Layout” from the context menu. The software will paste the sample IDs into the plate, starting at well A1. (If any well notes have been entered into the wells, these are kept.) An example of a sample layout created in Microsoft Notepad. PyroMark Q24 Analysis Software User Guide 01/2009 29 The result when copying and pasting the sample layout above. Run Workflow When a run is set up and ready to run on the PyroMark Q24, perform the following steps (see Section 5.5 of the PyroMark Q24 User Manual): 1. Prepare your samples. 2. Fill the PyroMark Q24 Cartridge with the required volumes of reagents. 3. Load the reagent cartridge and the PyroMark Q24 Plate into the instrument. 4. Insert the USB stick (containing the run file) into the USB port at the front of the instrument. 5. Select the run file and start the run. 6. When the run has been completed and data transferred to the USB stick, remove the USB stick. 7. Unload the plate and the reagent cartridge. Analysis Workflow 1. Insert the USB stick (containing the processed run file) into computer's USB port. Note: The computer must have PyroMark Q24 Software installed. 2. Move the run file from the USB stick to the desired location on the computer using Windows Explorer. 3. Open the run file in PyroMark Q24 Software either by selecting “Open” in the File menu or double-clicking the file ( ) in the shortcut browser. (To update the contents of a folder in the shortcut browser, right-click it and select “Refresh” from the context menu.) 30 PyroMark Q24 Analysis Software User Guide 01/2009 4. To analyze the run and get an overview of the results, compare the Pyrogram of different wells, or enter an analysis note, see Overview Tab, page 31. 5. To modify how the analysis is performed, see Analysis Setup Tab, page 34. 6. To generate analysis reports, see Reports, page 40. Note: The more frequently the file is saved, the more information is recovered if there is a power failure or similar problem while the file is open. To save the file, click in the toolbar. Overview tab At the “Overview” tab, in the analysis view, you can analyze the run, get an overview of the results, compare Pyrograms of different wells, and enter an analysis note. Analyze There are two ways to perform the analysis: Analyze all wells with a valid analysis setup for the selected analysis mode. Analyze the selected wells (see Select Wells, page 36). Note: It is also possible to right-click the selection and select “Analyze Selected” from the context menu. During the analysis a progress dialog is shown. This dialog contains a progress bar, a stop button, and the name of the well that is being analyzed. The analysis is stopped by clicking the “Stop” button. PyroMark Q24 Analysis Software User Guide 01/2009 31 AQ assays are analyzed in the AQ mode and CpG assays are analyzed in the CpG mode. To toggle between the analysis modes, select “AQ” or “CpG” in the toolbar. Note: Since the CpG mode does not support automatic analysis of SNPs, methylation percentages and quality assessments are only determined for the CpG sites. SNPs in CpG assays can be analyzed in the AQ mode using the (the CpG setups, select “AQ” in the toolbar, select the wells and click “Analyze Selected Wells” button). To exclude the CpG sites in the SNP reports, turn off (clear) the Analyze option for these positions at the “Analysis Setup” tab; see page 34. Well colors The color of the well indicates whether a well has been analyzed or not: Beige: Not analyzed (or not used). Either the well has not been analyzed or the assay has no valid analysis setup for the selected analysis mode Light blue: Analyzed View analysis results By selecting an analyzed well in the plate overview, its Pyrogram and histogram are displayed in the lower part of the window. Well information, including any analysis warnings, is listed in the “Well Information” area. For more information, see Well Information Area, page 39 and Pyrogram Details, page 37. The following well information can be viewed in the plate overview: Select to show the assay name Select to show the sample ID Select to show the well note. Select to show the quality bar. The quality bar shows the quality assessment of all variable positions in the well. For more information, see Color Legend, page 35. Select to show the mean methylation percentage of all CpG sites (except for failed) in the well. (Only available when in the CpG mode.) 32 PyroMark Q24 Analysis Software User Guide 01/2009 Select to show the methylation bar. The methylation bar shows the methylation level for each CpG site in the well. For more information, see Color Legend, page 35. (Only available when in the CpG mode.) Note: Wells with a high substrate peak will be marked with an information icon ( ) in the plate overview. This will not affect the quality assessments. Print or export plate overview as image The plate overview can be printed or copied as an image (to the clipboard) by right-clicking the plate overview and selecting “Print” or “Copy as Image” from the context menu. The image can be pasted into applications that support Enhanced Metafile (EMF) images. Compare Pyrogram of different wells To compare Pyrogram of a specific well (displayed in the Pyrogram area) with Pyrogram of one or several wells (displayed in the histogram area): 1. Select the well or wells (see Select Wells, page 36) you wish to open in the histogram area (the lower area). 2. Right-click the selection and select “Open” from the context menu. 3. Select the well you wish to open in the Pyrogram area (the middle area). If Pyrogram of several wells are displayed in the lower area, use the scroll bar to change Pyrogram within the selection. For more information and instructions on how to zoom in and out of Pyrogram, see Pyrogram Details, page 37). To close Pyrogram in the lower area and view the histogram for the selected well, click in the upper right corner of the Pyrogram area. Enter analysis note In the lower right corner, you can enter an analysis note. To expand or collapse the Note field, click + or –. PyroMark Q24 Analysis Software User Guide 01/2009 33 Analysis setup tab At the “Analysis Setup” tab, in the analysis view, it is possible to modify how the analysis is performed. Change analysis settings Modified analysis settings can be applied to selected wells or all wells that share the same assay and dispensation order as the displayed well. 1. In the plate navigator or overview, select the well or wells (see Select Wells, page 36) for which you wish to change the analysis settings. Only select wells with the same assay and dispensation order. Note: If you wish to change the analysis settings for all wells with the same assay and dispensation order, you only have to select one of the wells. 2. Change analysis settings at the “Analysis Setup” tab: To enable or disable variable positions (turn the “Analyze” option on or off) and/or change expected methylation ranges (only CpG assays), see Variable Positions Tab, page 19. To enable or disable reference peaks and/or bisulfite treatment controls (only CpG assays) or adjust the heights of the histogram bars, see Histogram, page17. To change other analysis settings, see Analysis Parameters Tab, page 21. Note: It is not possible to change the assay name, dispensation order, or assay note. 3. When finished, click “Apply”. The “Apply Analysis Setup” dialog appears. 4. To apply the changes to all wells that share the same assay and dispensation order as the displayed well (i.e. all the white wells in the “Apply Analysis Setup” dialog), click “To All”. 5. To apply the changes to the selected wells, (i.e. the white wells that are selected in the “Apply Analysis Setup” dialog), click “To Selected”. Note: The changes can only be applied to wells that share the same assay and dispensation order as the displayed well. During the analysis a progress dialog is shown. The dialog contains a progress bar, a stop button, and the name of the well that is being analyzed. The analysis can be stopped by clicking “Stop”. 6. To save the changes, click . Note: All saved changes are logged. To view the analysis log for a selected well, select “Analysis Log” from the “Tools” menu. 34 PyroMark Q24 Analysis Software User Guide 01/2009 Use modified assay in other runs Changes made at the “Analysis Setup” tab will not be saved in the original assay file. To use the modified assay in other runs: 1. In the plate navigator, select a well that is using the modified assay and click “Save Assay”. The “Save Assay As” dialog appears. 2. Save the changes to the original file or save the modified assay as a new file: Select destination (folder) from the “Save in” drop-down list. Enter filename in the File name text box and click “Save”. View analysis results By selecting a well in the plate navigator, its Pyrogram is displayed in the Pyrogram area and well information (including any analysis warnings) is listed in the Well Information area. If several wells are selected in the plate navigator, information for the first selected well (the well with the orange selection frame) is shown. For more information, see Well Information Area, 39 and Pyrogram Details, page 37. Color legend Quality assessments Quality bars in the plate overview at the “Overview” tab. (If the quality bars are not shown, click one of the three at the top right corner and select from the drop-down list.) The background color of the analysis results (the allele frequencies or the . methylation percentages) in Pyrogram, for example If a quality assessment has been edited by the user, this is displayed in , and in the Pyrogram by a border around the analysis result, for example plate overview or navigator by a black square in the well, for example . For instructions on how to edit a quality assessment, see Edit Quality Assessments, page 39. Off-white means not analyzed (either analysis is not supported by the software [e.g., SNP when in the CpG mode] or the variable position has been deselected by the user, blue means passed, yellow means check, red means failed. PyroMark Q24 Analysis Software User Guide 01/2009 35 Methylation levels When in the CpG mode, a methylation bar at the Overview tab shows the methylation level for each CpG site in the well. To view the methylation bars in the plate overview, click one of the three at the top right corner and select from the drop-down list: Light green: Below the defined range Green: Within the defined range Dark green: Above the defined range Select wells To select a single well, simply click on it. To select a rectangular group of wells, for example A2-A3, B2-B3, and C2-C3: Press and hold down the left mouse button while dragging the mouse pointer from well A2 to C3, or Select well A2 and press and hold down the “Shift” key while selecting well C3, or Select well A2 and press and hold down the “Shift” key while pressing the “Right Arrow” key once and the “Down Arrow” key twice. To add wells to the selection above, for example wells B7 and C7, press and hold down the “Ctrl” key while selecting the wells. To deselect a well, press and hold down the “Ctrl” key while selecting the well. Note: If several wells are selected in the plate overview or navigator, information for the first selected well (the well with the orange selection frame) is shown in the Well Information area, Pyrogram area, etc. 36 PyroMark Q24 Analysis Software User Guide 01/2009 Pyrogram details The following information, icons, and colors are displayed and used in the Pyrogram area: The well name and the sequence to analyze are shown in the upper left corner The analysis result (the allele frequencies or the methylation percentage) is . The background displayed above each variable position, for example color shows the quality assessment of the analysis result; see Color Legend, page 35. If the mouse pointer is positioned over the analysis result, a tooltip displays the position number and any analysis warnings (in white) = The software does not Note: = Deselected by the user. (in red) = support analysis, for example SNP when in the CpG mode. Not possible to analyze due to lack of data Variable positions are highlighted with a blue-gray background color The theoretical histogram is gray and positioned over the peaks. It is best viewed when zoomed in. Reference peaks are marked with blue diamonds over the peaks. For more information, see Histogram, page 17 Bisulfite treatment controls are marked with orange diamonds over the peaks and highlighted with a light yellow background color. For more information for CpG assays only, see Histogram, page 17. View histogram and/or reference peaks You can toggle between viewing and hiding the theoretical histogram or the reference peaks by right-clicking the Pyrogram area and selecting “Show Histogram” or “Show Reference Peaks” from the context menu. PyroMark Q24 Analysis Software User Guide 01/2009 37 Zoom Pyrogram It is possible to zoom in on Pyrogram by selecting a stretch of Pyrogram with the left mouse button. Zoom out either by right-clicking the Pyrogram area and selecting “Zoom Out” from the context menu (the zoom is set to the previous level), or by doubleclicking the Pyrogram area (the zoom is set to 100%). If comparing Pyrogram at the “Overview” tab (see Compare Pyrogram of Different Wells, page 33), Pyrogram with the same sequence to analyze can be zoomed simultaneously, i.e. linked zooming, by clicking in the top right corner of the Pyrogram area. View peak heights To view the height of a peak, position the mouse pointer over the top of the peak. A tooltip displays the height. Enable or disable reference peaks and controls Reference peaks and controls can be enabled or disabled (for CpG assays only) either in Pyrogram or in the histogram (at the “Analysis Setup” tab). For instructions, see Enable or Disable Reference Peaks and Controls in the Assay Setup, page 18. Note: If you wish to edit a selection of wells (that share the same assay and dispensation order), select the wells (see Select Wells, page 36) in the plate overview or navigator. Apply changes 1. To apply changes made in Pyrogram, click the green button. (This button is enabled when a change has been made.) 2. To apply changes made in the histogram at the “Analysis Setup” tab, click “Apply”. 3. In the “Apply Analysis Setup” dialog, either apply the changes to: All wells that share the same assay and dispensation order as the displayed well (i.e. all the white wells in the Apply Analysis Setup) or the selected wells (i.e. the white wells that are selected in the “Apply Analysis Setup” dialog) by clicking “To Selected”. Note: The changes can only be applied to wells that share the same assay and dispensation order as the displayed well. During the analysis a progress dialog is shown. This dialog contains a progress bar, a stop button, and the name of the well that is being analyzed. The analysis is stopped by clicking “Stop”. 38 PyroMark Q24 Analysis Software User Guide 01/2009 Note: All saved changes are logged. To view the analysis log for a selected well, select “Analysis Log” from the “Tools” menu. Edit quality assessments Quality assessments can be edited by left-clicking the analysis result (the allele frequencies or the methylation percentage) in Pyrogram and selecting “Passed”, “Check”, or “Failed” from the context menu. If a quality assessment has been edited by the user, this is displayed in , and in the Pyrogram by a border around the analysis result, for example plate overview or navigator by a black square in the well, for example . Note: All saved changes are logged. To view the analysis log for a selected well, select “Analysis Log” from the “Tools” menu. Export Pyrogram as image Pyrogram can be copied as an image to the clipboard by right-clicking the Pyrogram area and selecting “Copy as Image” from the context menu. The image can be pasted into applications that support Enhanced Metafile (EMF) images. Well information area The “Well Information” area shows the following information about an analyzed well that is selected in the plate overview or navigator: Well name Assay name Sample ID (if entered) Well note (if entered) Any analysis warnings. If several wells are selected in the plate overview or navigator, the information for the first selected well (the well with the orange selection frame) is shown. Note: Wells with a high substrate peak will be marked with an information icon ( ) in the plate overview. This will not affect the quality assessments. Analysis warnings An analysis warning affects the quality assessment for either all variable positions or a single position. If several warnings were triggered, only the most serious ones are displayed in the Well Information area. PyroMark Q24 Analysis Software User Guide 01/2009 39 For some of the warnings, the criteria for occurrence and the effect on the quality assessment can be modified by the user, see Analysis Parameters Tab, page 21. Note: If a dispensation warning is triggered, we recommend replacing the reagent cartridge. Reports PyroMark Q24 Software offers the following reports for processed runs: Reports menu for CpG runs Reports for AQ runs Analysis Statistics Report. This includes analysis statistics for all or selected wells. Analysis Results Report. This includes well information and analysis results for all or selected wells. Pyrogram Report. This includes well information and Pyrogram for all or selected wells. Full Report. This includes run parameters, run log, and well information and analysis results (including Pyrogram) for all or selected wells. SNP Overview Report. This includes genotypes and quality assessments for all SNPs. The information is presented in plate overviews with one plate per position number. Note: In order to view the Full Report, Pyrogram Report, and SNP Overview Report, you must have Adobe Acrobat Reader installed on your computer. Adobe Acrobat Reader is available on the PyroMark Q24 Software CD but can also be downloaded at www.adobe.com. 40 PyroMark Q24 Analysis Software User Guide 01/2009 Analysis statistics report The Analysis Statistics report includes the following statistics for variable positions with the same assay and position number, and (if desired) with the same sample ID, in all or selected wells (see Select Wells, page 36): The mean allele frequencies (AQ report) or mean methylation percentage (CpG report) The highest and the lowest allele frequencies (AQ report) or methylation percentage (CpG report) The standard deviation The number of values used in each calculation. The report can be saved as a text file (*.tsv or *.csv) or an HTML file (.html). The report can be imported into Microsoft Excel or other applications that can handle text files (*.tsv or *.csv) with data that is separated by semicolons (;) or tabs. This is useful when doing further calculations on the data. Report options In the “Analysis Statistics Report” dialog, there are the following options: All wells/selected wells The wells to be included in the report. Assay/assay and sample ID The analysis results (allele frequencies or methylation percentages) can be grouped according to: Assay, that is, results with the same assay will be compared Assay and sample ID, that is, results with the same assay and sample ID will be compared. (Can be useful when experiments with replicates are performed.) PyroMark Q24 Analysis Software User Guide 01/2009 41 Passed/check The analysis results to be included. The calculations can be performed on results with passed and/or check quality assessment. Note: If all passed and check results are included in the report (check the Passed and Check boxes), you can exclude results within this group by turning off the “Analyze” option for these positions at the “Analysis Setup” tab (see Variable Positions Tab, page 19). If you wish to view the report before you save or print it, click “Preview”. Analysis results report The Analysis Results report includes the following information for all or selected wells (see Select Wells, page 36): Well information (assay name, Sample ID, and, if desired, well note) The allele frequencies (AQ report), genotypes (SNP report), or methylation percentages (CpG report only) The mean methylation percentage and the standard deviation of all CpG sites (except for failed) in a well (CpG report only) The highest and the lowest methylation percentage in a well (CpG report only). Optional: The analysis version, the names of the variable positions, information on whether the quality assessments have been edited by the user or not, the original and/or the current quality assessments for the variable positions, and any analysis warnings. The report can be saved as a text file (*.tsv or *.csv) or an HTML file (.html). The report can be imported into Microsoft Excel or other applications that can handle text files (*.tsv or *.csv) with data that is separated by semicolons (;) or tabs. This is useful when doing further calculations on the data. The first line in the report states the name of the run. The following two or three lines contain the column headings. Each of the lines following the column headings contains detailed well information and statistics of a specified well. 42 PyroMark Q24 Analysis Software User Guide 01/2009 Report options In the “Analysis Results Report” dialog, there are the following options: All wells/selected wells The results to be included in the report. Row/column The sorting order of the wells. Note column If this option is checked, a column with well notes is included. Warning columns If this option is checked, a column with any analysis warnings is included. Analysis version column If this option is checked, a column with the analysis version is included. Position name columns If this option is checked, a column with the names of the variable positions is included. Original quality columns If this option is checked, a column with the original quality assessments (for the variable positions) is included. Quality columns If this option is checked, a column with the current quality assessments (for the variable positions) is included. Edited quality columns If this option is checked, a column with information on whether the current quality assessments (for the variable positions) have been edited by the user (Yes) or not (-) is included. If you wish to view the report before you save or print it, click “Preview”. PyroMark Q24 Analysis Software User Guide 01/2009 43 Pyrogram report The Pyrogram report includes well information (assay name, sample ID, and well note) and Pyrogram for all or selected wells (see Select Wells, page 36). The following information, icons, and colors are displayed and used in the Pyrogram area: The well name and the sequence to analyze are shown in the upper left corner The analysis result — allele frequencies (AQ report), genotypes (SNP report), or methylation percentages (CpG report) — is displayed above . The background color shows the each variable position, for example quality assessment of the analysis result; see the Color Legend section Note: = Deselected by the user. (in white)= The software does not (in red) = support analysis, for example SNP when in the CpG mode. Not possible to analyze due to lack of data Bisulfite treatment controls are highlighted with a light yellow background color If desired, the variable positions are highlighted with a blue-gray background color. Report options In the Pyrogram Report dialog, you have the following options: All wells/ Selected wells The wells to be included in the report. Number of rows/columns The number of columns and rows of Pyrogram on each sheet. Sort by row/column The sorting order of the wells. Portrait/landscape The paper orientation. Highlight variable regions If this option is checked, the variable regions are highlighted with a blue-gray background color. Paper size The paper size. If you wish to view the report before you save or print it, click “Preview”. 44 PyroMark Q24 Analysis Software User Guide 01/2009 Note: In order to view the report, you must have Adobe Acrobat Reader installed on your computer. Adobe Acrobat Reader is available on the PyroMark Q24 Software CD but can also be downloaded at www.adobe.com. Full report The Full report includes the following information for or all or selected wells (see Select Wells, page 36): Run parameters (run name, run date and time, instrument method, operator, plate ID, barcode, reagent ID, and run note) and a run log Information on whether the analysis settings have been changed by the user or not. Wells with changed analysis settings are listed Well information (assay name, Sample ID, and well note), analysis version, and sequence to analyze Analysis results for all or selected wells: Pyrogram. For information on icons and colors used in the Pyrogram area (see Pyrogram Report, page 44) The allele frequencies (AQ report), genotypes (SNP report), or methylation percentages (CpG report), and the quality assessments for the variable positions The mean methylation percentage of all CpG sites (except failed) in the well (CpG report) Any analysis warnings Report options In the “Full Report” dialog, you can select the wells to be included in the report, “All wells” or “Selected wells”. If you wish to view the report before you save or print it, click “Preview”. Note: In order to view the report, you must have Adobe Acrobat Reader installed on your computer. Adobe Acrobat Reader is available on the PyroMark Q24 Software CD but can also be downloaded at www.adobe.com. PyroMark Q24 Analysis Software User Guide 01/2009 45 SNP overview report The SNP Overview report includes genotypes and quality assessments for all SNPs. The information is presented in plate overviews with one plate per position number. The background color of the wells shows the quality assessment of the SNP; see Color Legend, page 35. Extract from a report. The Analyze option has been turned off for position 5 in well B1. Well B2–B3 and B7–B8 have no SNPs in position 5. Note: Variable positions can be excluded from the report by turning off the “Analyze” option at the “Analysis Setup” tab (see Analysis Setup Tab, page 34). Note: The SNP Overview report is only available when in the AQ mode. In order to view the report, you must have Adobe Acrobat Reader installed on your computer. Adobe Acrobat Reader is available on the PyroMark Q24 Software CD but can also be downloaded at www.adobe.com. 46 PyroMark Q24 Analysis Software User Guide 01/2009 Manage Instrument Methods The instrument method shall be selected according to the reagents and reagent cartridge that will be used for the run; see the instructions supplied with the products. Note: We recommend that only methods supplied by QIAGEN are used. To import a new method: 1. In the “Instrument Methods” dialog, click “Import”. The “Find Instrument Method” dialog appears. 2. Locate and select the method that you wish to import and click “Open”. To create a new method: 1. In the “Instrument Method” dialog, select an existing method and click “Save As”. 2. Enter a name for the method and press “Enter”. 3. Change the settings and click “Save”. Method parameters In the “Instrument Methods” dialog, the following parameters are available: Reagent pressure Pressure (millibar) during dispensation of the enzyme mix and substrate mix. Enzyme pulse time Dispensation time (milliseconds) for the enzyme mix. Substrate pulse time Dispensation time (milliseconds) for the substrate mix. Nucleotide pressure Pressure (millibar) during the dispensation of nucleotides. Nucleotide pulse time Dispensation time (milliseconds) for nucleotides. Note Optional: Note on the instrument method. PyroMark Q24 Analysis Software User Guide 01/2009 47 Troubleshooting Guide This troubleshooting guide may be helpful in solving any problems that may arise. For more information, see also the Frequently Asked Questions page at our Technical Support Center: www.qiagen.com/FAQ/FAQList.aspx. The scientists in QIAGEN Technical Services are always happy to answer any questions you may have about either the information and protocols in this handbook or sample and assay technologies (for contact information, see back cover or visit www.qiagen.com). Comments and suggestions Analysis software-related errors a) Red cross over wells in the “Overview” tab during analysis Contact QIAGEN Technical Services. b) “Exception” dialog appears Save the error report and send to QIAGEN Technical Services for information. Click “Continue” to proceed with analysis. If the dialog remains, click “Quit” and reopen the run. c) Could not create assay from specified “Pyrosequencing Assay Design Software” file Ensure a valid assay file type is being imported. References QIAGEN maintains a large, up-to-date online database of scientific publications utilizing QIAGEN products. Comprehensive search options allow you to find the articles you need, either by a simple keyword search or by specifying the application, research area, title, etc. For a complete list of references, visit the QIAGEN Reference Database online at www.qiagen.com/RefDB/search.asp or contact QIAGEN Technical Services or your local distributor. 48 PyroMark Q24 Analysis Software User Guide 01/2009 Notes PyroMark Q24 Analysis Software User Guide 01/2009 49 Notes 50 PyroMark Q24 Analysis Software User Guide 01/2009 Trademarks: QIAGEN®, Pyrogram®, Pyrosequencing® (QIAGEN Group). Limited License Agreement Use of this product signifies the agreement of any purchaser or user of the PyroMark Q24 to the following terms: 1. The PyroMark Q24 Analysis Software may be used solely in accordance with the PyroMark Q24 Analysis Software User Guide and for use with components contained with the Software only. QIAGEN grants no license under any of its intellectual property to use or incorporate the enclosed components of this Software with any components not included within this Software except as described in the PyroMark Q24 User Guide and additional protocols available at www.qiagen.com. 2. Other than expressly stated licenses, QIAGEN makes no warranty that this Software and/or its use(s) do not infringe the rights of third-parties. 3. This Software and its components are licensed for one-time use and may not be reused, refurbished, or resold. 4. QIAGEN specifically disclaims any other licenses, expressed or implied other than those expressly stated. 5. The purchaser and user of the Software agree not to take or permit anyone else to take any steps that could lead to or facilitate any acts prohibited above. QIAGEN may enforce the prohibitions of this Limited License Agreement in any Court, and shall recover all its investigative and Court costs, including attorney fees, in any action to enforce this Limited License Agreement or any of its intellectual property rights relating to the Software and/or its components. For updated license terms, see www.qiagen.com. © 2009 QIAGEN, all rights reserved. www.qiagen.com Australia Orders 03-9840-9800 Fax 03-9840-9888 Technical 1-800-243-066 Austria Orders 0800/28-10-10 Fax 0800/28-10-19 Technical 0800/28-10-11 Belgium Orders 0800-79612 Fax 0800-79611 Technical 0800-79556 Brazil Orders 0800-557779 Fax 55-11-5079-4001 Technical 0800-557779 Canada Orders 800-572-9613 Fax 800-713-5951 Technical 800-DNA-PREP (800-362-7737) China Orders 0086-21-3865-3865 Fax 0086-21-3865-3965 Technical 800-988-0325, 800-988-0327 Denmark Orders 80-885945 Fax 80-885944 Technical 80-885942 Finland Orders 0800-914416 Fax 0800-914415 Technical 0800-914413 France Orders 01-60-920-926 Fax 01-60-920-925 Technical 01-60-920-930 Offers 01-60-920-928 Germany Orders 02103-29-12000 Fax 02103-29-22000 Technical 02103-29-12400 Hong Kong Orders 800 933 965 Fax 800 930 439 Technical 800 930 425 Ireland Orders 1800 555 049 Fax 1800 555 048 Technical 1800 555 061 Italy Orders 02-33430-420 Fax 02-33430-426 Technical 800-787980 Japan Telephone 03-6890-7300 Fax 03-5547-0818 Technical 03-6890-7300 Korea (South) Orders 1544 7145 Fax 1544 7146 Technical 1544 7145 Luxembourg Orders 8002-2076 Fax 8002-2073 Technical 8002-2067 Mexico Orders 01-800-7742-639 Fax 01-800-1122-330 Technical 01-800-7742-639 The Netherlands Orders 0800-0229592 Fax 0800-0229593 Technical 0800-0229602 Norway Orders 800-18859 Fax 800-18817 Technical 800-18712 Singapore Orders 65-67775366 Fax 65-67785177 Technical 65-67775366 Spain Orders 91-630-7050 Fax 91-630-5145 Technical 91-630-7050 Sweden Orders 020-790282 Fax 020-790582 Technical 020-798328 Switzerland Orders 055-254-22-11 Fax 055-254-22-13 Technical 055-254-22-12 UK Orders 01293-422-911 Fax 01293-422-922 Technical 01293-422-999 USA Orders 800-426-8157 Fax 800-718-2056 Technical 800-DNA-PREP (800-362-7737) 1055455 01/2009 Sample & Assay Technologies