1
DESURBS Deliverable 4.7: User manuals for the
WP4 supporting tools
Project full title: ‘Designing Safer Urban Spaces’
Grant agreement no.: 261652
Lead beneficiary for Deliverable 4.7: Research Management
Dissemination level: Public
Expected delivery date: Month 44
Authors: M. Turner, E. Persov, Y. Weitz, H. Fleishman, E. Lederman, D. Shach-Pinsly, T. Ganor, N.
Marom, M. Gutman, D. Glazman, H. Spaander, I. Shleifer, H. Ilani, I. Raizberg, T. Niv, R. Singer, Y.
Cohen, R. Ben Shimol (Bezalel Academy); D. Felsenstein, Y. Grinberger, N. Shoval, A. Birenboim
(HUJI); G. Exadaktylos (TUC); F. Zárate, A. Barbat (CIMNE)
Actual delivery date: End of project
This project has received funding from the European Union’s Seventh Framework Programme for research,
technological development and demonstration under grant agreement no 261652
DESURBS Deliverable 4.7: User manuals for the DESURBS supporting tools
Table of Contents
1.
Introduction ..................................................................................................................................... 3
2. New industrial design security products (Bezalel Academy)............................................................... 3
2.1 HopeSpot balloon .................................................................................................................. 3
2.2 CityZen ................................................................................................................................. 10
2.3 CityTalk ................................................................................................................................ 22
2.4 Urban Resilient Design Guidelines ...................................................................................... 25
3. DySTUrbD (HUJI) ................................................................................................................................ 31
4. SensoMeter (HUJI) ............................................................................................................................ 40
5. STREMA-DB & FCMODEL(TUC) .......................................................................................................... 56
6. Vulnerability of structures database, blast and earthquake (CIMNE)............................................... 72
7.
Conclusion ..................................................................................................................................... 73
FP7 Grant agreement no.: 261652
DESURBS Deliverable 4.7: User manuals for the DESURBS supporting tools
1. Introduction
This report accompanies the comprehensive supporting tool package which is Deliverable 4.7 of
the FP7 Security Program research project ‘Designing Safer Urban Spaces’ (DESURBS, Grant
Agreement no. 261652). The purpose of this report is to provide short user manuals for each of
the supporting tools that have been developed in WP4.
2. New industrial design security products (Bezalel Academy)
The background and DESURBS advances in new industrial design security products are reported
in D4.1
2.1 HopeSpot balloon
Scope and Purpose
The HopeSpot's objective is to provide an efficient, cost-effective, accessible and portable
product to ease communication challenges with crowds. It was designed as a flexible
component of the supporting auxiliary infrastructure with uses during emergency and planned
scenarios.
Hope Spot creates a mark in the sky, pointing survivors of large-scale disasters to places where
they can get aid, or alternatively be used during planned events, such as marathons and
concerts, to point out first aid locations.
For examples please see the HopeSpot clip- http://vimeo.com/94975469
The HopeSpot’s helium inflated balloon is set aloft to a height of up to 50 meters or according to
local aviation rules, and is capable to reach height of 300 meters or more.
It has a distinct hue that is visible in daytime, in the last prototype test reached daytime
effective viability of up to 300 meters; while at nighttime LED lighted cable points toward the
ground with effective visibility of up to five kilometers.
The HopeSpot balloon has been developed into a prototype, and was tested during the 2014
Jerusalem Marathon.
FP7 Grant agreement no.: 261652
DESURBS Deliverable 4.7: User manuals for the DESURBS supporting tools
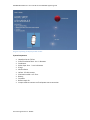
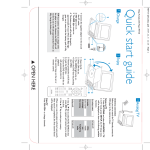
Diagram explaining the HopeSpot LED module
System Components
HopeSpot Carrier-70 liter
Ground insulation fabric -4 m. in diameter
Carabineers
Kevlar Rope-10 m. 2 mm in diameter
4 Pegs
Wind indicator
Helium -3.5 cubic meters
Illumination cable + roll- 50 m.
Battery
Controller
Balloon repair kit
Jumper cables to connect to a fixed power source connection
FP7 Grant agreement no.: 261652
DESURBS Deliverable 4.7: User manuals for the DESURBS supporting tools
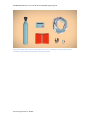
Illustrative image of the system components in the carrier, including: Ground insulation fabric,
Carabineer, Pegs, Helium, Illumination cable and Controller
FP7 Grant agreement no.: 261652
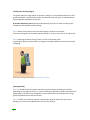
[Folding and Launching Stages]
The system requires a single person to operate it, though it is recommended that two or three
people participate in launching the system. One practice session per year is recommended to
improve operator capabilities in real time.
A periodic competency test should be performed every 6 months to make sure that system
components are complete and functioning
2.1.2.1 Helium tank pressure test: the pressure gauge is under the tank nozzle
An arrow on the green zone indicates optimal pressure / arrow on the red area - low pressure)
2.1.2.2 Checking the battery charge: There is an LED on the battery pack.
A green light indicates that the battery is charged / a red light indicates that the battery needs
recharging.
Illustrative image showing the HopeSpot Carrier
[Getting Started]
2.1.3.1.1 Choose the launch location; the optimal launch location should be pre-selected
depending on the usage scenario (i.e. in case of flooding the HopeSpot should be launched from
high ground, in the event of an earthquake an open space that can provide space for a large
group should be chosen as the launch spot).
2.1.3.1.2 Make sure the launch location is positioned at least 50 meters from the nearest
building; you can launch the Balloon from the roof of a building.
6
2.1.3.1.3 Clear a 3 m. radius from sharp objects that could endanger the HopeSpot balloon
during the launch
[Launching Sequence]
2.1.4.1.1 Place the HopeSpot carrier on the ground
2.1.4.1.2 Remove the ground insulation fabric and spread it on the ground and anchor with
stones, soil or sand.
2.1.4.1.3 Place the HopeSpot launch kit on the defined area on the ground insulation fabric.
2.1.4.1.4 Harness the carrier to the ground with additional weight (i.e. stones) to further anchor
the system in the specified area stitched at the bottom using pegs or tie it using the rope and
the pegs.
2.1.4.1.5 Place the balloon valve over the helium tank nozzle.
2.1.4.1.6 Release the helium and inflate the balloon.
2.1.4.1.7 Return the empty helium container to its designated cell in the carrier.
2.1.4.1.8 Launch the balloon into the air use the drum to control the cable release.
2.1.4.1.9 Operate the illumination using a dedicated button located on the controller panel (flip
up).
2.1.4.1.10 Close the carrier while checking that the helium tank is inside and the illumination
cable emerges from a dedicated hatch in the carrier.
If the option is available it is preferable to attach the carrier to a permanent power source
with a dedicated connector.
7
Illustrative image showing the launched HopeSpot prototype
[Folding Sequence]
2.1.5.1.1 Open the carrier.
2.1.5.1.2 Shutdown the lighting system on the illumination cable using the power switch (flip
down).
2.1.5.1.3 Roll up the illumination cable with help of the rolling drum until the balloon is 2 meters
from the ground.
2.1.5.1.4 Release the helium from the balloon using the dedicated valve; ensure that all the
helium has exited the balloon.
2.1.5.1.5 Disconnect the balloon from the illumination cable, fold the balloon and return it to its
dedicated cell in the carrier.
2.1.5.1.6 Release the carrier from its ground harness (stones, stakes or rope).
2.1.5.1.7 Fold the harnessing equipment into the carrier.
2.1.5.1.8 Folding the ground insulation fabric into the carrier.
2.1.5.1.9 Closing the carrier and remove it from the site.
8
[Maintaining System Capabilities]
2.1.6.1.1 Spread all system components outside the carrier.
2.1.6.1.2 Remove dirt and debris from the system components (thorns, mud, sticks).
2.1.6.1.3 Replace or fill the tank of helium (pressure gauge should indicate green).
2.1.6.1.4 Charge the battery (Green LED light).
2.1.6.1.5 Operate the illumination cable and make sure that all the lights are working.
2.1.6.1.6 Roll the cable onto the drum.
2.1.6.1.7 Fill the Helium balloon with clean air and check that there is no loss of air for a period
of two days.
2.1.6.1.8 Fold the balloon into its designated cell in the carrier.
9
2.2 CityZen
Scope and Purpose
Many resources are currently utilized to ensure our cities are kept clean, safe and well
functioning. The authorities’ ability to maintain safety and order relies heavily on gathering and
analyzing of real time information of ongoing occurrences in the urban environment. The ability
to respond quickly and efficiently is very much reliant on the capability to receive accurate and
relevant information fast. However, even the most advanced solutions, such as CCTV networks
and smart image analysis software, are unable to capture and understand all the relevant data
from around the city at all times and there is a true need for additional solutions.
Today, at a time when so many of us possess wireless, GPS enabled smart devices featuring high
definition cameras, the use of this prevalent technology can aid in creating a solution.
The background of the idea behind CityZen is to create a platform that will allow citizens and
authorities to cooperate in order to improve the safety and quality of their environment. The
goal of the CityZen service is to provide both authorities and citizens alike with a full and
accurate picture regarding issues of safety and security, transmit instant messages from the
citizens to the authorities and back, both in routine and emergency times and t thus strengthen
the connection between citizens and their city.
View the CityZen clip http://vimeo.com/94975467
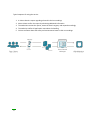
Process Overview
CityZen offers a free GPS enabled mobile application for urban citizens, featuring real-time
reporting on one hand and a back-end monitoring cloud software for the authorities’ use on the
other.
The CityZen application is community-driven; users can report accidents, security hazards,
disturbances and disasters and follow events reported by others around their location. Users are
encouraged to provide feedback for other reports and are updated about events handled by the
authorities.
The CityZen mobile application displays a map of the city to the user allowing him\her to report
hazards and security issues to different authorities using location services, voice, and imagery. In
addition, the user is able to view and comment on other user's reports.
The CityZen monitoring portal allows the authorities to receive and track the reports made by
citizens in real time, change the status of their handling and post messages to all the application
users in close proximity.
This project has received funding from the European Union’s Seventh Framework Programme for research,
technological development and demonstration under grant agreement no 261652
Typical sequence for using the service:
1. A citizen submits a report regarding a hazard in their surroundings
2. More citizens confirm the report by submitting additional information
3. The authorities receive the reports, assess the event's urgency and respond accordingly
4. The authority notifies all application users about the handling
5. Citizens are aware about the safety and environmental status in their surroundings
11
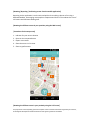
[Browsing /Reporting / Confirming events from the mobile application]
Reporting via the application is much easier and quicker than making a phone call or using a
dedicated website, encouraging more people to cooperate and share. It also reduces the cost of
call centers and eliminates waiting time.
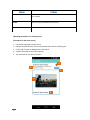
[Browsing the different events in your proximity using the MAP screen]
[Procedures for the map screen]
1. Indicator for your current location
2. Open to view a reported event
3. Report a new event
4. Show the events in a list view
5. Show my performance
4
5
1
2
3
[Browsing the different event in your proximity using the LIST screen]
This project has received funding from the European Union’s Seventh Framework Programme for research,
technological development and demonstration under grant agreement no 261652
[Procedures for the list screen]
1. Information regarding a specific event
2. Indicator about how many citizens reported the event and in what the handling state is
3. Confirming an event by adding additional information
4. Show events in map view
5. Show my performance
4
1
5
2
3
13
Indicator
Definition
Red
The event has been received on the authorities side but has not yet
been handled
Yellow
The event is being handled by the authorities
Green
The event has been handled by the authorities
[Watching the details of an existing event]
[Procedures for the event screen]
1. Information regarding a specific event
2. Indicator about how many citizens reported the event and the handling state
3. Confirming an event by adding further information
4. A photo submitted by one of the reporters
5. Text submitted by one of the reporters
2
1
3
4
5
14
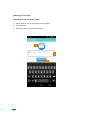
[Submitting a new report]
[Procedures for the new report screen]
1. Take a photo or pick an existing one from the gallery
2. Text input field
3. Submit the report to the local authorities
1
2
3
15
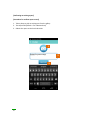
[Confirming an existing report]
[Procedures for confirm report screen]
1. Take a photo or pick an existing one from the gallery
2. Text input field [default = first submitted text]
3. Submit the report to the local authorities
1
2
3
16
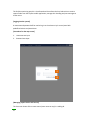
[Personal profile]
[Procedures for the personal profile screen]
1. The city to which the user is currently reporting
2. Number of reports the user submitted
3. Number of confirms the user contributed to existing reports
1
2
3
[Managing reports from the monitoring portal]
17
The CityZen monitoring portal is a cloud-based tool that allows the local authorities to receive
reports made from the CityZen mobile application, manage their handling and post messages to
civilian users.
[Logging into the system]
A username and password will be used to log in to the relevant city's control panel with
predefined actions and permissions.
[Procedures for the map screen]
1.
Username text input
2.
Password text input
1
2
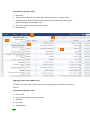
[Managing reports via the LIST screen]
The list screen shows all the recent events (most recent on top) in a table grid.
18
[Procedures for the map screen]
1. Event Feed
2. Table of events featuring: Time, Event type, Address, Number of reporters, Status
3. Navigation panel: allows to switch between the list and the map screens and to post a
general message to all application users
4. Filter menu: selects certain reports to be shown
5. Refresh button
3
4
1
5
2
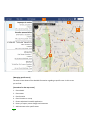
[Managing reports via the MAP screen]
The map screen shows all the recent events over a map with graphic indicators to mark their
location.
[Procedures for the map screen]
1. Event's Feed
2. City map with indicators of the local events
3. Date filter
4. Hour filter
5. Refresh button
19
3
4
1
5
2
[Managing specific event]
The event screen shows all the detailed information regarding a specific event. In this screen
you can find :
[Procedures for the map screen]
1. Event details
2. Event status
3. Event location
4. Event' location on a map
5. Photos submitted via mobile application
6. History of reports, status changes and comments
7. Add comment to the specific event
20
1
2
3
5
4
6
7
21
2.3 CityTalk
CityTalk is an elderly inclusive web-based communication platform, serving as a bridge between
urban planners and the community.
City resilience relies first and foremost on the safety, security and quality of life of its
inhabitants. The ability to construct such a city depends on understanding the needs, wishes and
difficulties of the people who live in it. The rise in percentage of elderly as part of the
population, combined with the many challenges posed to them by city life, require paying
special attention to their needs in the process of urban planning.
The aim of the CityTalk project is to examine the city through the perspective of the elderly in
order to be able to provide real solutions to issues revealed by qualitative research.
At this stage CityTalk has completed a comprehensive research stage and presents a conceptual
framework and mockup product for the next phase of development and programming.
The research covered the following:
Theoretical Context, The Aging Process, Physiological Changes, Social Changes, Cognitive
Changes, A cognitive interplay of Transitions, Aging Well ,Successful Aging , Active Aging,
Behavior Modification , Behavior Modification Through Design, Behavior Modification in the
Urban Context, Public Participation in Urban Planning, Public Participation , Principles and
Methods, Public Participation in Israel, Technology and the Elderly, Technology and Old Age and
Accessibility Guidelines.
22
[CityTalk Communication Platform]
CityTalk is a web-based communication platform between the urban planner and the
community. It consists of an interface for the community and an interface for the urban
planners, or the community worker operating the platform.
The Community Interface
The community interface provides 3 basic functionality options for the user.
The first one includes viewing of building projects in proximity to user.
The second option allows one to answer questionnaires sent out by urban planners,
providing an opportunity to participate in setting priorities for spatial planning.
The third function provides a place for expressing and sharing thoughts regarding the
built environment allowing the community to interact and communicate and perhaps
raise the public's awareness to issues needing attention.
Accessibility features include:
use of high contrasting colors,
color differentiation between functions,
text sixe,
stable and consistent use of site structure,
constantly visible menu for easy navigation,
an option for changing the language and transferability of the interface to different
media platforms.
Community interface of CityTalk
This project has received funding from the European Union’s Seventh Framework Programme for research,
technological development and demonstration under grant agreement no 261652
The facilitator interface
The facilitator interface allows for two primary functions.
The first one includes uploading of new projects
The second includes viewing and editing of ongoing projects.
Each of these two basic functions provides further options for the planners.
The 'Upload a new project' functionality gives the facilitator access to demographic
information from the area, allows him to access demographic relevant planning manuals
and supplies him with a tool to form a questionnaire or to choose one from a list of
templates in the program.
The 'edit and view existing projects' functionality, allows the facilitator to view results of
questionnaires, update projects status, and respond to projects comments.
The facilitator interface is built to ensure easy and intuitive operation of the site by the user.
This is done by providing a basic template the facilitator must fill in when uploading project.
Images can be dragged into location and text can be typed straight into specified text box. This
user friendliness is crucial if one doesn't want project to fail due usability problems on the
planners end.
Facilitator interface of CityTalk
24
2.4 Urban Resilient Design Guidelines
Scope and Purpose
The Urban Resilient Design Guidelines (URDG) is a manual produced in paper and pdf formats
that aims to highlight various types of information available to support resilient planning and
stress the importance of analyzing different data layers to create a comprehensive picture of the
existing situation. The URGD details a number of outputs from the DESURBS project and makes
recommendations for optimal use of new industrial design security products in the mapping
process.
The URDG proposes a GIS (Geographical Information System) based method with layers
that apply the Integrated Security and Resilience (ISR) design framework to identify
vulnerabilities and improve urban spaces through a stage-by-stage process.
The combination of layers and information is essential for understanding the evolving
urban space in greater detail, helping planners and stakeholders map vulnerabilities and
design options as part of the statutory process.
The URDG promotes secure urban design and planning, generating awareness regarding the
impact of different urban phenomena on urban resilience ( see clip-www.vimeo.com/93713153)
. The guidelines showcase several incidents, explains how to apply GIS (Geograpgic Information
Systems) in order to analyze them and assess the vulnerability, and suggests industrial design
products developed especially for the DesUrbs project that are available to aid in both
preparedness and mitigation. A basic understanding of GIS is needed to use the guidelines and
create the maps.
Process Overview
The URDG proposes a framework to help cope with risk preparedness.
The Bezalel DESURBS team has developed a number of innovative products that contribute to
the creation of safer urban environments, including the HopeSpot Balloon, CityZen and CityTalk:
these tools address a wide range of possible events (crime, terror, accidents, natural disasters
and inclusive planning) that threaten the urban populations and environments. These tools were
designed to aid in creating and maintaining safe spaces on a daily basis and during emergency
events.
At a site-specific level of planning, once the recommended layers for resilient design have been
collected the ISR (Integrated Security & Resilience) stages provide a framework for analyzing the
mapping data and decision-making. The ISR process helps identify urban vulnerabilities and
improve urban spaces with respect to security threats.
The ISR framework stems from the literature reviews and data collection/analysis that have
been undertaken over the duration of the project. The international risk management standard
ISO 31000 ‘Risk management – Principles and guidelines ‘ (British Standards Institution, 2011;
2009) presents four stages, those being risk
25
identification, assessment, evaluation, and treatment. In the ISR framework, ‘treatment’ has
been expanded into two stages, to aid end users to ‘identify’ what measures can be used, and to
‘prioritise’ them in relation to their effectiveness (see Bosher, 2014).
The maps created will show the planner and decision-makers strengths and vulnerabilities in the
vicinity and potential long-range impacts. Using these tools planners and decision makers can
reach better-informed conclusions for management the economic, social and environmental
implications during both routine and emergency events.
ISR Stage
1 Identify, characterize,
and assess
hazards/threats
2 Assess the vulnerability
of urban spaces to
specific hazards/threats
3 Determine the risk (i.e.
the expected
consequences of specific
hazards/threats on
specific assets)
4 Identify ways to reduce
those risks
5 Prioritise risk reduction
measures
26
Descriptor
Hazard/Threat identification – the process of finding, recognising and describing hazards/threats to which the space is
exposed.
Hazard/Threat identification involves the identification of:
Type of hazard/threat
The events/circumstances when the hazard/threat is prevalent
Their causes
Their potential consequences
It involves:
Assessing historical data,
theoretical analysis,
seeking informed and expert opinions, and
understanding stakeholders’ needs.
Vulnerability assessment is the process of assessing the susceptibility of the intrinsic properties (the structure, materials,
construction and planning) to a hazard/threat that can lead to an event with a consequence
Identifying the level of risk - magnitude of a risk or combination of risks, expressed in terms of the combination of the
likelihood (chance of something happening) and the impact (consequences) of an incident caused by that hazard/threat.
It utilises a Risk Matrix as a tool for ranking and displaying risks by defining ranges for consequence and likelihood
1. Inherent safety (eliminate the
possibility of hazards/threats
occurring)
2. Prevention (reduce the
likelihood of hazards/threats)
3. Detection (measures for early
warning of hazards/threats)
4. Control (limiting the size of
the hazards/threats)
5. Mitigation (protection from
the effects of hazards/threats)
6. Emergency response
(planning for evacuation and
access for emergency services)
Identifying (and prioritising) a course of action to address and treat the
hazard/threat and its associated risks. Treatment can involve:
avoiding the risk by deciding not to start or continue with the activity that gives rise
to the risk;
removing the hazard/threat source;
changing the likelihood or magnitude;
changing the consequences;
protecting assets/spaces from the effects of the risk
preparedness planning for the impacts of risks (events)
sharing the risk with another party or parties [including contracts and risk
financing]; and
retaining the risk by informed decision making
[Mapping for Resilience]
In order to begin the mapping process GIS (Geographic Information Systems) software is
needed. GIS is a comprehensive and widely available tool that allows users to use a single
database and perform a wide range of activities- including mapping, modeling and analysis.
[Access GIS]
In the event that you do not have permanent access to GIS, it is possible to access a free trial for
the leading software for most government agencies.
http://www.esri.com/software/arcgis/arcgisonline/evaluate.
Free open source software is also available, such as Grassgis, Qgis and more.
[Collect Layers of Data for Resilient Design]
The first step towards mapping for resilience is to collect data from different departments that
can aid in creating a comprehensive spatial analysis that can serve as the basis for future designs
and plans. Instead of planning solely for the population or a single issue you can plan for a
number of factors and thus provide wider address to the city and the community, as integrating
behavioral information can provide knowledge for resilience.
Examples of Layers for Resilient Design:
• Geo-morphology – Earthquakes, Tsunami prone areas, Mudslides, Flood plains.
• Areas of management of Police, Health Institutions and Fire Brigades
• Street Crime, Car Theft
• Land uses
• Public Events Venues
Transport
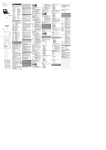
Data for maps should be formatted either in a GIS format or an excel tables. GIS formats include
.SHP and .GDB files. Excel tables can be appended to the GIS data using various tools including
union, append and join. It is recommended that while creating the tables to include a column
identical to the GIS data so that the joining will be easier.
27
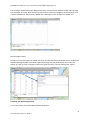
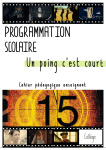
Example: Layers of information superimposed
28
[Types of Data]
For linear data, a street name or code can be used in the tabular data, i.e. routes closed
for parades need to have the exact street code used in the municipal GIS system.
For point data such as police barriers or water distribution points it is advised to use x,y
coordinates or a street address (street number and entrance). For polygon data one can
use the building ID or x,y of centroid. In this manner it is easier to fill out a table with
local data and information and afterwards to include it in the GIS and use the data in
map creating.
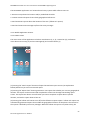
Example: Collecting and Using GIS Data sourced from the DesUrbs CityZen App
Within these definitions, we can also add information collected from residents and not solely
from official stakeholders. The DESURBS CityZen application, an image and GPS reporting
Smartphone application for two way communication between citizens and the authorities, can
collect x,y coordinates from live reports made by residents or visitors who provide real time
information regarding problems areas in the city. These reports can be compiled into a
comprehensive database that can be used to spot recurring events and identify vulnerability
trends.
After the various layers are set within a central database, the layers should be compiled into a
single map.
Putting too much information in one map can distort and warp the perception of urban
life and become visually disorienting. Therefore each layer should also be visualized in
separate maps. The result will feature many maps that display the data from each layer
along with other maps that displays all the layers together, super positioned one on top
of the other in the same color but in a semi-transparent manner so that areas which will
eventually seem opaque are actually the areas in which many semi-transparent urban
features are flagged as problematic.
The opaque areas will help identify vulnerable perimeters which stakeholders should
consider when they are dealing with future planning opportunities. After the main map
is drawn, stakeholders should examine it and determine whether their information has
affected the aggregated map.
Stakeholders should check if their information contributed to the general overview or if
local professional knowledge remained unexploited.
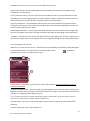
There are different types of GIS analyses that can be utilized on this type of map. Firstly
the most opaque areas should be digitized and transformed into a stand-alone layer.
This layer needs to be analyzed so that urban features identified within these
perimeters are taken into account in future planning programs.
29
For more information on Spatial Analyses visit: http://www.esri.com/products/technology-topics/spatialanalysis
Example of Data Analysis Sourced from CityZen
For optimal accuracy every stakeholder must be responsible for keeping their data up to date. It
is crucial to mention when the data was processed and collected to ensure that the maps
produced have optimal accuracy. There are three indicators for data quality that should be
considered: reliability, precision/ scale and sourc
30
3. DySTUrbD (HUJI)
The background and DESURBS advances for the DySTUrbD urban catastrophe management
simulation tool are reported in Deliverables 4.2, 4.3 and 4.4. The complete DySTUrbD user manual
can also be found in the appendix section at the end of Deliverables 4.2, 4.3 and 4.4.
Downloading, installing and running a model
In order to run a model, perform the following steps:
I.
II.
III.
IV.
V.
VI.
VII.
Download the ‘Repast Simphony 2.0’ suite by clicking the appropriate link on the portal.
Install Repast Simphony 2.0 on your computer by double clicking on the downloaded file and
following the installation instructions.
Download the desired model by clicking the appropriate link on the portal.
Uncompress the downloaded file, no specific location is required.
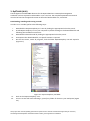
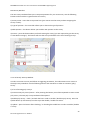
On the start menu, under all programs, find the folder RepastSimphony-2.0 and expand it
(Figure 2.1).
Figure 3.1. Repast Simphony 2.0 folder.
Click on the ‘Repast Simphony’ icon.
An intro screen will load. Following it, specify any folder of choice as your workspace (Figure
3.2).
This project has received funding from the European Union’s Seventh Framework Programme for research,
technological development and demonstration under grant agreement no 261652
DESURBS Deliverable 4.7: User manuals for the DESURBS supporting tools
Figure 3.2. Specifying a workspace folder.
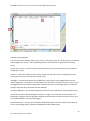
VIII.
On first use, the Eclipse SDK loads with no imported models (Figure 3.3). When specifying a
previously-used workspace, all models are imported along with their settings.
Figure 3.3. The Eclipse SDK interface.
IX.
Choose ‘Import…’ on the ‘File’ menu (Figure 3.4).
32
FP7 Grant agreement no.: 261652
DESURBS Deliverable 4.7: User manuals for the DESURBS supporting tools
X.
Figure 3.4. Importing a model.
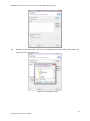
Expand the ‘General’ folder on the Import screen. Choose ‘Existing Projects into Workspace’
and press ‘Next’ (Figure 3.5).
Figure 3.5. Importing an existing project.
XI.
Select ‘Browse…’ on the next screen (Figure 3.6).
33
FP7 Grant agreement no.: 261652
DESURBS Deliverable 4.7: User manuals for the DESURBS supporting tools
XII.
Figure 3.6. Locating the models.
Navigate to the folder where you have uncompressed the downloaded model. Select this
folder and press ‘OK’ (Figure 3.7).
Figure 3.7. Locating the model.
34
FP7 Grant agreement no.: 261652
DESURBS Deliverable 4.7: User manuals for the DESURBS supporting tools
XIII.
XIV.
All models located in this folder are automatically identified. After checking the model(s) to
import press ‘Finish’ (Figure 3.8).
Figure 3.8. Selecting a model to import.
All imported models appear on the left side of the interface (Figure 3.9).
Figure 3.9. Eclipse SDK interface, including imported models.
35
FP7 Grant agreement no.: 261652
DESURBS Deliverable 4.7: User manuals for the DESURBS supporting tools
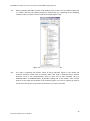
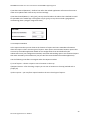
XV.
When expanding the folder of each of the models, their contents can be viewed. Expand the
‘src’ folder, and then the folder bearing the model name (e.g. ‘Bombing’ for the bombing
model) in order to view the source code of the model (Figure 3.10).
Figure 3.10. Navigating to the source code.
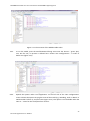
XVI.
The code is organized into Classes. Some of them represent agents in the model and
methods related to them (such as Civilian). Others are used to represent more abstract
elements (such as the ContextCreator class) or even just to store variables (such as
GlobalVariables or ModelVariables). By double clicking one of the classes, their content
appears on the upper left quadrant of the interface (Figure 3.11). This is required in order to
characterize the specific environment and scenario you wish to simulate.
36
FP7 Grant agreement no.: 261652
DESURBS Deliverable 4.7: User manuals for the DESURBS supporting tools
Figure 3.11. The contents of the GlobalVraibles Class.
XVII.
XVIII.
To run the model, press the small downward-facing arrow near the ‘Run As…’ green ‘play’
icon. On first use, no process is defined here. Choose ‘Run Configurations…’ in order to
define one (Figure 3.12).
Figure 3.12. Running a model.
Expand the options under ‘Java Application’ on the left side of the ‘Run Configurations’
screen. Choose the option carrying the name of the model (e.g. ‘Bombing’, with no ‘Batch’ or
‘Build Installer’ before it), and press Run (Figure 3.13). This option is now available under the
‘Run As...’ menu for this workspace from now on.
37
FP7 Grant agreement no.: 261652
DESURBS Deliverable 4.7: User manuals for the DESURBS supporting tools
Figure 3.13. Selecting a model to run.
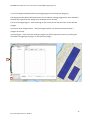
XIX.
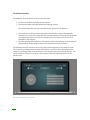
Upon completing the previous stage, a new 'simulation screen' interface would load. In order
to start and run the simulation, press the ‘Start’ button (Blue ‘play’ icon on the upper part of
the screen; Figure 3.14).
Figure 3.14. Simulation screen.
38
FP7 Grant agreement no.: 261652
DESURBS Deliverable 4.7: User manuals for the DESURBS supporting tools
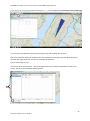
XX.
During the simulation, visual outputs are presented on the right side of the simulation screen
(Figure 3.15). Textual documentation of is presented at the lower right quadrant of the
interface (Figure 3.16).
Figure 3.15. Cartographic outputs during simulation.
Figure 3.16. Textual output during simulation run.
39
FP7 Grant agreement no.: 261652
DESURBS Deliverable 4.7: User manuals for the DESURBS supporting tools
4. SensoMeter (HUJI)
The background and DESURBS advances for the SensoMeter smartphone application for crowd
control surveys are reported in Deliverable 4.5.
Part A: The Web Application (for administrator users)
4.1.1. Functionality of the SensoMeter Web Application
The web application was designed to allow administrator users to configure their campaign. The web
application can be accessed from any computer that has an Internet connection and an Internet
browser and it allows administrator users to:
1. Configure surveys and surveys' triggers (including polygons that define the spatial area of a survey)
2. Configure various system properties (including communication, battery usage sample rate etc.)
3. Manage mobile users
4. View location data in real time
5. Export data
6. Send and receive messages to/from a specific user or group of users
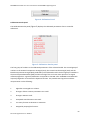
4.1.2. Web Application Windows
The web application includes 8 main windows that can be accessed from the top left hand part of the
main screen: 'Mobile Users', Polygons', 'Surveys', 'Poly-Surveys', 'Configuration', Reports', 'Survey
Results', and 'Messages'.
40
FP7 Grant agreement no.: 261652
DESURBS Deliverable 4.7: User manuals for the DESURBS supporting tools
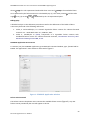
4.1.2.1 Mobile Users Window
The 'Mobile Users' screen allows the administrator to observe the mobile users that downloaded the
mobile application and that are registered for the campaign of the administrator's client.
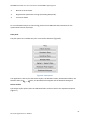
Configuring a Survey: The Polygon, Survey and Poly-Survey Windows
The Polygon, Survey and Poly-Surveys windows allow the administrator user to configure locationbased surveys. In order to generate a survey that will be triggered in the mobile application the
administrator user is required to activate a poly-survey. The following flow chart describes the stages
of creating a Poly-Survey.
Create a new
polygon or use an
existing polygon
Create a new
survey or use an
existing survey
Drag a polygon and a survey into
the '(new) Poly-Survey window'
and configure the temporal
parameters of the poly-survey
41
FP7 Grant agreement no.: 261652
DESURBS Deliverable 4.7: User manuals for the DESURBS supporting tools
4.1.2.2 The Polygon Window (observing existing polygons and creating new polygons)
The polygon window allows the administrator user to observe existing polygons that were defined in
the past and to generate new polygons by drawing them on the map.
1) A list of existing polygons – when selecting an item on the list the map will zoom to the selected
polygon.
2) Create a ‘New’ polygon button – after pressing this button you will be requested to draw a
polygon on the map.
3) Save polygon – after you finish drawing a polygon you will be required to save it by pressing the
save button and giving the polygon a name (see next image).
1
2
42
FP7 Grant agreement no.: 261652
DESURBS Deliverable 4.7: User manuals for the DESURBS supporting tools
3
4.1.2.3 The Surveys Window (observing existing surveys and creating new surveys)
The surveys window allows the administrator user to observe existing surveys that were defined in
the past and to generate new surveys by creating new questions.
1) A list of existing surveys.
2) Create a ‘New’ survey button – after pressing this button you will be requested to create a new
survey. The new survey window will be opened.
1
2
43
FP7 Grant agreement no.: 261652
DESURBS Deliverable 4.7: User manuals for the DESURBS supporting tools
New Survey Window
The new survey window allows you to compose questions for your new survey. Use the following
buttons and controllers to generate the new survey
1) Survey name – insert the survey name here (you cannot save the survey without assigning the
survey a name).
2) Type of question – this controller allows you to choose the type of question
3) Add Question – this button allows you to add a new question to the survey
4) Create – press this button when you finish creating the survey (you are required to give the survey
a name before saving it). This button will save the survey and add it to the list of existing surveys.
1
2
4
3
4.1.2.4 The Poly-Surveys Window
In order to activate a survey and define its triggering parameters, the administrator user must use
the Poly-Surveys Window. Use the following buttons and controllers in order to activate a (poly)survey.
1) A list of existing poly-surveys.
2) Create a new poly-survey button – after pressing this button you will be requested to create a new
poly-survey. The new poly-survey window will be opened.
3) Enable poly-survey – check / uncheck the box in order to enable / disable a poly-survey. Press the
Update button (in the bottom) in order to put the disable / enable into action.
4) Update – press this button after checking / un-checking the Enable box in order to enable / disable
a survey.
44
FP7 Grant agreement no.: 261652
DESURBS Deliverable 4.7: User manuals for the DESURBS supporting tools
3
1
4
2
New Poly-Survey Window
The new poly-survey window allows you to create a new poly-survey. This is the way you can activate
and configure your surveys. Use the following buttons and controllers to generate the new polysurvey
1) Poly-Survey name – insert the poly-survey name here (you cannot save the poly-survey without
assigning it a name).
2) Points – insert the number of points that a mobile user will receive when completing this polysurvey (this is used as an incentive for mobile users)
3) Weight – this controller defines the probability of a poly-survey to be triggered each time the
mobile application is checking for new available survey (1=100%, 0.5=50%). The poly-survey can only
be triggered when the temporal and spatial conditions are met (i.e. the mobile phone is within the
polygon and within the time frame that was defined).
4) Interval (Minutes) – this controller defines the minimum interval between each two poly surveys
5) Drop survey here and Drop polygon here boxes – Drag a survey from the surveys window and
(optionally) a polygon from the polygons window into these boxes in order to activate a survey and
to associate between a survey and a polygon.
6) Schedule Survey – this group of controllers allows defining the time frame within which the polysurvey can be triggered (e.g. Sundays and Mondays between 8:00-12:00)
45
FP7 Grant agreement no.: 261652
DESURBS Deliverable 4.7: User manuals for the DESURBS supporting tools
7) Create – press this button when you finish creating the poly-survey (you are required to give the
poly-survey a name before saving it). This button will save the poly-survey and add it to the list of
existing poly-surveys.
1
2
3
4
5
6
7
* Configure a Poly-Survey without spatial parameters (without a polygon)
Check the 'Location not needed' box in order to configure a survey that is triggered based on
temporal parameters only. When the 'Location not needed' box is checked, you are not required to
drag a polygon into the '(new) Poly-Survey' window.
4.1.2.5 Configuration Window
The configuration window allows you to define the structured reports that will appear at the mobile
applications of your mobile users, and to control several different settings.
After changing the settings you are required to press the update button at the bottom of the
configuration window.
General Settings
General settings allows you to:
46
FP7 Grant agreement no.: 261652
DESURBS Deliverable 4.7: User manuals for the DESURBS supporting tools
1) Show the last update time – see when was the last time in which the settings had been updated.
2) Define User levels - define the number of points that a mobile user should gain for advancing in
the various levels (this is used as an incentive for mobile users who may gain points for each survey
or report that they complete).
1
2
Questions Settings
The questions controllers allow you to define and add questions to the structured reports that
appear in the mobile application (see part B of this manual):
1) Add a question to the report
2) Choose the type of question
3) Remove a question
1
3
2
Power save Settings
The power save settings allow you to control the battery usage of the phone where usually there is a
tradeoff between location accuracy and battery usage.
1) Standing on the question mark symbol with the mouse crosser opens a text box that explains how
the controller next to the symbol influences the battery usage of the mobile phone.
47
FP7 Grant agreement no.: 261652
DESURBS Deliverable 4.7: User manuals for the DESURBS supporting tools
1
Surveys and Reports Settings
The surveys and reports settings allow the administrator user to configure the reports and surveys of
the phone
1) Auto start survey collection – when this box is checked the mobile application will automatically
start looking for available surveys after the application is downloaded and activated.
2) Survey check interval (Minutes) – determines how often the mobile application will look for
available surveys (this influences the battery usage).
3) Auto start reports collection - when this box is checked the mobile application will automatically
start recording phone location (in the interval that is specified bellow) after the application is
downloaded and activated.
4) Auto report interval (Minutes) – defines the interval of location recording.
5) Report points – defines how many points the mobile will receive for each report that he/she
sends.
1
2
3
4
5
Get Data Settings
48
FP7 Grant agreement no.: 261652
DESURBS Deliverable 4.7: User manuals for the DESURBS supporting tools
1) Get data interval (Minutes) – defines how often the mobile application will contact the server in
order to be updated with new surveys and new settings.
2) Get data bound (Meters) – Only (poly)-surveys that fall within the radius that is defined here will
be uploaded to the mobile app. This applies only for (poly)-surveys that include a geographical
conditioning (have a polygon assigned to them).
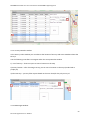
4.1.2.6 Reports Window
In the reports window you can observe the location of reports and some metadata information
about the reports. There are two types of reports. Auto reports are automatic location reports that
are sent by the mobile application based on the configurations that were defined by the
administrator user (see configuration window). Real time and Pending reports are structured reports
that were initiated by the mobile user (see part B of this manual about the mobile application).
Use the following controllers to navigate within the Reports window
1) List of reports – choose a report to see its location on the map
2) Report location – after choosing a report you can see its location on the map (marked with a
purple pin)
3) Filter reports – you may filter reports based on the user id and type of reports.
49
FP7 Grant agreement no.: 261652
DESURBS Deliverable 4.7: User manuals for the DESURBS supporting tools
3
2
1
4.1.2.7 Surveys Results window
In the Survey results window you can observe the location of Surveys and some metadata about the
Surveys.
Use the following controllers to navigate within the Surveys Results window
1) List of Surveys – choose a report to see its location on the map
2) Survey location – after choosing a Survey you can see its location on the map (marked with a
purple pin)
3) Filter Surveys – you may filter reports based on the user id and/or the poly-survey id.
3
1
2
4.1.2.8 Messages Window
50
FP7 Grant agreement no.: 261652
DESURBS Deliverable 4.7: User manuals for the DESURBS supporting tools
The messages window allows the administrator user to communicate with the mobile users through
text messages. Press the 'New' button in order to send a new text message to the entire group or to
a specific mobile user. Alternatively, double click a message in order to reply to a mobile user.
New message window
In order to write a message to a mobile user, drag a mobile user from the 'Mobile Users' window into
the New Message window. Afterwards type the message that you would like to send in the box
bellow. In order to write a message to the entire group check the 'send to whole group’ option.
4.2 Part B: The Mobile Application
4.2.1 Functionality of the SensoMeter Mobile Application
51
FP7 Grant agreement no.: 261652
DESURBS Deliverable 4.7: User manuals for the DESURBS supporting tools
The SensoMeter application is a location based survey system which allow its users to:
1. Receive surveys based on location and/or predefined schedule.
2. Initiate structured reports that include geographical references.
3. Send automatic reports about the location of the user ('follow me' reports).
4. Send and receive text messages to/from the survey manager.
4.2.2. Mobile Application Screens
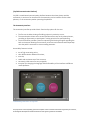
4.2.2.1 Main Screen
The main screen of the application includes 3 main buttons (1, 2, 3), a status bar (4), notification
icons about new surveys (5) and new messages (6) and a menu button (7).
7
5
1
2
6
3
4
(1) Pressing the "Send a report" button will open the Real time report screen (see explanation
bellow) which lets you send a structured report.
(2) Pressing the "Report later" button generates a new report that includes your current geographical
location. The report can be accessed and completed at a later time through the Pending report
screen. The report later button is useful when you cannot complete a report about a specific
location, and wish to report about it later on.
(3) Pressing the 'Follow me' button turns off/on the follow me reports option. 'Follow me' reports are
automatically-generated reports that include the geographical location of the phone. The interval of
the reports is defined by the survey manager. When the Follow me report is on (white color), the
52
FP7 Grant agreement no.: 261652
DESURBS Deliverable 4.7: User manuals for the DESURBS supporting tools
phone sends location reports automatically and a notification (two footsteps) will appear at the
notification bar of the phone.
(4) The status bar shows you your current level, the number of points you have collected so far (by
completing surveys and sending reports), and the number of points you need to collect for the next
level. Pressing the status bar will open a detailed status screen (see below).
(5) Survey notification – this notification indicates that you have a pending survey that should be
completed. Pressing the survey notification will open the survey itself. By completing the survey you
can earn points and advance in levels.
(6) Message notification – the message notification indicates that you received a new message from
the survey manager. Pressing the message notification will open the messaging screen (see below).
(7) Menu – pressing the menu button will open the menu of the application. The menu allows you to
control the settings, enter the messaging screen, and complete pending surveys and pending reports.
4.2.2.2 Pending surveys screen
Whenever you receive a new survey, a notification icon (followed by a notification sound) will appear
at the notification bar of your phone and in the main screen of the
application.
Press the icon in order to complete the survey/s
5
4
3
2
1
(1) The survey – complete it using the touch screen and keyboard. This part of the screen can be
scrolled up and down.
(2) Survey information bar – the bar includes (a) the geographical accuracy level that is available; the
higher the number the less accurate will be the location of the report*. (b) The number of points that
you gain for completing and sending the report.
*You can improve the accuracy level by activating the phone's GPS and Wi-Fi. If you are indoors, place the
phone near a window where a satellite signal can be obtained.
(3) Send button – Once you finish completing the report, press this button and the report will be
delivered.
(4) Back to the main screen of the application
53
FP7 Grant agreement no.: 261652
DESURBS Deliverable 4.7: User manuals for the DESURBS supporting tools
(5) Delete survey button.
4.2.2.3 Real time report screen
The real time report screen allows you to send a structured report in real time by pressing the: 'Send
a report’
button that is located in the main screen.
4
3
2
1
5
(1) The report – complete it using the touch screen and keyboard. This part of the screen can be
scrolled up and down.
(2) Report information bar – the bar includes (a) the geographical accuracy level that is available; the
higher the number the less accurate will be the location of the report*. (b) The number of points that
you receive for completing and sending the report.
*You can improve the accuracy level by activating the phone's GPS and Wi-Fi. If you are indoors, place the
phone near a window where a satellite signal can be obtained.
(3) Send button – Once you finish completing the report, press this button and the report will be
delivered.
(4) Back to the main screen of the application
(5) Slide for map button – scroll this button up if you wish to pinpoint your location manually (when
the accuracy level is low). The button will open a map on which you can pinpoint your location.
4.2.2.4 Pending report screen
The Pending report screen allows you to complete a report that you initiated using the Report later
button
that is located in the main screen. Pending reports include the location and time that
were
recorded at the moment that you pressed the report later button.
Pending reports can be completed the same way as real time reports (see 2.3)
4.2.2.5 Status screen
The status screen includes information about the number of points that you gained and the number
of surveys and reports that you have already completed. In addition, it presents the trophies that you
54
FP7 Grant agreement no.: 261652
DESURBS Deliverable 4.7: User manuals for the DESURBS supporting tools
have collected. You can view the status screen by pressing the status bar that is located on the
bottom of the main screen of the application.
4.2.2.6 Messaging screen
Through the messaging screen you can read text messages that were sent to you by the system
admin and send back a reply. Whenever you receive a new message, an envelope notification will
appear at the notification bar of the phone and at the main screen of the application.
3
2
1
(1) Message box – press the box in order to type a message. To complete the action, press the send
button that is next to it.
(2) The content of the messages.
(3) Refresh button – press it to receive new messages.
55
FP7 Grant agreement no.: 261652
DESURBS Deliverable 4.7: User manuals for the DESURBS supporting tools
5. STREMA-DB & FCMODEL(TUC)
A description of the use lf the web application for the STREMA-DB Strength of materials database is
given in chapeter 2 &3 of D4.6 ‘Materials database/numerical modeling’. Here we provide the user
manual for the FCMODEL part of the TUC package.
FCMODEL Usage Manual and Documentation
FCMODEL is a MATALB™ application that calibrates failure criteria. The application provides several
built-in failure criteria that can be calibrated on experimental data. The user may also import
additional failure criteria into the application.
Prerequisites
The FCMODEL application has been developed in MATLAB 7.12.0 (R2011a) with Optimization
Toolbox. Thus, for MATLAB’s versions R2011a and later, it will execute as expected. The
Optimization Toolbox must also be installed. The FCMODEL application may even run in older
versions of MATLAB but its behavior cannot be guaranteed.
Installation
To install the FCMODEL application:
1. Extract the zipped folder in your hard disk (the file can be obtained from George Exakaktylos
at DESURBS partner TUC)
2. Open MATLAB
3. Select File Set Path…
4. Click Add with subfolders…
5. Select the extracted fcmodel directory in your disk
6. Click Save
7. Click Close
The FCMODEL application is now installed in your system. For more details on setting the path,
please consult MATLAB’s documentation.
Background Theory: Conventions, Definitions and Minimization Algorithm
Conventions
The FCMODEL application assumes tension positive and compression negative. Moreover it assumes
(1)
where
,
and
are the three principal stresses of the Cauchy stress tensor
.
Definitions
The FCMODEL application requires the failure criteria to be given as expressions of the octahedral
stresses and the Lode angle. Every failure criterion must be given in the form
56
FP7 Grant agreement no.: 261652
DESURBS Deliverable 4.7: User manuals for the DESURBS supporting tools
(2)
where
(3)
is the mean pressure or octahedral normal stress and
tensor
.
is the first invariant of the Cauchy stress
is the octahedral shear stress
(4)
and the Lode angle
is given by
(5)
where
and
are the second and third invariants of the stress deviator tensor
, respectively.
(6)
(7)
(8)
where
is the Kronecker Delta.
Minimization Algorithm
FCMODEL utilizes the non-linear trust region reflective algorithm to calibrate the failure criteria.
Firstly, every experimental point is converted to its corresponding
cylindrical coordinates.
Then, the non-linear least squares algorithm tries to minimize the Sum of the Squared Residuals (SSR)
by altering the parameters of the failure criterion. The objective function subject to minimization is
given by
(9)
57
FP7 Grant agreement no.: 261652
DESURBS Deliverable 4.7: User manuals for the DESURBS supporting tools
where
is the i-th experimental octahedral shear stress and
is the octahedral shear
stress predicted by the failure criterion as calculated by Eq. (2). The mean pressure and the Lode
angle
in Eq. (2) are the
derived by the i-th experimental point.
Bibliography
A detailed analysis on the calibration procedure as well as the definitions of the build-in failure
criteria may be found in the following references:
1. Liolios, P. and Exadaktylos, G. A smooth hyperbolic failure criterion for cohesive-frictional
materials. Int. J. Rock Mech. Min. Sci., 58:85-91, 2013.
2. Liolios P., Exadaktylos G. (2013), Comparison of a hyperbolic failure criterion with
established failure criteria for cohesive-frictional materials, International Journal of Rock
Mechanics & Mining Sciences 63, 12–26.
FCMODEL Application Environment
To execute (run) the FCMODEL application go to MATLAB’s command window, type: fcmodel and hit
ENTER. The application’s main window is illustrated in Figure 1.
Figure 1: FCMODEL Application window
Failure Criterion Panel
The Failure Criterion drop down menu contains the available failure criteria (Figure 2). Any new
failure criteria provided by the user will appear in this list.
58
FP7 Grant agreement no.: 261652
DESURBS Deliverable 4.7: User manuals for the DESURBS supporting tools
Figure 2: Failure Criterion drop down menu
Data File panel
The Data File panel is used to open the file that contains the experimental data (Figure 3). A data file
must be selected before trying to calibrate.
Figure 3: Data File panel
Data file structure and conventions
The data file must be in plain ASCII format (simple text file). Only .dat and .txt files are allowed. The
file must contain three columns representing the three experimental principal stresses at failure. The
three columns must be separated by the comma symbol “;”. Each row in the file represents an
experimental point. The first column represents the principal stress σ1, the second column the
principal stress σ2 and the third the principal stress σ3. The file must contain only the values of the
experimental points and not any heading/tailing rows describing the columns etc.
According to FCMODEL’s conventions, for example a Uniaxial Compression Strength (UCS)
experiment would be written as
0;0;-σ
where -σ is the UCS value of the experiment (negative quantity). The subdirectory data in the
fcmodel directory contains sample data files that can be used as reference.
Calibration panel
The Calibrate! button (Figure 4) calibrates the selected failure criterion on the experimental points.
A data file must be set before executing the calibration.
59
FP7 Grant agreement no.: 261652
DESURBS Deliverable 4.7: User manuals for the DESURBS supporting tools
Figure 4: Calibration Panel
Calibration Results panel
The Calibration Results panel (Figure 5) displays the calibrated parameters after a successful
calibration.
Figure 5: Calibration Results panel
The first group of numbers is the calibrated parameters of the selected model. The second group of
numbers is the Uniaxial Compression Strength (UCS), the Uniaxial Tensile Strength (UTS) and the
Biaxial Compression Strength (BCS) predicted by the calibrated model. The third group of numbers is
the Sum of Squared Residuals (SSR) and the Exit Flag of the non-linear least squares trust region
reflective algorithm. A good fit/calibration corresponds to low SSR value. FCMODEL uses MATLAB’s
lsqcurvefit algorithm to minimize the objective function. The possible Exit Flag values and their
interpretation are the following:
1
Algorithm converged to a solution.
2
Change in failure criterion parameters too small.
3
Change in SSR too small.
4
Computed search direction too small.
0
Too many function evaluations or iterations.
-1
Stopped by output/plot function.
60
FP7 Grant agreement no.: 261652
DESURBS Deliverable 4.7: User manuals for the DESURBS supporting tools
-2
Bounds are inconsistent.
-3
Regularization parameter too large (Levenberg-Marquardt).
-4
Line search failed.
For more detailed analysis on the Exit Flag, please consult MATLAB’s documentation for the
optimization function lsqcurvefit.
Plots panel
The plot options are available only after a successful calibration (Figure 6).
Figure 6: Plots panel
The application is able to plot the Failure Surface, the Deviatoric Plane, the Meridional Plane, the
Rendulic Plane, the
Plane, the Residuals Polar Diagram and the Residuals Histogram.
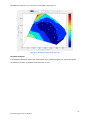
Failure Surface
The Failure Surface option plots the calibrated failure surface as well as the experimental points
(Figure 7).
61
FP7 Grant agreement no.: 261652
DESURBS Deliverable 4.7: User manuals for the DESURBS supporting tools
Figure 7: Failure Surface plot
Deviatoric Plane
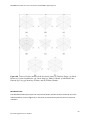
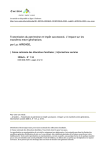
The Deviatoric Plane option plots the traces of the failure surface on the deviatoric plane (Figure 8a).
The plot illustrates the evolution of the shape of the failure surface with the increase of the mean
pressure. Currently FCMODEL includes the failure criteria shown in Figure 8b.
Figure 8a: Deviatoric Plane plot
62
FP7 Grant agreement no.: 261652
DESURBS Deliverable 4.7: User manuals for the DESURBS supporting tools
Figure 8b. Traces of failure models on the deviatoric plane: (a) Drucker-Prager, (b) HoekBrown,(c) Liolios-Exadaktylos, (d) Linear Mogi,(e) Mohr-Coulomb, (f) Modified LadeDuncan (by Ewy),(g) Menetrey-Willam, and (h) Willam-Warnke.
Meridional Plane
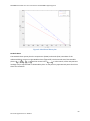
The Meridional Plane option plots the compression (θ=60ο) and the tensile meridian (θ=0ο) of the
calibrated failure criterion (Figure 9). It also plots any experimental points that lie on these two
meridians.
63
FP7 Grant agreement no.: 261652
DESURBS Deliverable 4.7: User manuals for the DESURBS supporting tools
Figure 9: Meridional Plane plot
Rendulic Plane
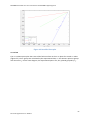
The Rendulic Plane option plots the compression (θ=60ο) and tensile (θ=0ο) meridians of the
calibrated failure criterion on the Rendulic Plane (Figure 10). The horizontal axis of the Rendulic
plane is
and the vertical axis is
. In other words, all the axisymmetric
loadings may be represented on the Rendulic plane. It also plots any experimental points that lie on
these two meridians.
64
FP7 Grant agreement no.: 261652
DESURBS Deliverable 4.7: User manuals for the DESURBS supporting tools
Figure 10: Rendulic Plane plot
σ2-σ3 Plane
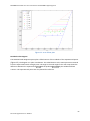
The σ2-σ3 Plane option plots the traces of the failure surface on the σ2-σ3 plane for several σ1 values
(Figure 11). The σ1 groups are calculated by the experimental data, i.e. the data are split into groups
with the same σ1. On the same diagram, the experimental points are, also, plotted grouped by σ1.
65
FP7 Grant agreement no.: 261652
DESURBS Deliverable 4.7: User manuals for the DESURBS supporting tools
Figure 11: σ2-σ3 Plane plot
Residuals Polar Diagram
The Residuals Polar Diagram option plots a filled contour of the residuals of the experimental points
(Figure 12). The diagram is in polar coordinates. The radial distance is the mean pressure measured
from the equitriaxial tensile strength point. The angle is the Lode angle θ. The color map shows the
difference between the experimental
and the predicted
by the calibrated failure
criterion. The experimental points are also plotted for reference.
66
FP7 Grant agreement no.: 261652
DESURBS Deliverable 4.7: User manuals for the DESURBS supporting tools
Figure 12: Residuals Polar Diagram plot
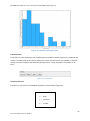
Residuals Histogram
The Residuals Histogram option plots a histogram of the residuals (Figure 13). A good prediction
increases the number of residuals with value near to zero.
67
FP7 Grant agreement no.: 261652
DESURBS Deliverable 4.7: User manuals for the DESURBS supporting tools
Figure 13: Residuals Histogram plot
Plot tools panel
Every plot has a Plot tools panel with available plot manipulation options (Figure 14). The Rotate 3D
option is available only for the Failure Surface plot. Zoom and Pan options are available on all plots
except from Failure Surface and Residuals Histogram plots. Finally, Grid option is available on all
plots.
Figure 14: Plot tools panel
Directory Structure
The directory structure of the FCMODEL application is illustrated in Figure 15.
fcmodel
|---- data
|---- functions
|---- models
68
FP7 Grant agreement no.: 261652
DESURBS Deliverable 4.7: User manuals for the DESURBS supporting tools
|---- postprocessors
|---- preprocessors
|---- templates
Figure 15: Directory structure of FCMODEL application
The directories contain the following functions/files:
data Sample files with experimental data. The user may store his own data files here
or in any other directory of his choice.
functions Internal functions of the application.
models Objective functions of the failure criteria. All the objective functions of the buildin models are stored in this directory. The objective function of every new
criterion provided by the user must be stored in this directory.
postprocessors Post-processors of the failure criteria. All the post-processors of the built-in
models are stored in this directory. The post-processor of every new criterion
provided by the user must be stored in this directory.
preprocessors Pre-processors of the failure criteria. All the pre-processors of the built-in
models are stored in this directory. The pre-processor of every new criterion
provided by the user must be stored in this directory.
templates Templates for building new failure criteria. An objective function, a preprocessor and a post-processor template are supplied.
Building New Failure Criteria
The FCMODEL application may be extended to support new failure criteria provided by the user. For
every new criterion an objective function, a pre-processor and a post-processor must be provided.
The templates directory contains template files for the three functions required. The three files must
be stored in the corresponding directories.
Objective function
The objective function is the failure criterion in the form of Eq. (2). The declaration of the function
(first row) must be in the form:
function [T,J]=model(x,p,theta)
where model is the name of the function. The model name must be exactly the same with the file
name.
69
FP7 Grant agreement no.: 261652
DESURBS Deliverable 4.7: User manuals for the DESURBS supporting tools
Parameter x is a row array containing the parameters of the failure criterion. The order of the
parameters is defined by the user. Parameters p and theta are column arrays containing the mean
pressure and the corresponding Lode angle. The FCMODEL application supplies these arrays
automatically. The user must supply in the function the necessary calculations in order to calculate
the octahedral shear stress T from x, p and theta. T must be a column array. Each value of T is
calculated by the corresponding (p, theta) pair from the input.
Parameter J is the Jacobian of the objective function with respect to its parameters in the x array. In
other words, J is a matrix containing the partial derivatives of T with respect to each parameter in x.
The columns of J are equal to the columns of x. The rows of J are equal to the rows of p and theta.
The order of the derivatives (columns) must be exactly the same with the order of the parameters in
x. The calculation of the Jacobian is optional. The algorithm calculates the Jacobian numerically if it is
not provided by the user.
For more details on building functions please consult MATLAB’s documentation.
Pre-processor
The pre-processor initializes the parameters of the failure criterion. The pre-processor function must
be declared in the form:
function [titlestring,x0,lb,ub,jac]=modelpreprocessor
where modelpreprocessor is the name of the pre-processor. To construct the name of the preprocessor, append the string “preprocessor” to the model’s name. For example if the name of the
objective function is “objfun1” then the pre-processor must be “objfun1preprocessor”. You must
always follow this pattern in order for FCMODEL to be able to locate the pre-processor.
The preprocessor has no inputs. The titlestring parameter is a string containing the name of the
failure criterion. The titlestring will appear automatically in the drop down list of the available failure
criteria. Parameter x0 is the initial guess row array of the parameters of the model. lb and ub row
arrays are the lower and upper boundary values for the parameters. Infinity is also allowed (open
boundary). jac is a string declaring if the Jacobian of the objective function will be provided by the
model function. Available options are “on” and “off”.
Post-processor
The post-processor performs calculations and data manipulations after a successful calibration. The
post-processor must be declared in the form:
function [ptt,results]=modelpostprocessor(x)
where modelpostprocessor is the name of the post-processor. To construct the name of the postprocessor please follow the same pattern as with the pre-processor by appending the
“postprocessor” string to the model name.
70
FP7 Grant agreement no.: 261652
DESURBS Deliverable 4.7: User manuals for the DESURBS supporting tools
x is the row array of the calibrated parameters and it is supplied by FCMODEL. ptt is the hydrostatic
(equi-triaxial) tensile strength. The ptt value is usually a singular point, thus its calculation must be
provided by the post-processor given the calibrated parameters in x. The results parameter is a
column cell array. Each row is a string containing a calibrated parameter. FCMODEL application does
not know what each parameter is; hence the post-processor must provide the description. For
example if the first parameter in x array is the cohesion c and the second parameter is the friction
angle φ, then the results array can be defined as:
results={strcat('c=',num2str(x(1)));
strcat('phi=',num2str(x(2)*180/pi))};
The results array is displayed in the Calibration Results panel of the FCMODEL application.
71
FP7 Grant agreement no.: 261652
DESURBS Deliverable 4.7: User manuals for the DESURBS supporting tools
6. Vulnerability of structures database, blast and earthquake (CIMNE)
The background and DESURBS advances for the vulnerability of structures database are reported in
D4.8.
A demonstration of the use of this tool can be found in a 4- part series of short videos that are
downloadable from the following link:
https://web.cimne.upc.edu/users/zarate/DESURBS/Videos
72
FP7 Grant agreement no.: 261652
DESURBS Deliverable 4.7: User manuals for the DESURBS supporting tools
7. Conclusion
In this deliverable, we have provided short user manuals for the DESURBS WP4 supporting tools.
73
FP7 Grant agreement no.: 261652