1
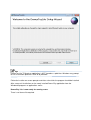
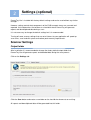
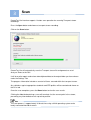
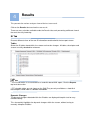
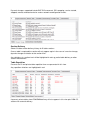
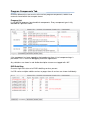
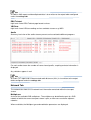
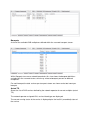
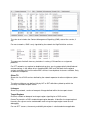
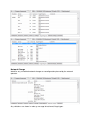
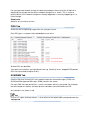
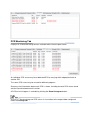
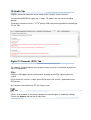
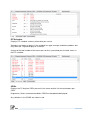
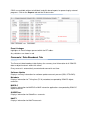
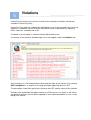
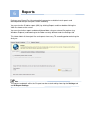
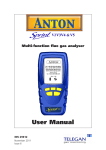
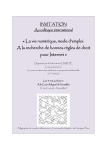
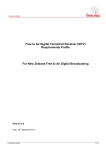
SOFTWARE
USER’S GUIDE
DemuxToy® Lite TS Anayser v1.1.0
Version 1
Aug 23, 2014
© Altais Digital 2013-2014
1
Getting Started
Note
• The screens in this manual are from Windows® 7. Screens on your PC may vary
depending on your operating system.
System Requirements
DemuxToy Lite minimum system requirements:
Microsoft Windows® XP, Windows Vista, Windows 7 or Windows 8
Microsoft .NET Framework: 2.0 or above
500 MB RAM minimum ~ Recommended: 2 GB or more
20 MB of hard-disk space for program installation
Screen dimensions of 1024 x 768 or greater
Recommendation is at least 2 GB of hard-disk space for decoded output from the
scanning process
Note
• The amount of RAM required depends upon the individual transport streams scanned.
Streams with a high number of carousels could require 2GB+ RAM during scan.
• Each transport stream is fully decoded to a user selected output folder on the hard-disk
during a scan. The folder contents are kept between scans, thus this folder size may grow
significantly after continued use. The user is urged to purge no longer required scan results
over time.
Installation Process
DemuxToy Lite for windows is supplied as a zipped Windows Installer Package (.msi) file
that prompts the installation process.
Copy the DemuxToyLiteInstaller.msi to a temporary directory on the Windows PC the
double click to run.
The installation wizard screen should appear as shown below.
Press the Next button and follow the instructions and prompts on-screen to complete the
installation process.
Note
You have to be logged in as an administrator to install the software on a Windows ®
platform.
Note
DemuxToy Lite TS Analyser application is NOT signed as a publisher. Windows may prompt
to run an unknown publisher. Click ok to proceed.
Follow the installer on-screen prompts and after a few clicks the program should be installed.
After successful installation run the newly installed DemuxToy application from the
Windows® programs or applications menu.
DemuxToy Lite is now ready for running scans.
There is no license file required.
2
Settings (optional)
DemuxToy Lite is installed with factory default settings and can be used without any further
changes.
However settings control what components of the DVB transport stream are scanned and
reported. It also determines the location on a hard-disk where DemuxToy will generate
reports and demultiplexed data during a scan.
It is not necessary to change the default settings but it is recommended.
Turning off some scanner settings that are not of interest to your application will speed up
scan times, save hard-disk space and reduce peak memory requirements.
Scanner Settings
Output folder
After installation it is recommended to change the factory default output folder that
DemuxToy Lite will generate reports and decoded data during the scan process.
Click on the Settings tab.
Click the Save button and create a new folder on the hard-disk or browse to an existing.
All reports and demultiplexed data will be generated into this folder.
Note
• It is recommended to choose a non-network output folder destination with fast access
times, since it will affect the time required to generate and produce scan reports at the end of
the scan.
• DemuxToy will never automatically delete previous scan results in this folder. Hence it is
possible to retain scan results for as long as required between scans for troubleshooting.
• DemuxToy can generate a large volume of data over time. Therefore it is recommended
to periodically delete files you no longer require in the selected output folder and to monitor
the available space on the drive / volume selected.
Scan Hidden PIDs
Click the Automatically extract Hidden CAS PIDs box to aid troubleshooting of CAS
systems to DVB receivers.
When enabled, DemuxToy will automatically identify hidden PIDs that are not referenced
within the SI tables. Each hidden PID type is then further classified as carrying section or
PES data and the activity within that PID analysed and reported.
The content found within the PID is saved to the hard-disk under a folder name of HIDDEN.
1st and 2nd level hidden PID activity including private tables e.g. for ECM/EMMs, table
repetition and violations are reported.
Note
The hidden PID function identification is on a best effort basis. It is has no prior knowledge of
individual private data. It is recommended to keep this setting unclicked unless you
specifically debugging CAS private data
Component Scanner settings
These settings control the automatic scanning of program components, codecs and
carousels present within the transport stream.
Ticking a box does 2 things.
It provides a high level Analyser View of that component in the GUI.
It will also enable compliance checking and saving of any demultiplexed / decoded data and
various reports to the output folder selected under the Settings Tab.
SI Report Settings
This configures what MPEG/DVB SI tables and descriptors are written to the SI tables (XML)
report (plus GUI) during a scan.
Show raw descriptor bytes will also add the raw descriptor bytes to the SI tables XML report
to add further debugging.
Note
BAT tables can be quite large so disabling can reduce the XML file size and speed up
viewing the file on most browsers
3
Scan
DemuxToy Lite interface supports 1-button scan operation for scanning Transport stream
recordings.
Press the Open button and choose a transport stream recording.
Click on the Scan button.
DemuxToy Lite will automatically scan the Transport stream file and generate a set of
Analyser Views to the GUI.
It will also write reports and various demultiplexed data to the output folder you have chosen
under the Settings Tab.
The progress information includes a count of all items scanned within the transport stream.
Any violations against appropriate standards and STB profiles will be counted and shown on
the UI in red.
Once the scan completes, press the Done button to view the scan results.
Clicking the Abort button during a scan will terminate it at the current point in the stream,
presenting any intermediate results up to that position.
Note
The scan process is approximately X10 real-time using a 32-bit operating system and a
locally connected hard-disk source.
4
Results
This presents the various analyser views of the last scan result.
Click on the Results tab to review the scan result.
There are many sub-tabs available under the Results tab, each presenting a different view of
the result for easy browsing.
SI Tab
Presents different views of the raw SI information contained with the transport stream.
Tables
Shows the SI tables found within the stream and version changes. All tables, descriptors and
streams are fully decoded for reference.
Note
• The SI information is also available as a hard-disk based XML report. Click the Reports
top level tab to view.
• EIT schedule tables are not shown on the GUI. They are only available as a hard-disk
based report saved under a subfolder named EIT.
Dynamic Changes
The dynamic changes detected within the SI tables are displayed into plain text for easy
troubleshooting.
This view quickly highlights the dynamic changes within the stream, without having to
manually compare SI tables.
Dynamic changes supported include PMT PID movement, PID swapping, service started,
stopped, moved, relocated and also various network reconfiguration events.
Section Delivery
Shows SI table section delivery history for SI table sections.
Once a table is captured the section will only appear again in the case of a version change,
dynamic change or violation at the section level.
Any violations at a section level will be highlighted in red e.g. partial table delivery or other
section related errors.
Table Repetition
Presents the SI and private table repetition times are presented in this view.
Any repetition violations are highlighted in red.
If present, private tables from ECM/EMM delivery will also appear in this view plus DSM-CC
sections for carousel delivery.
Program Components Tab
Presents different the scan results of the various program components, codecs and
carousels found within the transport stream.
Program List
List of MPEG2 programs found and their components. Every component type is fully
decoded to a plain text name.
If the component has been tagged by the broadcaster then a list of component tags is
presented. This is useful for debugging interactive applications.
Any violations are shown in red. Audio description streams are tagged with “AD”.
DVB Subtitling
Presents high level status of all DVB subtitling services present.
If a PID carries multiple subtitle services or pages then all services are shown individually.
Note
A subtitles XML report and demultiplexed data is also written to the output folder configured
under the settings tab.
EBU Teletext
High level view of EBU Teletext page based services.
VBI Data
High level view of VBI transcoding services and data streams e.g. WSS.
Audio
Summary level view of the audio streams present and associated to different programs.
For each audio stream the number of frames found, profile, sampling and rate information is
displayed.
Any violations appear in red.
Note
An audio TXT report and a reconstructed audio bitstream (AUs) is also written to the output
folder configured under the settings tab.
Network Tab
The network tab shows the SI network level information contained within the transport
stream.
Multiplexes
A view of the available DVB multiplexes. The multiplex may be defined as part of a DVB
network of which the current transport stream is part, or from cross-carried or adjacent
networks.
Where available, the Multiplex type and modulation parameters are displayed.
Bouquets
A view of the available DVB multiplexes defined within the scanned transport stream.
Whilst Bouquets transverse network boundaries this view shows the bouquet definitions
carried within the scanned stream, which may relate to bouquets present on different
multiplexes.
For each bouquet the total services per transport stream are shown and a total count per
bouquet.
Actual TS
Shows the list of DVB services defined by the network operator for current multiplex (actual
TS).
The network operator assigned LCN, service Id and type are displayed.
The current running status of the service is displayed plus the freeCA (scrambled) status of
the service.
The view also includes the Content Management Signalling (CMS) state of the service, if
any.
For most networks, CMS is only signalled by the network for High Definition services.
The comments field will show any violations in red e.g. LCN conflicts or assignment
problems.
For DTT networks any regional or duplicated services are also automatically identified and
commented e.g. in the above off-air recording BBC ONE and TWO both have regional
variants available, whilst all the other BBC services have duplicate instances available, likely
on different multiplexes.
Other TS
Shows the list of DVB services defined by the network operator for other multiplexes (other
TS).
The other multiplexes are defined fully by NIT or SDT definitions picked up within the
currently scanned transport stream.
Linkages
Shows any network, service or bouquets linkage defined within the transport stream.
Target Regions
Presents network or bouquet level target region signalling for a DVB service.
DemuxToy contains a DVB standard target region decoder. It identifies the target regional
hierarchy for a given service and decodes each using the target region name to ease
debugging.
For non DTT streams, the country availability descriptor is substituted where applicable.
Network Change
Identifies any scheduled network changes or reconfiguration planned by the network
operator.
Any violations are shown in red e.g. message Id not found, illegal types.
For every planned network change, the delta time between the arrival of the SI table first
identifying the change and the actual schedule change time is shown. This is useful to
quickly identify if the network change has already happened, is currently happening or is a
future change.
Simulcasts
Identifies any simulcast services
PIDS Tab
Shows the PID multiplexing usage within the transport stream.
Each PID type is assigned a fully decoded plain text name.
Shared PIDs are identified.
Transport level violations are highlighted in red e.g. Continuity errors, dropped PES packets,
PIDs not transmitted (multiplex errors).
ECM/EMM Tab
Displays high level summary of CAS related Entitlement Control Messages (ECM) and
Entitlement Management Messages (EMM) found in the stream.
For each CAS message found the 1st and 2nd level down activity is presented. For example,
the total number of sections and what private sub-tables are carried within the PID.
Any violations are shown in red.
Note
A CAS TXT report showing sections is also written to the output folder configured under the
settings tab.
PCR Monitoring Tab
Displays all PCR based timing sources available within the transport stream.
An individual PCR source may be a dedicated PCR or carrying within adaptation fields of
another PID.
The same PCR source may be reused for different programs.
Summary level information about each PCR is shown, including the total PCR values found
and the interval between each insertion.
A PCR arrival histogram is available by clicking the Show Histogram button.
Note
A PCR TXT file containing raw PCR values is also written to the output folder configured
under the settings tab.
TS Health Tab
Displays information about the overall health of the transport stream scanned.
The calculated MPEG2 transport rate is shown, TS packet size and overall recording
duration.
The display includes the main 1st/2nd/3rd priority DVB measurement guidelines according to
TR 101 290.
Digital TV Recorder (DTR) Tab
This displays SI signalling from the transport stream scan that is relied upon by receivers
with DTR capabilities.
EITpf
Displays EITpf triggers present and dynamic changes to the EITpf signalling over the
stream.
EITpf state of the service is shown, where EITpf means the service is expected to have
EITpf events.
Any violations found within the EIT are shown in red.
Note
EITpf is also available as part of the standard SI hard-disk report, if enabled by settings.
Click on the Reports tab and the SI tab to view.
EIT Schedule
Displays EIT schedule summary information per service.
Violations are shown in red e.g. if the schedule has gaps, overlaps and other problems that
may affect the TV guide display on a receiver.
A count of the total number of the events per service is presented, plus the total events in
the EIT schedule.
CRIDs
Displays the TV-Anytime CRIDs present in the stream and the list of event locators per
CRID.
Programme, Series and recommendation CRIDS are decoded and displayed.
Any violations in the CRIDS are shown in red.
Note
CRIDs are available written to individual hard-disk based reports for processing by external
programs. Click on the Reports tab and the SI tab to view.
Event Linkages
Highlights all Event linkages present within the EIT tables.
Any violations are shown in red.
Carousels / Data Broadcast Tab
The Carousel (data broadcast tab) displays the summary level information of all DSM-CC
data or object carousels within the stream.
Every carousel is automatically mounted and scanned in real-time.
Software Update
Displays summary information for software update carousels present (SSU, DTG-OAD).
Metadata
Displays information for TV-Anytime (TV-A) metadata transported by DSM-CC object
carousels.
MHEG-5
Displays information for MHEG-5 or MHP interactive applications transported by DSM-CC
object carousels
GUIDEPlus+
Displays information for GuidePlus+ carousels.
HbbTV
Displays information for HbbTV carousels.
5
Violations
DemuxToy Lite Analyser has contains a demo of the automatic verification functionality
available in DemuxToy Verify.
DemuxToy Verify helps by automatically highlighting issues in the transport stream that may
manifest as a problem in the STB, particularly within Service Information (SI) signalling,
EPGs, carousels, metadata and so on.
The demo in the lite edition is limited to around 200 checking rules.
A summary of the violations found during the last scan appear under the Violations tab.
Each violation has a Rule Identification referencing the origin of the violation. For example,
SDT.LinkageError is a violation of a linkage descriptor appearing within an SDT.
The description should fully qualify the instance of that SDT and the nature of the violation.
Violations that could affect the proper function of a DVB receiver are shown in red. Others
are potential violations that are either expected in some network conditions or else usually
benign to a receiver.
6
Reports
During a scan DemuxToy Lite automatically generates a detailed set of reports and
demultiplexed data per transport stream recording.
You can view the SI tables report (XML) by clicking Reports and then double clicking the
XML file shown on the screen.
You can view further reports and demultiplexed data using an external file explorer (e.g
Windows Explorer) and browsing to the folder currently defined under the Settings tab.
This folder holds all the output files and reports from every TS recording performed using the
Analyser.
Note
The content and detail within the SI report can be customised by choosing the Settings tab
and SI Report Settings.