1
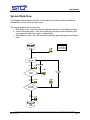
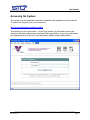
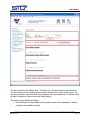
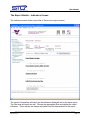
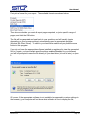
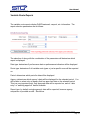
Performance Planning System
User Manual
Systems Technology Group, Inc.
2828 North Central Avenue, Suite 700
Phoenix, AZ 85004
http://www.stglink.com
Voice: 602.234.3131
Fax: 602.234.3138
User Manual
Table of Contents
INTRODUCTION: WHAT IS THE PERFORMANCE PLANNING SYSTEM? ................................................3
HIGH LEVEL OVERVIEW ......................................................................................................................................4
SYSTEM WORK-FLOW ...........................................................................................................................................5
ACCESSING THE SYSTEM .....................................................................................................................................7
GENERAL LOOK AND FEEL .................................................................................................................................8
HOME PAGE – AVAILABLE REPORTS ...............................................................................................................9
VIEW / EDIT REPORT............................................................................................................................................10
THE REPORT DETAILS SCREEN ................................................................................................................................10
THE REPORT DETAILS – INDICATORS SCREEN .........................................................................................................15
THE REPORT DETAILS – IMPORT DATA SCREEN ......................................................................................................17
REPORTING.............................................................................................................................................................22
REPORT VIEWER ......................................................................................................................................................23
FIXED ROUTES REPORTS .........................................................................................................................................31
VARIABLE ROUTE REPORTS ....................................................................................................................................33
ROLLUP REPORTS ....................................................................................................................................................34
USER NOTES............................................................................................................................................................37
This document and any information contained within is the sole property of Systems Technology Group, Inc. and is considered proprietary and confidential.
Revision 3.2.5
Page: 2
User Manual
Introduction: What is the Performance Planning System?
The Performance Planning System is a custom developed software program to track
the results and recommendations from Phase I of the Valley Metro/Regional Public
Transportation Authority Efficiency and Effectiveness Study. The study’s purpose was
to develop a performance reporting framework in support of Proposition 400.
The framework developed addresses four “modes” (Fixed Route System Wide, Fixed
Route, Route level, Paratransit, and Rail). Bus service categories include Local,
Supergrid, Express/BRT, Rural, Paratransit, and Circulators.
With exception of the rail system, which is not yet open to revenue service and which
therefore has no historical data, all bus and paratransit measures above have been
tested by the RPTA and member cities. Valley Metro/RPTA is also in the process of
developing specific goals across each indicator.
The system is implemented as a web application with a relational database backend.
• It is web based, so it can be accessed from anywhere
• It is secure, so many users can access it, each with their access privileges and
enabled functions
• It includes basic workflow as defined in the requirements documents
• It uses state of the art technology
This document and any information contained within is the sole property of Systems Technology Group, Inc. and is considered proprietary and confidential.
Revision 3.2.5
Page: 3
User Manual
High Level Overview
The system is overseen by Valley Metro who is interested in capturing the reporting of
various performance indicators from transit contractors and operators for the system
wide as well as individual transit routes.
The system allows the various transit contractors to enter specific performance data for
each of their routes as well as system wide data on a quarterly as well as annual basis.
The system implements basic workflow that allows for quality checks of the data before
it is submitted to Valley Metro, as well as quality checks by Valley Metro. All transit
contractors and Valley Metro have access to detailed reports as well as summary
reports.
Quarterly, new reports are created automatically and allow the users to report the
defined performance data. Based on the reported data values, the system
automatically calculates predefined performance indicators. Once this quarterly data
entry phase is complete, the data is submitted for internal review and finally to Valley
Metro. A similar process is followed for Annual reports that rollup data for the 4
previous quarters that make up the year.
This document and any information contained within is the sole property of Systems Technology Group, Inc. and is considered proprietary and confidential.
Revision 3.2.5
Page: 4
User Manual
System Work-Flow
The Diagram below explains the flow of data within the system and the interactions
between the various users and user roles.
The system supports three user roles:
• Data Entry users – who will enter the performance data in their agency’s report
• Internal Reviewer users – who will review the performance data accuracy, and
upon approval submit the report to Valley Metro
• Administrator users – who will review the internally approved reports and finalize
them
This document and any information contained within is the sole property of Systems Technology Group, Inc. and is considered proprietary and confidential.
Revision 3.2.5
Page: 5
User Manual
The various users, interact with the system and with each other as follows:
1. A new report is generated by the system, and the Data Entry users are notified
by email
2. The Data Entry user enters the performance data
3. The Data Entry user requests an internal review, and the Internal Reviewer user
is notified by email
4. The Internal Reviewer user reviews the data.
a. Internal Reviewer user rejects the report, the Data Entry user is notified by
email, and the report is placed state 2
b. Internal Reviewer user approves the report
5. The Administrator user (Valley Metro) reviews the internally approved report
a. The Administrator user Rejects the report, the Data Entry and Internal
Reviewer users are notified by email and the report reverts back to state 2
b. The Administrator user Approves the report, the Data Entry and Internal
Reviewer users are notified by email and the report is finalized in state6
6. Report becomes final
Even when the same person holds more than one role, the same process outlined
above will be followed, meaning the person will still have to submit the report for internal
review, even if that person will be same to approve it and forward if to Valley Metro to
be finalized.
This document and any information contained within is the sole property of Systems Technology Group, Inc. and is considered proprietary and confidential.
Revision 3.2.5
Page: 6
User Manual
Accessing the System
The system is a web application and thus accessible from anywhere over the internet.
To access the program, point your browser to:
http://prod.valleymetro.stglink.com/pp/
This will bring up the login screen. On the login screen you will need to enter your
assigned user login and password and press the [login] button. If you do not remember
your password or to be set up to use the system, please contact Valley Metro.
This document and any information contained within is the sole property of Systems Technology Group, Inc. and is considered proprietary and confidential.
Revision 3.2.5
Page: 7
User Manual
General look and feel
Once you log in you will have access to the application main page (or home page)
At the top of the screen you have a series of images and buttons that make up the page
header. This header matches the look and feel of the Valley Metro website at the time
this application has been designed. Clicking on the buttons will navigate to the main
Valley Metro website, effectively abandoning the application. You can also quit by
closing your browser.
Additionally you will notice that on the left side of the screen the application menu.
Based on the security level assigned to your account, you may have different options
visible. These menu items will help you navigate within the application.
In the center of the page you have the active application space. This is where you will
conduct most of the work. Again, the same screen may look different based on your
account permissions.
This document and any information contained within is the sole property of Systems Technology Group, Inc. and is considered proprietary and confidential.
Revision 3.2.5
Page: 8
User Manual
Home Page – Available Reports
Once you log in you will be placed on the “home page”. This is the main system hub
form where most actions will be performed.
The screen consists simply of a list of available reports, filtered by agency. Your
agency’s reports are displayed by default. When you select a different agency from the
filter drop down list, that agency’s reports will be displayed. However, when you agency
is selected, you can view ALL reports, in all reporting stages. If a different agency is
selected, you will be able to view only those reports that have been finalized by Valley
Metro.
From this screen you can then drill down and access the performance data associated
with a report. Simply select the View/Edit button next to the report that you want to
access.
Depending on the report status and your role within the system, your access to the
report data may be read only, or you may be able to modify data.
• All finalized reports are read only for all users
• Data Entry users will be able to read/write data to reports in the data entry state.
All other users will only have read only access.
• Internal Reviewer users will be able to read/write data to reports that have been
submitted for internal review. All other users will only have read only access.
• Once a report is submitted for final approval, all users will only have read only
access.
• Administrator users have read only access to all reports submitted for finalization.
This document and any information contained within is the sole property of Systems Technology Group, Inc. and is considered proprietary and confidential.
Revision 3.2.5
Page: 9
User Manual
View / Edit Report
To access a report, click on the View/Edit button in the list of reports. You will navigate
to the Report Details Screen.
The data on this screen may be available for editing (data entry) or it may be read only,
as determined by the report status, your user role in the system, and the agency the
report belongs to. For more information please read the previous section.
The Report Details Screen
This screen is divided in 4 functional areas, as highlighted in the image below. From
the top, the first area displays context information about the report currently displayed,
including the agency that submitted it, what year/quarter it is for, and current status.
This document and any information contained within is the sole property of Systems Technology Group, Inc. and is considered proprietary and confidential.
Revision 3.2.5
Page: 10
User Manual
The second area is the display filter. To begin with, all report sections are filtered out.
The drop down list box contains all the sections that are part of the current report. You
can also see them in the third area which displays the report data itself – however, since
all data is filtered out, the sections are initially empty.
The report can be filtered as follows:
• All data filtered out (the default setting when screen is first displayed) – labeled
as [Select an available section]
This document and any information contained within is the sole property of Systems Technology Group, Inc. and is considered proprietary and confidential.
Revision 3.2.5
Page: 11
User Manual
•
•
All report data displayed at once – this option may take a minute or two to display
if the report contains many fixed routes – this option is labeled [All available
sections]
A single report section at the time – for each of the sections available in the
report there will be the corresponding option in the filter criteria (Fixed Route,
Fixed Route System Wide, Vanpool, DAR/Paratransit).
o When you select the Fixed Route filter (if available for the current report),
then a second drop down list box will be displayer, allowing you to perform
a sub-filtering operation is desired. The sub filter will allow you to select
[All available fixed routes] included on the report, or any one of the
individual routes included in the report.
Once you have selected the desired filter, click the “Refresh/Filter Results” button and
the screen will display the selection, as below.
This document and any information contained within is the sole property of Systems Technology Group, Inc. and is considered proprietary and confidential.
Revision 3.2.5
Page: 12
User Manual
If the report is in data entry mode you can modify (or enter for the first) the requested
data. The buttons at the bottom of the screen will display:
Please remember that no data entry is actually saved to the database until you click the
Save button. If you re-filter the screen, Cancel, or View Indicators, the data will NOT be
saved.
The buttons at the bottom of the screen will change depending on the actions that you
can take at the time you are viewing the data. For instance note the buttons below.
The actions you can take on this screen (and buttons you could use if the context
permits) are:
• Save: saves the changes to the currently displayed data
• Cancel: returns you to the Home Page
• Request Internal Review: submits the report for an internal review
• Approve: approves the content of the report and moves it into the next phase
This document and any information contained within is the sole property of Systems Technology Group, Inc. and is considered proprietary and confidential.
Revision 3.2.5
Page: 13
User Manual
•
•
•
•
Reject: moves the report back to Data Entry
Submit to VM: moves the report into the waiting for final approval phase
View Indicators: Navigates to the calculated performance indicators screen.
Import data from an Excel spreadsheet
This document and any information contained within is the sole property of Systems Technology Group, Inc. and is considered proprietary and confidential.
Revision 3.2.5
Page: 14
User Manual
The Report Details – Indicators Screen
The Indicators screen looks very similar to the previous report screen.
The context information will match, as the indicators displayed are for the same report.
The filter area will match as well. Choose the appropriate filter and display the report
indicators. These values are always calculated from the data entered on the report
This document and any information contained within is the sole property of Systems Technology Group, Inc. and is considered proprietary and confidential.
Revision 3.2.5
Page: 15
User Manual
(previous screen), and can never be modified – are read only. The only way to modify
an indicator’s value is to change the underlying data it is calculated from.
Below is a sample of the indicators for all the fixed routes.
Indicators can not be approved or rejected as of themselves. Thus the only functionality
available on the screen is to return to the report by clicking on the “Back to Report Data”
button at the bottom of the page.
This document and any information contained within is the sole property of Systems Technology Group, Inc. and is considered proprietary and confidential.
Revision 3.2.5
Page: 16
User Manual
The Report Details – Import Data Screen
Depending on the status of the report in the established workflow and approval process,
if the user has Modify permissions, the Import Data button will be available. Click on it,
and you will be sent to the import data screen.
This document and any information contained within is the sole property of Systems Technology Group, Inc. and is considered proprietary and confidential.
Revision 3.2.5
Page: 17
User Manual
The import screen allows you to copy from Excel and paste into the application values
that need to be imported. The data will be imported into the currently selected report
(the information is in the header). If you need to import into a different report, go back
to Home Page, select it form the list, and so on.
The import screen contains 2 large text boxes, the top one will accept values to be
imported, and the bottom one will give you feedback on data that could not be imported
(if any).
The Excel spreadsheet you need to copy values from will need columns for :
Report Section
DAR/Paratransit
DAR/Paratransit
Vanpool
Vanpool
Fixed Route System Wide
Fixed Route System Wide
Fixed Route
Fixed Route
Fixed Route
Fixed Route
Route Name
Point Name
Rte
Rte
Rte
Rte
Operating Expenses
Passenger Fares
Operating Expenses
Passenger Fares
Operating Expenses
Passenger Fares
Operating Expenses
Passenger Fares
Operating Expenses
Passenger Fares
30
30
61
61
Value
10000000
1000000
12345
12345
12345
12345
12345
12345
12345
12345
The first column is the name of the report section the data point applies to. The second
is route name – if the section is NOT Fixed Route, then this does not apply, and leave it
empty. The third column is the Data Point Name, which has to be valid for that report
section. Finally the last column is the value to import.
In your spreadsheet, highlight/select the data to import, and click Ctrl-C to copy.
This document and any information contained within is the sole property of Systems Technology Group, Inc. and is considered proprietary and confidential.
Revision 3.2.5
Page: 18
User Manual
Switch back to the Performance Planning application, click on the top field, and press
Ctrl-V to paste the data you copied from Excel.
This document and any information contained within is the sole property of Systems Technology Group, Inc. and is considered proprietary and confidential.
Revision 3.2.5
Page: 19
User Manual
To process the data click the “Process Import Data” button. If there any errors, the error
information will display in the bottom text box (see below). As expected the data we
attempted to import generated 2 errors (which can be ignored). The first line is:
“Report Section
Route Name
Point Name
Value”.
Of course “Report Section” is not a valid report section name, as well as “Route Name”
is not a valid route name, and “Point Name” is not a valid data point name.
The second line is empty, so again there is no meaningful data to import and an error is
produced.
All the other lines do not produce errors, as they are correct.
This document and any information contained within is the sole property of Systems Technology Group, Inc. and is considered proprietary and confidential.
Revision 3.2.5
Page: 20
User Manual
The screen retains the imported data, so that you may manually delete some of the
rows (or modify others) and click the “Process Import Data” to re-attempt the import of
the data in the top text box.
When done, click the Go Back button to go back to the Report Details screen.
For the applicable report section names, route names and data point names, consult the
report details. Also you can consult the Administrative setup screen, as well some of
the reports.
This document and any information contained within is the sole property of Systems Technology Group, Inc. and is considered proprietary and confidential.
Revision 3.2.5
Page: 21
User Manual
Reporting
The Performance Planning System collects data (data points) and generates data
(calculated performance indicators) on a quarterly/annual basis. The sets of data
collected and generated are generally called “quarterly reports” or “annual reports”
because of the frequency this data is required, and thus “reported”.
However, for this “report” data to be useful, it needs to be extracted and presented in a
format suitable for review, comparison, analysis, etc. This is accomplished thru the use
of reporting. To be exact, in this context reporting and reports should be understood as
a system interface that displays the data entered into the system in a convenient and
understandable format.
The system provides over 40 reports, grouped on 3 reporting pages, based on the data
they report on:
• Fixed Route Reports that strictly display, analyze and compare the data pertinent
to the fixed routes. These reports are agency based.
• “Variable” Route Reports that display, analyze and compare the data pertinent to
the “variable” routes , i.e. DAR/Paratransit, Vanpool, etc. These reports are
agency based.
• Rollup reports that present cumulative data across agencies, based on various
parameters. These reports are only available to the system administrators.
To access the reporting pages, select the appropriate reports page form the left side
menu under the “Reports” heading. The reports pages generally display at the top of
the page a set of criteria that allow you to select what report you want to display. This
will be discussed in detail for each reporting page in the next sections.
This document and any information contained within is the sole property of Systems Technology Group, Inc. and is considered proprietary and confidential.
Revision 3.2.5
Page: 22
User Manual
Report Viewer
Once a report and its parameters are selected from the criteria at the top of the page,
and the “Display Selected Report” button is pressed, the system will collect the
requested data, format it, and display it in the report viewer.
The report viewer displays a toolbar that is consistent for all reports and allow you to
further manipulate the data of the report.
The buttons on the toolbar, from the left are as follows:
1. Export/Save
2. Print
3. Show/Hide report groupings
4. VCR buttons for navigating across multiple pages of the reports
5. Current page information
6. Jump to page field and button
7. Search report field and button
8. Zoom percentage
This document and any information contained within is the sole property of Systems Technology Group, Inc. and is considered proprietary and confidential.
Revision 3.2.5
Page: 23
User Manual
Export/Save
The export/save toolbar item allows you to create, download and save a copy of the
report data on your machine. To do that, the system needs more information, and it
collects it via a pop-up window. Sometimes users set up their browsers, or use 3rd party
software plug-ins that block pop up windows. Please make sure you override the pop
up blocker settings to allow pop ups for this web site / application.
Once the button is pressed, the following window will be displayed.
This document and any information contained within is the sole property of Systems Technology Group, Inc. and is considered proprietary and confidential.
Revision 3.2.5
Page: 24
User Manual
First pick a format for your export. The available formats are shown below:
Then choose whether you want all report pages exported, or just a specific range of
pages, and click the OK button.
The file will be generated and sent back to your machine, and will usually (again
depending on your browser settings) automatically open in appropriate program
(Acrobat, Ms Word, Excel). To save to your hard drive make sure you press the save
button in this program.
If you do not have the appropriate software installed or registered to view the generated
file (or if again, you have certain specific settings enabled/disabled for your browser)
you will be prompted to save the file directly to your hard drive (to look at later), or open
it.
Of course, if the appropriate software is not available (as opposed to custom settings in
the browser), your computer will not know what software to use to display the file,
This document and any information contained within is the sole property of Systems Technology Group, Inc. and is considered proprietary and confidential.
Revision 3.2.5
Page: 25
User Manual
Sometimes you can manually pick some appropriate program that is not “registered”
with the system (by using the “Open With…”, but in general, this means you will not be
able to view the file, unless you install the appropriate software.
Another observation noteworthy regarding the export formats, is that all of them, with
the exception of MS Excel 97-200 (Data Only), will attempt to replicate the look, feel,
and positioning of the report as closely as possible in the selected software. The MS
Excel 97-200 (Data Only) format will only export the raw data without any formatting.
Please see below the difference between the exports for the same data using the 2
Excel formats and the Adobe PDF format.
This document and any information contained within is the sole property of Systems Technology Group, Inc. and is considered proprietary and confidential.
Revision 3.2.5
Page: 26
User Manual
Print
The Print report toolbar button functions very much alike the Export/Save functionality.
In fact the process really generates (just like the export) a PDF file that you can then
print. To do that, the system needs more information, and it collects it via a pop-up
window. Sometimes users set up their browsers, or use 3rd party software plug-ins that
block pop up windows. Please make sure you override the pop up blocker settings to
allow pop ups for this web site / application.
Once the button is pressed, the following window will be displayed.
This document and any information contained within is the sole property of Systems Technology Group, Inc. and is considered proprietary and confidential.
Revision 3.2.5
Page: 27
User Manual
Show/Hide report groupings
Certain reports (like the fixed route reports) will contain grouped data (like all the
information regarding a specific route is grouped together). The Show/Hide groupings
is a toggle button, meaning that if the groupings list is hidden (by default) it will display
it, and if it if visible it will hide it. If the list is visible (see below), you can use it as a
shortcut search and find navigation tool.
This document and any information contained within is the sole property of Systems Technology Group, Inc. and is considered proprietary and confidential.
Revision 3.2.5
Page: 28
User Manual
You can click on any of the groupings displayed in the list and the report will jump to the
page where that specific grouping starts. Furthermore, to make the grouping more
easily identifiable on that page, the grouping will be highlighted in yellow. See screen
capture above, where the Rte 104 was selected form the groupings list.
Turning off the grouping list will also remove the grouping highlighting.
VCR buttons for navigating across multiple pages of the reports
Similar to most other applications where navigation is possible across multiple pages,
the VCR buttons allow you to move across the pages present in the report. The
standard buttons available are first page, previous page, next page, and last page.
Depending on what page you are on, some of these buttons may be disabled. For
instance on the first page of the report, the first page and previous page are disabled
(because you already are on the first page, and there is no previous page to go to).
Similarly, on the last page of the report, the next page and last page buttons are
disabled (because there is no next page to go to, and you already are on the lat page).
Current page information
The current page information display information on what page you currently are on and
if there are any additional pages in the report.
The format used is either x / x+ where x is the current page you are one. This means
that you currently on page x of the report and there are more pages following (x+).
Another format is x / x which simply means that you currently are on page x of the report
and there are no more pages following (x is the last page).
This document and any information contained within is the sole property of Systems Technology Group, Inc. and is considered proprietary and confidential.
Revision 3.2.5
Page: 29
User Manual
Jump to page field and button
For easier navigation across pages, you can use the “jump to page” field and button ot
scroll multiple pages at the time.
Just enter the page you want to jump to and push the toolbar button next to the field.
Please note that if you enter a page number greater than the total pages in the report
(just like the image above) you will be jumped only to the last page of the report
Search report field and button
In case you need to find a specific piece of text or value in a report, you can use the
search functionality.
Once you enter the term you would like to search for, and click the search button, the
report viewer will attempt to find it. For better search capabilities we strongly suggest
exporting the report to a PDF format and using the Adobe Acrobat more powerful and
better performing search capabilities.
This document and any information contained within is the sole property of Systems Technology Group, Inc. and is considered proprietary and confidential.
Revision 3.2.5
Page: 30
User Manual
Zoom percentage
Generally used by visually impaired users, this feature will zoom the report contents to a
certain zoom factor that you select from the zoom drop down list.
Fixed Routes Reports
The fixed routes reports display fixed route information. The report selection
parameters are as follows:
The selection of along with the combination of the parameters will determine which
report is displayed.
Data type: determines if performance data or performance indicators will be displayed.
Route: determines if all routes or just a specific route will be reported on.
Period: determines which period’s data will be displayed.
Agency: determines which agency’s data will be displayed for the selected period. You
will be able to select only an agency that has approved data or the selected period.
This document and any information contained within is the sole property of Systems Technology Group, Inc. and is considered proprietary and confidential.
Revision 3.2.5
Page: 31
User Manual
This is a very important point: only approved data will be reported on, and no “data
entry” or “awaiting approval” data is available.
Report type: by default a single agency’s data will be reported, however agency
comparison is possible as well. See below.
When agency comparison is selected, the screen changes and allows you to select a
comparison period and comparison agency. This is most useful in comparing the same
agency’s data across different periods.
It is possible to compare a second agencies data as well. However (and this is a very
likely scenario), if the two agencies did not report on the same route, the second
agency’s data values will obviously be N/A – not available. However, this may not be
always the case (for instance when responsibility for a route changes from one agency
to another from one period to the next).
This document and any information contained within is the sole property of Systems Technology Group, Inc. and is considered proprietary and confidential.
Revision 3.2.5
Page: 32
User Manual
Variable Route Reports
The variable route reports display DAR/Paratransit, vanpool, etc. information. The
report selection parameters are as follows:
The selection of along with the combination of the parameters will determine which
report is displayed.
Data type: determines if performance data or performance indicators will be displayed.
Route type: determines if all variable route types or just a specific ones will be reported
on.
Period: determines which period’s data will be displayed.
Agency: determines which agency’s data will be displayed for the selected period. You
will be able to select only an agency that has approved data or the selected period.
This is a very important point: only approved data will be reported on, and no “data
entry” or “awaiting approval” data is available.
Report type: by default a single agency’s data will be reported, however agency
comparison is possible as well. See below.
This document and any information contained within is the sole property of Systems Technology Group, Inc. and is considered proprietary and confidential.
Revision 3.2.5
Page: 33
User Manual
When agency comparison is selected, the screen changes and allows you to select a
comparison period and comparison agency. This is most useful in comparing the same
agency’s data across different periods.
It is possible to compare a second agencies data as well. However (and this is a very
likely scenario), if the two agencies did not report on the same variable route type, the
second agency’s data values will obviously be N/A – not available.
Rollup Reports
The rollup reports will rollup and group ALL data for a specific period based on selection
criteria. These reports are available only to system administrators, and they are
available only for “full closed” periods, meaning that ALL agencies reporting for the
period have their data approved. This is done because the figures reported will not be
either complete or they may change if any individual agency’s data can change (be
rejected and revised).
This document and any information contained within is the sole property of Systems Technology Group, Inc. and is considered proprietary and confidential.
Revision 3.2.5
Page: 34
User Manual
The selection of along with the combination of the parameters will determine which
report is displayed.
Data type: determines if performance data or performance indicators will be displayed.
Period: determines which period’s data will be displayed. Only the “fully closed” periods
will be available in the drop down.
All Agencies Rollup
This report will rollup all the data from all the agencies and report the cumulative values
for each route type.
Rollup by Agency
This report will rollup all the fixed routes for each agency that has them and display
them.
Rollup by Route Type
This report will rollup all the fixed routes based on the associated fixed route type and
display the respective rollups.
Rollup by Route Name
As the name suggests, the report will rollup based on the route name (especially useful
if route responsibility is shared across and reported by multiple agencies
simultaneously).
Rollup for Unprotected Routes
This report rolls up all routes marked as unprotected and displays the calculated data.
This document and any information contained within is the sole property of Systems Technology Group, Inc. and is considered proprietary and confidential.
Revision 3.2.5
Page: 35
User Manual
Rollup for Protected Routes
This report rolls up all routes marked as protected and displays the calculated data.
Rollup by Contracting Agency
This report rolls up all routes assigned to a contracting agency and displays the rolled
up data for all contracting agencies.
This document and any information contained within is the sole property of Systems Technology Group, Inc. and is considered proprietary and confidential.
Revision 3.2.5
Page: 36
User Manual
User Notes
This document and any information contained within is the sole property of Systems Technology Group, Inc. and is considered proprietary and confidential.
Revision 3.2.5
Page: 37
User Manual
This document and any information contained within is the sole property of Systems Technology Group, Inc. and is considered proprietary and confidential.
Revision 3.2.5
Page: 38
User Manual
This document and any information contained within is the sole property of Systems Technology Group, Inc. and is considered proprietary and confidential.
Revision 3.2.5
Page: 39