1
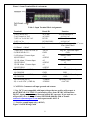
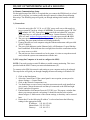
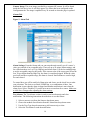
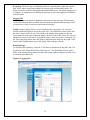
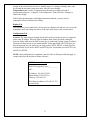
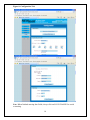
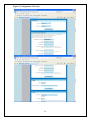
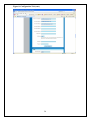
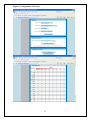
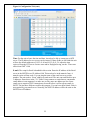
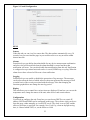
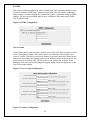
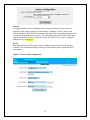
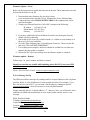
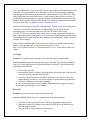
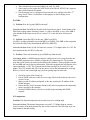
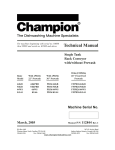
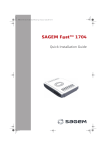
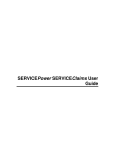
Site Power Monitor Installation/Operation Manual Model: SPM-200 TABLE OF CONTENTS Section Topic QUICK REFERENCE GUIDE I) OVERVIEW II) INSTALLATION III) SET-UP MONITORING & DATA LOGGING A) Remote Communications Setup B) Data Logging Only C) Web Browser Tabs Overview D) Browser Tabs (Specific Instructions) E) SNMP F) Text Message Set-Up IV) TROUBLESHOOTING V) SPECIFICATIONS VI) WARRANTY VII) INDEX Page 2 3 4 10 10 12 12 13 24 26 27 34 36 37 Firmware Update: We recommend visiting the website below and downloading the latest firmware if needed before placing the SPM-200 into service. See page 26 for instructions. www.newmartelecom/site_power_monitor/site_power_monitor.html M-SPM200 As of February 2010 1 Quick Reference Guide 2 I) Overview General Description Your NEWMAR Site Power Monitor, model SPM-200, web-enables and integrates intelligence to any site’s AC and DC power system for 24/7 monitoring, alarm condition notification, and data logging of vital electrical functions. All sensor inputs are programmable, accessible, and managed via the Internet: TCP/IP or SNMP. View current conditions and log 30 day history of DC and AC power status at remote sites before dispatching personnel. The SPM-200 is designed specifically for monitoring power supplies, rectifiers, batteries, converters, inverters, UPS, power distribution panels, and AC power at communication sites, base stations, outdoor enclosures and command vehicles via Ethernet or Wireless connection. The unit can be rack, DIN-rail, or wall mounted and is easily adapted to virtually any make of power system via nine sensor input ports which capture and stream critical data via the internet for analysis and logging of site history. Web page based programs are easily user configured for site parameters with up to 50 desired alarm conditions settings and multiple automatic notification options by e-mail, PDA, and mobile phone via text messaging. Sites without internet access can use the monitor solely as a data logging instrument that captures and retains a 30 day history file, ready for download to a spread sheet on a lap top computer during maintenance visits for recording site history and analysis of component performance and failure conditions. Monitors: In addition to a built-in temperature sensor, the SPM offers the following 9 sensor ports: Voltage DC: 3 Ports: • 2 each 0 to +40 VDC (Negative Ground), • 1 each 36-60 VDC (Positive Ground), typically -48V systems CAUTION: If you intend to power -48 VDC AND monitor -48 VDC, input power must come from an isolated DC converter. If you need one, we will provide it free of charge. Contact NEWMAR: 800-854-3906 or E-Mail: [email protected] and request model: 48-12-1i Kit • Accuracy ± 5% AC: 2 Ports: • 90-264 VAC utility power (L-N or L-L Single Phase) Floating • 90-264 VAC inverter output, Single Phase Note: This input can be used to monitor a second utility or generator source providing it's a Line to Neutral source with grounded Neutral which must be connected to "INV IN (GND)" Terminal # 4 WARNING! Inverter GND terminal 4 is common to all SPM grounds and returns. • Accuracy ± 5% DC: 1 Port: • 100 amp/100mV differential shunt voltage (shunt included) 3 • Read battery charge/discharge (-) current, or load current • Dry contact switch inputs: 3 ports • Possible uses: voltage loss, door open, water leak detection, smoke alarm, component failure, breaker trip, high temperature, etc. System Requirements To enable the full remote access feature requires: • Ethernet connectivity via RJ-45 plug • Static IP address Materials Provided The following items are provided with the SPM-200: Qty (1) Screwdriver (00 Philips) (1) Installation/Operation Manual (CD-ROM) and short form. (4) 1 Amp In-Line Fuse Assembly, P/N: 563-0498-0 (4) ACG-1 Fuse, P/N: 554-0100-0 (1) 100A/100mV shunt, P/N: 575-2000-0 (4) # 8 Sheet Metal, SS, Pan Head Screws, 1”. Phillips, P/N: 730-0816-2 (Mount SPM and Shunt) (2) DIN-rail (35mm) End Clamps, P/N: 701-0040-0 (1) CAT .5 Cross-Over Cable, P/N: 873-0048-0 Optional Accessories The following materials are optional (not provided) and are available through NEWMAR. Please reference part number when ordering. • Rack Mounting Kit, model: RM-SPM – 19 or 23”, P/N: 020-5091-0 • 48 VDC to 12 VDC Isolated DC Converter, model: 48-12-1i • Sensors Water Door/Window Open alarm Fire/Smoke Detector • Software Multi site monitor software – Model: 100 Site Software - SPM II) Installation Mechanical There are 3 methods of mounting: Wall, DIN-rail, and Rack. Regardless of method, please observe the following: free air flow (away from other equipments’ hot air exhaust so that the temperature sensor reads accurately). Indoor installation only! No exposure to rain, spray, or moisture. Plan your wire routing when considering location. Option A: Wall, Panel, or Inside Enclosure Mounting The SPM can be mounted on any flat secure surface (wall or tray) using screws through the four holes on the mounting tabs (#8 screws recommended). Orientation should provide access to the front panel terminal block. 4 Option B: DIN-rail Mounting The chassis supports DIN mounting via a 35mm rail at least 8 inches long. Installer needs to provide DIN-rail. Two DIN-rail end clamps, P/N: 701-0040-0 provided. Option C: Rack Mounting The unit can be rack mounted with Newmar optional 19” or 23” rack mounting kit, 2 RU (3.5 inches) tall, model RM-SPM, P/N: 020-5091-0. Wiring Connections for both operating power and sensor inputs are made to the terminal block on the front panel. The terminal block accommodates 16-22 gauge wire, and a small insulated screw driver is provided to ease your connection process. Do not over tighten screws. WARNING: All un-grounded voltage inputs to the SPM must be fused with a 1 amp in-line fuses, except for the A1, A2, and A3 switch inputs (floating contact), and the Is1 and Is2 shunt input (terminals 5 & 6). All returns and GROUNDS on the SPM are common with the –V DC input terminal. CAUTION: Do not make connections to the SPM with the power on, or with any live AC or DC sources! Refer to Figure 1 and 2 for details on the following steps. Each terminal block position has a reference number 9 abbreviated ID, and full description (see Table 1). CAUTION: Chassis Ground Stud: Connect to earth ground first! Stud size: #6-32 CAUTION: If you intend to power -48 VDC AND monitor -48 VDC, input power must come from an isolated DC converter. If you need one, we will provide it free of charge. Contact Newmar: 800-854-3906 or E-mail: [email protected] and request model: 48-12-1i DC Operating Power Input 9-60 VDC: Connect using 16-22 AWG wire. Connect your main DC power source to the –V and +V terminals being careful to observe proper polarity. A 1 amp fast blow fuse on the +V input is recommended for protection. The SPM draws approximately 200 m/A. DC Voltage Monitor Ports There are three ports total that monitor DC voltage. Two are rated for 0-40 VDC input, (terminals 15-16 and 17-18) and a third, (terminals 7-8) with inverse ground reference rated for 30-60 VDC input, intended primarily for neg. 48 volt telecom system use. Note all DC sense voltage ties to the SPM must share a common ground with the DC power source. CAUTION: If you intend to power -48 VDC AND monitor -48 VDC, input power must come from an isolated DC converter. If you need one, we will provide it free of charge. Contact Newmar: 800-854-3906 or E-mail: [email protected] and request model: 48-12-1i 5 DC Current Terminals 5 & 6 (Is1 and Is2) A 0-100mV DC shunt input and shunt are provided for measuring DC current (not provided ) Shunt can measure load current, rectifier current, battery current (charge and discharge), depending on where the shunt is installed in the power distribution system. Use 22 AWG twisted pair wires for best results and steady noise free readings. Install shunt in positive or negative lead. Polarity of the shunt output can be swapped to achieve desired positive or negative current flow indication. Dry Contact Switch Sensors Terminals 9-10, 11-12, 13-14. Connect up to three devices with switched alarm contacts (N/C or N/O) between A1 and A1 RTN. Assign user-friendly names on Display Tab on monitor that describe the specific functions of each circuit. Some examples include: Magnetic Door Switch, Rectifier Alarms, Smoke Alarms, Battery Temp Alarms, loss of voltage, contact relay closure, etc. Multiple switches can be installed in series, or paralleled in a string to a single input to the SPM. AC Voltage Monitoring Two ports are available for monitoring AC voltage sources: One for Utility line power, and a second for an auxiliary/back up source such as generator or inverter with floating output. Utility power: Connect AC voltage Line and Neutral to these input terminals 1&2. To measure and log AC voltages from 90-264 VAC, 47-63Hz. Fuse the Line side (hot) with a 1 amp fast blow fuse (provided). Auxiliary power: Connect to inverter output to measure a secondary AC source of 90264 VAC, terminals 3 &4. Fuse the line side (Hot) with a 1 amp fast blow fuse. Note: This input can be used to monitor a second utility or generator source providing it’s a Line to Neutral source with grounded Neutral which must be connected to “INV IN (GND)”, Terminal #4 CAUTION: Never connect the line side (Hot) of an AC source to INV IN (GND) or any RTN terminal on the SPM. Ethernet Connection Remote monitoring requires Ethernet connection via RJ 45 jack. Plug into the port on left side of unit. A solid green LED on the port indicates a link is established. A flashing green LED on the jack indicates activity (com). Temperature Sensor This sensor is located on the top right hand side corner of the SPM-200 when vertically mounted and senses ambient temperature. A protective guard prevents damage to the exposed sensor. Sensor Range: -40⁰C to +60⁰C/‐40⁰F to +140⁰F Accuracy: +/- .5% There are two adjustments which can be made to the Temperature Sensor, both are found on the SPM-200 static IP address. To make a change, pull up the SPM-200 static IP 6 address, either locally with a PC during configuration or remotely once the remote connection has been set-up. On the opening SPM-200 static IP address page, select DISPLAY on the left hand side of page. At the top of the Display page in the GENERAL section, you can make two adjustments to the Temperature Sensor: Temperature Unit – Select from the drop down menu to display temperature in Fahrenheit (factory default) or Celsius. Internal Temperature Offset – This adjustment is pre-calibrated at the factory. The offset is necessary only when the unit is operating in a very low air flow environment where internal board heating inside the SPM case causes the temperature to read slightly warmer than the outside or surrounding air. In certain installations where the SPM-200 experiences constant airflow around it, the Internal Temperature Offset can be reduced. Use the drop down menu to select a lower offset, or zero. (See Troubleshooting section F, “Temperature” for more information.) 7 Figure 1: Input Terminal Block Assignments Table 1: Input Terminal Block Assignments Terminal# 1) AC Line 90-264 2) AC Neutral AC Ref. 3) INV AC In 90-264 VAC 4) INV AC In 5) I Shunt 2 -100mV Board ID AC-LINE AC-NEU INVIN INVIN(GND)* Is 2 6) I Shunt 1 +100mV 7) NEG DCV (-30 to -60 VDC)** 8) GROUND Ref.*** 9) S/B Alarm 3 Contact Input 10) RETURN 3 11) S/B Alarm 2 Contact Input 12) RETURN 2 13) S/B Alarm 1 Contact Input 14) RETURN 1 15) +V3 IN (0 to +40VDC) 16) GROUND 17) +V2 IN (0 to +40VDC) 18) GROUND 19) GROUND (RTN) 20) +6 to 60 VDC (+PWR In) Is 1 −DCVs GND* A3 A3RTN* A2 A2RTN* A1 A1RTN* +V3IN GND* +V2IN GND* −PWRIN* +PWRIN Function AC Line Monitor #1 90-264 VAC AC Line Monitor #2 90-264 VAC Charge/Discharge or Load Current from 100A/100mV Shunt Neg. DC Volt Sense Input GND Alarm Contact #3 Alarm Contact #2 Alarm Contact #1 0 to +40 VDC Sense Input GND 0 to +40 VDC Sense Input GND Operating Power 0-60 VDC * CAUTION: Common to all input grounds and returns. ** Neg. DCV is not compatible with input voltages that are positive with respect to pin 8 GROUND. CAUTION: If you intend to power from -48 VDC AND monitor 48 VDC, input power must come from an isolated DC converter. If you need one, we will provide it free of charge. Contact NEWMAR: 800-854-3906 or E-mail: [email protected] and request model: 48-12-1i *** Positive ground inputs only (-48VDC) Figure 2: Install Wiring Guide 8 9 III) SET-UP MONITORING & DATA LOGGING A) Remote Communications Setup For the initial setup of the SPM, it is required that you connect the SPM directly to a local system (PC) or lap top, you cannot reach it through a network without first performing these steps. The following steps will guide you through making initial contact with the unit. 1) Connections 1. Power the unit with a DC 12, 24, or -48 VDC source wall wart or lab supply (or power system DC back-up voltage). CAUTION: If you intend to power -48 VDC AND monitor -48 VDC, input power must come from an isolated DC converter. If you need one, we will provide it free of charge. Contact Newmar: 800-8543906 or E-mail: [email protected] and request model: 48-12-1i 2. The green power indicator will illuminate. You will also notice that soon after powering, the green status indicator will blink periodically. 3. Connect the unit to a local computer using the Ethernet cross-over cable provided (P/N 873-0048-0). 4. The green Link indicator (on the Ethernet Jack) will illuminate if a good link has been established. If the indicator does not light, then check the connections and/or try a new cross-over cable. 5. The unit has now been connected to a local system; it is time to setup the network card, so that the system can communicate with the unit. 2) NIC setup (On Computer to be used to configure the SPM) NOTE: You need to assign a static IP address to enable remote monitoring. This is not provided with the SPM. Contact your network administrator (IT). To connect to the SPM, the network card setting on your computer needs to be adjusted. The steps below will guide you through changing the network settings in Windows XP. 1. Click on the Start button. 2. Select the Control Panel. If the control panel is not an option you may need to choose Settings → Control Panel. 3. Click on the Network Connections icon. 4. You should now see one of more icons that represent network cards installed on your system. Choose the network card that you connected to the SPM and right click it, and select Properties. 5. Find and double-click Internet Protocol (TCP/IP) icon. This opens a window that shows your current network card settings. It should be similar to the window shown in figure 2. Make a note of the current settings, so that they can be restored later. 6. Ensure that “Use the following IP address” is selected and enter the following settings in the appropriate fields. IP Address: 192.168.123.100 Subnet Mask: 255.255.255.0 Gateway: 192.168.123.1 10 7. Leave the DNS fields blank. Click the OK button on the TCP/IP window to save the changes. Then click OK on the Local Area Connection window to finalize the process. Figure 2 – Laptop NIC Settings for Unit at Default IP 3) Connecting to the SPM Once the network settings have been adjusted you can connect to the unit using a browser. 1. Open a web browser. 2. Type in http://192.168.123.123 in for the address. (Refer to label on unit, see step 2.6) 3. You should get a screen that looks like figure 3. 4. If so, you are able to connect to the SPM. To configure the IP address on the unit, refer to the Configuration tab section. 5. If not, refer to the TROUBLE SHOOTING section. IP Settings Reset: Pressing and holding the small square button directly below the RJ-45 jack on the SPM for 15-20 seconds will restore the interface to default of 192.168.123.123 and will reset all passwords. Use this reset button if the IP address or passwords have been lost. 11 B) Data Logging Only Using the cross-over cable, plug into laptop and set-up sensor names (Display Tab), alarm thresholds (Alarms Tab). Be sure and set the local time on the system clock or logging will not be enabled. Figure3: Main Webpage Screen C) Web Browser Tabs Overview Sensors: This is the main screen. Here you can see the current values for the sensors that are attached to the unit. For each device there is a graph that shows trends in the data. Sensor on-screen ID’s can be changed to reflect your particular system set-up. Alarms: The alarms tab lets you set the range of acceptable values for a sensor. You select the method the unit will use to notify you if the sensor goes outside of this range. There is also an option to send test alarms for each sensor. An event log is also included on this page that keeps a record of log messages from the SPM. Logging: On this screen, you get a graph for a selected group of sensors and a certain time frame. You can also download log data from this page and set the logging interval. Display: Use the display tab to change the default names of the devices. On this page you can also see devices that are unplugged or unavailable. You are given the option of removing them from memory. On the display page, you set the temperature unit. (C or F, and Offset). Configuration: The configuration tab is used to configure the main features of the SPM, including email, SNMP, user accounts, and an IP camera. From here, you can choose DHCP or set a static IP address. SMTP and SNMP can be configured on this page. The real time clock can be set from this page, either manually or via an SNTP server. The 12 clock is set to GMT and the offset to local time is specified. For example, New York City, when on daylight saving time, is 4 hours behind GMT; so, set the offset to -4:00. D) Browser Tabs Sensor Tab Figure 4: Sensors Tab Current readings: The current values for each sensor are displayed on the Sensors page. These are updated automatically every 60 seconds. For a faster update hit the Refresh button on your browser. Sensors are grouped together by device. Only devices that are currently available will show up on this screen. Unplugged devices will not. The internal sensors are displayed in the first box, with the other device boxes following. Graphs: In each device box there is a line graph showing the trend of the sensors for that device. The colors on the graph match with the color box next to each sensor. If a sensor does not have a color box next to it, then it will not be graphed. The X-axis (Horizontal) shows time and the Y-axis (Vertical) shows value. The value axis will change scale to keep the graph data within the graph window. Alternate Formats: The Alternate Formats links are used to get information from the SPM in a variety of formats. PDA – A small version of the Sensors page, used on PDA’s and cell phones. WAP – A special version of the Sensors page, used by WAP enabled cell phones. XML – The current data, along with device information, displayed in XML. MIB – Check on this link to download the MIB for the SPM. Used in SNMP. 13 Camera Image: This is an image provided by a supported IP camera. It will be found inside the first device box. It will only appear if a camera has been configured on the Configuration tab. The image is updated every 20 seconds or when the page is updated. Alarms Tab Figure 5: Alarm Tab Alarm Settings: From the Alarms tab you can setup the unit to notify you if a sensor’s value goes outside of an acceptable range. There are up to 50 unique alarm settings, and for each alarm there is a Low Trip, High trip and Alarm State. Use the low and high trips to set the acceptable range for the sensor. If the current value of the sensor goes below the Low Trip or higher than the High Trip, the alarm is considered tripped. When the value goes back into the acceptable range, the alarm is cleared. Notifications are sent for high, low and cleared. To control how you will be notified of alarm trips and clears, use the check box to make your selections. The choices are Email, SNMP trap, or a combination of these. One notification is sent when the alarm is tripped and another notification is sent when the alarm clears. Select “Disabled” if you do not want to set an alarm for a sensor. Make sure to click Save Changes after adjusting the alarm settings. Test Alarms: The Test Alarms section is used to send test alarm trip and clear notifications. The following instructions describe how to use this feature. 1. 2. 3. 4. Select a sensor to test from the Sensors drop-down menu. Choose the method of notification from the Alarm State drop-down menu. Use the Trap Type drop-down menu to pick between trip or clear. Select the Test button to send the notification. 14 Event Log: The Event log is a chronological list of events that have taken place on the unit. This is where errors and warnings are listed as well as alarm notifications. The Event Log is also useful for debugging email and SNMP issues. The default logging level is Verbose. To change this use, the drop-down menu to select the logging level and then click Set Mode. Logging Tab From this tab you can enable or disable the generation of log messages. The messages can be selected on the basis of which software subsystem generates the message as well as on the basis of the severity associated with the message. Graph: On the Logging Tab is a set of controls for the Logs graph. You can select sensors and the time span to use for the graph. The Y-axis shows the sensor values and the time is shown on the X-axis. The legend at the bottom of the graph provides the sensor name for each color used on the graph. On the left side of the screen is a series of checkboxes, one for each sensor. To graph the sensor, make sure its box is checked. Use the Time range drop-down above the graph to adjust the time range for the graph. Click on an Update Graph button to get a new graph, when a change is made. Download Logs: To download the log history, select the “Click here to download raw log data” link. The log file is in CSV format and will be called “log.csv”. This download can take quite a while, if the unit has been running for some time. Open, analyze, and process with excel as a normal spreadsheet file. Figure 6: Logging Tab 15 Logging Frequency: The SPM saves log data on a set interval, every 30 seconds for max number of days that can be logged. The data log is a circular buffer. Once it fills up, old data is overwritten by the newer data. (FIFO). Typically, all functions can be logged simultaneously for 30 days without loss of data. Delete Logs: To clear the log data, check the Delete Log History checkbox and click on the Save Changes button. In a few seconds the graphs should clear and graphing will resume in a few minutes, depending on the logging frequency. Figure 7: Display Tab Friendly names: On the Display page is a list of the friendly names for each device attached to the unit. If the SPM has I/O sensors, the friendly names for these can be 16 located in the section below the device friendly names. To change a friendly name, edit by clicking the box and re-enter new name, and click save changes. Temperature Unit: Use the Temperature drop-down box to change the unit of measurement (degrees C or degrees F) for temperature. Then select Save Changes to finalize the change. If the displayed temperature reads higher than actual ambient, you may select a temperature offset to calibrate the reading. Display Tab This tab allows you to control how various items are displayed. From here you can set the temperature unit, and change the names of the unit, other devices and certain sensors. Configuration Tab Network: The main network settings for the unit can be set in this section. To assign the unit a static IP address, fill in the Static IP address field, Static Net Mask, and Static Gateway fields. Make sure the DHCP check-box is unchecked if using a static IP address. The next two drop-downs let you enable/disable Telnet and SNMP. The HTTP Services drop-down menu lets you choose if you want to allow HTTP, HTTPS, or both. The last two input fields let you set the HTTP and HTTPS ports. The default port for HTTP is 80, and 443 for HTTPS. NOTE: Once configuration is completed, enter all codes on label provided and apply to conspicuous place on the unit for future reference. SPM Firmware Settings Static IP (assigned by user) __________ NIC: IP Address: 192.168.123.100 Subnet Mask: 255.255.255.0 Gateway: 192.168.123.1 Web Browser address: 192.168.123.123 (reset default) 17 Figure 8: Configuration Tab Note: When finished entering data fields, always click on SAVE CHANGES to avoid re-entering. 18 Figure 8: Configuration Tab (cont.) 19 Figure 8: Configuration Tab (cont.) 20 Figure 8: Configuration Tab (cont.) 21 Figure 8: Configuration Tab (cont.) Time: For the unit to know the time and date, it needs to be able to connect to an NTP server. The IP address for two servers can be entered. If these fields are left blank the unit will use the default addresses of 192.5.41.40 and 192.5.41.41. To adjust the time retrieved from the NTP server for time zone and/or Daylight Saving, use the “Time-zone offset from GMT” field. E-mail: The setup for Email is handled in this section. Enter the IP address of the Email server in the SMTP Server IP Address field. This needs to be in the numeric form. A named version will not work. You can ping the name of the email server to get this number. The unit needs a “From” address to send email. The unit can send email to up to 5 addresses. Enter these in the “To” fields. Using commas or semicolons to concatenate email address is not supported, so make sure to only enter one address per line. Some email servers require a POP3 connection to be made before it will accept an email via SMTP. The last three fields are used for this purpose. You can leave these blank, if this is not required by your email server. Normally, the POP3 IP address will be the same as the SMTP Server IP address. 22 Figure 9: E-mail Configuration HELP Sensors Under this tab you can view live sensor data. The data updates automatically every 30 seconds, but you can reload the page in your web browser to see any new data within shorter intervals. Alarms From this tab you can define alarm thresholds for any device-measurement combination and select who will be notified when the alarm threshold is crossed and how that notification will occur. You can also disable alarm notification from this tab. Notification is configured on a per alarm basis and can be via e-mail, SNMP trap, or syslog. When the alarm clears, those selected will be sent a clear notification. Logging From this tab you can enable or disable the generation of log messages. The messages can be selected on the basis of which software subsystem generates the message as well as on the basis of the severity associated with the message. Note that changing the functions graphed does not change the max log period. Display This tab allows you to control how various items are displayed. From here you can set the temperature unit, change the names of the unit, other devices and certain sensors. Configuration Use this tab to configure the unit. From here you can choose DHCP or set a static IP address. SMTP and SNMP can be configured on this page. The real time clock can be set from this page, either manually or via an SNTP server. The clock is set to GMT and the offset to local time is specified. For example, New York City, when on daylight saving time, is 4 hours behind GMT; so, set the offset to -04:00. 23 E) SNMP This section is used to configure the unit for SNMP traps. The community string for traps can be set using the SNMP Trap Community String field. This only sets the community string for traps. Currently the unit only supports the “public” community string for SNMP requests. The unit can send SNMP traps to up to 4 addresses. Enter these in the SNMP Trap IP address fields. Figure 10: SNMP Configuration User Accounts Use the Name and Password section to control access to the unit. There are three levels of access. The highest is admin, which allows full access to the unit. The second level of access is Control. This allows access to the Sensors, Logs and Control tab. Control access also lets the user change the logging frequency and delete the logs from the Logs tab. The lowest access level is Read-only. The user can view the Sensors and Logs tab. At the Read-only level, the user can not change the logging display nor delete log history on the Logs Tab or alarm settings. Figure 11: User Account Configuration Figure 12: Camera Configuration 24 Camera If a supported IP camera is configured in this section, the image from the camera is displayed in the Sensors tab page. Put the numeric IP address of an IP camera in the Camera IP address field. Select the camera model from the list of supported camera in the Camera Model drop-down menu. Note: The camera does not connect to the SPM-200, it must be connected to a router. If both IP camera and SPM-200 are to chose a single IP address see figure 14, pg. 27 Device Information from the fields in this section is displayed in the footer of each webpage. Normally, this is information helps identify the SPM and the person responsible for its maintenance. Figure 13: Device Info Configuration Unit Location: Newmar Admin: Jay Mendoza or Call 800-854-3906 Support: [email protected] or Call 714.751.0488 Copyright © 2003, 2009 Newmar, Inc. All Rights Reserved. Admin Info 25 Firmware Update - Local Below are the instructions to update the firmware on the unit. These instructions can also be found in the firmware zip file. 1. Download the latest firmware for your device from: www.newmartelecom.com/Site_Power_Monitor/Site_Power_Monitor.html 2. Connect the unit with a CROSS-OVER CABLE to the computer that will be used for the update. 3. Change your Network Interface Card's (NIC) settings to the following: IP address 192.168.123.100 Subnet Mask 255.255.255.0 Gateway 192.168.123.1 4. If you have enabled the built-in Windows firewall or any third-party firewall, disable it before continuing. 5. Extract the zip file to an easy to find location (i.e. a folder on your desktop or at the root level of your hard disk) 6. Go to the SPM configure page, “Upload System Firmware”. Browse to the file and click “UPLOAD NEW FIRMWARE” 7. If everything works properly, the device should be available for use about two minutes after the update is complete. 8. Restore the NIC's previous settings once the firmware update is complete. Firmware update – Remote Follow steps 5-8, wait 5 minutes, and then re-connect. Should you run into any trouble while updating, please DO NOT reset your SPM and contact us at: Phone: 800-854-3906 • E-mail: [email protected] F) Text Message Set-Up The SPM can send text messages by sending emails to a special address at the cell phone provider. Below is a list of addresses for some popular providers. For example, if you have cell service with AT& T, you can send a test message by sending an email to [email protected], where xxxxxxxxxx is your cell phone number. Simply enter this data in “To Email address 1-5”, and save. Note: you will need to select under the ALARMS tab which alarms are to be routed to this email to receive a text message. SMA Thru Email Paths: T-Mobile: [email protected] Virgin Mobile: [email protected] Cingular: [email protected] Sprint: [email protected] 26 Verizon: [email protected] US Cellular: [email protected] SunCom: [email protected] Powertel: [email protected] AT&T: [email protected] Alltel: [email protected] Metro PCS: [email protected] Nextel: [email protected] Universal Format: [email protected] IV) Troubleshooting A) Connecting to the SPM 1) Problem: I cannot get the webpage for the unit. Corrective Action: 1. If DHCP is enabled, the IP address for the unit may have changed. Check with the DHCP server to find out the current IP address for the unit. 2. If the IP address of the unit was changed by DHCP or by the Configuration tab, make sure to use the new IP address to connect to the unit. Even if the IP address was changed, the unit can still be reached at 192.168.123.123. 3. Check the connections to the unit and the network. The power and link indicators should both be on and stable. The activity light should blink periodically. If the power light is not on, check the connection on both ends. If the link light is out then check the network cable connections. A cross-over cable should be used for connecting directly to a computer and a straight-through should be used for connecting to a network. 4. Ensure the network card settings are appropriate for the IP address of the unit. The recommended network settings for a unit at the default IP address are IP Address: 192.168.123.100 Subnet Mask: 255.255.255.0 Gateway: 192.168.123.1 5. Try to contact the unit using ping, telnet or ftp. For instance at the default IP address these commands would look like the following: ping 192.168.123.123 telnet 192.168.123.123 ftp 192.168.123.123 If the unit is not at the default IP then the correct IP address would need to be substituted for the 192.168.123.123. 6. If the unit is still unreachable, it may be on a different subnet, could be blocked by a firewall, or a proxy could be preventing access. These are networking issues beyond the scope of this document. 2) Problem: Uploaded latest firmware, then unable to open the web page or unable to upload firmware. 27 Corrective Action: Press the IP-Reset button located beneath the RJ45 jack. Re-enter IP addresses under ‘config’ tab. 3) Problem: SPM-200 has been configured with IP address, subnet mask, etc. but unable t o communicate with SPM. Corrective Action: Press the System Reset button located to the left of the terminal block. B) Static IP Address Problem: I do not have a static IP address available at the site of installation. Corrective Action: How to connect the SPM to the Internet without a static IP address. One option is to utilize services offered by www.dyndns.com along with a Linksys WRT54G Router to allow external users to access the web server. Other services and other routers use a similar approach. For a home or small office installation, Internet service is provided by a telephone or cable company using a DSL modem or a cable modem. The modem is connected to the Linksys router using 10baseT or 100baseT Ethernet. Local machines including the SPM are in turn connected to the router using Ethernet as well. Figure 14: Local Network and Router The local machines, including the local port of the router, are assigned addresses in a private domain such as 192.168.123.XXX. The external port is assigned a dynamic address by the Internet provider’s Distributed Host Configuration Protocol (DHCP) server. The dynamic IP address works fine for most typical applications that might be run in a home or small office environment, such as web surfing or checking email, but it presents a problem when using a server, such as the SPM. If people want to connect to the server/SPM from somewhere on the public Internet they need to know an IP address that they can use to reach it. Normally they find this address using the Internet’s Domain 28 Name Service (DNS). But if our server’s address changes whenever the DHCP server changes it, then the regular DNS service can’t keep up with it. www.dyndns.com offers a service that will solve this problem. What Dyndns does is allow you establish a URL in one of their domains, and they keep up with changes to your IP address. Your URL is something like www.myUrl.dyndns.biz. When you enter that into a browser Dyndns redirects the request to your current IP address. In order for this to work you have to have a client program on your device that updates Dyndns whenever your provider changes your IP address. In the local network example, you want to be able to reach the SPM’s Web Server from the public Internet. There are two issues: 1) The Web Server is behind a local router, and has an “unrouteable” IP address. 2) The IP address of the router is assigned by the Internet Provider’s DHCP server, and thus may change without warning. There are three things that have to be done to solve the problem. The first is to use the Dyndns service to make the IP address of the router available to users on the public Internet. The second is to program the router to forward requests for web pages to the SPM, and the third is to configure the SPM. To set up the Dyndns service, go to www.dyndns.com, preferably from a PC on the same subnet as the SPM you want to access from the Internet. Under the “Services” heading select “Free Dynamic DNS”. Select “Get Started”, and create a new account. Select one of their domains, such as www.dyndns.biz and select a hostname for your router, such as “myRouter”. If you do this from a PC on the same subnet as your SPM, Dyndns will pick up your router’s current IP address automatically. Once you complete this process Dyndns will be ready to forward users to your server. Once you have Dyndns set up, you need to set up your router. Consult the manual for the Linksys router for instructions on how to log in to the Admin account. The Linksys software includes the client utility it needs to connect to Dyndns. On the “Setup” screen, choose the “DDNS” tab. Pull down “Dyndns.org” as the service you want to use. You will be prompted to enter the User ID and Password you set up, as well as the hostname you assigned to your router. The router should connect to Dyndns at this point. If it cannot, you may have not set your account up properly, or entered the wrong User ID or Password. 29 The next thing you must do is set up something called “port forwarding”. Dyndns will forward a user’s request to the router; you need the router to forward the request to your SPM. Go to the router’s “Applications and Gaming” tab. This page tells the router to forward requests that come to it using certain protocols on certain ports to be forwarded to specific machines on the local network. You need to forward http and https to your SPM. On the first line under “Application” enter http. The default port number for http is 80. Enter the IP address of the SPM on your network. In the example network shown on the first page this address is “192.168.123.200”. (You will assign this address to the SPM when you set it up). On the second line enter “https” (secure http). The default port for https is 443. Again, enter the IP address of the SPM. Be sure and save the settings before you exit. 30 Note: some ISPs block access to port 80. If yours is one of them, you’ll need to use some other port. Valid port numbers are in the range 0 to 65535, but to be totally compliant with the rules of the Internet you should pick a number between 49152 and 65535. This reduces the chance that some other service is also using the same port that you pick. If you do pick a number besides 80, you must configure the SPM to listen on the same port number, and to reach the SPM from the internet you will have to append the port number you chose to the URL, as in http://myRouter.dyndns.biz:49152. Lastly you must configure your SPM. Navigate to the “Config” page. Scroll down to the “Network” section, and assign the same IP address that you entered on the port forwarding page. The Gateway needs to be set to the IP address of the router (192.168.123.1 in our example). In the “Web Server” section, set the ports for http and https. Again, the defaults are 80 and 443, but if you selected different port numbers when you configured your router, enter the same numbers you selected there. Again, be sure to click on “Save Changes”. Once you have completed these steps, your server should be reachable from the public Internet. Note that the URL is http://myRouter.dyndns.biz, NOT http://www.myRouter.dyndns.biz. Do not include the “www” in the address; that is not correct. C) Graphs Problem: The graphs do not look right. They show dots, gaps, or appear blank. Corrective Action: Sometimes the log data can get corrupted. This will cause graphing issues. To fix this problem you will need to delete the log history. The following steps will explain how to do this. 1. Click on the Logs tab. 2. Download the logs by clicking on the appropriate link on this page. Skip this step if you do not need a backup of the log data. 3. Check the Delete Log History checkbox. If this box is grayed out, refer to the troubleshooting section on a grayed out logging frequency/delete logs checkbox. 4. Select Save Changes to delete the log history. In a few seconds the graphs should go blank. Depending on the logging frequency, the graphing should begin in a few minutes. D) E-mail Problem: I have not been able to get email from the unit. Corrective Action: Below are some common solutions to email problems. 1. Check the Event Log for email errors. This may help diagnose the problem. 2. Make sure a numeric IP address is used for the SMTP Server IP address (and POP3 IP address if used). 3. The unit needs a ‘From’ address to send an email. 31 4. There should only be one email address in each ‘To’ field. 5. Some email servers require the POP3 fields to be filled in. If POP3 isn’t required these fields should be left blank. 6. If an Exchange server is being used, then it needs to be configured to allow 3rd party emails. There is a checkbox for this purpose in the Exchange server configuration. E) SNMP 1) Problem: How do I get the MIB for the unit? Corrective Action: The MIB for the unit can be found in two places. In the header of the SPM-200 webpage under Alternate Formats, is a link to the MIB. A copy of the MIB is also included in the firmware zip file of version 2.53 (is this the latest version) and higher. 2) Problem: I need the OID’s for the unit. (What’s an OID?) An OID is an Object Identifier used with MIB’s for SNMP. Click MIB on the navigation bar below the Help Tab to download the MIB files (MIP.ZIP) Corrective Action: In the zip file for firmware versions 2.53 or higher there is a CSV file that contains the list of OID’s for the unit. 3) Problem: I have not been able to get a SNMP trap from the unit. Correction Action: A SNMP manager must be configured to receive traps from the unit. Most SNMP programs have a database of traps they are monitoring for. The possible traps that can be sent by the unit must be added to this database. Some programs can take the unit MIB and extract the trap information. With other programs the trap data has to be entered manually. A CSV file is included in the firmware zip file of version 2.53 and higher. The CSV includes the OID’s for the unit as well as the information for each trap. Below is a list of issues that might stop you from getting traps from the unit. 1. Check for errors in the Event Log. 2. Not all SNMP software is able to receive traps. Check if the software can receive version 1 traps. 3. Make sure the IP address configured on the unit, matches the IP address of the SNMP manager. 4. Ensure that the Trap Community String on the unit corresponds to the community string expected by the manager. 5. On some SNMP software, you have to enable trap monitoring and SNMP requests. F) Temperature Problem: The internal temperature on my unit seems to be reading high. Corrective Action: The internal temperature can read 2-3° F higher than an external sensor, because of the heat generated by the circuits in the unit. The following steps can help minimize internal heating. 32 - Go to DISPLAY, and set the desired temperature offset, and SAVE. - Make sure there is good airflow to the unit. - Heat can be transferred to the unit from other sources and through the rack. If possible mount the unit away from heat sources. G) Logging Frequency/Delete Logs Grayed Out Problem: I want to change the logging frequency or delete the logs, but they are grayed out. Corrective Action: An account level of Control or Admin Access is required to change the logging frequency period or delete the log data. It will grayed out if the current access level is not high enough. To change this, do the following: 1. To change to Control access click on the Control tab. For Admin click on Configuration. 2. Enter the appropriate username/password for the appropriate account. 3. Click on the Logs tab and the Logging Frequency and Delete Log History checkbox should not longer be grayed out. Note: IP Reset Button The IP Reset Button, located under the RJ45 connector, has two functions: 1) If you hold it down while you power up the unit, all of the user-configurable parameters are reset to the factory defaults. 2) If you hold it down for 20 seconds while the power is on, it resets the IP address to 192.168.123.123 and the subnet mask to 255.255.255.0 and clears out any user IDs and Passwords that you have set. This is useful if you have forgotten the IP address you set. Console Monitor Software Option: • • • • Consolidate data from many units into a single web interface Combine log data and push firmware updates to several units at a time Easily set alarm levels for a list of units Available from NEWMAR 33 V) Specifications Inputs Power Source Voltage: 9-60 negative / positive ground*, 250 mA max CAUTION: If you intend to power -48 VDC AND monitor -48 VDC, input power must come from an isolated DC converter. If you need one, we will provide it free of charge. Contact NEWMAR: 800-854-3906 or E-mail: [email protected] and request model 48-12-1i Kit Monitor Inputs: 9 total Voltage: DC: 3 ports: 1. 2 each 0-40 VDC, Negative Ground 2. 1 each 36-60 VDC, Positive Ground 3. Accuracy +/- 5% AC: 2 ports: 4. 90-264 VAC utility power (L-N or L-L) 5. 90-264 VAC inverter output (floating) 6. Accuracy +/- 5% • DC current one port: o +/- 100mv, 100 amp differential shunt voltage, o Read battery charge/discharge (-) current, or load current. o Accuracy +/- 5% • Dry contact switch sensors, 3 ports o Possible uses: include: door open, water leak detection, smoke alarm, component fail, breaker trip, etc. • Temperature sensor o Located outside case of unit o Range -40 to +60 C, -40 to +140 F o Accuracy +/-0.5 C, Reporting • • • • • • • • • • Ethernet Port connection: RJ-45, 10/100 autosense HTTP-Web Access, Self-generated Web-page SNMP-MIB with Gets, Traps, and Clears Alarms-HIGH and LOW trip, 50 max, user-programmable Logging-Excel logs created, time stamped, continuous graphing SMTP/POP3 - email alerts, POP password Data Formats: XML, PDA, WAP (cell phone) Optional Console-Multiple Site Monitor with log aggregation and thumbnail camera views Remote Firmware upgrades-no need to visit the site. Local Data downloading and programming require and RJ-45 crossover cable (not included) 34 Data Screens: • Sensors • Alarm settings (customized web page) • Data logging • Camera feeds (4 max.) Data logging: remote or down load locally: • 30 day+ rolling history with 30 second interval refresh • CSV file compatible Images: Ethernet IP Camera enabled Alarms: • 50 user configurable all with separate high/low trip settings • Notification by Via Internet, e-mail or mobile phone • User-programmable notification to 5 different e-mails addresses Diagnostics / Indicators/ Controls: Front panel LED’s: • Input Power ON/OK • System OK • Flashing Activity Indicator Ethernet port • System reset button Protections: • Reverse Polarity • Input overvoltage • External 1A fast-blow fuse required for DC power input (provided) Mechanical: Case: Aluminum, black powder coat Size: 2.18” x 3.27” x 4.66” Weight: 1 lb Mounting options: • Wall mount • Din rail • 19 or 23 inch rack mount (via optional kit) Input Ports: • Screw terminals • 14-26 AWG wire Environmental: Operating Temperature range: -20⁰ C to +60⁰ C 35 VI) Warranty Product Registration NEWMAR warrants that your Site Power Monitor be free from defects in material and workmanship for two years from date of purchase. If you wish to register your product with us and provide comments or questions, please log onto www.newmarpower.com/product_registration.html or for immediate response to your questions or comments, please call tech service at 1-800-241-3897 or E-mail: [email protected]. Warranty Information If a problem with the SPM-200 persists after you have applied the outlined solutions from the TROUBLESHOOTING section, or if you have any questions about installation and proper operation of the unit, please contact NEWMAR’s Technical Service: Phone: 1-800-241-3897 – From the hours of 7:30 A.M. to 4:30 P.M. weekdays, P.S.T. Fax: 714-957-1621 – Anytime E-Mail: [email protected] – Anytime We are happy to consult with you to resolve any problems or questions you may have. If , during consultation, it appears the SPM-200 must be returned to the factory for repair, we will issue a Return Materials Authorization (RMA) number at that time. 36 VII) Index Page No. Activity LED 2 AC Voltage Monitoring 6 Alarms 14 Ambient Temperature Sensor 6 Camera 25 Camera Configuration 25 Configuration Tab 17-26 Connecting to SPM 11 Console Software 33 Data Logging 12 DC Input OK LED 2 DC Power Input 5 DC Voltage Monitoring 5 DHCP 12 DIN-Rail Mounting Option 5 Display Tab 17 Earth Ground Stud 2 Ethernet Connection 6 E-Mail 22 Event Log 14 Firmware Update 26 Friendly Names 16 Graphs 15 Input Terminal Block 8 Install Wire Guide 9 Installation 4 Interface Type 12 Inverter 6 IP Address 10 Link Activity LED 2 Link LED 2 Logging/Logs 15 Logging Frequency 15 MIB 13 Mounting Flanges 4 Network 17 NIC Set-up 10 OID 32 Operating Temperature Optional Sensors Overview PDA Ping Power Source/Consumption Product Registration Quick Reference Guide Rack Mount Option Remote Communication Set-up Reset Button, IP Reset Button, System Sensors Shunt SNMP Static IP Subnet Mask Specifications Tech Support Telnet Temperature Offset Adjustment Temperature Sensor Text Message Set-Up Time Troubleshooting User Account Configuration Utility Power Video Camera WAP Warranty Web Browser Tabs: Sensors Alarms Logging Display Config. Help Wiring 37 Page No. 35 4 3 13 27 34 36 2 5 10 2, 11 & 28 2 & 28 13 5 11, 24 10 10 33 36 27 32 2&6 26 12 27 24 6 25 34 36 13 14 15 17 17 23 5