1
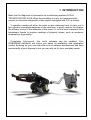
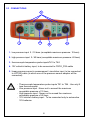
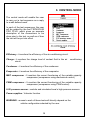
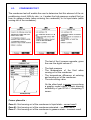
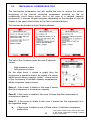
DIAGNOSTIC TOOL FOR AUTOMOTIVE
AIR CONDITIONING CIRCUITS R134a
TECNOCLIM PRO PLUS
For monitoring and diagnosis help of
automotive air conditioning circuits R134a.
USER GUIDE
Warranty : 2 years parts and labour
Document n° 0240247-V1
WARNING : risk danger (see user guide)
Warranty : 2 years parts and labour
Document n° 0240247-V1
PRECAUTIONS REGARDING THE USE OF THE EXOCLIM INTERFACE AND
COOLANT FLUID R134A
¾ This tool has been exclusively designed for professional operators who
must know about the principles of refrigeration, cooling systems, gas
coolants and the damage that can occur due to devices under pressure.
¾ Read this booklet carefully
¾ This unit may not be used with any coolant different from the one it has
been designed for.
¾ Before starting any operation, make sure that the flexible hoses used do
not contain non-condensable gases.
¾ Avoid inhaling steam coming from gas coolants.
¾ Use appropriate protection measures, such as eye protection and gloves;
direct contact with the coolant may cause blindness and other physical
damage to the operator. The coolant’s low boiling temperature
(approx. -30 ° C) may cause frostbite.
¾ Do not work near open flames and hot surfaces; coolant gas decomposes
at high temperatures and releases toxic and aggressive substances,
harmful for the operator and the environment.
¾ Use the tool in areas with suitable ventilation and good air circulation.
¾ Before disconnecting the tool, make sure that all valves are closed. By
doing so you will prevent the coolant from dispersing into the atmosphere.
¾ The tool must always be used under the supervision of the operator.
¾ Do not use the interface near explosive gas, steam or dust.
¾ Respect the measurement peaks indicated on the interface.
¾ Check correct operation of the TECNOCLIM PRO PLUS by measuring
known values. If in doubt, have the tool checked.
3
SUMMARY
1
INTRODUCTION ....................................................................................................................................................... 5
2
TECNOCLIM PRO PLUS CARRYING CASE - DESCRIPTION ........................................................................ 6
2.1 CONTENT’S DESCRIPTION ....................................................................................... 6
2.2 FRONT PANEL............................................................................................................ 7
2.3 CONNECTIONS .......................................................................................................... 8
3
CONNECTING ........................................................................................................................................................... 9
4
USE ............................................................................................................................................................................. 10
4.1
4.2
4.3
4.4
5
STARTING UP THE APPLICATION .......................................................................... 10
AIR CONDITIONING MENU ...................................................................................... 11
VEHICLE CONFIGURATION .................................................................................... 11
ARCHITECTURE OF THE AIR CONDITIONING FUNCTION.................................... 12
MEASUREMENT MODE ....................................................................................................................................... 13
5.1 « DISPLAYERS » MODE .......................................................................................... 13
5.2 « GRAPHIC » MODE ................................................................................................. 14
5.3 « DETAIL » MODE .................................................................................................... 15
6
CONTROL MODE ................................................................................................................................................... 18
6.1
6.2.
6.3.
6.4.
6.5.
6.6.
EFFICIENCY TEST ................................................................................................... 19
LOAD TEST ............................................................................................................... 20
CONDENSER TEST .................................................................................................. 21
EVAPORATOR TEST ................................................................................................ 22
MECHANICAL COMPRESSOR TEST ...................................................................... 23
PWM COMPRESSOR TEST ..................................................................................... 24
6.6.1.
6.6.2.
« Measuring » function ............................................................................................................................... 24
« Simulation » function ............................................................................................................................... 25
6.7. 0-5V PRESSURE SENSOR TEST............................................................................. 26
6.7.1.
6.7.2.
7
« Measuring function » ............................................................................................................................... 26
«Simulation » function ................................................................................................................................ 27
AUTO. DIAGNOSTIC MODE ................................................................................................................................ 28
7.1. DIAGNOSIS PROCEDURE ....................................................................................... 28
7.2. PROCEDURE INTERRUPTIONS.............................................................................. 33
8.
MANAGING SAVED DATA ................................................................................................................................... 35
RECORDS – MEASUREMENT MODE .............................................................................. 35
RECORDS – AUTO. DIAGNOSTIC MODE ........................................................................ 35
OPENING A RECORD ....................................................................................................... 35
9.
CONNECTING THE TOOL TO A PC .................................................................................................................. 37
10.
DOWNLOADING AND PRINTING OF RECORDS ........................................................................................... 40
PRINTOUT SAMPLE –MEASUREMENT MODE ............................................................... 46
PRINTOUT SAMPLE – AUTO DIAGNOSTIC MODE ......................................................... 47
GLOSSARY .......................................................................................................................................................................... 48
WARRANTY ........................................................................................................................................................................ 49
SPECIFICATIONS .............................................................................................................................................................. 50
4
1 INTRODUCTION
Basic tool for diagnosis of automotive air conditioning systems R134A,
TECNOCLIM PRO PLUS offers the possibility to carry out measurements,
monitor or automatic diagnostic of any system equipped with 2 fill up valves.
3 operation modes will allow the more or less advanced user to carry out in
few minutes a complete diagnosis of the cold loop, to easily monitor the charge,
the efficacy of one of the elements of the circuit, or to fine-tune a research for a
breakdown thanks to precise readings of physical values, such as pressure,
temperature, hygrometry…
Completely future-proof, this tool’s software can be updated. Your
ROBINAIR® distributor will inform you about its availability and application
modes. By doing so, you can make the most of software development and have
permanently at your disposal a tool you can rely on for your everyday needs.
5
2
TECNOCLIM PRO PLUS CARRYING CASE DESCRIPTION
2.1 CONTENT’S DESCRIPTION
The TECNOCLIM PRO PLUS carrying case contains the following elements :
TECNOCLIM PRO PLUS tool : to place under the bonnet, it allows the user to
measure and treat the physical values of the air conditioning circuit. It allows as
well to record and store measurements data.
Communicating with PC using its USB link (Software drivers, records and print
outs software supplied) it allows diagnostic report print outs.
P12v cable : to be connected to the vehicle’s 12V battery as to power the
TECNOCLIM PRO PLUS tool and to reload its internal battery
Cable and couplers for R134a service valves: dedicated to the measurement
of high and low pressures
THR probe : for measuring the temperature and hygrometry of ambient air or
vent air. Wireless probe communicating by radio with TECNOCLIM PRO PLUS
Set of TK probes : 4 thermocouple probes for measuring the temperature of
the coolant fluid by being in contact with the metallic pipes of the air
conditioning system.
6
2.2 FRONT PANEL
4
5
6
3
7
2
8
1
1. On / Off button
2. On / Off status led
3. USB communication status Led
4. Quick menu access
5. Up / Left key
6. Return key
7. Down / Right key
8. Escape key
7
2.3 CONNECTIONS
3
1
5
4
2
1. low pressure input 0 / 10 bars (acceptable maximum pressure: 10 bars)
2. high pressure input 0 / 40 bars (acceptable maximum pressure: 40 bars)
3. thermocouple temperature probe inputsTK1 to TK4
4. 12V vehicle’s battery input, to be connected to CRCO_PSA cable
5. linear pressure sensor’s measurement / simulation input, to be connected
to HP1000 cable (to which one of the pressure sensor adapter will be
connected)
- Thermocouple temperature probe inputs TK1 to TK4 : Use only K
type thermocouples
- Low pressure input : Never not to exceed the maximum
acceptable pressure of 10 bars
- High pressure input : Never not to exceed the maximum
acceptable pressure of 40 bars
- 12V vehicle’s battery input : To be connected only to automotive
12V batteries
8
3
CONNECTING
Connect the tool as described below :
1. screw the red high pressure quick connection to an end of the red high
pressure flexible hose, screw the blue low pressure quick connection to
an end of the blue low pressure flexible hose.
2. screw the free ends of both high and low pressure flexible hoses onto the
TECNOCLIM PRO PLUS tool following the colours indicated on the case.
3. connect the 4 thermocouple probes TK1 to TK4 into the location to that
effect, on the TECNOCLIM PRO PLUS case.
4. press ON/OFF button
to turn the equipment on.
The diagnosis tool is, from now on, ready for use ; the connection to the vehicle
of different elements such as TK, THR probes, HP & BP quick connections,
pressure sensor’s adapters… will be displayed on the TECNOCLIM PRO
PLUS’s screen while in use, and depending on the mode or test chosen.
9
4 USE
4.1 STARTING UP THE APPLICATION
When powered on, the
TECNOCLIM PRO PLUS
displays the opposite main
menu :
Selecting the icon AIR CONDITIONING :
Using the navigation keys, select the air conditioning icon from the icons in the
main menu. When the icon has been selected, press the validation key in order
to open the function AIR CONDITIONING proposed by the tool.
10
4.2 AIR CONDITIONING MENU
After selecting and confirming the function AIR CONDITIONING proposed by
the tool, the following menu appears :
3 operating modes are suggested :
Measure : mode that enables the user
to display in graph form or digitally the
measured values
Control : mode that enables the user to
monitor an element or a functionality of
the air conditioning circuit
Auto. Diagnostic : mode that enables
the user to do a thorough diagnosis of
the whole air conditioning circuit and to
give a final interpretation of its results
4.3 VEHICLE CONFIGURATION
Regardless of the selected mode,
Measure, Control, and Automatic Diag., a
page called « vehicle configuration» will
tell the tool TECNOCLIM PRO PLUS the
environment in which it is going to be
working.
The following can be configured: the
number of service valves available in the
vehicle, the type of compressor mounted
in the air conditioning circuit, as well as
the type of filtration used in that same
circuit.
The selection is done by means of the
tool’s selecting knob and it is saved after
pressing the button
11
4.4 ARCHITECTURE OF THE AIR CONDITIONING FUNCTION
12
5 MEASUREMENT MODE
The measurement mode enables graph or digital display of several physical
values such as :
-
High and low pressure of the vehicle’s air conditioning circuit
Temperature and hygrometry of the ambient air or of the vent air let out by
the system
Temperatures of coolant fluid circulating the pipes with which the
thermocouple clamps TK1 to TK4 are in contact
In measurement mode, TECNOCLIM PRO PLUS suggests two types of
display :
• the displayers mode (default mode)
• the detail mode
5.1 « DISPLAYERS » MODE
After selection and confirmation of the measurement mode, past the main menu
of the AIR CONDITIONING function, the TECNOCLIM PRO PLUS goes by
default into Displayers mode:
This display mode shows the whole of
available data in large digital display
boxes.
To select a display
To show the selected
value in Detail mode.
The displays are designed in black on white, but they revert to
white on black when they are selected.
13
5.2 « GRAPHIC » MODE
The Graphic mode lists the whole of
available signals in table form and
traces the selected signal.
From the Displayers Mode or the Detail Mode, access to the Graphic Mode
can be gained as follows:
Conversely, going back to the Displayers Mode is done as follows:
14
5.3 « DETAIL » MODE
This display mode gives detailed information of the selected value in the
following way:
1.
2.
3.
Instant digital value
Maximum, average and Minimum
Visualisation of the variation : Trace function
1.
4.
2.
3.
5.
The Detail mode has a menu toolbar which allows the user to parameterise the
trace function, as well as the saving and storing of the values given:
4.
5.
Menu toolbar
Visualisation of the time basis
TECNOCLIM PRO PLUS uses the calibre directly, thus enabling
the most detailed possible display of the trace (3.) : automatic scale
15
DETAIL MODE MENU TOOLBAR :
When set in the Detail Mode, the TECNOCLIM PRO PLUS is
actually acquiring data: it displays the value of the reading as well as
the maximum, the average and the minimum. The trace appears on
the screen and the menu toolbar gives the four following choices:
-
: Goes back to previous screen (Displayers or Graph).
Same function as the ‘back’ key :
-
: Deletes, according to your choice, the maximum, the
average, the minimum, the trace or the whole of memorised
data.
-
: Selects the display speed of the trace points: Acquisition
speed can be adjusted from 100ms to 10s.
-
: Goes into ‘pause’ mode.
Using the buttons :
• select the choices from the menu toolbar, then select from
the sub-menus.
• confirm the selected choice, then confirm the settings
16
•
The ‘pause’ mode allows the user to study the memorised
trace:
-
: To re-start measuring.
-
: Moving the trace’s displayed area.
-
: Adjustment of the size of the displayed area.
-
: Makes a cursor appear on the trace (vertical dotted line).
The cursor moves and the value of the trace under the cursor is
displayed.
Status bar of the trace
• The status bar shows the total duration of the trace: grey rectangle.
• The black rectangle shows the visible part of the trace (displayed area).
• 100ms indicates the acquisition speed. It can be adjusted using the
following values:
100ms, 200ms, 400ms, 1s, 2s, 4s or 10s
• 6.0s indicates the size of the displayed area (black rectangle),
adjustment :
• 30s indicates the total duration of the trace.
17
6 CONTROL MODE
The control mode will enable the user
to carry out a test sequence as a reply
to a well defined need.
In each of the test sequences, the user
will be guided by the tool TECNOCLIM
PRO PLUS, which gives an accurate
description of the connections to be
done prior to the test, as well as of how
the test will be put into effect
Efficiency : it monitors the efficiency of the air conditioning circuit.
Charge : it monitors the charge level of coolant fluid in the air
circuit.
conditioning
Condenser : it monitors the efficiency of the condenser.
Evaporator : it monitors the efficiency of the evaporator
MEC compressor : It monitors the correct functioning of the variable capacity
compressor (compressor using mechanical control)
PWM compressor : It monitors the correct functioning of the variable capacity
compressor (compressor using PWM control)
0-5V pressure sensor : controls and simulates linear’s high pressure sensors
Power supplies : Volmeter function
WARNING : access to each of these tests will directly depend on the
vehicle configuration selected by the user.
18
6.1 EFFICIENCY TEST
The efficiency test, divided up into 5 phases, will enable the user, by measuring
the vent air, to determine the efficiency of the air conditioning system under test
depending on the initial conditions measured, i.e. temperature and hygrometry
of ambient air (outside the vehicle).
The last of the 5 screens of this test is shared
between a digital display of temperature,
hygrometry
and
theoretical*
maximum
temperature of vent air, and a graph display
showing the development of the vent air
temperature.
The theoretical* maximum temperature varies
depending on the initial conditions (temperature
and hygrometry of ambient air).
This display in graph form is broken down into 3
zones :
Zone A : shows a wrong temperature of vent air
Zone B : shows a satisfactory temperature of vent
air.
Zone C : shows a correct temperature of vent air
(below theoretical limit)
19
6.2.
LOAD TEST
The load test, aimed to determine the correct level of load of coolant fluid in the
air conditioning circuit, takes place in 4 stages :
The last of the 3 screens gives the user 3 physical values :
- High pressure in bars
- Temperature of high pressure fluid in degrees Celsius
- Value of under-cooling in degrees Celsius
On the other hand, it shows in graph form the
circuit’s load level, by means of a cursor
which moves along a 3 zone graphic model :
Zone A : if the cursor is stable in this zone it
shows a lack of charge of liquid coolant in the
tested circuit.
Zone B : if the cursor is stable in this zone it
shows an excessively high charge of coolant
fluid in the circuit under test.
Zone C : if the cursor is stable in this zone it
shows a correct charge of the
20
6.3.
CONDENSER TEST
The condenser test will enable the user to determine that this element of the air
conditioning circuit fulfils its role, i.e. it makes the high pressure coolant fluid go
from its gaseous state (when entering the condenser) to its liquid state (when
coming out of the condenser).
The last of the 4 screens opposite, gives
the user the digital values of :
- The high pressure
- The temperature of the fluid when
coming out of the condenser.
- The temperature difference at entering
and coming out of the condenser.
- The sub-cooling value
On the other hand, a cursor moves along
a graphic model called « graph showing
availability of gas R134 », comprising 3
zones :
Cursor placed in :
Zone A : fluid coming out of the condenser in liquid state – correct result
Zone B : fluid coming out of the condenser saturated – incorrect result
Zone C : fluid coming out of the condenser in gaseous state – incorrect result
21
6.4.
EVAPORATOR TEST
The evaporator test will enable the user to determine that the evaporator –
regulator unit of the air conditioning circuit fulfils its role, that is to say, it makes
the liquid coolant go from a « high pressure - liquid » state to a « low pressure –
gaseous » state.
The last of the 4 screens opposite, gives
the user the digital values of :
- The low pressure
- The fluid temperature when coming out
of the evaporator
- The temperature difference when
entering and coming out of the
evaporator
- The overheating value
On the other hand, a cursor moves along
a graphic model called « graph showing
availability of gas R134 », comprising 3
zones :
Curseur positionné en :
Zone A : fluide en sortie d’évaporateur à l’état liquide – résultat incorrect
Zone B : fluide en sortie d’évaporateur saturé – résultat incorrect
Zone C : fluide en sortie d’évaporateur à l’état gazeux – résultat correct
22
6.5.
MECHANICAL COMPRESSOR TEST
The mechanical compressor test will enable the user to ensure the correct
functioning of the internal controlled compressor mounted on the air
conditioning circuit being tested. And in the case of a variable capacity
compressor, it ensures its good progress depending on the demand of vent air
(thanks to the user’s intervention on the fan’s command button).
This test can be divided up into 4 distinct phases:
The last of the 4 screens gives the user 2 physical
values :
- High pressure in bars
- Low pressure in bars
On the other hand, it shows in graph form the
compressor’s operation status, by means of a cursor
which moves along a graphic model *, characteristic
of the functioning of variable capacity compressors,
which comprises various zones :
A
C
B
Zone A : if the cursor is stable in this zone it shows
that the compressor is at minimum capacity .
Zone B : if the cursor is stable in this zone it shows that the compressor is
at maximum capacity.
Zone C : if the cursor is stable in this zone it shows that the compressor is in
the regulation stage.
: if the cursor is stable in one of these zones, it indicates compressor
malfunction.
* this graphic model is only shown in the event
23
of the vehicle configuration needing a variable
capacity compressor.
6.6.
PWM COMPRESSOR TEST
The PWM compressor test enable the user to monitor and to simulate the
external controlled compressor mounted on the air conditioning circuit being
tested.
6.6.1. « Measuring » function
The last of the 3 screens, opposite,
allows the user to check the following
parameters:
- the high and low pressure values
measured from the air conditioning
system
- The frequency of the signal emitted
by the vehicle electronics
- The PWM of the signal emitted by the
vehicle electronics
24
6.6.2. « Simulation » function
You can go from measuring mode to simulation mode (and vice-versa) just by
pressing the key marked with a star on the TECNOCLIM PRO PLUS tool:
The simulation mode enables the user to
alter the value of the PWM of the signal
emitted to the compressor, while still
being able to read the effective high and
low pressures present in the system :
The user can change the « signal set » with the high and low keys of the
TECNOCLIM PRO PLUS tool.
This information will then be treated by the compressor, which will allow the
user to check the air conditioning system’s responses at the compressor’s valve
control signal.
You can go back to reading mode just by pressing the key marked with a star,
the compressor will then receive the PWM emitted from the car electronics
itself.
Note 1: the PWM « signal set » default value is fixed at 50%.
25
6.7.
0-5V PRESSURE SENSOR TEST
The pressure sensor test will allow the user to check the good functioning of the
high pressure sensor of the air conditioning system by comparing the high
pressure value, which is deduced from the voltage delivered by the pressure
sensor, with the real value of the pressure measured by the TECNOCLIM PRO
PLUS tool.
On the other hand, the « simulation » function will allow us to send different
pressure values to the ECU, thus being able to control the compressor’s high
and low cut-offs, its restarts, as well as the engine fans starting / stopping.
6.7.1. « Measuring function »
The last of the 3 screens, opposite,
allows the user to check the
following parameters:
- the pressure sensor’s power
supplies (+5v and ground)
- the signal delivered by the pressure
sensor
- the deduced high pressure (from the
pressure sensor’s signal)
- the high pressure measured by the
TECNOCLIM PRO PLUS tool via
the system’s HP service valve
26
6.7.2.
«Simulation » function
You can go from measuring mode to simulation mode (and vice-versa) just by
pressing the key marked with a star on the TECNOCLIM PRO PLUS tool:
The simulation mode allows the user to
alter the value of the pressure sensor’s
signal, while still being able to read the
effective pressure present in the system:
- effective high pressure read by the HP
pressure sensor
- effective high pressure read by the
TECNOCLIM PRO PLUS tool
- simulated high pressure (deduced out
from the signal set)
- signal set , this value can be adjusted
by the user
The user can change the « signal set » with the high and low keys of the
TECNOCLIM PRO PLUS tool.
This information will then be treated by the car electronics, which will allow the
user to check the air conditioning system’s responses at different levels and
pressure variations.
You can go back to reading mode just by pressing the key marked with a star,
the car electronics will then receive the pressure sensor’s signal again, which is
the real image of the pressure present in the circuit.
Note 1: the « signal set » default value is the one which is read when the tool
goes into simulation mode.
Note 2: due to safety reasons, the simulation function is only available on those
vehicles which are equipped with a High Pressure service valve.
Note 3: only the so called « linear » pressure sensors, i.e. those which deliver a
voltage image of the high pressure, are subject to diagnosing and simulation.
The old generations of pressure sensors, the so called « tri-function » pressure
sensors, installed in series with the control circuit of the compressor’s clutch,
can neither be diagnosed nor simulated.
27
7 AUTO. DIAGNOSTIC MODE
The Auto. Diagnostic Mode will enable the user to carry out a full diagnosis of
any air conditioning circuit equipped with 2 service valves, and to get, only a few
minutes later, an interpretation of the results of the measurements.
All along this procedure, the user is guided by the tool EXOCLIM, which gives
an accurate description of the connections to be made prior to every stage of
the test, as well as how they are brought into play.
7.1.
DIAGNOSIS PROCEDURE
Choose mode « Auto. Diagnostic » from the
main menu AIR CONDITIONING on the tool
TECNOCLIM PRO PLUS.
Choose the vehicle configuration:
The vehicle dealt with in this example
consists of 2 service valves, high and low
pressure. It is equipped with a linear high
pressure sensor, with a variable capacity
compressor and with a gas expansion
system of the type: expansion valve
28
Description of connections needed for the
measurements to be made by the tool.
Follow-up of the description of
connections.
Follow-up of the description of the
conditions to realise the initial conditions
measurment
29
Acquisition 1 :
Acquisition of temperature as well as of
ambient hygrometry.
Confirming this page will enable the tool to
determine the threshold of effectiveness
that the air conditioning system will have to
achieve.
Description of the conditions to realise
the automatic procedure.
Follow-up of the description of the
conditions to realise the automatic
procedure.
30
Acquisition 2 :
New acquisition phase. Only temperature
measurements and hygrometry of vent air are
displayed.
A scroll bar, inside the red circle, shows the
progress of the test. The user must keep,
during the whole test, the conditions required
to get started that have been previously
described.
End of procedure, in the event of a
positive result :
A summary table (on the right) is displayed,
showing the minimal, maximum and average
values measured in the course of the
diagnosis procedure.
The initial conditions, as well as the efficiency
of the air conditioning circuit, that is to say, the
lowest temperature reached by the vent air,
are displayed, too.
A last screen then confirms the correct
functioning of the air conditioning system.
It is then possible, to either save these
results for further consultation, even for
later printing, or to quit the diagnosis
procedure.
31
End of procedure, in the event of a negative result :
A summary table (opposite) is
displayed, showing the minimal,
maximum
and
average
values
measured in the course of the
diagnosis procedure.
The initial conditions, as well as the
efficiency of the air conditioning circuit,
that is to say, the lowest temperature
reached by the vent air, are displayed,
too.
Automatic treatment of the values raised
during 2 phases of acquisition of the
procedure, thus enabling the tool to
suggest the possible causes for the
malfunctioning of the air conditioning
circuit being monitored, as well as
guiding the user in his search of the
breakdown
It is then possible, to either save these results for further consultation, even for
later printing, or to abandon the diagnosis procedure.
*presented case : compressor power failure.
32
7.2.
PROCEDURE INTERRUPTIONS
In the course of the automatic diagnosis procedure, and when the tool detects
incoherence among the measurements taken, the tool itself can interrupt its
own boss’s procedure.
THR probe not connected
Cette interruption intervient lorsque aucune communication n’est détectée entre
l’outil TECNOCLIM PRO PLUS et la sonde THR. En mode diag. Automatique
uniquement.
Unsuitable ambient temperature:
This other interruption occurs exclusively during the measurement of the initial
conditions prior to a efficiency test (in monitor mode) or at the beginning of the
Automatic Diag. procedure.
In fact, no control or diagnosis of an air conditioning circuit can be really reliable
if the temperature outside the vehicle is below 15°C.
33
Incompatibility of the vehicle configuration :
This interruption could occur at the beginning of the Automatic Diag. procedure
when the vehicle configuration selected by the user is not compatible with the
procedure.
This interruption does not allow the Automatic Diag. procedure to carry on, for
example, if the vehicle dealt with only has one fill up valve.
Abnormal temperature of vent air :
This interruption, also reserved for the Automatic Diag. procedure, could occur
when the temperature of the vent air remains abnormally high.
The user is invited to check that the opening of the front aerator is correct, as
well as the position of the mixing flap. After this check, selection and validation
of the « continue » button, will enable the user to carry on with the diagnosis
procedure.
34
8. MANAGING SAVED DATA
The Measurement and Auto Diagnostic modes of the TECNOCLIM PRO PLUS
allow the recording of data which will be stored as to be visualized or printed out
lately
RECORDS – MEASUREMENT MODE
The data recording from the measurement mode is possible as soon as the
user has activated the “pause” function from the “detail” screen.
The recording function of the measurement mode will store simultaneously all
inputs data from the TECNOCLIM PRO PLUS tool. The measurement records
are named « ACMeas »
RECORDS – AUTO. DIAGNOSTIC MODE
The data recording from the Auto. Diagnostic mode is possible at the end of the
diagnostic procedure by the validation of the icon
The recorded data are corresponding to the final measurement table and the
possible faults list shown at the end of any diagnostic. The diagnostic records
are named « ClimDiag »
OPENING A RECORD
Use the navigation keys in order to choose
the saved data for editing :
35
Press the validation key to open the selected
saved data.
The record is opened, it is then
possible to visualize the memorized
values and graphicals : pressure,
temperature, hygrometry….
36
9. CONNECTING THE TOOL TO A PC
The TECNOCLIM PRO PLUS tool has a USB port allowing a connection with a
PC which is needed for :
- The TECNOCLIM PRO PLUS software updating
- The TECNOCLIM MANAGER utility software use
- The USB CAPTURE utility software use
Driver installation :
- Insert the TECNOCLIM PRO PLUS disk in the PC’s CD-Rom drive
- Connect the tool to the PC using the USB cable (included), the PC detects
a new peripheral and propose its installation
Tick « No » and validate using the button « Next »
37
Tick « Install from a list…» and validate using the button « Next »
Tick « Search from …» and validate using the button « Next »
38
The pilot installation proceeds automatically, do not cancel the procedure.
At the end of the driver’s installation procedure, click on « Finish » to quit the
program. The TECNOCLIM PRO PLUS tool is now recognized by the PC as an
USB peripheral.
39
10. DOWNLOADING AND PRINTING OF RECORDS
The A4 size printing of records (measurement & Auto Diagnostics) is possible
using the TECNOCLIM MANAGER storage and printing utlity software. This
application must be installed from the TECNOCLIM PRO PLUS CD-Rom by
executing the file « Tecnoclim manager Setup.exe ».
Configuration
At the occasion of the first use ot the Tecnoclim Manager software, it is needed
to fill-in the informations relative to the TECNOCLIM PRO PLUS owner. These
informations will be systematically shown at the top of any diagnostic or
measurement report printed page.
allows to add a logo at the printed report
allows to save the user configuration
40
At the end of the configuration data keyboarding, save the configuration using
the button
and quit the page using the button
Proceed by the same way concerning the update configuration.
Main screen
The Tecnoclim Manager main screen shows :
Diagnostics :allows the data downloading to the PC, storage and
printout of any records memorized in the TECNOCLIM PRO PLUS
tool.
Update : allows the updating of the TECNOCLIM PRO PLUS
embedded software and the TECNOCLIM MANAGER PC software
USB Capture : utility allowing a dynamic display of the TECNOCLIM
PRO PLUS screen to the PC screen
Configuration : allows the configuration about the user and the
advanced configuration of the tool
Help : gives the access to the TECNOCLIM PRO PLUS user manual
(pdf files).
Quit : closes the Tecnoclim Manager application
41
Diagnostics mode
This mode allows the data downloading, storage and printing of the records
from the TECNOCLIM PRO PLUS tool.
From the records list stored by the Tecnoclim Manager software, it is possible to
select and open a record as to visualize, modify, delete or print it out.
open a record
print out a record
delete a record
allows the data downloading from the memory of the TECNOCLIM
PRO PLUS tool (needs the USB connection between the TECNOCLIM
PRO PLUS tool ; the tool must be powered and on its main menu
page)
42
Update mode
The update mode allows :
- The activation of the automatic search of available updates for the
Tecnoclim manager software and the Tecnoclim Pro Plus tool (needs an
internet connection)
- The manual search of updates from the internet
- To show the installed software version of the Tecnoclim manager software
- To show the installed software version of the TECNOCLIM PRO PLUS
- To proceed to the updates
43
USB Capture utility
The USB Capture utility allows, when the TECNOCLIM PRO PLUS tool is linked
to the PC to display the tool’s screen onto the PC screen.
2 possibilities :
- Dynamique display
- Screenshots
44
Help
The « Help » mode allows the display of the TECNOCLIM PRO PLUS user
manual (Needs Adobe Reader)
45
PRINTOUT SAMPLE –MEASUREMENT MODE
Page 1
Page 2
46
PRINTOUT SAMPLE – AUTO DIAGNOSTIC MODE
47
GLOSSARY
Undercooling:
The undercooling shows the difference between the liquid coolant temperature
taken when coming out of the condenser, and the R134’s theoretical
condensing temperature, calculated from the high pressure value present in the
air conditioning circuit.
The undercooling value of an R134 air conditioning circuit must be comprised
between 4 and 13°C
Overheating:
The overheating shows the difference between the liquid coolant temperature
taken when coming out of the evaporator, and the R134’s theoretical
evaporation temperature, calculated from the low pressure value present in the
air conditioning circuit.
The overheating value of an R134 air conditioning circuit must be comprised
between 4 and 13°C
Enthalpy :
Enthalpy represents the heat energy and the work that is brought into play
depending on a fluid’s temperature and pressure.
In the case of fluid coolant R134, using an enthalpic diagram will allow us to
determine the fluid’s status (liquid, vapour or saturated) from its pressure and
temperature.
Output :
The output shows the effectiveness of the system from the user’s point of view.
Mentioned on the diagnosis report carried out by the TECNOCLIM PRO PLUS
tool, it can take 3 different estates:
- GOOD, if the temperature of pulsated air taken during the
acquisition phase is lower than the maximum admissible
temperature determined by the tool
48
- SATISFACTORY, if the temperature of pulsated air taken during the
acquisition phase is not over 2ºC higher than the maximum
admissible temperature determined by the tool
- BAD, if the temperature of pulsated air taken during the acquisition
phase is over 2ºC higher than the maximum admissible temperature
determined by the tool
WARRANTY
The TECNOCLIM PRO PLUS product has a two years period warranty as from
the date of purchase, against all vice of manufacture under conditions of normal
use and maintenance and in accordance with the instructions present in this
user guide.
Are excluded from this guarantee the accumulators as well as degradations
resulting from a misuse or handling, from negligence or accident to the product.
49
SPECIFICATIONS
Spécifications THR probe and TECNOCLIM PRO PLUS tool :
Temperature
Probe THR
Range: -10 to +50°C
Resolution 1°C
Temperature
Probes TK
Range : -30 to +120°C
Resolution 1°C
Hygrometry
Probe THR : 5 to 95%
Pressure
Power supply
Range : 0 to + 31 bars (high pressure)
Resolution 100 mbars
Range : 0 to +8 bars (low pressure)
Resolution : 10 mbars
Usong djack plug : 9 à 26V
Using the A1000 cable to the car battery : 6 à 23V
Never not to replace the accumulators by
batteries
Use only accumulators whose characteristics
are as follows :
Accumulateurs
Size : AA R6
Technology : Ni-MH (Nickel Métal Hybride)
Voltage : 1.2V
Capacity : 1700 mAh
Consumption
1.5 W
Environment
Use temperature : from 0 to 50°C
Storage temperature : from -20 to 60°C
Reference temperature : 23°C +/-2°C
Do not to expose the apparatus to the rain and water projections.
Do not to use this apparatus to take measurements on the mains 230
Vac.
50