1
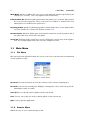
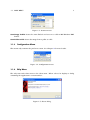
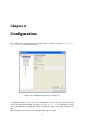
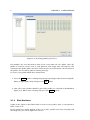
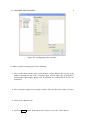
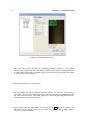
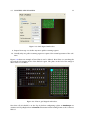
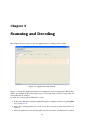
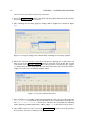
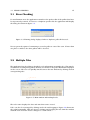
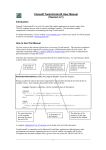
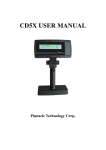
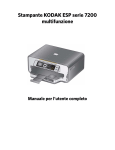
CBSR Sample Scanner User Manual
Prepared for the Canadian BioSample Repository
by the Alberta Ingenuity Centre for Machine Learning
January 18, 2011
ii
Contents
1 Overview
1
1.1 Main Menu . . . . . . . . . . . . . . . . . . . . . . . . . . . . . . . . . . . . . .
2
1.1.1 File Menu . . . . . . . . . . . . . . . . . . . . . . . . . . . . . . . . . . .
2
1.1.2 Scanner Menu . . . . . . . . . . . . . . . . . . . . . . . . . . . . . . . .
2
1.1.3 Configuration Menu . . . . . . . . . . . . . . . . . . . . . . . . . . . . .
3
1.1.4 Help Menu
3
. . . . . . . . . . . . . . . . . . . . . . . . . . . . . . . . . .
2 Configuration
5
2.1 Scanning and Decoding . . . . . . . . . . . . . . . . . . . . . . . . . . . . . . .
6
2.1.1 Decoding Parameters . . . . . . . . . . . . . . . . . . . . . . . . . . . .
6
2.1.2 Decoding Profiles . . . . . . . . . . . . . . . . . . . . . . . . . . . . . . .
7
2.1.3 Plate Positions . . . . . . . . . . . . . . . . . . . . . . . . . . . . . . . .
8
3 Scanning and Decoding
13
3.1 Error Checking . . . . . . . . . . . . . . . . . . . . . . . . . . . . . . . . . . . .
15
3.2 Multiple Tabs . . . . . . . . . . . . . . . . . . . . . . . . . . . . . . . . . . . . .
15
iii
iv
CONTENTS
List of Figures
1.1 The CBSR Sample Scanner’s main window. . . . . . . . . . . . . . . . . . . .
1
1.2 File menu. . . . . . . . . . . . . . . . . . . . . . . . . . . . . . . . . . . . . . . .
2
1.3 Scanner menu. . . . . . . . . . . . . . . . . . . . . . . . . . . . . . . . . . . . .
3
1.4 Configuration menu.
. . . . . . . . . . . . . . . . . . . . . . . . . . . . . . . .
3
1.5 About dialog. . . . . . . . . . . . . . . . . . . . . . . . . . . . . . . . . . . . . .
3
2.1 Configuration preferences dialog box. . . . . . . . . . . . . . . . . . . . . . . .
5
2.2 Scanning and Decoding preferences. . . . . . . . . . . . . . . . . . . . . . . .
6
2.3 Selecting a scanning source. . . . . . . . . . . . . . . . . . . . . . . . . . . . .
6
2.4 Decoding preferences. . . . . . . . . . . . . . . . . . . . . . . . . . . . . . . . .
7
2.5 Decoding profiles preferences. . . . . . . . . . . . . . . . . . . . . . . . . . . .
8
2.6 Configuring a plate position. . . . . . . . . . . . . . . . . . . . . . . . . . . . .
9
2.7 Sample flatbed scan.
. . . . . . . . . . . . . . . . . . . . . . . . . . . . . . . .
2.8 Grid aligned with tubes.
10
. . . . . . . . . . . . . . . . . . . . . . . . . . . . . .
11
2.9 Plate 2 grid aligned with tubes. . . . . . . . . . . . . . . . . . . . . . . . . . .
11
3.1 Application main window.
. . . . . . . . . . . . . . . . . . . . . . . . . . . . .
13
3.2 Progress dialog boxes shown while scanning and decoding a pallet. . . . . .
14
3.3 Decode with missed tubes. . . . . . . . . . . . . . . . . . . . . . . . . . . . . .
14
3.4 Warning dialog displayed when a duplicate pallet ID detected. . . . . . . . .
15
3.5 Main window with multiple tabs. . . . . . . . . . . . . . . . . . . . . . . . . .
15
3.6 Split tabs. . . . . . . . . . . . . . . . . . . . . . . . . . . . . . . . . . . . . . . .
16
3.7 A tab’s context menu (right click on the tab title). . . . . . . . . . . . . . . . .
16
v
vi
Todo list
LIST OF FIGURES
Chapter 1
Overview
The CBSR Sample Scanner is a Microsoft Windows application that decodes DataMatrix
encoded 1.0 ml or 0.5 ml tubes inserted into NUNC 96 well plates. It communicates
with a scanner that uses either TWAIN1 or WIA2 drivers. Most scanners available on the
market provide these drivers.
Up to 5 pallets can be scanned and decoded at a time. The product IDs of decoded pallets
can be saved to individual files that specify the pallet product ID and the date and time
the scan was performed. Files are saved in Comma Separated Value (CSV) format which
is a plain text format or can be imported in to Microsoft Excel.
Figure 1.1 shows the application’s main window and highlights some of its components.
This figure shows the application when it is configured to scan a single pallet.
Figure 1.1: The CBSR Sample Scanner’s main window.
1 http://en.wikipedia.org/wiki/TWAIN
2 http://en.wikipedia.org/wiki/Windows_Image_Acquisition
1
2
CHAPTER 1. OVERVIEW
Main Menu (labelled 1) Allows the user access to the different functions provided by the
software (see section 1.1 for a description of the menu items).
Pallet Product IDs (labelled 2) The product ID of the pallets to be scanned. This product
ID is used in the output file. These text boxes are enabled or disabled based on
which plates are enabled in the preferences.
Decoding Profile (labelled 3) Scanning profiles control which tubes on the pallet will be
decoded. Profiles are described in detail in section 2.1.2.
Decode Results (labelled 4) This part of the window shows the decoded product IDs of
the tubes that were decoded for each pallet.
Status Bar (labelled 5) The status bar is used to display the current state of the application. It is usually updated after the user has completed a task.
1.1
1.1.1
Main Menu
File Menu
The items under the File Menu allow the user to create new scan tabs and save individual
decoded pallets to a file.
Figure 1.2: File menu.
New Scan Use this menu item to clear the contents of the current scanning tabs.
New Tab Creates a new scanning tab. Multiple scanning tabs can be used to keep decode
information easily accessible.
Save All Saves to file all scanned pallets on the current tab.
Save Used to save to file one of the scanned pallets on the current tab.
Quit Used to quit the application.
1.1.2
Scanner Menu
Allows the user to save scanned images to file.
1.1. MAIN MENU
3
Figure 1.3: Scanner menu.
Scan Image To File Scans the entire flatbed and saves it to a file in MS Windows BMP
format.
Scan Pallet to File Scans the image from a pallet to a file.
1.1.3
Configuration Menu
This menu only contains the preferences item. See Chapter 2 for more details.
Figure 1.4: Configuration menu.
1.1.4
Help Menu
The only item under this menu is the About item. When selected it displays a dialog
containing the application’s version number.
Figure 1.5: About dialog.
4
CHAPTER 1. OVERVIEW
Chapter 2
Configuration
The configuration settings for the Java Client can be found by selecting Configuration
→ Preferences from the main menu.
Figure 2.1: Configuration preferences dialog box.
A configuration page can be selected by clicking on a node on the tree on the left hand
side of the dialog box (labelled 2 in figure 2.1). The filter text box (labelled 1) can be
used to quickly find a configuration page by typing the name of the page in whole or in
part.
The following sections discuss the configuration pages in detail.
5
6
2.1
CHAPTER 2. CONFIGURATION
Scanning and Decoding
The settings on this page allow the user to specify the scanning and decoding parameters
used when decoding pallet images.
Figure 2.2: Scanning and Decoding preferences.
Select Scanner This button is used to select the scanner that will be used to scan 96
well pallets. The dialog box shown in figure 2.3 is shown when the button is pressed.
Figure 2.3: Selecting a scanning source.
Driver Type The type of driver that was selected when the Select Scanner button was
pressed. Normally, the application will attempt to determine the driver type as soon
as the user makes the selection, but sometimes the application does not select the
correct type. Use the check boxes here to override what the application selected if it
was incorrect.
DPI The Dots per Inch used by the scanner for scanning images. For best results use 600
DPI.
Brightness The brightness setting to be used when scanning images. This parameter
does not work on Hewlett-Packard scanners when using the WIA based driver.
Contrast The contrast setting to be used when scanning images. This parameter does
not work on Hewlett-Packard scanners when using the WIA based driver.
2.1.1
Decoding Parameters
On the preferences dialog window, if there is a "plus" symbol next to the Scanning and
Decoding node, press it to expand the sub tree.
These settings control how the software decodes the sample tubes imprinted with DataMatrix 2D barcodes.
2.1. SCANNING AND DECODING
7
Figure 2.4: Decoding preferences.
Decode Library Debug Level The decoding software library can output debugging information to a log file. When this value is zero there is no debugging information
stored in the log file. Possible values are 0 through 9. The higher the value the more
detailed the debugging information.
Decode Edge Threshold Set the minimum edge threshold as a percentage of maximum.
For example, an edge between a pure white and pure black pixel would have an
intensity of 100. Edges with intensities below the indicated threshold will be ignored
by the decoding process. Lowering the threshold will increase the amount of work
to be done, but may be necessary for low contrast or blurry images. The default and
recommended value is 5.
Decode Square Deviation Maximum deviation (in degrees) from squareness between adjacent barcode sides. The default and recommended value is N=15 and is meant for
scanned images. Barcode regions found with corners <(90-N) or >(90+N) will be ignored by the decoder.
Decode Corrections The number of corrections to make while decoding. The default and
recommended value is 10.
Decode Scan Gap The scan grid gap size in inches. The default and recommended value
is 0.085.
Decode Cell Distance The distance in inches between tubes. The default and recommended value is 0.345 for NUNC pallets.
2.1.2
Decoding Profiles
On the preferences dialog window, if there is a "plus" symbol next to the Scanning and
Decoding node, press it to expand the sub tree.
This page allows the user to define Decoding Profiles. These profiles allow the user define
a sub set of tubes to decode when an image of a pallet is scanned. Scanning profiles can
be used during scan link and scan assign (see sections ?? and ??).
8
CHAPTER 2. CONFIGURATION
Figure 2.5: Decoding profiles preferences.
For example: the user may wish to only decode every other row on a pallet. Once the
profile is created it can be used at scan link and scan assign time and only the cells
activated in the profile will be decoded. If 2D barcodes are found in the cells not active in
the profile, the user will be given a warning message.
To create a new profile follow these instructions:
1. Press the Add... button. A dialog box pops up requesting a name for the new profile.
Enter an appropriate name and press the OK button.
2. Now select each cell that should be part of the profile (see cells with a checkmark in
Figure 2.5). When done selecting cells press the Apply button.
2.1.3
Plate Positions
A plate is the region on the flatbed that is used to scan a pallet. Plate 1 corresponds to
Pallet 1 and so on.
On the preferences dialog window, if there is a "plus" symbol next to the Scanning and
Decoding node, press it to expand the sub tree.
2.1. SCANNING AND DECODING
9
Figure 2.6: Configuring a plate position.
To define a pallet scanning region do the following:
1. Place a pallet that contains tubes on the flatbed scanner. Ensure the top edge of the
pallet is touching the top of the scanning region, and the right edge of the pallet is
touching the right margin. Ensure the 12 columns are vertical and the 8 rows are
horizontal.
2. Select the plate region you are going to define. If it is the first select Plate 1 Position.
3. Click on the "Enable" box.
4. Press the Scan button. Now wait for the scanner to scan the entire flatbed.
10
CHAPTER 2. CONFIGURATION
Figure 2.7: Sample flatbed scan.
5. Once the scan is done, you will see something similar to Figure 2.7. The image
shown on the right hand side is the image taken by the scanner and superimposed
is a grid with 8 rows and 12 columns. The cell coloured in cyan should correspond
to tube in row A and column 1.
6. Under orientation select "Landscape".
7. You can adjust the size of the grid using the mouse. If you move the mouse to
one of the corners or one of the edges you can resize the grid by holding down the
left button on the mouse. The whole grid can be moved by pressing the left mouse
button while hovering inside the grid.
8. Once the grid cells are aligned with each tube press the OK button (see Figure 2.8).
The wheel on the mouse can be used to make the cells smaller or bigger (this is
referred to as the Cell Gap).
2.1. SCANNING AND DECODING
11
Figure 2.8: Grid aligned with tubes.
9. Repeat from step 2 to define any more pallet scanning regions.
10. Usually only one pallet scanning region is required for normal operation of the software.
Figure 2.9 shows an example of how Plate 2 can be defined. Here Plate 2 is touching the
top and the left margin of the of the flatbed region. The plate on the left of the image is
where Plate 1 is defined.
Figure 2.9: Plate 2 grid aligned with tubes.
Note that cell A1 should be at the Top Left when configuring a plate in Landscape orientation and Top Right when in Portrait orientation when looking down at the scanner’s
flatbed.
12
CHAPTER 2. CONFIGURATION
Chapter 3
Scanning and Decoding
This chapter discusses how to use the application for scanning and decoding.
Figure 3.1: Application main window.
Figure 3.1 shows the application when it is configured to scan a single pallet. When more
pallets are configured the bottom part of the screen will show a decode results table for
each pallet that is enabled.
To scan one or more pallets follow these steps:
1. If this is the first time using the application please configure at least one pallet plate
(see section 2.1.3) .
2. Select the scanning profile to be used. Leave the selection on All if none have been
defined.
3. Enter the pallet barcodes into the pallet barcode text boxes. A USB barcode scanner
13
14
CHAPTER 3. SCANNING AND DECODING
can be used to enter this text into the text boxes.
4. Press the Scan Selected button. Note that only the pallets with text in the product
ID text box will be scan and decoded.
5. The scanning and decoding progress dialogs will be displayed as shown in figure
3.2.
Figure 3.2: Progress dialog boxes shown while scanning and decoding a pallet.
6. When the scan and decode is done the result may be missing one or more tubes. In
this case press the Re-Scan Selected button to scan and decode again. The second
scan and decode aggregates information to the previous scan and decodes. Figure
3.3 shows that the tube at position A1 was missed because that cell in the table is
empty. Re-scan can be attempted multiple times.
Figure 3.3: Decode with missed tubes.
7. Once a pallet is successfully scanned the information can be saved to a file using the
File → Save All menu item. If you only want to save a single pallet result the use
the File → Save → Pallet x menu item. The files are saved with the following
name <pallet_product_barcode>_<date_time>.csv to the folder of your choice.
8. Once all files have been saved, press the Clear Selected button to clear the product
ID text boxes and start scanning a new pallet.
3.1. ERROR CHECKING
3.1
15
Error Checking
To avoid human error, the application remembers the product IDs of the pallets that have
been previously scanned. If it detects a duplicate product ID, the application will display
the dialog box shown in figure 3.4.
Figure 3.4: Warning dialog displayed when a duplicate pallet ID detected.
You are given the option of continuing to scan the pallet or cancel the scan. If more than
one plate is enabled, the other pallets will be decoded.
3.2
Multiple Tabs
The application has the ability to display decode information on mutiple tabs. This may be
useful when decoding many pallets and the user wishes to keep the information displayed
on the screen. The user can quickly switch between the two windows by clicking on their
corresponding tabs.
Figure 3.5: Main window with multiple tabs.
The tab’s name displays the date and time that it was created.
Tab’s can also be rearranged by clicking on the tab and dragging it. Figure 3.6 shows two
tabs split horizontally. This was done by clicking and dragging the tab down the window
until the icon under the mouse changes to a down arrow.
16
CHAPTER 3. SCANNING AND DECODING
Figure 3.6: Split tabs.
Note that a tab can be closed at any time by pressing the X on the tab title. The tab’s
context menu is shown when you right click on the tab’s title.
Figure 3.7: A tab’s context menu (right click on the tab title).
The functions of the items in this menu are as follows:
Move Move the tab as to display two tabs side by side either vertically or horizontally.
This is the same as clicking on the tab and dragging it.
Size Used for resizing the tab.
Close Closes the tab.
Close Others Closes all tabs except this one.
Close All Closes all tabs. If this is done a new tab can be created by selecting File →
New Tab.
New Editor Creates a new tab.