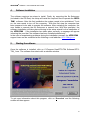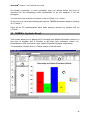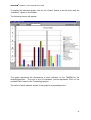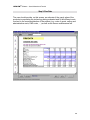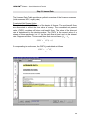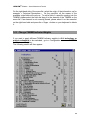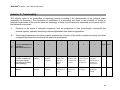
1
© V.1.1 Software «A tool to help experts evaluate the marketability potential of new technologies» User’s Manual and Tutorial © EUROPEAN COMMISSION - JOINT RESEARCH CENTRE - INSTITUTE FOR PROSPECTIVE TECHNOLOGICAL STUDIES ALL RIGHTS RESERVED - DECEMBER 1999 IPTS-TIM © Software – User’s Manual and Tutorial USER’s MANUAL and TUTORIAL Technology Identification Methodology IPTS-TIM © - Software V.1.1 «A tool to help experts evaluate the marketability potential of new technologies» Authors: P. Moncada-Paternò-Castello, J. Rojo (European Commission, Joint Research Centre, Institute for Prospective Technological Studies – EC, JRC’s-IPTS), F. Bellido (Consejería de Economía, Comunidad de Madrid, Spain), A. Menéndez (IDETRA, Spain) Contributors: T. Amorelli (CEST, UK), G. Slavazza (Parametric Technology, F), A. Tubke (EC, JRC’s IPTS) Technical Developers: J.M. Mayo, M. Rodriguez (EC, JRC’s IPTS), L. Bergounioux (Prodidact, F) Any requests for additional information can be addressed to the following e-mail: [email protected] This product was developed by the EUROPEAN COMMISSION’s JOINT RESEARCH CENTRE – INSTITUTE FOR PROSPECTIVE TECHNOLOGICAL STUDIES – with the support of the Innovation Programme of the European Commission’s ENTERPRISE Directorate General. EUR 19037 EN The reproduction of this document is not authorised © EUROPEAN COMMISSION - IPTS-TIM December, 1999 2 IPTS-TIM © Software – User’s Manual and Tutorial TABLE OF CONTENTS 1. INTRODUCTION .........................................................................................6 2. OPERATION AND MODULARITY ..........................................................8 3. MINIMUM PC REQUIREMENTS.............................................................8 4. SOFTWARE INSTALLATION...................................................................9 5. STARTING THE SOFTWARE...................................................................9 6. USE OF IPTS-TIM .................................................................................12 6.1. INTERFACE WITH THE USER ...............................................................12 6.2. USE OF MENUS ....................................................................................13 6.3. TOOL BAR ...........................................................................................14 7. CREATING A NEW PROJECT ...............................................................15 7.1. GENERAL DATA .................................................................................16 7.2. TECHNICAL DESCRIPTION .................................................................16 7.3. MARKET ENQUIRY .............................................................................17 7.4. TECHNOLOGY WATCH 1 - EU RTD POLICIES, STRATEGIES AND PROGRAMMES..18 7.5. TECHNOLOGY WATCH 2 – PROSPECTIVE STUDY ANALYSIS ..........................20 7.6. TECHNOLOGY WATCH 3 – ANALYSIS OF OTHER RELEVANT INFORMATION ........23 8. TECHNOLOGY RANKING FROM TW RESULTS ...............................25 9. TECHNOLOGY AND MARKET EVALUATION MODULE(T&MEM)26 10. T&MEM’S SYNTHETIC RESULT.........................................................28 3 IPTS-TIM © Software – User’s Manual and Tutorial 11. T&MEM’S SYNTHETIC RESULT BY SPECIFIC INDICATORS .....30 12. DETAILED ECONOMIC AND FINANCIAL EVALUATION MODULE (DE&FEM) ........................................................................................32 STEP 1: BASIC INPUT..........................................................................33 STEP 2: FIRM DATA.............................................................................34 STEP 3: LICENSOR DATA ..................................................................35 STEP 4: SUMMARY OF RESULTS ....................................................36 STEP 5: SENSITIVITY OF ROYALTY RATE ..................................37 STEP 6: CASH FLOWS TO COMPANY ............................................38 STEP 7: DECISION TREE ANALYSIS...............................................39 STEP 8: NPV AND PROBABILITY.....................................................41 13. FINAL EVALUATION INDEX (FEI) .....................................................42 14. SOFTWARE CONFIGURATION ...........................................................44 14.1. USER MANAGER ...............................................................................44 14.2. INFORMATION ON THE INDICATORS ................................................45 14.3. CHANGE INDICATOR WEIGHTS .......................................................46 15. CONTACT INFORMATION ...................................................................47 4 IPTS-TIM © Software – User’s Manual and Tutorial APPENDIX 1: T&MEM INDICATORS AND THEIR DEFAULT FACTOR SCALES DEFINITION ..................................................................48 INDICATOR 1: ADVANCEMENT STATUS/TECHNOLOGICAL PROGRESS ....48 INDICATOR 2: EARLY CONCEPT ...............................................................50 INDICATOR 3: PRODUCT/PROCESS DIFFERENTIATION ............................51 INDICATOR 4: SUNK COSTS .......................................................................52 INDICATOR 5: LEARNING CURVE..............................................................54 INDICATOR 6: NEEDED INFRASTRUCTURE ...............................................55 INDICATOR 7: INTELLECTUAL PROPERTY RIGHTS ..................................57 INDICATOR 8: APPLICATIONS ALREADY KNOWN .....................................59 INDICATOR 9: POTENTIAL APPLICATIONS ...............................................61 INDICATOR 10: STATE-OF-THE-ART.........................................................62 INDICATOR 11: TRANSFERABILITY ..........................................................64 INDICATOR 12: TIME TO MARKET ............................................................65 INDICATOR 13: MARKET BARRIERS .........................................................67 INDICATOR 14: RELATIVE MARKET IMPORTANCE ..................................69 INDICATOR 15: MARKET SIZE ..................................................................70 INDICATOR 16: PROFITABILITY ...............................................................72 INDICATOR 17: EMPLOYMENT .................................................................73 INDICATOR 18: SOCIAL USEFULNESS .......................................................74 INDICATOR 19: ENVIRONMENTAL SOLUTIONS.........................................75 INDICATOR 20: REGULATORY EVOLUTION ..............................................76 APPENDIX 2: FULL MARKET ENQUIRY QUESTIONNAIRE .............77 5 IPTS-TIM © Software – User’s Manual and Tutorial IPTS-TIM © Software V1.1 - User’s Manual 1. Introduction IPTS-TIM constitutes an innovative user-friendly software tool which aims to assist members of the technology assessment team, scientists, technology based organisations or stake-holders in increasing their awareness on market related issues, by upgrading skills and information. This tool aids in the characterisation of aims and results from RTD projects, independently of their stage of implementation, especially under the European perspective. IPTS-TIM can be used as an instrument to guide the appraisal of the marketability potential of new technologies not commercialised yet in a given market/segment. The software would assist, for example, in structuring project portfolios, establishing transparent linkages between projects and technology marketability, orientating project reporting towards relevant and critical issues, in order to provide technology evaluations with the necessary information base. Simultaneously, the software can produce relevant inputs to more refined evaluations at the supplier / final user level (e.g. portfolio balance, clustering of technologies analysis). IPTS-TIM takes into account the relevant aspects involved in a technological project in order to reach a final conclusion aimed at providing an objective evaluation of the economic and social benefits expected from the results of the technology development. The information is collected through four modules that arrange and select external and internal information and process it through three additional modules to provide clear conclusions that facilitate decision-making. In addition, IPTS-TIM allows to: define a technology's characteristic, and by way of a questionnaire to define its importance against marketability potential compare various technologies according to pre-selected criteria and to classify each of them according to the possibility of its implementation perform project comparisons using graphics. The basic set up of IPTS-TIM model consists of 7 modules. The General Data (GD) and the Technology Description (TD) modules complement each other collecting and processing all the basic information available at the Organisation/Department level concerning the technology that is going to be evaluated. The Market Enquiry (ME), provides the compiled results obtained through a survey questionnaire to benefit the evaluation process, of appraisal from commercial bodies of the market potential of the targeted technology. The Technology Watch (TW) module provides a systematic and structured procedure to retrieve and process supportive detailed background and prospective information on the technology under analysis, and on the industrial areas in which it might be applied. The information provided in this module uses database and bibliographic sources, in conjunction with the analysis of available foresight studies and European Union R&D and relevant industrial policies and programmes. The Technology and Market Evaluation (T&MEM) module provides a mechanism to prioritise and rank the technologies. The T&ME, relying heavily on the qualitative 6 IPTS-TIM © Software – User’s Manual and Tutorial results derived from the TD, TW and ME modules, provides as an outcome a weighted average of 20 factor scores attained in four main evaluation criteria categories (Development level, Innovative Potential, Market Potential, Strategic Importance) by each of the technologies. Depending on the expert/objective of the organisation the weights can be modified accordingly, following the recommendations (eigenvector method) supplied. The Detailed Economic and Financial Evaluation (DE&FEM) module allows to define for each technological investment project a royalty rate and a licensing fee (including net present value, return on investment and other economic and financial parameters). The Final Evaluation Index (FEI) module, after structuring and processing all the information, allows to combine, in the form of a synthetic index, the qualitative and quantitative outputs from T&ME and DE&FEM modules. 7 IPTS-TIM 2. © Software – User’s Manual and Tutorial Operation and Modularity The IPTS-TIM constitutes a fully integrated and compatible software package made up of different complementary and interconnected modules. The development approach for IPTS-TIM permits an independent operation of each of its modules. This characteristic provides the user with the required flexibility needed in technology related project evaluation. The accuracy of the results provided by IPTS-TIM are highly dependent on the user skills/knowledge of the technology being evaluated and on the level of detail of the information fed into the system. The time necessary to finish the evaluation through IPTS-TIM varies considerably from 1 hr. to 4 weeks, depending on how many evaluation modules the expert uses, how much information is fed in and how much the expert is familiar with the software. The estimated time it takes to evaluate a given technology by using all the modules of the IPTS-TIM© software tool is 4 weeks, e.g., as following: Module\Week GD TD TW ME T&MEM DE&FEM FEI 1 2 3 4 This estimate would apply in the case of starting the evaluation with very little information on the new technology (and its potential market), and when exhaustive information is searched and used during the evaluation. Note that the market enquiry (ME) questionnaire can be sent to the targeted organizations in electronic form (ACCESS database) by e-mail. 3. Minimum PC requirements IPTS-TIM is developed in Visual Basic 6.0 for operation under Windows 95, Windows 98 and Windows NT, and uses ACCESS database. The minimum requirements to install IPTS-TIM are the following: · Display: 800 x 600 VGA resolution. · Processor: CPU 486 · Memory: 32 Mb RAM · Operating system: Windows 95/98/NT · HDD: 15 Mb. free. 8 IPTS-TIM 4. © Software – User’s Manual and Tutorial Software Installation The software requires two steps to install. Firstly, by executing the file Setup.exe (included in the CD-Rom) the setup will install the required files to operate the IPTSTIM software. After this first installation the system needs to be reinitialised. To do so, the user needs to turn off the computer. With this first step the computer has been prepared to be able to operate the software. After restarting the computer, the user needs to execute the file Setup.exe a second time. With this operation, the software installation will take place entering in the setup wizard for the installation of the IPTS-TIM . If the installation has taken place correctly, a message will appear informing the user that "the software has been installed satisfactorily". In the case of experiencing problems during the installation process, the IPTS-TIM support team can be contacted at the following e-mail address: [email protected] 5. Starting the software Once the software is installed, click on C:/Program files/IPTS-TIM Software/IPTSTIM_1.exe. The software then starts with a welcome window. To get more information about this program, click on “Overview” and the following screen will then appear: 9 IPTS-TIM © Software – User’s Manual and Tutorial This screen shows the software’s basic structure. To continue, close this window and then, click on the “Continue” button. Note: The first time that you are installing/using the software, a message will appear asking you to select the database. 10 IPTS-TIM © Software – User’s Manual and Tutorial By default, the software is installed in the directory: « C:\PROGRAMS FILES\ IPTS-TIM Software\ ». In most cases, the database is located in the same directory. It is sufficient to simply select the file and click on “open”. Otherwise, go into the directory where the database is located. If you do not have access to a name and password, you will not be able to go any further. By default, after the installation, the identification number is 462 and the password is « IPTS ». This information can be changed into the Software. At this stage, keyboard your user number and your password to connect. If you enter an invalid name or password, your connection will be refused, and you will be informed by a message. 11 IPTS-TIM © Software – User’s Manual and Tutorial If everything has gone well, you are now connected and you can enter the IPTSTIM database. 6. Use of IPTS-TIM 6.1. Interface with the user The IPTS-TIM main menu is presented in the following way: 2 1 3 1 The top left-hand part represents the main application menus. 2 The part below the application menu represents the toolbars, which you have access to. 3 The central part contains the main applications’ functions. 12 IPTS-TIM © Software – User’s Manual and Tutorial 6.2. Use of menus The application consists of 7 menu items: · Projects: Access to projects (creation, deletion…). · Evaluation: Access to evaluations · Market Enquiry: Access to Market Enquiry · Report: Access to the Report 13 IPTS-TIM © Software – User’s Manual and Tutorial · Configuration: Access to the Configuration · Windows: Access to the windows application · Help: Access to Help function Some menus contain sub-menus. 6.3. Tool bar The tool bar is a shortcut to the menu for certain functions. Depending on the screen you are on, it is possible to access certain functions directly through the tool bar. Create a new project (equivalent to « Projects », »New ») Open a project (equivalent to « Projects », « Open ») Save modifications (only in display mode of a project, equivalent to « Project », « Save ») Print the current window (equivalent to « Project », « Print ») Search for a project for a technology previously evaluated 14 IPTS-TIM 7. © Software – User’s Manual and Tutorial Creating a new project To create a new technology or project assessment, click on «New Project » in the window in the middle of the screen or click on « Projects», «New». The following screen will then appear: The Menu on the left part of the screen shows you the options to be followed to evaluate the technology / project. You can follow the example provided before you start your evaluation: You may want to first follow an example to become more familiar with the software before starting your technology/project'’ evaluation: Click on the «Technology Database» button and then select the technology/project listed with the Nº 1. 15 IPTS-TIM © Software – User’s Manual and Tutorial 7.1. General Data The general data concerns information about who is going to evaluate and a short/basic information about the technology or project being evaluated. If you select this option, the following window will appear: Once you have finished this task, click on the "save" button. The evaluation can continue only if this information is filled in. 7.2. Technical Description The input required in the technical description refers to technical information concerning the technology or the state-of-the art of the project, including information related to the situation with regards to: intellectual property rights, applications, innovation aspects, etc. This information is not compulsory, but the degree of completeness achieved will have a direct influence on the accuracy of the overall results obtained in the technology or project evaluation. 16 IPTS-TIM © Software – User’s Manual and Tutorial If you select the technical description option, the following window will appear: The Technology Description screen contains 6 steps. 7.3. Market Enquiry This module allows to identify the potential market attractiveness of a particular technology/project, including relevant economic information, alternative applications, potential market segments for technology application, etc. 17 IPTS-TIM © Software – User’s Manual and Tutorial © If you select this option from the IPTS-TIM menu, the following window will appear: The software provides a summary of the results from all Market Enquiry questionnaires received by the organisation/department regarding a particular technology. The full questionnaire is available in the software so that it may be sent and received electronically. The summary of results from the market enquiry are automatically consolidated and presented to the user in 12 steps. These results are provided in a read-only type form and cannot be modified by the user. (See annex 2 the full questionnaire form) 7.4. Technology Watch 1 - EU RTD Policies, Strategies and Programmes 7.4.1 Introduction to TW 1 The information relating to Technology Watch 1 is rather simple to use and takes little time. The information provided is about, in summarised form, the main lines of action supported under the Fifth European Commission’s Research and Technological Development Framework Programme 1999-2002. The objective of this task is twofold. Firstly, to identify and construct a synthetic overview of the EU major policy lines relevant to the set of pre-selected technologies, and secondly, to provide a methodology useful for the assessment of a set of technologies. This approach provides a quantitative methodology to perform a ranking on a set of technologies in accordance to the perceived embedding/adaptation of those 18 IPTS-TIM © Software – User’s Manual and Tutorial technologies to the EU policies' major lines of action. Therefore, the user evaluates, in quantitative terms, the closeness of a particular technology to the perceived current policy agenda. So, the role of this task is complementary to that of the foresight and technological assessment technology watch components. (See later) The user matches the technology with the main actions of the RTD Framework programme linked to the technology being evaluated. The system then records the ‘hits’ of each of the preselected technologies according to their matching with the different EC RTD Framework Programme action lines. The user further assigns to each matching EU RTD line found a score in the range -from 1 (poor linkage) to 5 (strong linkage)- to indicate the degree of adaptation of the EU programme/policy to the corresponding technology being evaluated. The TW1 indicator is computed as an average TW 1 Ζ 1 n n si i Ζ1 where i denotes action line, n is the total number of hits for the technology and s is the assigned score to the matching of each of the hits to the technology. 7.4.2 User’s guide A list of scientific and technological domains, structured in the tree-form is provided in the upper part of the screen. The user should click on the appropriate information and provide, on the inferior part of the screen, the level of importance for the technology/project under evaluation. This level of importance will be used later to calculate the TW1 index. If a scientific and technological domain does not fit to technology/project under evaluation, it is not necessary to enter 0 for importance. Simply skip it. If you select this option in the menu, the following window will appear: 19 IPTS-TIM © Software – User’s Manual and Tutorial 7.5 Technology Watch 2 – Prospective Study Analysis 7.5.1 Introduction to TW2 This component provides a digested overview of the results deriving from different foresight and critical technology studies carried out worldwide. This TW component transforms information of a qualitative type into quantitative information. The “technological orientation” character of the present methodology limits the scope to two types of studies: Delphi studies and Key/ Critical technologies studies The Key/ Critical technologies study consists in a list of technologies that are rated as critical according to a selected set of criteria. Furthermore, a national critical technologies list doesn’t include usually more than 100 technology families; thus it is targeted to provide a quick assessment of the technology being evaluated, despite the fact that it does not cover all aspects in detail of a given technological area. The expert provides a score on the range from 1 (lowest value) to 5 (highest value) considering the following criteria regarding the status, innovation, competition and market size based on the information provided by the system. The user matches the connection of the technology being evaluated with the topics contained in the prospective technological studies. The weights applied depend on: A. topic directly related with the technology 1 B. topic referring to enabling technologies 0.75 20 IPTS-TIM © Software – User’s Manual and Tutorial C. topic contributing to define a picture of the general frame for the development of the technology 0.50 D. topic referring to competing technologies 0.25 Technology Watch 2 module contains information originating from French Key Technologies study (under permission). This information provides - in addition to France’s position - the relative position of Europe as related to the technology taken into account. The software has been designed to be able to endorse additional worldwide prospective studies’ results. The computation of the TW2 indicator uses the following formula: TW 2 Ζ 1 n n i Ζ1 ξ(0.3Si Η 0.3I i Η 0.2Ci Η 0.2M i ).wi ζ where i refers to the topic found in the prospective study ( n is the total number of topic found related to a particular technology) and wi is the weight given to the matching of the topic with the technology being evaluated depending on their degree of correlation. 7.5.2 User’s guide If you select this option, the following window will then appear: Please select the appropriate sector/area found in the top window (in the figure "Health" was selected), which corresponds to the technology/project under evaluation, and then click on the more specific topic of the list that will appear to evaluate your technology; then click on the evaluation button. 21 IPTS-TIM © Software – User’s Manual and Tutorial There is no technology rating in the French Key Technologies study. Instead, comments and recommendations are provided for single technologies or for technology groups. Once the information is displayed (in the example, under "Transgenic animals"), you must read it and then provide evaluation values. To implement this task, click on the « Evaluation » tab. 22 IPTS-TIM © Software – User’s Manual and Tutorial For each technology considered in the French Key Technology Study (Tech.FKTS), the user should define the possible impact of the technology being evaluated (TechUnderEval), by providing the following information: - TechUnderEval direct relation with the Tech.FKTS - Current/future use and market the TechUnderEval - It could contribute to innovate as referring to the Tech. FKTS information or help in reaching future development targets. - Competing technologies to TechUnderEva This information is important because it contributes to a better evaluation of the technological project. There are no guidelines to value attribution: the evaluation should be carried out according to your experience and your understanding of the present situation and future developments. Once you have filled in the appropriate information, click on the « + » button to record it. In order to get rid of this module, click on the cross button. The TechUnderEval is displayed below with the criteria and values you have keyboarded. To delete the information you have provided in this module, please select it and then click on the « –» button. To modify the information you have, you should carry out the same operation from the beginning of this sub-module. 7.6. Technology Watch 3 – Analysis of other relevant information 7.6.1 Introduction to TW3 This component complements the user's available scientific and technological information with information retrieved from specialised information databases covering relevant domains for the commercialisation of the technology, such as intellectual property rights, industrial, market and economic databases. This component searches for information on exploitability and market attractiveness for a portfolio of technologies. In comparison to those, this methodology aims to examine the current status of the pre-selected technologies on a stand-alone basis using a number of complementary information sources. The framework methodology uses the following information sources: · · · · Database search Bibliographic examination Internet search Patents Database Search: On-line information providers make access available to a large number of databases, which cover many subjects and themes. The databases themselves are grouped into subject areas to ease searching. This was further 23 IPTS-TIM © Software – User’s Manual and Tutorial supported by two search modes, which allowed a structured approach. Most of these databases allow to perform searches based on keywords, sentences and boolean operator providing the number of “hits” from the search. Internet Search: The TW-Assessment component directs the user to pre-identified internet sites of recognised “quality”. These cover well-known scientific journals and international organisations, which specialise in publishing scientific and technological information. Patents Search: Access to on-line database information providers allows to search patent sources. Patent information can be a key indicator to assess the interest for the technology under examination. In the case where patents are already in place it is possible to gain supplementary information regarding its present status and validity. The TW3 indicator is constructed using a weighted average of the i references retrieved when conducting a search for a particular technology. The technology potential is evaluated considering four aspects: competitiveness C i , status S i , market M i and innovation I i ) applying different factor loadings according to the following formula TW 3 γ n n n n 1 0 . 2 C Υ 0 . 3 S Υ 0 . 2 M Υ 0 . 3 Ii i i i n i Ζ1 i Ζ1 i Ζ1 i Ζ1 7.6.2 User’s guide If you select this option, the following window will appear: 24 IPTS-TIM © Software – User’s Manual and Tutorial Firstly, you should keyboard the source that may have the name concerning this nformation. The link may contain a description or URL if the information comes from the WEB. Finally, « Number of reference » serves to indicate the name of the data found for this source. Once you have this information, in is convenient to give a level of importance for innovation, Competitiveness, Market and Status in order to be able to calculate the index. Repeat these operations as many time as necessary. 8. Technology Ranking from TW results 8.1 Introduction This module allows to compare projects/technologies with information from the three TW sub-modules. The technologies/projects are ranked in function of a Standardised Index. The Technology Watch ranking is elaborated from the combination of the results of the different TW indicators. Since the TW indicators were developed independently, in order to make them comparable, the scores of the three independent TW indicators are standardised according to a normal distribution xi ~ N (0, ″ ) . After the scores are standardised (i.e. STW1, STW2, STW3), a joint index or Total Weighted Score (TWS) is computed according to the following formula: TWS _ 3 pi z i i Ζ1 where pi is the weighing factor and z i is the standardised score for each of the factors. The pi applied by default to each factor is 1/3. The results for the TWS allow to rank a portfolio of technologies. 8.2 User’s guide To get this ranking information, click on « Report » and «Technology/Project Ranking». The screen shown below will appear: 25 IPTS-TIM © Software – User’s Manual and Tutorial This window includes the following information for each technology or project: Technology Code: Identifying Project/Technology Technology Name: Technology/Project title TW1: Technology Watch 1 Index TW2: Technology Watch 2 Index TW3: Technology Watch 3 Index Average: Average of Technology Watch 1, 2 and 3 indexes STW1: TW1 Standardised index STW2: TW2 Standardised index STW3: TW3 Standardised index TWS: Total Weighted (Standardised) Score index (it may be positive or negative) Final Ranking: Technology ranking from 1 (highest value/position) to ∞. 9. Technology and market evaluation module (T&MEM) 9.1 Introduction The technology and market evaluation module (T&MEM) permits to evaluate, in detail and in a structured and traceable way, the technology or the project. This module is composed of 53 evaluation steps that correspond to 20 indicators, which belong under the four main criteria (Development level, Innovative potential, 26 IPTS-TIM © Software – User’s Manual and Tutorial Market potential, Strategic Importance). In each evaluation step you should define the level of relevance for the technology under examination, and this allows you to give the project a total score. The total score has a top value of 100 (i.e.: the technologies or projects closer to 100 are better than that closer to 0). 9.2 User’s guide The following dialogue box will appear at the beginning: 2 1 6 3 4 5 1 Reminder of the technology or project you are evaluating 2 Provides TW1, TW2 and TW3 indexes as possible reference information 3 Indication of the technology related to the evaluation criterion and the description of its specificity. 4 Allows you to define the level of relevance for the technology under examination 5 Navigation interface (same menu as for a new technology/project evaluation) 6 The “Info TD/ME” and “Info TW” buttons allow you, at any moment, to display the information you have already selected and worked out (i.e. in Technical Description, Market Enquiry and TW modules), which is relevant for the evaluation criteria and the related specific questions you are dealing with to evaluate. 27 IPTS-TIM © Software – User’s Manual and Tutorial As already mentioned, in each evaluation step you should define the level of relevance for the technology under examination (0 for the weakest, 5 for the strongest). To move from one question to another, click on « Back » or « Next ». At any time you can stop evaluating through the T&MEM evaluation steps by clicking on « Cancel ». Once all the 53 questionnaires have been properly worked out, please click on « Finish ». 10. T&MEM’s Synthetic Result This screen allows you to display the Technology and Market Evaluation results in a tree type of diagram and in function to the main four evaluation criteria (i.e.: Development Level, Innovative Level; Market Potential; Strategic Importance). To access this function click on “Charts” button in the left menu. 3 1 4 2 28 IPTS-TIM © Software – User’s Manual and Tutorial 1 Structure of the T&MEM’s index 2 Technologies/Projects for comparison 3 Numerical values 4 Graphical representation of the data This graph representation is useful to examine the elements of the scoring table. In this example, by clicking on « Technology level », you can display the importance of « Technology » and « Industrial Applications » in graphical and numerical form showing the relative values of the four main evaluation criteria. This screen also allows you to compare technologies/projects. To do this, click on « Compare Technology ». A dialogue box will be opened; then select the technology/project you wish to compare and click on « OK ». You can now compare 2 (or more) projects/technologies: 29 IPTS-TIM © Software – User’s Manual and Tutorial 11. T&MEM’s synthetic result by specific indicators This function allows you to display the relative importance of each of the 20 indicators on the T&MEM synthetic result. These indicators are usually grouped in four main evaluation criteria: Development; Innovation; Market Strategy (e.g., see previous section). It allows you to better appreciate the Technology's strong and weak points according to the T&MEM evaluation. The structure of the T&MEM's indicators is the following: 30 IPTS-TIM © Software – User’s Manual and Tutorial To display the indicators graph, click on the “Charts” button in the left menu and the “Indicators” option on the toolbar. The following screen will appear: The graph represents the importance of each indicator on the T&MEM for the technology/project. The sum of the 20 indicators' values represents 100% of the synthetic value result of the Technology/project. The value of each indicator shown in the graph is in percentage form. 31 IPTS-TIM © Software – User’s Manual and Tutorial 12. Detailed Economic and Financial Evaluation module (DE&FEM) 12.1. Introduction This module (in effect it can be considered an input-output module) establishes possible scenarios for the commercialisation and transfer of the technology. Since this module is based on quantitative information, the module evaluates expected returns of technology transfer processes. Basically, the model calculates common formulas for investment projects decisions such as net present value, return on investment, pay-back and others more common to technology transfer processes such as maintenance fees, royalty shares as well as opening the possibility to incorporate decision under uncertainty through the use of decision trees analysis. The Detailed Economic and Financial Evaluation Module (DE&FEM) can be considered a stand-alone module or it can be integrated with the rest of the © modules of the IPTS-TIM . This module is based on the Technology Valuation © Spreadsheet Valuate developed by Martha Luehrmann from the Lawrence Berkeley National Laboratory for the University of California. The module permits to perform, for a technology investment project, a detailed economic and financial evaluation on the potential profitability of the project. © Integration with other IPTS-TIM Modules Based on the results of the DE&FEM, the user assigns a value on a scale from 0 (no information available) to 5 (high relevance) to serve as an input for the Final Evaluation Index (FEI). General operation of the Detailed Economic and Financial Evaluation Module In the DE&FEM module, the cells which refer to the basic inputs that can be modified by the user are shaded in PURPLE. Unshaded cells are calculated automatically by the software program. 12.2. User guide To access this module, click on « DE&FEM » in the left menu. The DE&FEM is made up of 10 basic steps which are briefly described below: 32 IPTS-TIM © Software – User’s Manual and Tutorial Step 1: Basic Input This screen request the user to provide the basic input required in the economic and financial evaluation of the project: Discount rate: Rate of discount used to convert future costs and benefits into equivalent present values; typically 20-30% for projects which involve uncertainty Royalty Rate Consideration paid by a Licensee to a licensor for the right to make, use and/or sell an Invention when the product is already on the market (commonly as a percentage on total sales) Minimum royalty Consideration paid by a Licensee to a licensor for the right to make use and/or sell an Invention when the technology is still in the development stage for commercialization. The values of the parameters given by the user will remain constant for the whole life of the project, although the user could modify them in order to see its effect under alternative scenarios. 33 IPTS-TIM © Software – User’s Manual and Tutorial Step 2: Firm Data The user should provide, on this screen, an estimate of the yearly sales of the products incorporating the technology being evaluated and of the different costs involved in the commercialisation of the product (e.g. costs of goods, selling and administrative costs, R&D costs, …) as well as the license maintenance fee. 34 IPTS-TIM © Software – User’s Manual and Tutorial Step 3: Licensor Data The Licensor Data Table provides a synthetic overview of the Licensor revenues (total revenues, NPV, royalty rate) Cumulated Net Present Value The calculation of the NPV is one of the basics of finance. The cost-benefit flows are discounted to reflect the time value of money. The cumulated net present value (CNPV) considers all future cost-benefit flows. The value of the discount rate is determined by the decision-maker. The CNPV is the current value of a stream of future payments. Let CFt be the cash flow at time t and r is the interest rate. Suppose we have T future cash flows that occur at times t1,t2,…,tT. CNPV Ζ T CFt (1 Η r ) t t Ζ1 If compounding is continuous, the CNPV is calculated as follows CNPV Ζ T e ϑ rt CFt t Ζ1 35 IPTS-TIM © Software – User’s Manual and Tutorial Step 4: Summary of Results Provides a summary overview of the returns accrued to the Licensor and the Licensee during the whole life of the product, including the return on the investment to the licensee and the break even year Internal Rate of Return The internal rate of return (IRR) of a cash flow is the interest rate that makes the present value of a cash flow equal to zero. The IRR provides the rate at which future benefits should be discounted in terms of today's value. It provides decision-makers with a value expressed in percentage terms rather than in any other metric. IRR is a method to determine the value of a project that does not depend on an arbitrary identified discount rate. The IRR method requires the calculation of a discount rate such that the discounted value of future cost-benefit flows equal the initial investment. In other words, the IRR is the rate that makes zero the NPV, the present value of cost flows minus the present value of benefits. IRR is based on the assumption that the cost-benefit flows are reinvested at the internal rate of return. 36 IPTS-TIM © Software – User’s Manual and Tutorial Step 5: Sensitivity of Royalty Rate The Sensitivity Analysis of the Royalty Rate permits to examine the changes in results of the analysis when the implied royalty rate is varied over a specified range. 37 IPTS-TIM © Software – User’s Manual and Tutorial Step 6: Cash Flows to Company Concerning the licensee, this Table provides detailed information on the cash flows generated. The user can modify some of the cells. 38 IPTS-TIM © Software – User’s Manual and Tutorial Step 7: Decision Tree Analysis Introduction Decision Tree Analysis A decision tree describes the decision options available to the decision-maker at each relevant point in time (decision points) and the uncertain events that can occur at each relevant point in time (chance points). A decision tree is a tool that facilitates the process of decision making under uncertainty and with many interrelated alternatives. Decision tree analysis assumes that the criterion used by the decision-maker is the expected value. Basically, a decision tree consists of a graphical representation of a decision problem. In the tree, all the branches represent both acts and events. A square node in a decision tree represents a point where a mutually exclusive decision has to be made. A round node represents a point where one of the uncertain mutually exclusive states of nature can occur. At the end of the branches the payoffs are shown for each of the alternatives (terminal value). The elements needed to build a decision tree are the cash flows that result from the decisions and chance events and the probabilities assigned to each of the chance events. A probability is assigned to each branch originating at a chance node and the probabilities at each chance node must add up to one. The assignation of probabilities to possible events is normally based on experience, knowledge and prediction. These probabilities are, most of the time, of a subjective character and depend on the decision-maker. Each decision and chance have cash flows assigned with it (positive, negative or zero). Adding up the cash flows along each path, or scenario, generates the terminal value to each terminal node of the tree. Decision tree analysis is resolved by working backwards from the final decision or chance nodes, to previous decision or chance nodes, calculating the payoff value associated with each node of the decision tree. The payoff value at each chance node is the expected value of the payoffs of each of the subsequent nodes while at each decision node is the branch associated with the highest payoffs. The simplest approach to incorporate a time factor in tree analysis is introducing all the cash flows in the form of discounted cash flows from the initial decision point. Decision trees are used to reproduce sequential decision problems under uncertainty. The following Figure provides an illustration of a decision problem. 39 IPTS-TIM © Software – User’s Manual and Tutorial Operation of decision Tree Analysis The user should provide the dates and the probability of success of the critical trials involved in the technology industrial production and demonstration phases. The program will calculate the joint probability of success at each of the trials as well as the Cumulative Net Present Value to each of the parts in the negotiation, the licensor and the licensee and the percentage the licensor represents in the CNPV. Finally, the program will compute the expected value of the overall project taking into consideration the critical trials involved. 40 IPTS-TIM © Software – User’s Manual and Tutorial Step 8: Net Present Value (NPV) and Probability A Figure plots in a bar diagram the results of the decision tree analysis provided in the previous screen 41 IPTS-TIM 13. © Software – User’s Manual and Tutorial Final Evaluation Index (FEI) 13.1. Introduction The Final Evaluation Index (FEI) is a module combining the results of the “Technology and Market Evaluation” Index and the “Detailed Economic and Financial Evaluation” Index. The formula to calculate the Final Evaluation Index defines a weighted average of the T&MEM Index, which is based on purely qualitative information as a primary source, and the DE&FEM Index which is based on quantitative information as a primary source. The formula to compute the Final Evaluation Index (FEI) is FEI _ wSTI STI Μ wFEV FEV where STI is the scoring table index and wSTI is the weight applied to this index and FEV is the Financial and Economic Evaluation Index and wFEV is the weight applied to the Financial and Economic Evaluation Index. 13.2. User guide To access this module, click on « Charts» in the left menu. The following screen will then appear: 42 IPTS-TIM © Software – User’s Manual and Tutorial This screen allows you to input the relative weights that T&MEM and DE&FEM should have in the Final Evaluation Index’s score. To continue click on “OK” and then select, in the following screen, a chart type. Then a similar screen will appear: 43 IPTS-TIM 14. © Software – User’s Manual and Tutorial Software configuration This menu concerns the application parameters. To access to it, please go to the "Configuration" menu. It should be carefully used because it allows the user to access the database structure and the T&MEM. Furthermore, Technologies Watch 2 calculations can be as well modified. 14.1. User Manager This screen allows you to add, modify and delete the information about the software’s user. There are 2 types of users: - Normal user - Super user The “super user” can access all the software’ functions. The “normal user” has fewer options; he/she is limited mainly to the consultation of information and cannot modify it. Create user Delete user 44 IPTS-TIM © Software – User’s Manual and Tutorial 14.2. Information on the T&MEM indicators When the user enters information on the T&MEM module to evaluate a technology/project, he/she can, at any time, use the « info » button to consult the concerned indicators/evaluation criteria they are referring to, and in which module have been used, while evaluating the technology/project. This screen shows the indicators/evaluation criteria and the origin of the information (from Technical Description and Market Enquiry modules) and the availability (of specific information). 2 1 3 1 53 indicators/evaluation criteria of the “Technology & Market Evaluation Module” 2 Origin of information (i.e. from Technical Description and Market Enquiry modules) 3 The relation/links between areas of input information (see figure, right column) and the indicators (see figure, left column) is already initialised by default. If you would like to modify it, you can do so through a simple operation: 45 IPTS-TIM © Software – User’s Manual and Tutorial On the right-hand side of the menu/list, select the origin of the information, as for example, « Technical Description ». On the menu/list, all the names of the available origin-fields will come up. To add a field of a specific question into the T&MEM, please select the field and drag it to the element of the T&MEM on the menu-list. If an element is not correctly placed, please select it on the menu-list on the right-hand side and press the « Suppr » button on your keyboard to delete it. 14.3. Change T&MEM Indicator Weights If you want to apply different T&MEM indicator weights to ALL technology or project evaluations to be evaluated, go to « Configuration » menu, « T&MEM» and click on « Weights ». The following screen will then appear: 46 IPTS-TIM © Software – User’s Manual and Tutorial You can now change the weights by simply moving the little bars that are located in the right part of the screen. If you want to apply these changes to only ONE technology or project evaluation, you must open the Technology/project file first from the main menu, and then click on «Weights» in the left menu. The changes will be applied only to that Technology/project evaluation. 15. Contact Information For additional information, or for any suggestion you may have, you can contact the European Commission’s JRC-IPTS by sending an e-mail to: [email protected] or writing to the following address: European Commission Joint Research Centre Institute for Prospective Technological Studies W.T.C., Isla de la Cartuja s/n, 41092 Sevilla (Spain) www.jrc.es 47 IPTS-TIM © Software – User’s Manual and Tutorial APPENDIX 1 to the IPTS-TIM © User’s Manual T&MEM Indicators and their Default Factor Scales Definition Indicator 1: Advancement status/Technological progress Measurement of the advancement reached by the researchers in the considered technology development, considering technology innovation as the OECD (Oslo Treaty manual) approach – new product, production process, delivery process, service or methodology. It is done through four factors: 1. Concrete results availability with a clearly established functionality, as prototypes in the case of process or product technologies, or as a well defined set of detailed technical specifications allowing the construction of a prototype or the supply of technology services (materials properties characterisation, e.g.). The finishing level of that prototype or the technological specifications readiness are to be considered among the most important evaluation elements, because they involve not only the reduction of further technology industrialisation expenditures, but even the own technology credibility in relation with the market. 2. The number and kind of RTD projects developed by the organisation in order to obtain or to validate the considered technology is another of the factors. It is important not only to validate the in progress or accomplished projects, but even the projects orientation: applied focuses as different to more fundamental or basic research focused projects, which have different meaning when confronted with the results exploitation. 3. The existence of scientific and technical papers is another complementary factor in the evaluation, being the elements to consider not only the kind of documents published (preliminary reports or the result of research accepted by scientific journals), but also their basic science- or technology orientations. 4. The engagement and availability of a scientific research team is linked to the possibility of answering any demand of going ahead with the development or of modifying it to get a more suitable result to be transferred. 48 IPTS-TIM © Software – User’s Manual and Tutorial Fac- 1.1.1.1. tor ADVANCEMENT STATUS (1) 0 1.1 Available Prototype / Tech. Not defined Specs 1.2 Development Projects No projects 1.3 Publications 1.4 Engaged Scientific Team 1 Basic definition 2 Prototype devel. scheme 3 4 5 Weight Source Initial prototype Final prototype untested Final prototype tested 35% TD Generic Research Applied Tech. Projects Projects in progress Completed Applied / Tech. Development Projects Validation Projects/Projects under Contract in progress Completed Validation Projects/Projects under Contract 35% TD No publications Congress papers submitted Congress proceedings Scientific Publications Technical Reports Dissemination disclosed Publications. 10% TD Dispersed Team Several Teams not Fully involved Shared / Distributed Responsibility Engaged Senior Responsible Consolidated Sc. Scientific & Team Marketing Team 20% TD 49 IPTS-TIM © Software – User’s Manual and Tutorial Indicator 2: Early concept Considering the technology novelty from the market or the competence point of view involves the reference to the maturity of every development in this field: 1. Likely, the existence and the advancement level of third parties alternative projects become a reference element to evaluate the market interest or importance of the analysed technology. 2. As a complementary reference are to be considered the third parties publications, according to the time when they have been published, Three years has been chosen as the reference period to consider an accentuated decreasing of the technology importance. 3. Sharing this same point of view even more important is the coming up of new RTD papers or publications. It has been considered the readiness of new publications on a particular technology the best level to be considered as the earliest technology concept. 1.1.1.2. EARLY CONCEPT (2) 2.1 Third Parties Devel. Projects in Progress 0 Unknown 2.2 Third Parties Last Public Unknown/More Innovative Disclosure Date than 3 years 1 2 3 Technology available Prototype developed 2 yrs. < < 3 years 1 yr < < 2 years Last 12 months disclosure 4 Development Exploratory projects running Stages 2.3 JRC Last Public Disclosure More than 3 years 2 yrs < < 3 years 1 yr < < 2 years Last 12 months / Unpublished disclosure Date 5 Weight Source No projects under 25% development Recently Non-existent disclosed (last 6 months) TD/TW 25% TD/TW Recently Disclosure under 50% disclosed (last 6 preparation months) (approved abstract) TD 50 IPTS-TIM © Software – User’s Manual and Tutorial Indicator 3: Product/Process differentiation Giving advantage to a technology to be sold is not only its ability to show new possible solutions to a determined problem, but also its differentiation related to other alternative solutions. The following factors give expression of that: 1. Performance improvement and the supply of a better quality solution show a difference between the present and other usual technologies. That improvement can refer only to functionality or mean also a qualitative change. 2. The user friendliness of the technological solution considered is an additional key element, when the requirement of a high level of technology specialization could hinder the transference possibilities. 3. Last but not least is the solution improvement as far as the availability and final price, in relation to existing technology solutions. Fac- 1.1.1.3. PRODUCT/PROCESS tor DIFFERENCIATION (3) 0 3.1 Performance Improvement Not evident 3.2 Friendly Use / Easy Operational Very Difficult Operation Access 3.3 Higher Availability / Better Price Unpredictable terms or costs 1 Similar Performance Difficult Operation 2 3 Small Medium Improvement Improvement Highly skilled personnel Not clear price or Similar to present availability supply improvement Specifically trained personnel Light improvement in availability / price 4 High Improvement 5 Weight Source Qualitative Improvement 45% Intuitive Operation 20% Generally trained personnel Best Accessibility 35% Strong improvement in and Price availability / price TD/TW TD TD/TW 51 IPTS-TIM © Software – User’s Manual and Tutorial Indicator 4: Sunk costs The organisation research team effort spent in development is an actual entrance barrier for other possible entrants, so much important as high have been the costs and the difficulties overcome. 1. Firstly the needed expenditures to end the technology development and the possibility of recuperation through the exploitation of results. 2. The development time needed for the development, even when it could be shorter for a new entrant than the spent by the organisation RTD team, due to new knowledge available or to a new perspectives of economic results appeared. 3. Breakthrough development risks -- at one or several different process steps -- will generally be lower for new entrants as far as new information is available on the probability of final success of the technology development. 4. Accessibility to financing sources for development means an actual barrier for new entrants: accessibility to public financing will be reduced -- except in the case of a competitor supported by national or political reasons -- , and the investment decision of a competitor, being it a company or a research centre, is conditioned by the interest of the technology and the advantage situation reached by the RTD team. 52 IPTS-TIM © Software – User’s Manual and Tutorial Fac- 1.1.2.1.1. tor SUNK COSTS (4) 0 1 2 Low High probab. specifically break-even associated costs attained 3 4.1 Cumulative expenditures Irrelevant in development 4.2 Development time requested Irrelevant < 6 months 4.3 Risks of break-through Irrelevant Low incertitude Medium incertitude in one during development development steps Medium incertitude in several development steps 4.4 Possible Sources of Financing for a new entrant 100 % Public funding Devel. under contract 4 Medium probab. Low probab. break-even break-even attained attained Source Non-proportional 30% to any expected returns TD > 3 years 25% TD High incertitude in several development steps 30% TD < 50 % Public RDT Total self50 % Public Programmes funding financing Programmes funding (e.g. FP, (Basic research) pre-competitive stages) 15% TD/TW 6 months < < 12 1 yrs < < 2 years 2 yrs < < 3 years months > 50 % Public Programmes funding 5 Weight High incertitude in one development steps 53 IPTS-TIM © Software – User’s Manual and Tutorial Indicator 5: Learning curve The learning curve of any entrant in a new technology field, that is, the time necessary for tackling a new development in an up to then unknown technology decays powerfully with time engaged in the field. However it means a strong barrier for new possible competitors. This indicator is defined by a group of three factors: 1. The competitors' research team, its qualification and eventually its specific orientation towards the particular technology field. 2. New entrants experience and awareness with the technology. 3. The needed time to reach valuable results in the research, even when the former factors were highly qualified. Fac- 1.1.2.1.2. tor LEARNING CURVE (5) 0 1 2 5.1 Competitor Research Team Not necessary Common team members Low profiled team members 5.2 Competitor existing research field Not necessary Some experience High experience in connected in connected fields fields 5.3 Updating time for new entrants Not necessary Short term research ( < 6 months) Short term research (6 months< < 12 months) 3 4 5 Weight Source Specialised team High qualification Specifically HQ 35% members needed personnel trained personnel TD General Specific Long time broad 35% experience in the experience in the experienced field field research in that field TD 30% TD Medium term research (1 yr < < 2 years) Medium term research (2 yr< < 3 years) Long term research ( > 3 years) 54 IPTS-TIM © Software – User’s Manual and Tutorial Indicator 6: Needed infrastructure Finally, a new competitor could find another entry barrier to be able of developing the technology by itself: the availability of infrastructure, instruments or singular equipment needed to work: 1. Needs of infrastructure and equipment for the project development could mean for new entrants a high barrier according to their specificity for that technological field, and also depending on the lack of suppliers of the needed equipment. In the limit the difficulties would be established by the necessity to proceed to perform a specific design of the equipment needed for the technology development. 2. Likewise, the importance of the difficulties for new entrants to use third parties facilities would mean an additional barrier. The last factor considered is the investment amount needed to get the research labs or equipment. 55 IPTS-TIM © Software – User’s Manual and Tutorial Fac- 1.1.2.1.3. tor NEEDED INFRASTRUCTURE (6) 0 1 2 3 4 5 Weight Source Non available 50% and sophisticated equipment / Fulindoor development Easy but high Difficult access Non existing / 25% cost access Singular infrastructures existent Medium cost High cost High cost 25% single application multipurpose single investment investment application investment 6.1 New entrant facilities and equipment Not necessary Fully available Restricted access Partially available equipment / Partial indoor development needed 6.2 Accessibility to 3rd Parties infrastructure Not necessary Fully accessible Easy and low cost access 6.3 Level of investment needed Not necessary Low cost investment Medium cost multipurpose investment Restricted access and partially available TD TD TD 56 IPTS-TIM © Software – User’s Manual and Tutorial Indicator 7: Intellectual property rights Besides the access barriers to technology coming from the difficulties derived from the new entrant features, other barriers have to be considered: the level of protection of the technology: 1. The level of protection established or in progress, as patents or design registration. 2. When existing Intellectual Property Rights, the geographic coverage range. This is a factor successive to the previous one. 3. A complementary factor to the first one -- even when sometimes could be alternative --- for intellectual property protection is the secrecy: the dissemination control of the key information of the technology. 4. The positive protection for the transfer compromises acquired or the co-property diminishes the technology represented by the former factors derived from co-operation of the RTD organisation with third parties in the development. 5. The extreme evaluation of this factor ("IPR sold") meaning the losing of the technology property is ion of the constraints resulting in a "nought" for technology transfer, and so is a reason to remove it from the technologies list to be evaluated. 57 IPTS-TIM © Software – User’s Manual and Tutorial Fac- 1.1.2.2. tor INTELLECTUAL PROPERTY RIGHTS (7) 0 1 2 7.1 Patents Non applicable Patentable results Filing foreseen 7.2 Geographical coverage Non applicable 1 country 7.3 Secret know-how Openly disclosed Openly disseminated information in scientific circles 7.4 Acquired compromises I.P.R. sold 3 Patent applied /pending 4 5 Weight Source Partially patented Fully patented technology technology 40% TD E.U and/or USA and/or Japan 15% TD 30% Restricted access Access limited to Very limited Well known to information the research team number of information persons among specialists acquainted under confidentiality contract TD Several European E.U. countries World-wide Exclusivity rights Licensed, non Shared I.P.R. (as Collaborative Exclusive temporarily exclusively, rights project result, result of research ownership granted e.g.) 15% TD 58 IPTS-TIM © Software – User’s Manual and Tutorial Indicator 8: Applications already known One of the keys to the success in the technology transfer processes is derived from the functionality of the technology for the applications to that is oriented. As far as the already known applications are concerned -- even when there has not been a validation of the technology -- there are the following factors to be considered: 1. The number of different applications to be addressed, and the industry sector where they could be of interest. Clearly a new sector can supply new perspectives of growth to a particular technology already applied in other sectors. 2. The actually established links with companies of possible interest for transference of the technology, and the kind of expressions of interest (contracts, project co-operation, generic relationship) coming from the industry. 3. The attained success in the concrete application of the technology, happening under very different conditions, from the research premises to a real and more restrictive industrial environment. 4. The validation process to overcome from the present situation onwards. 59 IPTS-TIM © Software – User’s Manual and Tutorial 1.2.1. Fac- APPLICATIONS tor ALREADY KNOWN (8) 0 1 2 3 4 5 Weight Source One identified Several identified Deeply known or A broad field of 30% present specific application sector applications / applications application / sectors sector TD/ME 8.1 Differentiated Application Unknown / No One application identified in confirmed / Industries envisaged application field restricted fields (e.g. nuclear) 8.2 Expressions of Interest Non-existent General One company expression of collaborating in interest by one or research more companies Several One company companies engaged under collaborating in contract research (e.g. FP) Several companies engaged under contract 30% TD 8.3 Successful Experiences Non-existent Own laboratory positive results Pilot development Tested under under contract industrial conditions Certified product 20% ready for market TD 8.4 Validation period Not defined Short period of Long time period Medium time of validation (> 1 validation period validation pending (1 year> pending (< 3 yr) pending months) > 3 months Market validated 20% product TD Success on a collaborative project Industrial validation finished 60 IPTS-TIM © Software – User’s Manual and Tutorial Indicator 9: Potential applications This indicator has not associated factors separated, and has a successive coverage with the former Indicator 8. It only refers to generic and not confirmed technology applications. Fac- 1.2.2. tor POTENTIAL APPLICATIONS (9) 0 1 2 3 4 5 9.1 Unknown One general application conceived Several general applications expected One potential field of application detected Several possible fields of application detected Wide field 100% of possible applications (not confirmed) Potential Applications / Industries Weight Source TD/ME/TW 61 IPTS-TIM © Software – User’s Manual and Tutorial Indicator 10: State-of-the-art In former indicators the referred technology was the one developed by the organisation itself. On the contrary, in this case refers to the development situation of the competitors; therefore the assigned marks in the scales corresponding to the different factors are contrariwise proportional to the fulfilment of the commented situations. 1. The evaluation corresponding to the technology through this factor is also inverse to the suitability and the advanced level of the similar solutions found in the market. 2. Likewise happens to the existing protection for similar solutions. In relation to this factor only when there is a certainty on the non-existence of similar developments, the lack of information on the technology involves a high mark to be assigned. 3. Lastly, the existence of products or technological services in the market is the element that can allow positioning the analyzed technology related to the "de facto" state-of-the-art. 62 IPTS-TIM © Software – User’s Manual and Tutorial Fac- 2.0.1. tor STATE-OF-THE-ART (WORLDWIDE) (10) 0 1 10.1 Evolutionary Present available concurrent Advanced concept solutions solutions technological solutions fully adequate provided 10.2 Patents / Publications 10.3 Products already marketed Mature products on supply Partially Patented technology / Not protected technology applicable Recently marketed products 2 Conventional technologies available 3 4 Weight Source Advanced generic No technological 20% Partial solutions solutions technological envisaged solutions existing researched Detailed technical Papers published Congress information with general information disclosed information published Already announced products, not available 5 No information existent Partially Alternative, No product equivalent lower-grade marketed products available products available TW 30% TW 30% ME/TW 63 IPTS-TIM © Software – User’s Manual and Tutorial Indicator 11: Transferability This indicator refers to the possibilities of technology transfer according to the characteristics of the industrial space (especially the European). The possibilities of exploitation of a technology are linked to the possibility of finding an adequate environment at the moment when the technology is ready for the market and represents an innovative input in that industrial environment. 1. Existence in the region of adequate companies, from the perspective of their technological, commercial and financial capacity, specially the existing relationship between them and the organisation. 2. Technology attractiveness for industry can be evaluated as a function of the reaction registered coming from those companies that have been involved in this particular development. 2.0.2. TRANSFERIBILITY Fac- (EUROPEAN tor INDUSTRIAL BASE) (11) 0 11.1 Existing external conditions No company identified to transfer (company size, technological capacity, particular interest in that field of technology) 11.2 Attractiveness for the industries Rejections registered 1 2 3 4 5 Weight Source Generally identified companies One company with the right profile (size, capacity), in contact Several companies with the right profile, in contact One company collaborating on commercial developments. Several companies collaborating on commercial developments. 45% ME/TW Objections registered Not direct confirmation of interest More than one expression of interest Negotiations on TT engaged Partial TT agreements attained 55% ME/TW 64 IPTS-TIM © Software – User’s Manual and Tutorial Indicator 12: Time to market The ever-diminishing terms for industrial exploitation of research results expose the value of the time-to-market for the technology that has ended its pre-competitive development stage. Factors included in this indicator are in practice inverse to those contained in Indicator 4 (Sunk costs). There was mentioned the importance of the factors for third parties trying to compete with the RTD organisation. Here the same importance makes reference to the analyzed technology. 1. Transforming technology in a marketable product or process, what is called industrialization process, involves costs often much higher to transference costs and even to development costs, and underestimate them results very often in the failure of technology transfer negotiation. 2. The same could be said in relation to the needed time for suitability of the technology to the market. 3. The failure risks in this process are closely linked to the development level of the transferred technology, which is very different according to every kind of them. 65 IPTS-TIM © Software – User’s Manual and Tutorial Factor 3.0.1. TIME TO MARKET (12) 0 1 12.1 Product/process industrialisation cost Not quantifiable / Relevant / higher Similar to TT than TT costs costs extremely high costs 12.2 Time needed Not quantifiable / Time between 2-3 Time between 1-2 Time between 6 Time less than 6 yrs. yrs. months and 1 yr. months extremely long time 12.3 Risk of breakthrough in industrialisation Undetermined risks High risk foreseeable 2 Valuable risks 3 4 Costs lower than Low-relevance the TT cost costs Measurable risks, Incidental risks accurately evaluated 5 Weight Source No additional costs 40% TD/MA Ready to use technology 35% TD/MA Certified / Standardised technology 25% TD/MA 66 IPTS-TIM © Software – User’s Manual and Tutorial Indicator 13: Market barriers The market barrier indicator evaluates the hindering factors in technology transfer coming from the demand market features or from technology users, and likewise those factors derived from the technology marketable features. 1. When the number of companies possibly interested in the technology is very small (that even can be interested in a gradual arrival to the market, according to their own position in it) the evaluation of the technology is very different to the opposite situation: a completely open market. 2. Knowledge on the technology or its functionality disseminated in the industry can favour the technology transfer, being the process much more difficult when there is no awareness on the proximity of the technology to the solution of concrete problems. 3. Versatility as a quality of the technology and its complementary character to other existent and already applied technologies represents an important advantage for it. 4. Use of technical barriers, coming from specific regulation or from "de factor" standards laid by the market continues to be one of the main constraints to enter new markets, including the technology market, in spite of the European Union and other institution efforts. 67 IPTS-TIM Factor © Software – User’s Manual and Tutorial 3.0.2. MARKET BARRIERS (13) 0 1 2 3 4 Regional / Sector Well positioned dominant position suppliers 13.1 Monopoly situation in the market World demand monopoly Monopoly situations in several regions / sectors Dominant position of a restricted group of companies 13.2 Users awareness with the technology Undetected or non-formulated links between the technology and existing problems Solutions expected in that particular development line Partial awareness Knowledge of of the possible previous stages of users with the development technology 13.3 Technology specificity and complementarity Insufficiently defined / known applications Extremely specific users / applications One well defined Several well Wide number of application defined users and users in several applications applications 13.4 Technical Barriers Strictly established regulations / previous certification needed Defined period to De facto standard Best practices to be fulfilled widely obtain established certification Generalised dissemination of simpler solutions in the same technological field Current supplier(s) solutions well known 5 Weight Source Openly accessible 40% market ME/TW Knowledge and 15% general acceptance of the technology ME/TW Wide versatility 15% TD/ME Non-existent 30% TD/ME 68 IPTS-TIM © Software – User’s Manual and Tutorial Indicator 14: Possible Market Share According to the features of the foreseeable application markets, and specially the presence of other technological solutions providers, the relative importance of the RTD organisation technology should be considered, and therefore a possible market share to be attained. There are evident difficulties to perform this evaluation, although it is necessary to attain a correct evaluation of the technology. Fac- 3.0.3. tor POSSIBLE MARKET SHARE (14) 14.1 Exclusivity (Foreseeable market share) 0 Negligible share 1 Numerous suppliers 2 3 Small number A few likeky of suppliers suppliers 4 Potential suppliers identified 5 Weight 100% Highly exclusive situation / slave market Source ME/TW 69 IPTS-TIM © Software – User’s Manual and Tutorial Indicator 15: Market size When referring to the market size of the technology it is meant the collection of problems that could be solved optimally by it. Therefore a wide estimation of the different markets where the technology is oriented is to be done: 1. The independent consideration of the European market is coming from its specific character related to other markets as the American or the Japanese, but most importantly due to its proximity and the policy orientations given to the organisation research. Even more, this concept of proximity applies especially to technological services. 2. The rest of the world markets are analyzed from the same view as the European, although only for some technology accessibility and proximity play the same role as in Europe. 3. The market growth refers only to those most relevant for the considered technology, being in general European markets. 70 IPTS-TIM © Software – User’s Manual and Tutorial Factor 3.0.4. DEMAND/MARKET SIZE (15) 0 15.1 European market size Non-existent Emerging market Small sized market Medium sized market 15.2 Extra-European market size Non-existent Emerging market Small sized market Medium sized market 15.3 Market growth rate Disappearing / Undefined 1 Decreasing 2 3 Up & down / Stable Non-existent but promising market 4 Weight Source Big sized market High proximity big size market 40% ME/TW Big sized market High proximity big size market 30% ME/TW High growth rate 30% ME/TW Slow / sustained growth 5 71 IPTS-TIM © Software – User’s Manual and Tutorial Indicator 16: Profitability Profitability measurement coming from the technology to be sold refers to the return obtained compared with the costs relative to the different development stages. Fac- 3.0.5. tor PROFITABILITY (16) 16.1 Expected economic return according to RTD investment 0 No economic return 1 Return under marginal investment 2 Return covering marginal investment 3 Return covering total RTD investment 4 Positive benefits in the operation 5 Weight Source Highly profitable 100% operation ME 72 IPTS-TIM © Software – User’s Manual and Tutorial Indicator 17: Employment In the European policies, the creation of jobs is one of the main objectives. Introduction of new technologies has not always positive effects on employment, therefore the evaluation of the foreseen impact on employment is of special interest. 1. On one side is to be considered the impact on the direct or indirect employment derived from the production processes generated or the new business initiatives coming from the application of the technology. 2. Secondly, the qualification of the jobs, from low levels in manufacturing up to the continuation of the RDT activities in the industry, and in the best of the situations when new business are created (spin-offs) for the exploitation of the technology. Fac- 4.1.1. tor EMPLOYMENT (17) 0 No new employment 1 2 3 4 5 Weight Source Consolidation of Small number of Medium number Large number of Large number of 60% the concerned direct jobs (<10) of direct jobs (50 direct & indirect new jobs, jobs < <10) jobs (>50) including differentiated groups of workers 17.1 Employment generated 17.2 Laboratory Quality/specialisation of the Unqualified / Not Manufacturing applicable low qualified jobs personnel and employment technicians Professional Highly qualified employment (research, (design engineers, management) e.g.) Spin-offs ME/TW 40% ME 73 IPTS-TIM © Software – User’s Manual and Tutorial Indicator 18: Social usefulness In the same framework of European policies, the social usefulness is to be checked in relation to its contribution to the solution of quality of life, health (healthcare, consumer nutrition, quality of life for elderly and disabled, education and culture and other aspects) and safety problems. In this indicator two factors are included: 1. First, the social importance of the problems that could be solved with the application of the technology. 2. Second the consideration of the importance of the technology to support or contribute to a solution. Factor 4.1.2. SOCIAL USEFULNESS (18) 0 1 2 3 18.1 Importance of the social problems envisaged Not applicable Low relevance General improvement of quality of life 18.2 Contribution to the solution Not applicable Low relevance Support to partial Partial solution solutions of the problem Incidence in the solution of a particular problem 4 Very important health & safety problem 5 Weight Several important 40% health & safety problems Significant partial Full solution solution Source TW 60% TW 74 IPTS-TIM © Software – User’s Manual and Tutorial Indicator 19: Environmental solutions Similarly to the former indicator, contributing to the solution of the environmental problems (reduced pollution, noise or radiation, preservation of natural heritage and resource management, production and rational use of energy and other aspects) in the frame of European policies has a wide incidence to be considered in the evaluation: Because of the importance of the considered environmental problems. Due to the potential contribution of the technology to support or provide solutions to defined problems. Fac- 4.1.3. ENVIRONMENTAL tor SOLUTIONS (19) 0 1 2 3 19.1 Importance of the problems Not applicable envisaged Low relevance General improvement of environment Incidence in the solution of a particular problem 19.2 Contribution to the solution Not applicable Low relevance Support to partial Partial solution solutions of the problem 4 Very important environmental problem 5 Weight Source High 40% environmental impact problems TW Significant partial Full scale solution 60% solution TW 75 IPTS-TIM © Software – User’s Manual and Tutorial Indicator 20: Regulatory evolution A great number of technologies are oriented towards fields where the role of the public regulations favours their incorporation to industrial process and products. Therefore the analysis and evaluation of the public regulation processes in the fields where the technology can apply, from the very moment when a social consciousness of the problem appears until the moment when a legal act is promulgated, is relevant for an adequate evaluation. Fac- 4.2 tor REGULATORY EVOLUTION (20) 20.1 Action trends in (new) regulation in application fields of the technology 0 Not applicable 1 Social concern 2 Political involvement 3 Regulatory technical committees at work 4 Drafts of regulatory measures 5 Operating regulations Weight Source 100% TD/TW 76 IPTS-TIM © Software – User’s Manual and Tutorial APPENDIX 2 to the IPTS-TIM © User’s Manual Full Market Enquiry Questionnaire THE AIMS OF THE PRESENT QUESTIONNAIRE ARE: to get a valuable opinion/evaluation of the marketability potential of a new technology (appropriate information is provided with the questionnaire) form a real player, - industrialist, distributor and dealer- , in the market to inform the industrialist on a possible transfer of the proposed new technology and receive its manifestation of interest to obtain any other possible useful information on the proposed new technology about alternative application/markets, possible improvements, other companies which might be interested, etc. A. General Information of the respondent’s Organization 1. Name of the Company 2. The questionnaire respondent’s company belongs to the following main shareholder(s) (if applicable) 3. Main SECTOR(S) (NACE classification, 3 digits) of Activity (maximum 3 entries; JUST THE NACE CODES) 4. Name(s) of the respondent(s) 5. Job Title/Position 6. Contact Information (address, tel, fax, e-mail, web page) B. Information about the respondent’s Company 1. Annual Turnover □ < 10 Million EURO □ 10 to 50 Million EURO □ 50 to 500 Million EURO □ > 500 Million EURO 2. Number of employees 77 IPTS-TIM □ □ □ □ © Software – User’s Manual and Tutorial < 10 10 to 50 50 to 500 > 500 3. Research and Technological Development (RTD) 3.1. Main Field(s) of RTD activity (maximum 3, by priority order) 3.2. Type of RTD activity □ Mainly basic research □ Targeted research □ Both basic & targeted research and technological development □ Mainly, market oriented technological development of research ` results 3.3. RTD staff (number of scientific and technical employees) □ < 10 □ 10 to 50 □ 50 to 500 □ > 500 3.4. Annual RTD budget □ < 200 thousand EURO □ 200 thousand to 1 million EURO □ from 1 to 10 million EURO □ > 10 million EURO. 3.5. Positioning of your strategic market □ Regional □ National □ European □ World-wide 4. Technological co-operation with other organisations 4.1. Joint patent ownership □ yes □ no 4.2. Experience participating in technology intensive mergers, joint ventures, transfer of technologies to third companies □ yes □ no 4.3. Participation in European RTD programme/ projects 78 IPTS-TIM © Software – User’s Manual and Tutorial □ yes Please, provide the title the most significant projects and name of the European RTD programmes: …….. □ no 4.4. Organisation past experience in any type of RTD co-operation □ yes Please provide the name of the organisations with which you co-operate more frequently ……………….. □ no 4.5. Any previous co-operation or contact with the organisation which developed the proposed new technology □ no □ yes, please specify in which issue ……………. C. Assessment of the proposed technology 5. Technological SWOT of the proposed technology 5.1. Advantages □ no □ yes, please specify in which issue……………. □ unknown 5.2. Disadvantages □ no □ yes, please specify in which issue……………. □ unknown 5.3. Opportunities □ no □ yes, please specify in which issue……………. □ unknown 5.4. Threats □ no □ yes, please specify in which issue…………… □ unknown 6. Technical specifications needed in order to be commercialised (minimum requirements) □ no; the present specifications already fit market requirements □ yes, modifications needed to fit the market requirements please specify in which …………… □ unknown 79 IPTS-TIM © Software – User’s Manual and Tutorial 7. Degree of maturity of the proposed technology □ no major development effort is envisaged □ important development tasks should still be undertaken please, specify :…………….. 8. Market interest 8.1. Novelty: Is the technology proposed really new (problem solving/fit demand deeds) □ yes □ no 8.2. Field of application □ Same as already figured out by the new technology developer/traditional field □ There are /could be NEW fields envisaged of application; please, specify : …………. 8.3. Expected/present market size of application WORLDWIDE □ < 200 thousand EURO □ 200 thousand to 1 million EURO □ from 1 to 10 million EURO □ > 10 million EURO. 8.4. Expected/present market size of application EUROPE □ < 200 thousand EURO □ 200 thousand to 1 million EURO □ from 1 to 10 million EURO □ > 10 million EURO. 8.5. Commercial threshold price (average price of competing technologies in the market) □ …………..(in EUROs) □ unknown 8.6. Known competitors for the industrial segment of the technology □ no competition □ low competition □ medium competition □ high competition 9. Pre-commercial issues 80 IPTS-TIM © Software – User’s Manual and Tutorial 9.1. Potential investments required to adapt technology to industrial production □ No investment are needed to adapt technology to industrial production □ Yes, investment are needed to adapt technology to industrial production: □ < 100 thousand EURO □ > 100 thousand to 500 thousand EURO □ from 500 to 1 million EURO □ > 1 million EURO □ Unknown 9.2. Foreseen potential time to market for the technology □ < 6 months □ > 6 months to 1 year □ >1 year to 2 years □ > 2 years 9.3. Provide a judgement for the degree of uncertainty assumed under the commercialisation phase of the technology □ none □ low □ medium □ high 10. Manifestation of Interest of your organisation in the proposed technology □ None □ Weak □ Medium □ Strong 10.1. Provide your interest for a particular form of transfer scheme for the current technology □ License □ Transfer of the technology □ Development in cooperation □ Training □ Service 10.2. Interest in receiving more detailed information on the technology □ 10.3. Yes □ No Interested in scheduling an appointment with the developers 81 IPTS-TIM © Software – User’s Manual and Tutorial □ Yes □ No 11. Suggestion for other contacts (e.g. other potentially interested companies) □ No □ Yes. Please provide the organisation’s name and the contact information: ………………………………………………………….. 82 IPTS-TIM © Software – User’s Manual and Tutorial Institute for Prospective Technological Studies European Commission - Joint Research Centre The Institute for Prospective Technological Studies (IPTS) is one of the eight institutes making up the Joint Research Centre (JRC) of the European Commission. It was established in Seville, Spain in September 1994. IPTS provides techno-economic analysis support to the European decision-makers. It monitors and analyses science & technology related developments, their cross-sectorial impact, interrelationships and future policy implications. IPTS presents this information in a timely and synthesised fashion through its Reports, Executive Briefing Notes, ‘The IPTS Report’ and the World Wide Web (http://www.jrc.es). In addition to its own resources, IPTS makes use of external Advisory Groups, such as the High Level Economists group, comprising a number of outstanding economists amongst which Nobel prize winner Robert Solow. It also operates a series of networks such as the European Science and Technology Observatory (ESTO), which draws on the resources of 35 institutions including all the major European think-tanks, the TechnoEconomic Analysis Network for the Mediterranean (TEAM), and a network to involve pre-accession countries in prospective issues, these last two networks being new initiatives. The activities undertaken by IPTS are characterised by a high degree of multidisciplinarity. IPTS portfolio is grouped under three main headings: Technologies for Sustainable Development; Life Sciences / Information and Communication Technologies; and, Technology, Employment, Competitiveness and Society. Address: European Commission Joint Research Centre Institute for Prospective Technological Studies W.T.C., Isla de la Cartuja s/n, 41092 Sevilla (Spain) www.jrc.es For general information about JRC-IPTS, please contact Ms. M. González responsible for Communication. 83