1
Using
Integrated Company
Analysis
Version 2.0
Zacks Investment Research, Inc. 2000
Manual Last Updated: 8/11/00
Contents
Overview
3
Introduction ..............................................................................................................3
Guided Tour
4
Getting Started in ICA...............................................................................................4
Parts of ICA Screen .....................................................................................4
Single Ticker Look-Up ..............................................................................................5
Working with Ticker Lists in ICA................................................................................5
ICA Ticker Types..........................................................................................5
Working with Companies Ticker Lists ...........................................................5
ICA Folders ..............................................................................................................8
Printing ICA Reports ....................................................................................8
Exporting ICA Reports..................................................................................8
Price Action Quick Start Guide..................................................................................9
Estimates Quick Start Guide .....................................................................................9
Snapshot Quick Start Guide......................................................................................9
Company vs. Industry Analysis Quick Start Guide.....................................................9
Peer Analysis Quick Start Guide ...............................................................................9
Internet-Based Reports Quick Start Guide .............................................................. 10
Clearing Temporary Internet Files........................................................................... 10
Price Action
11
Overview ................................................................................................................ 11
Basic Charting ........................................................................................................ 11
Using Chart Definitions............................................................................... 11
Understanding Price Chart Type................................................................. 12
Price Chart Frequency ............................................................................... 13
Display Data .............................................................................................. 14
Price Charts for Multiple Companies........................................................... 15
Advanced Charting ................................................................................................. 18
Editing Chart Definitions............................................................................. 18
Understanding Overlay Options.................................................................. 21
Creating New Chart Definitions .................................................................. 22
Creating New Chart Definitions for Aggregates........................................... 24
Estimates
25
Overview ................................................................................................................ 25
Estimate Reports Categories .................................................................................. 25
Current Estimates and Ratings Report ....................................................... 26
Current Estimates and Ratings Report Components................................... 26
Rating Performance Report........................................................................ 30
Rating Performance Report Components ................................................... 31
Analyst Rating History Plot ......................................................................... 33
Annual EPS Accuracy Report..................................................................... 35
Annual EPS Accuracy Report Components ................................................ 35
Quarterly EPS Accuracy Report ................................................................. 37
Snapshot
Doc-To-Help Standard Template
41
1
Overview ................................................................................................................41
Snapshot Report Components ................................................................................42
Company vs. Industry Analysis
45
Overview ................................................................................................................45
Company vs. Industry Analysis Report Components ...............................................45
Company vs. Industry Analysis Ratio Sets..................................................46
Ratio Set Editor ..........................................................................................46
Peer Analysis
48
Overview ................................................................................................................48
Zacks Peer Group ......................................................................................48
Custom Peer Group....................................................................................48
Peer Analysis Components .....................................................................................49
Peer Analysis Ratio Categories ..................................................................49
Peer Analysis Information Table .................................................................50
Peer Analysis Ratio Sets ............................................................................50
Historical Peer Analysis Charts...................................................................51
Working With Ratio Set Editor ....................................................................52
Internet-Based Reports
54
Using Internet-Based Reports .................................................................................54
Fundamental Reports .............................................................................................54
Income Statement, Balance Sheet, and Cash Flow tables ..........................54
Return on Equity Reports ...........................................................................54
Risk Rating/Bankruptcy Reports .................................................................55
Business Description & Management Discussion Reports .......................................55
Business Descriptions Reports ...................................................................55
Management's Discussion and Analysis Reports ........................................55
Insider Trading Report ............................................................................................55
Brokerage Research Reports and Their Abstracts...................................................55
Appendix
56
Company Overlays .................................................................................................56
Fundamental Overlays ...............................................................................56
Index Overlays ...........................................................................................57
Zacks Chart Definitions ...........................................................................................61
Zacks Sector and Industry Designations..................................................................63
Zacks X (Expanded) Sector Groups............................................................63
Zacks M (Medium) Industry Groups ............................................................63
Zacks X (Expanded) Industry Groups .........................................................64
Estimates Report Methodology ...............................................................................65
2 Technical Support
67
Glossary of Terms
69
Index
71
Doc-To-Help Standard Template
Overview
Introduction
Integrated Company Analysis (ICA) is a powerful tool for examining stocks
using customized charts, graphs, and reports. This product is comprised of
the following components.
Price Action: analyzes the price impact of fundamentals. Price Action
reports overlay price charts with the EPS Surprises, Consensus Estimates,
Annual, Quarterly or 12-month EPS, Zacks Indicator, ROE, ROA, Broker
Recommendations, Sales, or Net Income data. You can also analyze
company performance versus another company, Industry, Sector, S&P 500
or other major market indexes.
Estimates: displays the flow of estimate revisions and recommendations
from over 300 brokerage firms and individual analyst’s track record. The
Estimates reports display the latest information on individual broker
recommendations, annual and quarterly EPS estimates and revisions,
analyst Consensus, and Zacks Ratings for over 6,500 companies. Estimates
provide Analyst Track Record and Analyst Ratings History data.
Snapshot: view a single company report. Includes price, EPS surprises and
estimate revisions charts along with the company’s description and
fundamental data.
Company vs. Industry Analysis: use charts to see how a company is
performing versus the industry median, sector median, S&P 500 or a specific
number based on a wide range of fundamentals.
Peer Analysis: compare a company’s fundamental data to companies in the
same industry or your custom peer group. Peer Analysis reports include
graphs and data tables for various financial ratios.
Internet-Based Reports: analyze various fundamental data tables, Business
Description & Management Discussion Reports, Insider Trading data,
Brokerage Research reports and their abstracts.
Doc-To-Help Standard Template
Overview 3
Guided Tour
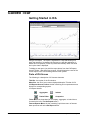
Getting Started in ICA
Using ICA is simple. The layout is organized in a way that allows you to
begin the analysis of a company the moment you start the application. A
default list of companies (Ticker List) loads automatically when ICA starts
and a price chart is displayed.
To display a new report, just click the report button from the ICA Reports
Access Toolbar. After specifying a report, ICA will display the name of the
current report in the Title bar along with the ticker symbol.
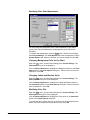
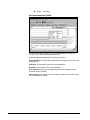
Parts of ICA Screen
The following is a description of ICA screen elements.
Title Bar: the top bar of the ICA window.
Menu Bar: the list of menu names displayed below the Title bar of ICA.
ICA Reports Access Toolbar: the bar containing ICA components access
buttons for corresponding reports.
ICA Report buttons
Aggregates
Indexes
Ratios Editor
Companies
Ticker Menu: the drop-down list of company, aggregate, or index tickers
(located to the left of the Get Report button).
Internet Reports Menu: the bar containing a pull-down menu of Internetbase reports as well as the Get Report button.
4 Guided Tour
Doc-To-Help Standard Template
Single Ticker Look-Up
To access any of the ICA reports for a company, type the company’s ticker
symbol in the Tickers drop-down menu (located to the left of the Get Report
button) then click Enter.
Working with Ticker Lists in ICA
ICA Ticker Types
There are three types of tickers used in ICA.
Company Tickers: ticker symbols for stocks in Zacks companies universe.
ICA has a sample list that loads automatically when the application starts.
Aggregate Tickers: ticker symbols for aggregate classes such as S&P 500,
Zacks Industry or Zacks Sector in Zacks aggregates universe.
Index Tickers: ticker symbols for various indexes in the Zacks market index
universe.
Company tickers can be used in all ICA reports, whereas Aggregate and
Index tickers are used in Price Action reports only.
Working with Companies Ticker Lists
To display an ICA report, select a ticker or set of tickers (Ticker List). The
Ticker List is automatically sorted by ticker symbol. When the Ticker List is
selected, a price chart displays the first ticker on the list.
ICA has a sample Ticker List (myportf.txt) automatically loaded when first
starting the application.
Ticker list files are in a tab-delimited format (*.txt). Use the Ticker List
created with any Zacks screening application.
Doc-To-Help Standard Template
Guided Tour 5
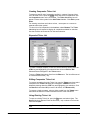
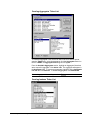
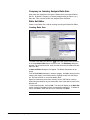
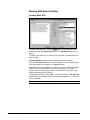
Creating Companies Ticker List
To anayze a specific set of companies (portfolio), create a Company ticker
list to be used in ICA. Open the Ticker menu then select Companies or click
the Companies button on the ICA toolbar. The Ticker List dialog box will
appear. Enter a ticker symbol in the Add Ticker List box. Click Add or press
Enter.
For entering more than one ticker at a time, use a space or a comma to
separate each ticker symbol.
To view a list of all companies in the database, select Browse. The Ticker
List dialog box will expand to display all companies available for selection.
Use the scroll bar to browse the Full Universe selection.
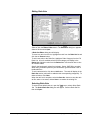
Expanded Ticker List
To create a multiple company Ticker List, select tickers by holding down the
CTRL key and highlighting your selection.Next click << Add then OK.
Selected tickers will appear in the Tickers menu.
To save a Ticker List, select Save from the File menu. The list will be saved
in a tab delimited format (*.txt).
Editing Companies Ticker List
To remove companies from the Ticker List, open the Ticker menu then select
Companies.The Ticker List dialog box will appear. Select tickers to be
deleted by holding down the CTRL key and highlighting your selection. Click
the Remove button then OK (to remove all tickers, click Remove All).
To remove a single company, select a ticker symbol from the Tickers menu
then select the Remove Ticker command from the Ticker menu.
Using Existing Ticker List
To open an existing Ticker List, open the File menu and select Open. The
Open dialog box appears. Enter the file name (*.txt) or select a file from the
list and click Open.
ICA contains a sample Companies Ticker List (myportf.txt) that also can be
used.
6 Guided Tour
Doc-To-Help Standard Template
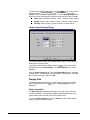
Creating Aggregates Ticker List
To create an Aggregate Ticker List to be used in the Price Action reports,
open the Ticker menu, select Aggregates or click the Aggregates button on
the ICA toolbar. The Aggregate List dialog box will appear.
From the Available Aggregates section, highlight an Aggregate Class then
select a specific Aggregate. Click Add to List. The aggregate will appear in
the Aggregate List. To remove an aggregate, highlight it in the Aggregates
List and then click Remove. To delete all aggregates, click Remove All.
Selected aggregate tickers will appear in the Tickers menu.
Creating Indexes Ticker List
Doc-To-Help Standard Template
Guided Tour 7
To create an Indexes Ticker List to be used in the Price Action open the
Ticker menu then select Indexes, or click the Indexes button on the ICA
toolbar. The Index List dialog box will be displayed. Select multiple Indexes
by holding down SHIFT and highlighting your selection. To select one Index
at a time, hold down the CTRL key and click the Index name. Click OK.
ICA Folders
To view ICA settings, choose the Folders command from the Tools menu.
The Default Folders dialog box will appear, displaying the location of Zacks
databases when applicable (Ticker Lists, Ratios Sets, and export directory;
Output ).
Printing ICA Reports
To print the report, select Print from the File menu or click the Print button.
Exporting ICA Reports
Export ICA reports data to Excel or copy the report to the Windows clipboard.
Snapshot reports can only be copied to the clipboard.
Exporting to Excel
To export data after displaying a report, open the Tools menu then select
Export. Select Export Data to Excel (the Save As dialog box will appear).
Enter the export file name (*.csv) then click OK.
The file is saved in the comma-delimited format (*.csv). The location of the
export folder is determined by your output folder settings.
ICA will automatically launch the Excel application and the exported file will
be opened in Excel.
Copying Data to Clipboard
ICA charts and graphs can be copied to a clipboard and used in
presentations and marketing materials. To create a chart open the Tools
menu then select Export and click Copy to Clipboard (the active chart
window will be copied to the Windows clipboard). Open a WORD document
or any presentation file. Paste the ICA report into the document using the
program's editing features.
8 Guided Tour
Doc-To-Help Standard Template
Price Action Quick Start Guide
Price Action operates with Chart Definitions. Chart Definitions are predefined settings that combine price charts with various overlays. Use Zacks
Chart Definitions or create your own.
Access Zacks Chart Definitions by opening the Chart menu then select Chart
Settings or click the Price Action button on the ICA Components toolbar.
Select a chart definition. View the description of the Chart Definition by
selecting the Description tab in Chart Options dialog box.
When opening ICA, a default list of companies will be automatically loaded,
and a chart for the first ticker on the list will be displayed.
Estimates Quick Start Guide
To display an Estimates report select a ticker from the ticker drop menu
(located to the left of Get Report button) or click the Estimates button on the
ICA Components toolbar. An Estimates report for the selected company will
be displayed.
Snapshot Quick Start Guide
To display a Snapshot report select a ticker from the ticker drop menu
(located to the left of Get Report button) or click the Snapshot button on the
ICA Components toolbar. A Snapshot report for the selected company will be
displayed.
Company vs. Industry Analysis Quick
Start Guide
To display a Company vs. Industry Analysis report select a ticker from the
ticker drop menu (located to the left of Get Report button) or click the
Company vs. Industry Analysis button on the ICA Components toolbar. A
Company vs. Industry Analysis report will be displayed.
Zoom Options
To enlarge each ratio’s display area, choose the Zoom In option from the
Company vs. Industry Analysis Zoom menu to turn on the magnifier.
Move the magnifier over each ratio display to enlarge the area.
Turn the magnifier off by selecting the Zoom Out option.
Peer Analysis Quick Start Guide
To display a Peer Analysis report, select a ticker from the ticker drop menu
(located to the left of Get Report button) or click the Peer Analysis button
on the ICA Components toolbar. A Peer Analysis report will be displayed.
The ratios in the chart are based on the latest information about the selected
companies. To view a historical performance of the specific company, select
the Show History button from the chart display.
Doc-To-Help Standard Template
Guided Tour 9
Internet-Based Reports Quick Start
Guide
To display a report, open the Tickers menu, click Companies then select a
ticker. Select a report type from the Get Report drop menu (located to the
right of the Get Report button) then click the Get Report button.
ICA will launch your default browser in a new window to display the report.
To switch between your browser and ICA, click the ICA button on the
Windows taskbar.
Clearing Temporary Internet Files
ICA has a special temporary Internet files folder, on your hard disk, where
ICA pages are stored as you view them. This speeds up the viewing of
charts for the companies that are in your active Ticker List.
To delete these temporary files, select the Clear Cache command from the
Tools menu.
10 Guided Tour
Doc-To-Help Standard Template
Price Action
Overview
The ICA Price Action feature helps analyze how strongly a stock's price
reacts to EPS surprises, estimate revisions and broker recommendations.
Price Action compares two or more company prices and fundamental
performance data. It also helps analyze company performance versus
industry sector, S&P 500 and any major market index. Price Action plots
price charts against a wide range of fundamentals (overlays). Overlays
display how sensitive a stock or an aggregate is to any given factor.
Basic Charting
Using Chart Definitions
Price Action performs with Chart Definitions, settings that combine price
charts with various overlays. Use Zacks Chart Definitions or create your own.
To access Chart Definitions, Click the Price Action button on the ICA
Reports Access toolbar. Open the Chart menu, select Chart Settings. The list
of Current Settings will be displayed. Select a Chart Definition name to
display chart.
Doc-To-Help Standard Template
Price Action 11
Understanding Price Chart Type
When displaying a chart, select to display either absolute or relative price
data for the selected tickers.
To access the Chart Type options, open the Chart menu, choose Chart
Settings then click Current Settings. The Chart Options menu will appear.
Click the Chart Type tab. Select a chart type then click OK.
When choosing the Relative to Aggregate option, select the aggregate from
the Class list of available aggregates.
When choosing the Relative to Another Company option, enter the ticker
symbol in the Company Ticker box.
When choosing the Relative to Index option, select an Index from the Index
list.
Absolute Price Charts
Absolute Price charts plot company or aggregate prices for the specified time
period.
Relative to Aggregate Price Charts
Relative to Aggregate Price charts, display the relative performance of a
selected company or aggregate as measured against a specific Industry,
Sector, or the S&P 500.
For example, when charting a company price versus the S&P 500 index, the
stock price is divided by the S&P 500. The performance of the stock is
compared to the general market. A resulting upward sloping Relative
Performance chart indicates a company is outperforming the market,
whereas the downward sloping indicates a company is under-performing the
market.
Users may choose to display either Median or Market Weighted values for
the aggregates.
12 Price Action
Doc-To-Help Standard Template
Relative to Another Company Price Charts
Relative to Another Company Price charts, display the relative performance
of a selected company or aggregate as measured against another company.
Relative to Index Price Charts
Relative to Index Price chart, display the relative performance of a selected
company or aggregate as measured against any market Index.
Changing Chart Type
To change the chart type, open the Chart menu, choose Chart Settings then
click Current Settings. The Chart Options menu will be displayed. Click the
Chart Type tab. Select a chart type then click OK..
Price Chart Frequency
Price Chart Frequencey option display charts using share volume data with
monthly, weekly or daily frequency distinctions.
Monthly Frequency: displays month-end prices and volume. Volume is
the total number of shares traded during a month (expressed in
thousands). Monthly prices are available for the past 12 years.
Weekly Frequency: displays week-end prices and volume. Volume is
the total number of shares traded during a week (expressed in
thousands). Weekly prices are available for the past 12 years.
Daily Frequency: displays daily prices and volume. Volume is in actual
shares (expressed in thousands). Daily prices are available for the past
1.5 years.
Changing Price Chart Frequency
To change the price chart’s frequency, select Chart Frequency from the
Chart menu then select a frequency option (daily, weekly, or monthly).
Display Range
The Display Range (time period) option is used to specify price chart
frequency (daily, weekly, or monthly).
Doc-To-Help Standard Template
Price Action 13
To access the Display Range options, open the Chart menu, choose Chart
Settings and click Current Settings. The Chart Options menu will be
displayed. Click the Chart Frequency tab. From the Display Range menu
specify one of the following time periods for each frequency then click OK.
Daily: select 3 months, 6 months, 1 year, 2 years or custom options.
Weekly: select 1 year, 2 years, 3 years, 5 years or custom options.
Monthly: select 3 years, 5 years, 10 years or custom options.
Using Custom Display Range
The Custom Display Range option allows users to zoom in to the specific
date range for the price chart.
To specify a custom Display Range, open the Chart menu, select Chart
Settings then click Current Settings . The Chart Options menu will be
displayed.
Click the Chart Frequency tab. From the Display Range menu, select the
Custom option. The dates menu will be enabled. Enter a date in the From
box or use the scroll bar. Then click OK.
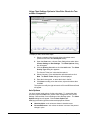
Display Data
To examine particular data points in a data series of Price Action charts,
select Display Data from the Chart menu. A Data Legend box will be
displayed.
Data Legend Box
The Data Legend box displays ticker date, price, and volume data with
overlay information. The legend box displays data corresponding to your
cursor position when scrolled over the Price Action chart.
To view the Data Legend box, open the Chart menu then select Display
Data (to remove, select Hide Data).
14 Price Action
Doc-To-Help Standard Template
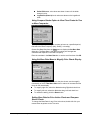
Two Panels View
To view two charts simultaneously, open the View menu then select Two
Panels. Two charts for the active ticker will be displayed. Click inside either
chart and select a new ticker from the Tickers pull-down menu.
Price Charts for Multiple Companies
You can view prices for two or more companies on the same chart. You may
choose to compare stock prices or their percent difference. If you choose to
compare the percent difference, the right-axis displays the relative
percentage change in the stock price.
There are two ways to view two or more companies price charts. To compare
the relative performance of two or more stocks, use the Compare Stocks
menu (or select Chart Settings from the Chart menu).
Doc-To-Help Standard Template
Price Action 15
Using Chart Settings Option to View Price Charts for Two
or More Companies
To display a chart, follow these steps:
1. Select a company ticker from the tickers drop-down menu
(located to the left of the Get Report button).
2. Open the Chart menu, choose Chart Settings then select either
Current Settings or New Settings . The Chart Options dialog
box will appear.
3. Click the Overlay List tab then click the Add button. The Select
Overlay Type dialog box appears.
The Current Ticker box is checked, de-select it.
4. Select Company, Price and Absolute radio buttons then click
Next. The Select Ticker dialog box will be displayed.
5. Enter the ticker symbol or select the ticker in the list.
6. Click Next to modify price chart colors, style and markers then
click OK.
The option to modify the right axis scale to Percent Difference Scale
will appear.
Axis Options
You have several scale options for the price charts. To access the chart
axis menu open the Chart menu, select Chart Settings then click Current
Settings. Choose either Current Settings or New Settings option. The Chart
Options dialog box will appear. Click the Axis Options tab.
Modifying left and/or right axis scales are displayed as follows:
16 Price Action
Absolute Value: axis values are shown in absolute terms.
Percent Difference: axis values are shown in terms of the percent
change in price.
Doc-To-Help Standard Template
Dollar Difference: axis values are shown in terms of the dollar
change in price.
Logarithmic (Base 10): axis values are shown on the logarithmic
scale.
Using Compare Stocks Option to View Price Charts for Two
or More Companies
To compare the percent change in company prices over a specified period,
first select the Chart Frequency (daily, weekly, or monthly).
Choose Set Base Date from the Chart menu to display the Set Base Date
dialog box. The Base Date is the date from which price changes are
calculated and depends on the Chart Frequency.
Enter the new date in the Base Date box or use the scroll bar then click OK.
Using Set Base Date Menu to Magnify Price Charts Display
In addition to changing the time axis for the price charts, use the magnify
functionality of the ICA Set Base Date menu to reduce or increase the time
frame for the chart display.
To magnify right axis, select the Maximize along Right Axis check box.
To magnify left axis, select the Maximize along Left Axis check box.
To restore the setting, click the Reset button.
Setting Base Date for Price Action Charts and Compare
Stocks Charts
To change the Base Date for any Price Action chart, double left click your
mouse button anywhere on the Time axis.
Doc-To-Help Standard Template
Price Action 17
To change the Base Date for the Compare Stocks charts, double left click
your mouse button anywhere on the Time axis or on the stock comparison
chart.
Advanced Charting
Price Action works with Chart Definitions. These settings combine price
charts with various overlays. You can modify Zacks Chart Definitions or
create your own.
Some Chart Definitions created for company tickers will not operate for
Aggregate or Index tickers and vise versa. In that case, “Error 1003 - Data
for ticker could not be read” message will display.
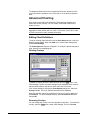
Editing Chart Definitions
To edit an existing Chart Definition click the Price Action button on the ICA
Reports Access toolbar. Open the Chart menu, select Chart Settings then
click Current Settings.
The Chart Options dialog box will appear. To modify the specific aspects of
chart, select the corresponding tab.
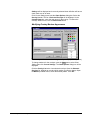
Deleting Overlays
To delete an overlay from the Chart Definition open the Chart menu, click
Chart Settings. The list of Current Settings will be displayed and a currently
selected chart definition will have a check mark next to its name.
Click Current Setting to activate the Chart Options dialog box. Select the
Overlay List tab. The list of Selected Overlays will be displayed.
Open the selected overlay list, highlight an overlay you wish to delete and
click Remove. To delete multiple overlays, press the Remove All button.
Choose OK.
Renaming Overlays
You can change the overlay name as it appears on the chart. To rename the
overlay, open the Chart menu, select Chart Settings. The list of Current
18 Price Action
Doc-To-Help Standard Template
Settings will be displayed and a currently selected chart definition will have a
check mark next to its name.
Click Current Setting to activate the Chart Options dialog box. Select the
Overlay List tab. The list of Selected Overlays will be displayed. In the
Custom Name box, enter the new name for the overlay. To restore the
overlays' default name, click the Reset Name button.
Modifying Overlay Markers Appearance
Each overlay on the chart can be distinguished by a unique pattern (marker).
To change markers for the overlays, open the Chart menu, select Chart
Setting, then click Current Settings. The Chart Options dialog box will be
displayed.
Click the Overlay List tab to view selected overlays. Open the Selected
Overlays list, highlight an overlay which marker you want to change. Open
the Marker pull-down menu, select the desired pattern. Click OK.
Doc-To-Help Standard Template
Price Action 19
Modifying Price Chart Appearance
You can change the appearance of the various elements of your charts
(colors, lines, and text attributes for the background, price, and volume
elements).
To change chart appearance, open the Chart menu, choose Chart Settings,
then Current Settings. The Chart Options menu will be displayed. Click the
General Options tab. Select the element you want to change and click OK.
Changing Background Color for the Chart
Open the Chart menu, choose Chart Settings, then Current Settings. The
Chart Options menu will be displayed.
Click the General Options tab. Highlight the Background option in the Chart
Items section of the Chart Options dialog box. Select a new color from the
palette box. Click OK.
Changing Labels and Borders Color
Open the Chart menu, choose Chart Settings, then Current Settings. The
Chart Options dialog box will be displayed.
Click the General Options tab. Highlight the Labels and Borders option in
the Chart Items section of the Chart Options dialog box. Select a new color
from the palette box. Click OK.
Modifying Price Plot
Open the Chart menu, choose Chart Settings, then Current Settings. The
Chart Options dialog box will be displayed.
Click the General Options tab. Highlight the Price option in the Chart Item
section of the Chart Options dialog box.
To modify the style, weight, and color of the price plot line and specify axes
labels, select new styles from the pull-down menus. Click OK.
20 Price Action
Doc-To-Help Standard Template
Modifying Volume Plot
You can change the appearance of the Volume plot lines as well as the
amount of space Volume lines occupy on the chart.
Volume lines
Open the Chart menu, choose Chart Settings, then Current Settings. The
Chart Options dialog box will be displayed.
Click the General Options tab. Highlight the Volume option in the Chart
Item section of the Chart Options dialog box.
To change the style, weight, and color of the Volume plot line, and specify
axes select new styles from pull-down menus. Click OK.
Editing Volume lines spacing
Volume charts occupy the lower part of the Price Action screen.
To change the amount of space Volume lines occupy on a chart, open the
Chart menu, choose Chart Settings, then Current Settings. The Chart
Options dialog box will be displayed.
Click the General Options tab. In the Volume occupies (% window) section,
use the adjustment bar to specify the screen space taken by the volume
chart. Click OK.
Adding or Deleting Chart Gridlines
Open the Chart menu, choose Chart Settings, then Current Settings. The
Chart Options dialog box will be displayed.
Click the General Options tab. In the Gridlines box, select appropriate
check boxes. Click OK.
Understanding Overlay Options
The list of available overlays depends on whether the active ticker is a
Company, an Aggregate, or an Index. You may display an almost unlimited
variety of overlay combinations.
a. Possible overlay function(s) when an active ticker is a Company:
Display Fundamental Absolute ratios overlays for the active ticker
Display Fundamental Relative ratios overlays for the active ticker
Add new Company ticker, Company Price Absolute
Add new Company ticker, Company Price Relative
Add new Company ticker, Company Fundamental Absolute
Add new Company ticker, Company Fundamental Relative
Add new Aggregate ticker, Price Absolute
Add new Aggregate ticker, Price Relative
Add new Aggregate ticker, Fundamental Absolute
Add new Aggregate ticker, Fundamental Relative
Add New Index ticker Price Absolute
Doc-To-Help Standard Template
Price Action 21
b. Possible overlay function(s) when the active ticker is an Aggregate:
Display Fundamental Absolute ratios overlays
Display Fundamental Relative ratios overlays
Add new Aggregate Ticker
Add new Aggregate Price Absolute
Add new Aggregate Price Relative
Add new Aggregate Fundamental Absolute
Add new Aggregate Fundamental Relative
Add new Company Ticker, Company Price Absolute
Add new Company Ticker, Company Price Relative
Add new Company Ticker, Company Fundamental Absolute
Add new Company Ticker, Company Fundamental Relative
c. Possible overlay function(s) when the active ticker is an Index:
Add new Company Ticker, Company Price Absolute
Add new Company Ticker, Company Price Relative
Add new Company Ticker, Company Fundamental Absolute
Add new Company Ticker, Company Fundamental Relative
Add new Aggregate Ticker
Add new Aggregate Price Absolute
Add new Aggregate Price Relative
Add new Aggregate Fundamental Absolute
Add new Aggregate Fundamental
Creating New Chart Definitions
There are unlimited possibilities in creating new chart definitions.
With Company Overlays you can view the sensitivity of a stock to the various
fundamental ratios, compare a stock’s price and fundamentals against any
industry, sector, or S&P 500. When selecting overlays, you can view them
for the active ticker or any other company, aggregate, or market index.
Adding Fundamental Overlays
To view whether the stock price responds to the changes in the company's
fundamentals, you can add the fundamental overlay.
To add the Fundamental overlay for the active company ticker select a
company ticker from the Ticker pull-down menu (located to the left of the Get
Report button).
Open the Chart menu, choose Chart Settings, then New Settings. The
Chart Options dialog box will appear.
Click the Overlays List tab then click Add. The Select Overlay Type dialog
box will appear (leave the Current Ticker box marked).
Select Fundamental then Absolute options by clicking the radio buttons
then click Next. The Select Overlay(s) dialog box appears (click an overlay,
to view its description in the description box).
22 Price Action
Doc-To-Help Standard Template
Highlight an overlay then press Next. The Overlay List menu. reappears,
specify the appearance of the overlay lines: style, weight, color, marker, and
axes then click OK.
Adding Absolute Aggregate Price Overlays
To view how a company performed versus its respective sector, industry, or
S&P 500, use the Aggregate Prices overlays.
To add the Absolute Aggregate Price overlay for the active company ticker,
select a company ticker from the Ticker pull-down menu (located to the left
of the Get Report button).
Open the Chart menu, select Chart Settings, then New Settings. The Chart
Options dialog box will appear.
Click the Overlays List tab then click Add. The Select Overlay Type dialog
box will appear.
De-select the Current Ticker box.
Select Aggregate, Price and Absolute options by marking the radio buttons
then click Next. The Select Aggregate dialog box appears.
Open the Class menu, highlight the aggregate you want to add.
By default, ICA will pick the company-relevant Industry or Sector. The
Associated check box will be marked. If you do not want the related
Industry or Sector, de-select the Associated box. Some aggregates will also
allow you to select from displaying either the Median or Market Cap weighted
values.
After finishing the aggregate selection, click Next.
The Overlay List menu will appear, specify the appearance then click OK.
Adding Absolute Aggregate Fundamental Overlays
To view how a company performed versus its respective sector, industry, or
S&P 500, use the Absolute Aggregate Fundamental overlays.
To add the Absolute Aggregate Fundamental overlay for the active company
ticker, select a company ticker from the Tickers pull-down menu (located to
the left of the Get Report button).
Open the Chart menu, select Chart Settings, then New Settings. The Chart
Options dialog box will appear. Click the Overlays List tab then click Add.
The Select Overlay Type dialog box will appear. De-select the Current
Ticker box.
Select Aggregate, Fundamental and Absolute options by clicking the radio
buttons then click Next. The Select Aggregate dialog box will appear.
Open the Class menu, highlight the aggregate to add.
By default, ICA will pick the company-relevant Industry or Sector, the
Associated check box will be checked. De-select it if you do not want it then
click Next.
The Select Overlay(s) dialog box will appear, click an overlay to view its
description in the description box.
Doc-To-Help Standard Template
Price Action 23
Highlight an overlay from the Available Aggregate Overlays list (depending
on the overlay selected, you can display the Median, Market Cap Weighted,
or Total values) then click Next.
You will return to the Overlay List menu, where you can specify the
appearance then click OK.
Adding Index Price Overlay
To add an index price overlay, select a company ticker from the Tickers pulldown menu (located to the left of the Get Report button).
Open the Chart menu, select Chart Settings, then New Settings.
The Chart Options dialog box will appear. Select the Overlays List tab then
click Add.
The Select Overlay Type dialog box will appear (leave the Current Ticker
check box marked).
Select Fundamental and then Absolute options by clicking the radio buttons
then click Next.
The Select Overlay(s) dialog box appears (click an overlay, to view its
description in the description box).
Scroll down to view the first Index overlay description. Highlight an Index
overlay then click Next. The Overlay List menu reappears. Specify the
appearance of the overlay lines: style, weight, color, marker, and axes then
click OK.
Creating New Chart Definitions for Aggregates
You can chart prices and fundamental ratios for various Aggregated Classes:
S&P 500, Zacks X (Expanded) Industry, Zacks X (Expanded) Sector, Zacks
M (Medium) Industry.
Adding Absolute Fundamental Aggregate Overlays
To add the Fundamental Aggregate overlay for the active aggregate ticker,
select an aggregate ticker from the Tickers pull-down menu (located to the
left of the Get Report button).
Open the Chart menu, select Chart Settings, then New Setting.
The Chart Options dialog box will appear. Click the Overlays List tab then
click Add.
The Select Overlay Type dialog box will appear (leave the Current Ticker
check box marked).
Select Fundamental and then Absolute options by clicking the radio buttons
then click Next.
The Select Overlay(s) dialog box appears (highlight an overlay, to view its
description in the description box).
Highlight an overlay then click Next. The Overlay List menu reappears, you
may then specify the appearance of the overlay lines: style, weight, color,
specify a marker, or choose to display overlay data on the left axis.
24 Price Action
Doc-To-Help Standard Template
Estimates
Overview
Deriving more
value from
brokerage equity
research
Performance of
analysts not
brokers
Track record not
short term
performance
Quantitative tool
for measuring the
performance of sell
side analysts
The Estimates reports provide you with the most complete and accurate
overview of sell-side analyst earnings estimates and stock recommendations
available. The reports display the latest information on individual analysts
recommendations, annual and quarterly EPS estimates and revisions,
consensus, and Zacks Ratings for over 6,500 companies – showing you the
flow of estimate revisions and recommendations from over 300 brokerage
firms.
The estimates and recommendations in Estimates reflect the opinions of
individual analysts who may have been employed by more than one broker
during the period of evaluation. Thus, the ranking indicates the performance
of the analyst and not his/her current employer. The broker name noted for
each analyst is that of the firm he/she was employed by as of the date of the
last estimate recorded.
Zacks rates analysts over the long term — four years for estimates and over
five years for recommendations. Consequently, rankings are a measure of
the analyst's track record and are less likely to be affected by random, shortterm events.
Zacks introduces objective standards into the decision process by
quantitatively evaluating and ranking sell side analysts on two important
performance measures: the accuracy of their earnings per share (EPS)
forecasts and the utility of their stock ratings. Both these measures reflect
only demonstrated performance.
Zacks analyzes data for over 6,500 companies aggregated into over seventy
industry groups. This data covers multiple years and includes the EPS and
stock ratings of over 2,500 analysts. The data shown in Estimates is
associated with an individual analyst and stays with that analyst, regardless if
he/she is employed by more than one firm during the period under
evaluation.
Estimate reports evaluate the performance of people…not stocks. With
these reports you have the ability to evaluate the analysts' past
performances to better assess the credibility of their current EPS estimates
and recommendations.
Estimate Reports Categories
There are several Estimates and Recommendations Reports available:
Current Estimates and Ratings Report
Rating Performance Report
Annual EPS Accuracy Report
Quarterly EPS Accuracy Report
Rating Performance Report, Annual EPS Accuracy Report, and Quarterly
EPS Accuracy Report may not be included in your subscription.
Doc-To-Help Standard Template
Estimates 25
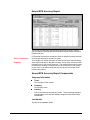
Current Estimates and Ratings Report
Current Estimates and Ratings reports contains: ticker symbol, company
name, industry, EPS report dates, analysts, brokers, current
recommendation and its date, current and next fiscal year estimates, current
and next fiscal quarter estimates, consensus data for ratings and estimates,
and Zacks rating.
Current Estimates and Ratings Report
Components
Company Information
Ticker
The company’s ticker symbol.
Company
The company name.
Industry
One of more than seventy industry groups. These groupings represent
an aggregation of the over 200 industry categories under which Zacks
records data.
Last Update
The date of the database update.
Zacks Rating
The Zacks Rating is based on our proprietary model that uses earnings
estimate revisions and earnings surprises to predict short-term price
movements. Stocks are rated as a Strong Buy, Buy, Hold, Sell, or a Strong
Sell. These ratings have shown to be an accurate predictor of stock price
performance (relative to market) for the coming 90-180 days as oppose to
26 Estimates
Doc-To-Help Standard Template
the analyst’s long-term predictions that usually represent a 6-12 month
outlook.
The Zacks Rank is also a relative measure, comparing stock against the
entire universe of stocks, and the distribution of ranks reflects this:
approximately 20% of stocks are ranked Buy or Strong Buy; 60% of stocks
are ranked Hold; and 20% ranked Sell or Strong Sell.
Analyst/Broker
Analyst
Under the Analyst heading is a list of the names of the individual analysts.
An analyst name listed as Not Ident means authorization is needed to view
the name.
Click the Analyst heading to sort the column.
Broker
Under the Broker heading is a list of the names of the brokerage houses and
independent research institutions that currently employ the analyst. A broker
name listed as Not Ident means authorization is needed to view the name.
When the Broker column has the CO FORECAST entry, it identifies the
company’s own estimates for the earnings.
You can click the Broker heading to sort the column.
Ratings Code and Date
Rating Codes
The analyst ratings are presented as follows:
SB - Strong Buy
B - Buy
H - Hold
S - Sell
SS - Strong Sell
NR - No Rating (or you may not be authorized to view certain analyst’s
recommendations).
An up/down arrow next to the rating code indicates a recent rating change by
an analyst. The direction of the arrow indicates a change from the previous
analyst's recommendation.
A red rating code indicates the most accurate analysts.
You can click the Code heading to sort the column.
Rating Dates
Rating dates show the date of the recommendation or a revision date. Simple
rating confirmations do not affect the original or revised rating dates.
A blue rating date indicates the most recently released analyst
recommendation.
You can click the Date heading to sort the column.
Annual Estimates
The Annual Estimates section lists the analyst’s EPS projections for the
current and next fiscal years.
Doc-To-Help Standard Template
Estimates 27
Current Fiscal Year Estimates
The leftmost column of the Annual Estimates section shows the latest
estimates for the company's current fiscal year. The column’s heading
shows the month and the year the current fiscal year will end in the
MM/YYYY format (for example, 12/2000).
An up or down arrow next to the estimate indicates a recent estimate
revision. The direction of the arrow indicates a change from the previous
analyst's estimate.
Estimates made by the Most Accurate Analysts are shown in red. You can
click the MM/YYYY heading to sort the column.
Date of Annual EPS Estimate
The Date column shows the date of the current fiscal year estimate.
A blue rating date indicates the most recently released analyst EPS
estimates. Click the Date heading to sort the column.
Next Fiscal Year Estimates
Analysts’ EPS estimates for the next fiscal year are listed in the Annual
Estimates section in the column headed by the month and year (MM/YYYY)
the company's next fiscal year will end.
An up or down arrow next to the estimate indicates a recent estimate
revision. The direction of the arrow indicates a change from the previous
analyst's estimate.
Estimates made by the Most Accurate Analysts are shown in red. You can
click the MM/YYYY heading to sort the column.
Date of Annual EPS Estimate
The Date column shows the date of the next fiscal year estimate. A blue
rating date indicates the most recently released analyst EPS estimates.
Click the Date heading to sort the column.
Quarterly Estimates
The Quarterly EPS Estimates section lists all analysts’ EPS projections for
the current and next fiscal quarters.
Current Fiscal Quarter Estimates
The leftmost column of the Quarterly Estimates section shows the latest
estimates for the current fiscal quarter. The column’s heading shows the
month and the year the current fiscal quarter will end in the MM/YYYY format
(for example, 03/2000).
An up or down arrow next to the estimate indicates a recent estimate
revision. The direction of the arrow indicates a change from the previous
analyst's estimate.
Estimates made by the Most Accurate Analysts are shown in red.
Click the MM/YYYY heading to sort the column.
Date of Quarterly EPS Estimate
The Date column shows the date of current fiscal quarter estimate. A blue
rating date indicates the most recently released analyst EPS estimate. Click
the Date heading to sort the column.
28 Estimates
Doc-To-Help Standard Template
Next Fiscal Quarter Estimates
Analysts’ EPS estimates for the next fiscal quarter are listed in the Quarterly
Estimates section in the column headed by the month and year (MM/YYYY)
the company's next fiscal quarter will end.
An up or down arrow next to the estimate indicates a recent estimate
revision. The direction of the arrow indicates a change from the previous
analyst's estimate.
Estimates made by the Most Accurate Analysts are shown in red. Click the
MM/YYYY heading to sort the column.
Date of Quarterly EPS Estimate
The Date column shows the date of next fiscal quarter estimate.
A blue rating date indicates the most recently released analyst EPS estimate.
Click the Date heading to sort the column.
Consensus
Consensus data for recommendations and estimates is displayed in the
lower portion of the Estimates report. There are separate consensus items
for the ratings and for the annual and quarterly estimates.
Most Accurate Consensus
The most accurate EPS consensus (displayed in red) is computed by ranking
the analyst's historical performance.
Annual EPS Estimates - Most Accurate Consensus Criteria
The most accurate EPS consensus is the average of the top quartile of the
analysts making forecasts, for whom we have history.
Most Accurate Annual
EPS Estimates
Consensus Criteria
The criteria for annual analyst EPS accuracy is the average number of
month end forecasts during the past four years when the analyst's annual
EPS absolute forecast error was less than the absolute consensus error for
the year.
Quarterly EPS Estimates - Most Accurate Consensus Criteria
Most Accurate Quarterly
EPS Estimates
Consensus Criteria
The criterion for quarterly analyst EPS accuracy is the average of the
analyst's absolute errors for the last two quarters.
Most Accurate Recommendations
Most Accurate
Recommendation
Ranking Criteria
Recommendation performance rates analysts based on the accuracy of their
recommendations. Zacks uses two measures to evaluate an analyst's ability
to rate stocks -- "Win Percentage" and "Excess Return".
A Win is recorded for each analyst's recommendation that beat the
performance of an equal weighted industry index for all buy and sell ratings.
Ties are broken by measuring how much the average buy recommendation
was in excess of the average industry performance.
The final results are expressed in terms of Strong Buy, Buy, Hold, Sell, or
Strong Sell.
Most Recent Consensus
The average of the most recent 25% of analysts' annual or quarterly
estimates and recommendations (dates displayed in blue).
Doc-To-Help Standard Template
Estimates 29
Zacks Consensus
Zacks consensus is computed for the current and next fiscal year estimates,
current and next fiscal quarter estimates and recommendations. The Zacks
consensus is the average (mean) of all analysts’ estimates or
recommendations for the company.
Custom Consensus
Custom consensus lets you compute your own consensus for ratings or
annual and quarterly EPS (for example, create a custom consensus to
include analysts only from national brokerage houses).
To create a custom consensus, de-select the box next to the analyst's name
you wish to exclude. As each boxes is unchecked your custom consensus
will automatically be calculated.
Rating Performance Report
This report shows you the best runs of each analyst for the past five years. A
run is a time period during which the analyst was recommending the stock a
Strong Buy or a Buy. If an analyst had more than one run during a period, we
only display the best run.
This report allows you to evaluate how individual analyst’s recommendations
performed in the past and whether the analysts have been successful in
making recommendations for the company.
You can also view a chart with the analyst’s ratings history from the moment
he or she began covering the company. The data associated with individual
analyst stays with that analyst, whether or not he or she is employed by more
than one firm during the period under evaluation.
30 Estimates
Doc-To-Help Standard Template
Rating Performance Report Components
Company Information
Ticker
The company’s ticker symbol.
Company
The company name.
Industry
One of more than seventy industry groups. These groupings represent
an aggregation of the over 200 industry categories under which Zacks
records data.
Last Update
The date of the database update.
Zacks Rating
The Zacks Rating is based on our proprietary model that uses earnings
estimate revisions and earnings surprises to predict short-term price
movements. Stocks are rated as a Strong Buy, Buy, Hold, Sell, or a Strong
Sell. These ratings have shown to be an accurate predictor of stock price
performance (relative to the market) for the coming 90-180 days as oppose
to the analyst’s long-term predictions that usually represent a 6-12 month
outlook.
The Zacks Rank is also a relative measure, comparing stock against the
entire universe of stocks, and the distribution of ranks reflects this:
approximately 20% of stocks are ranked Buy or Strong Buy; 60% of stocks
are ranked Hold; and 20% ranked Sell or Strong Sell.
Analyst/Broker
Analyst
Under the Analyst heading is a list of the names of the individual analysts. If
the analyst name is listed as Not Ident - it means that you do not have an
authorization to view the name.
You can click the Analyst heading to sort the column.
Broker
Under the Broker heading is a list of the names of the brokerage houses and
independent research institutions that currently employ the analyst. If the
broker name is listed as Not Ident - it means that you do not have an
authorization to view the name.
You can click the Broker heading to sort the column.
Ratings Code and Date
Rating Codes
The analyst ratings are presented as follows:
SB - Strong Buy
B - Buy
Doc-To-Help Standard Template
Estimates 31
H - Hold
S - Sell
SS - Strong Sell
NR - No Rating (or you may not be authorized to view certain analyst’s
recommendations).
An up/down arrow next to the rating code indicates a recent rating change by
an analyst. The direction of the arrow indicates a change from the previous
analyst's recommendation.
A red rating code indicates the most accurate analysts. Click the Code
heading to sort the column.
Rating Dates
Rating dates show the date of the recommendation or a revision date. Simple
rating confirmations do not affect the original or revised rating date.
A blue rating date indicates the most recently released analyst
recommendation. Click the Date heading to sort the column.
All Runs (Recommendation Performance)
A run is a time period during which the particular recommendation was
maintained.
#RECOM: The number of buy and sell recommendations made by the
analyst for the company in the last five years.
WIN% (Win Percentage): The percent of the recommendations that
outperformed an equal weighted industry index.
The WIN% is a measure of the analyst’s ability to identify stocks that have
superior or inferior performance compared to that of the industry. The WIN%
gives credit to both buy and sell ratings if, subsequent to the rating, the stock
performs as predicted in relation to its industry’s group’s equal weighted
index. It is not meant to measure the magnitude of a stock’s’ performance in
relation to that of the industry, rather the degree to which the direction of the
analyst’s rating was accurate.
See the Appendix section “Estimates Reports Methodology” for details and
calculation descriptions.
Average Buy Return
#MO: The average number of months the stock was recommended as Buy
by the analyst.
RET: The average return of each Buy recommendation.
IND: The average return of an equal weighted industry index during the same
period as the stock recommendation.
EXC: An approximation of a "wealth index," Excess Return reflects the
difference between the average return calculated for the analyst's buy
recommendations and the average returns of the equal weighted industry
index for the period during which the recommendations were in effect.
The Excess Return evaluates what an investor's profit could have been, if he
or she had diligently acted upon the analyst's buy recommendations.
32 Estimates
Doc-To-Help Standard Template
Best Buy Return
The buy recommendations with the best returns during the past five years are
shown in the Best Buy Return section.
#MO: The number of months with the best returns.
RET: The return of the recommendation with the highest return.
IND: The return of an equal weighted industry index for the same period as
the best buy recommendation.
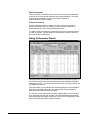
Analyst Rating History Plot
Analyst Rating History charts display how analyst recommendations have
changed over time. To access the Analyst Rating history, open the Rating
Performance report menu, select up to five analysts, whose historical
performance you want to evaluate, by checking the box to the left of the
analyst’s name.
Click the Plot History button.
The Analyst Rating History chart appear on the last used Price Action chart.
Interpreting Analyst Rating History Charts
The Analyst Rating History chart displays Analyst Ratings as horizontal bars
on the Price Action chart that was used last in place of volumes. Each
horizontal bar represents one analyst. The color of the bar represents the
recommendation as follows:
Doc-To-Help Standard Template
Dark Green – Strong Buy
Green – Buy
Light Blue – Hold
Light Red – Sell
Red – Strong Sell
Estimates 33
Empty – No Rating
Recommendations Details
You can also view the details of each recommendation by moving your
mouse over the Analyst Ratings horizontal bar.
A data box appears containing the following information:
Recommendation: Analyst rating expressed as Strong Buy, Buy, Hold, Sell,
or Strong Sell.
Start Date: The beginning date of the recommendation.
End Date: The end date of the recommendation.
Price Change: Stock’s price change during the recommendation period
(dividend are not included).
Index Change: The change in relevant Zacks X Industry Price Index during
the recommendation period.
34 Estimates
Doc-To-Help Standard Template
Annual EPS Accuracy Report
The Annual EPS Accuracy Report displays how many months in a given
year, an analyst’s estimate was more accurate than that month’s consensus
for that fiscal year.
Period of Evaluation
Eligibility
For Estimate Performance calculations Zacks is using the monthly forecasts
of fiscal year earnings for the last four years.
To be eligible, an analyst must have (a) rated at least three separate stocks
within a given industry for the past five years, and (b) have at least one EPS
forecast on file for the current fiscal year. This second requirement is meant
to ensure that, although an analyst may not have issued buy or sell ratings
for any of his or her stocks during the most recent year, the analyst is still
following the industry.
Annual EPS Accuracy Report Components
Company Information
Ticker
The company’s ticker symbol.
Company
The company name.
Industry
One of more than seventy industry groups. These groupings represent
an aggregation of the over 200 industry categories under which Zacks
records data.
Last Update
The date of the database update.
Doc-To-Help Standard Template
Estimates 35
Zacks Rating
The Zacks Rating is based on our proprietary model that uses earnings
estimate revisions and earnings surprises to predict short-term price
movements. Stocks are rated as a Strong Buy, Buy, Hold, Sell, or a Strong
Sell. These ratings have shown to be an accurate predictor of stock price
performance (relative to the market) for the coming 90-180 days as oppose
to the analyst’s long-term predictions that usually represent a 6-12 month
outlook.
The Zacks Rank is also a relative measure, comparing stock against the
entire universe of stocks, and the distribution of ranks reflects this:
approximately 20% of stocks are ranked Buy or Strong Buy; 60% of stocks
are ranked Hold; and 20% ranked Sell or Strong Sell.
Analyst/Broker
Analyst
Under the Analyst heading is a list of the names of the individual analysts. If
the analyst name is listed as Not Ident - it means that you do not have an
authorization to view the name.
Click the Analyst heading to sort the column.
Broker
Under the Broker heading is a list of the names of the brokerage houses and
independent research institutions that currently employ the analyst. The
broker name listed as Not Ident means authorization is needed to view the
name.
When the Broker column has the CO FORECAST entry, it identifies the
company’s own estimates for the earnings.
Click the Broker heading to sort the column.
Annual Estimates
The Annual Estimates section lists the analysts’ EPS projections for the
current and next fiscal years.
Current Fiscal Year Estimates
The leftmost column of the Annual Estimates section shows the latest
estimates for the company's current fiscal year. The column’s heading
displays the month/year the current fiscal year will end in the MM/YYYY
format (for example, 12/2000).
An up/down arrow next to the estimate indicates a recent estimate revision.
The direction of the arrow indicates a change from the previous analyst's
estimate.
Estimates made by the Most Accurate Analysts are shown in red. Click the
MM/YYYY heading to sort the column.
Date of Annual EPS Estimate
The Date column shows the date when the current fiscal year estimate was
made. A blue rating date indicates the most recently released analyst EPS
estimates. Click the Date heading to sort the column.
36 Estimates
Doc-To-Help Standard Template
Next Fiscal Year Estimates
Analysts’ EPS estimates for the next fiscal year are listed in the Annual
Estimates section below the column headed by the month/year (MM/YYYY)
the company's next fiscal year will end.
An up/down arrow next to the estimate indicates a recent estimate revision.
The direction of the arrow indicates a change from the previous analyst's
estimate.
Estimates made by the Most Accurate Analysts are shown in red. Click the
MM/YYYY heading to sort the column.
Date of Annual EPS Estimate
The Date column shows the date when the next fiscal year estimate was
made. A blue rating date indicates the most recently released analyst EPS
estimates. Click the Date heading to sort the column.
Number of Month Analyst Beats Consensus
There are four columns in the # of Month Analyst Beats Consensus display.
Each column represents one of the past four company’s fiscal years,
identified by that fiscal year end date.
For each year, we look at the analyst estimate 12 times during that year (at
each month end). We then compare that estimate with the consensus on
that date and note if the analyst was more accurate than the consensus. As
the result, the number of months (out of 12 observations) when the analyst's
absolute forecasting error was less than the consensus absolute error is then
shown in each column.
Quarterly EPS Accuracy Report
The Quarterly EPS Accuracy Report displays by how much each analyst
missed the actual each quarter for the past four quarters. The report also
shows the Consensus error for that quarter.
Period of Evaluation
Doc-To-Help Standard Template
For Estimate Performance calculations Zacks is using the EPS forecasts of
quarterly earnings for the last four fiscal quarters.
Estimates 37
Eligibility
To be eligible, an analyst must have (a) rated at least three separate stocks
within a given industry for the past five years, and (b) have at least one EPS
forecast on file for the current fiscal year. This second requirement is meant
to ensure that, although an analyst may not have issued buy or sell ratings
for any of his or her stocks during the most recent year, the analyst is still
following the industry.
Quarterly EPS Accuracy Report Components
Company Information
Ticker
The company’s ticker symbol.
Company
The company name.
Industry
One of more than seventy industry groups. These groupings represent
an aggregation of the over 200 industry categories under which Zacks
records data.
Last Update
The date of the database update.
Zacks Rating
The Zacks Rating is based on our proprietary model that uses earnings
estimate revisions and earnings surprises to predict short-term price
movements. Stocks are rated as a Strong Buy, Buy, Hold, Sell, or a Strong
Sell. These ratings have shown to be an accurate predictor of stock price
performance (relative to the market) for the coming 90-180 days as oppose
to the analyst’s long-term predictions that usually represent a 6-12 month
outlook.
The Zacks Rank is also a relative measure, comparing stock against the
entire universe of stocks, and the distribution of ranks reflects this:
approximately 20% of stocks are ranked Buy or Strong Buy; 60% of stocks
are ranked Hold; and 20% ranked Sell or Strong Sell.
Analyst/Broker
Analyst
Under the Analyst heading is a list of the names of the individual analysts.
The analyst name listed as Not Ident means authorization is needed to view
the name.
Click the Analyst heading to sort the column.
Broker
Under the Broker heading is a list of the names of the brokerage houses and
independent research institutions that currently employ the analyst. The
broker name as Not Ident means authorization is needed to view the name.
When the Broker column has the CO FORECAST entry, it identifies the
company’s own estimates for the earnings.
38 Estimates
Doc-To-Help Standard Template
Click the Broker heading to sort the column.
Quarterly Estimates
The Quarterly EPS estimates section lists all analyst EPS projections for the
current and next fiscal quarters.
Current Fiscal Quarter Estimates
The leftmost column of the Quarterly Estimates section displays the latest
estimates for the current fiscal quarter. The column’s heading displays the
month/year the current fiscal quarter will end in the MM/YYYY format (for
example, 03/2000).
An up/down arrow next to the estimate indicates a recent estimate revision.
The direction of the arrow indicates a change from the previous analyst's
estimate.
Estimates made by the Most Accurate Analysts are shown in red. Click the
MM/YYYY heading to sort the column.
Date of Quarterly EPS Estimate
The Date column shows the date when the current fiscal quarter estimate
was made. A blue rating date indicates the most recently released analyst
EPS estimate. Click the Date heading to sort the column.
Next Fiscal Quarter Estimates
Analyst EPS estimates for the next fiscal quarter are listed in the Quarterly
Estimates section in the column headed by the month and year (MM/YYYY)
the company's next fiscal year will end.
An up/down arrow next to the estimate indicates a recent estimate revision.
The direction of the arrow indicates a change from the previous analyst's
estimate.
Estimates made by the Most Accurate Analysts are shown in red. Click the
MM/YYYY heading to sort the column.
Date of Quarterly EPS Estimate
The Date column shows the date when the next fiscal quarter estimate was
made. A blue rating date indicates the most recently released analyst EPS
estimate. Click the Date heading to sort the column.
Estimate Errors
There are four columns in the Estimate Error section. Each column
represents one of the past four fiscal quarters for the company and is
identified in its heading by that quarter’s end date. These dates are shown in
the MM/YYYY format (for example, 12/1999, 09/1999, 06/1999, 03/1999).
The data shown in each column is the Quarterly Analyst Error for that
quarter.
Quarterly Analyst Error
The Quarterly Analyst Error is the difference between the quarter’s actual
EPS and the analyst's EPS estimate for that quarter as of the last day of the
given quarter.
Margin of Error - Top Quartile Performance (*)
An asterisk next to the analyst's estimate denotes a margin of error in the top
25% percent of all analysts. Observed when analyst’s error is less then
consensus error.
Doc-To-Help Standard Template
Estimates 39
Consensus Error
The report also includes the consensus error for each quarter. Consensus
Error is the difference between the consensus estimate for the quarter and
the actual quarterly EPS.
40 Estimates
Doc-To-Help Standard Template
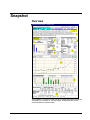
Snapshot
Overview
The Snapshot is a company report featuring company description, actual and
estimated EPS, company vs. industry ratings, fundamental data, broker
recommendations and price charts.
Doc-To-Help Standard Template
Snapshot 41
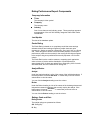
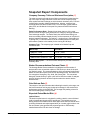
Snapshot Report Components
Company Summary Table and Business Description (1)
The most commonly referred pieces of data on a stock are located near the
top of the report for easy references. Items here include company name,
ticker symbol and the Exchange on which the stock is traded, price, P/E ratio
(trailing twelve months), Market Capitalization, Industry, company type,
current dividend rate and Dividend Yield, 12 month sales, growth rates for
sales, EPS, and dividends for the past five years and Zacks Performance
Ranking.
Zacks Performance Rank - Research has shown that one of the most
powerful forces driving a stock performance is change in earnings estimates
from brokerage analysts. The Zacks Rank (also called Zacks Rating) is a
short-term trading indicator based primarily on the momentum of revisions in
analysts' earnings estimates. The ranking — ranging from 1 (Strong Buy) to
5 (Strong Sell) — has been shown to be an accurate predictor of stock price
performance (relative to the market) for the coming 90-180 days.
Company Type - The company type is based on its Market Cap and
Price/Book ratio.
Market Cap
Price/Book
< $800 mil – Small
< 1.75 – Value
> $3500 mil – Large
> 3.5 – Growth
> $800 mil and < $3500 mil – Mid
> 1.75 and < 3.5 – Blend
Business Description - The brief business description provided beneath the
summary table.
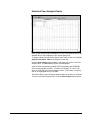
Broker Recommendations Data and Charts (2)
The Average Broker Recommendation is highlighted and the number of
analysts who have revised their opinion of the stock up or down in the past
four weeks is noted. The recommendations, which are updated continuously
based on information Zacks receives from brokerages firms, are broken into
five categories: Strong Buy, Buy, Hold, Sell, Strong Sell. The convenient
histogram format allows you get a quick feel for both the number of analysts
actively following the stock and their opinions about the stock's relative
attractiveness.
Price/Volume Data (3)
This section of the report includes data indicating the stock's price range over
the last 52 weeks as well as year-to-date price change for the stock and its
performance relative to the S&P 500. The average daily trading volume for
the last 20 trading days is also provided.
Expected Return/Market Risk (4)
Implied Return
The stock's implied return is calculated by adding a stock's current dividend
yield to its estimated long-term EPS growth rate. The implied return is a
handy performance measure which could approximate the total annual return
(including dividends and capital appreciation) an investor might achieve over
the next several years provided the projected growth on EPS actually
materializes and the P/E ratio does not change.
42 Snapshot
Doc-To-Help Standard Template
Beta
A stock's Beta is a statistical measure of its sensitivity to past market
movements. A stock with a beta of 1.5 has historically seen its price move
(up or down) one and one-half times the percentage change in the broader
equity market.
Shareholder Data (5)
This section includes data on the number of shares outstanding and the
percentage owned by Inside Management and Institutional Investors. Some
Institutional sponsorship is desirable because these large investors typically
trade large blocks of stocks that can result in significant upward price
movements. However, too high a level of Institutional ownership can
increase a stock's downside risk because these large shareholders represent
potential sellers if something goes wrong at the company. Significant
ownership by corporate insiders is considered favorable because
management's interests are then more closely aligned with other
shareholders.
Fundamental and Technical data
EPS, P/E and Growth Rates (6)
This section summarizes the company's recent Actual and Estimated EPS,
P/E and Year-to-Year EPS Growth Rates.
Current and 5-year Average Data (7)
This section includes five key measures as they stand currently versus
historically (average of the last five years). These measures are: P/E ratio
(trailing 12 months), P/E ratio relative to the S&P 500, Net Margin, Return on
Equity (ROE), and the Long-Term Debt To Capitalization Ratio - a key
indicator of financial risk. Stocks trading below (above) their historical P/E
and relative P/E ratios may be cheap (expensive) unless there have been
fundamental changes in the company's growth prospects. Similarly, changes
in a company's profitability or capital structure from previous norms are
important to note.
Actual EPS and EPS Estimates vs. Stock Price Chart (8)
The chart at the center of the Snapshot report plots the stock price versus
the 12-month earnings per share. The chart includes fiscal year-end data
going back five years, quarter-end data for the last four and next two
quarters, and estimated earnings projected 1,2 and 3-5 years out. While not
intended for use as a technical analysis tool, the price chart provides a visual
representation of how the stock has been trading relative to its past growth in
earnings as well as how Wall Street perceives its future earnings growth
prospects.
EPS Surprises and Estimate Revisions Chart (9)
A plot of the EPS surprises for the last four quarters and the 12 week
earnings estimate revisions for the current and next fiscal years are
displayed in a bar graph below the price chart. Earnings surprises are the
percent by which a company's earnings exceed or fall short of the consensus
estimates for a company on the EPS report date.
Company vs. Industry Comparison (10)
The table located at the bottom of a Snapshot report provides an overview of
how a company measures against its industry peers and the overall market
on a number of key measures. This data includes year-to-date price change,
P/E (12 month), estimated 3-5 year EPS growth rate, Price/Book,
Doc-To-Help Standard Template
Snapshot 43
Price/Sales, Price/Cash Flow, implied return to P/E ratio, dividend yield, Net
Margin, ROE, and Debt/Capital.
The industry comparable data is most useful for relatively homogeneous
industries. Zacks large number of industry classifications (over 200) helps to
insure comparability between companies.
44 Snapshot
Doc-To-Help Standard Template
Company vs. Industry Analysis
Overview
The Company vs. Industry Analysis report is great for showing how one
particular stock measures against your favorite stock-picking criteria. You
can graphically evaluate the investment attractiveness of a company versus
the industry median.
On the Company vs. Industry Analysis charts, the bar representing the
company is colored yellow and the bar representing the benchmark is
colored gray.
If a company’s ratio beats the benchmark, the "variance" bar is colored
green. If a company's ratio does not beat the benchmark, the "variance" bar
is colored red. For items where the lower number is better (for example
Average Broker Rating), the "variance" bar will be colored conversely: below
the benchmark will be green, and above the benchmark will be red.
Company vs. Industry Analysis Report
Components
The Company vs. Industry Analysis report can contain ratios from up to six
different categories: EPS Momentum, Fundamental Ratios, Broker
Recommendations, Growth Rates, Valuation, and Price Momentum.
Peer Analysis and Company vs. Industry Analysis use the same set of ratios.
When you create or edit the ratio set, it can be used with both the Company
vs. Industry Analysis and Peer Analysis reports.
Doc-To-Help Standard Template
Company vs. Industry Analysis 45
Company vs. Industry Analysis Ratio Sets
What ratios are displayed in the report is determined by the special Ratios
Set file. By default, Company vs. Industry Analysis uses the Value (*.txv )
Ratio Set. Edit or create a Ratio Set using the Ratio Set Editor.
Ratio Set Editor
Create a new Ratios Set or edit an existing one using the Ratios Set Editor.
Creating Ratio Sets
To create a new Ratio Set open the Tools menu then select Ratio Set Editor
or click the Ratios Editor button on the tool bar. The Edit Ratio dialog box
appears. For new ratios set file, enter the ratio set name in the File name box
then click Yes.
A Ratio Set Editor dialog box will appear. The Ratios Set section will be
empty.
From the Full Ratio List section, select a category. Available ratios from that
category will display in the Ratios section. Highlight a ratio from the Ratios
list. Use the scroll bar to view all available ratios.
Specify a benchmark (select from Industry, Sector, S&P 500 or number).
When using the Number as your benchmark, enter in the desired value in the
Number box.
To add a selected ratio, click << Add. The ratios will display in the Ratio Set
section (ratios will be added to their corresponding categories). To delete all
ratios, click Clear. When the ratio set is complete, click Save.
You may select up to 14 ratios from the same category…
46 Company vs. Industry Analysis
Doc-To-Help Standard Template
Editing Ratio Sets
To edit a previously created Ratio Set, open the Tools menu, select Ratio Set
Editor or click the Ratios Editor button. The Edit Ratio dialog box appears.
Select a file then click Open.
A Ratio Set Editor dialog box will display.
To remove a ratio from the list, highlight that ratio from the Ratio Set list and
click the >> Remove button.
To add a new ratio to the Ratio Set, highlight a Ratio Category from the Full
Ratio List. A list of available ratios from that category will display in the
Ratios list. Highlight a ratio from the Ratios list. Use the scroll bar to view
all available ratios.
Specify the benchmark, (select from Industry, Sector, S&P 500 or number).
When using a Number option as your benchmark, type the desired value in
the Number box.
To add a selected ratio, click the << Add button. The ratio will display in the
Ratio Set section (ratios will be added to their corresponding categories). To
delete all ratios, click Clear.
When the ratio set is complete, select the Save As.. button to save the ratio
set file under a new name; choose Save to overwrite the existing file.
Selecting Ratio Sets
To select a new default ratio set, open the Tools menu, select Select Ratio
Set. The Select Ratio Set dialog box will appear. Select a Ratio Set file
then click Open.
Doc-To-Help Standard Template
Company vs. Industry Analysis 47
Peer Analysis
Overview
With the Peer Analysis reports you can graphically compare any active ticker
on the current Ticker List (portfolio) with its peers based on historical sales,
net income, past and future EPS, brokerage firm recommendations or many
other investment criteria.
The Peer Analysis report displays ratios from the ratio sets that can be edited
to match your own decision making process and can be customized to match
your requirements.
By default, Peer Analysis is using Zacks Peer Group (called Automatic Peer
Group). You can use the Custom Peer Group option to view the group of
companies that you put together.
Zacks Peer Group
By default, Peer Analysis will select a Zacks Peer Group for the active ticker
on the current Ticker List (portfolio). The Peer Analysis automatically selects
a Peer Group of companies in the same industry as the selected company.
The company’s industry assignment is based on Zacks Expanded Industry
Classification (200+ codes). A Peer Group can contain up to eight
companies. Reported annual sales numbers are basis for selection to Peer
Group, i.e., companies in the same industry with the similar sales volumes
will be grouped together.
Custom Peer Group
To view a Peer Analysis report for all companies on your current Ticker List
(portfolio), select Custom Peer Group from the Tools menu.
Selecting Companies for Custom Peer Groups
48 Peer Analysis
Doc-To-Help Standard Template
Selecting Custom Peer Group option will display the Peer Analysis report for
all companies on your active Ticker List.
To create a Ticker List with companies for you custom group, open the Ticker
menu, choose Companies or click the Companies button on the ICA toolbar.
The Ticker List dialog box will appear.
Click the Remove All button to clear the Ticker List.
In the Add Ticker List box enter a ticker symbol. For entering more than one
ticker at a time, a space or a comma must separate each ticker symbol.
Click Add or press Enter then click OK when done.
Be sure to save and name your Ticker List.
Selecting Ticker List for Custom Peer Groups
To select a Ticker List for the Peer Analysis report, open the File menu,
select Open. Select a Ticker List to open then click OK. The specified Ticker
List will become active. Open the Tools menu, select Custom Peer Group.
Peer Analysis Components
The Peer Analysis report allows you to display various fundamental ratios
from up to six Ratio Categories. It also shows the companies in the Peer
Group. All the data is displayed in the Information Table and a Fundamental
ratios comparison chart.
Peer Analysis Ratio Categories
Peer Analysis displays information from up to six ratio categories: EPS
Momentum, Fundamental Ratios, Broker Recommendations, Growth Rates,
Valuation, and Price Momentum. To toggle between these ratio categories,
highlight the category name you wish to see displayed in a report.
Information for the items in the selected category will display in the
Information Table in the lower section of the Peer Analysis report.
If the ratio set does not contain ratios from each of the six categories, you
must select from the displayed categories only.
Doc-To-Help Standard Template
Peer Analysis 49
Peer Analysis Information Table
Financial data for the selected ratio category appears in the Information
Table in the lower section of the Peer Analysis report. To view a graph of
each ratio displayed in the table, click the column title in the Peer Analysis
Information Table.
Peer Analysis Ratio Sets
What ratios are displayed in the report is determined by the special Ratios
Set file. By default, Peer Analysis uses the Value (*.txv) Ratio Set. You can
edit or create a Ratio Set file using the Ratio Set Editor.
Peer Analysis and Company vs. Industry Analysis use the same set of ratios.
When you create/edit the ratios set, it can be used with both the Company
vs. Industry Analysis and Peer Analysis reports.
50 Peer Analysis
Doc-To-Help Standard Template
Historical Peer Analysis Charts
When a Peer Analysis report is displayed, you can view historical data for the
selected item for the companies in your current peer group.
To display a historical chart for the specific ratio Select a ratio from the Peer
Analysis Information Table by clicking the column title.
Click the Show History button located in the upper right corner of the Peer
Analysis chart. The Peer List dialog box will be displayed.
Select multiple companies by holding SHIFT and pressing the UP/DOWN
arrow keys to highlight selection. To select one company at a time, hold
down the CTRL key and click the company name. (To de-select a company,
click on its highlighted name). Click OK.
The Ratios History report will display historical data for the ratio you selected.
To return to the Peer Analysis menu, click the Peer Analysis access button.
Doc-To-Help Standard Template
Peer Analysis 51
Working With Ratio Set Editor
Creating Ratio Sets
To create a new Ratio Set, open the Tools menu, select Ratio Set Editor
command or click the Ratios Editor button The Edit Ratio dialog box will
appear.
To create a new ratio set file, enter the ratio set name in the File name box.
then click Yes.
A Ratio Set Editor dialog box will be displayed (the will be empty).
From the Full Ratio List section, select a category. A list of available ratios
from that category will be display in the Ratios section.
Highlight a ratio from the Ratios list. Use the scroll bar to view all available
ratios. (If this ratio set file will be used with the Company vs. Industry
Analysis reports as well, select a specific benchmark for each ratio or the
default benchmark will be Industry).
To add a selected ratio, click << Add. The ratio will display in the Ratio Set
section (ratios will be added to their corresponding categories). To delete all
ratios, click Clear.
Be sure to save after completing ratio set.
52 Peer Analysis
Doc-To-Help Standard Template
Editing Ratio Sets
To edit a previously created Ratio Set, open the Tools menu, select Ratio Set
Editor or click the Ratios Editor button The Edit Ratio dialog box appears,
select a file then click Open.
A Ratio Set Editor dialog box will display
To remove a ratio from the list, highlight a ratio from the Ratio Set list then
click the >> Remove button.
To add a new ratio to the Ratios Set, from the Full Ratio List section, select
a category. A list of available ratios from that category will display in the
Ratios section.
Highlight a ratio from the Ratios list. Use the scroll bar to view all available
ratios.
To add a selected ratio, click << Add. The ratio will be displayed in the
Ratio Set section (ratios will be added to their corresponding categories). To
delete all ratios, click Clear.
When the ratio set is complete, select the Save As.. button to save the ratio
set file under a new name; choose Save to overwrite the existing file.
Selecting Ratio Sets
The Select Ratio Set option allows you to specify a new default ratio set file
(*.txv).
To select a new default ratio set open the Tools menu, click Select Ratio Set.
The Select Ratio Set dialog box will appear. Select a new default Ratio Set
file then click Open.
Doc-To-Help Standard Template
Peer Analysis 53
Internet-Based Reports
Using Internet-Based Reports
Before you display a report, select a company from the Company Ticker List.
To display a report Select a company from the Tickers pull-down menu
(located to the left of the Get Report button). Choose a report from the
Internet Reports menu then click the Get Report button. ICA will launch your
browser in a new window and the report will be displayed. To switch between
your browser and ICA, click the ICA’ s button on the Windows taskbar.
Fundamental Reports
Income Statement, Balance Sheet, and Cash Flow tables
There are several Income Statement, Balance Sheet, and Cash Flow tables
(presented annually for the last 5 years and quarterly for the last 8 quarters)
available in this category of the Internet-Based reports.
Please note that the line items shown in these tables may not exactly match
the line items on the 10-K and 10-Q reported by the company, as Zacks has
standardized a number of items to facilitate comparison between companies.
The reports in this category include:
Annual Cash Flow Statement - standardized report containing data
from 10K filings.
Annual Income Statement - standardized report containing
information from 10K filings.
Annual Balance Sheet - standardized report containing data from
10K filings.
Quarterly Balance Sheet - standardized report containing data from
10Q filings.
Quarterly Income Statement - standardized report containing data
from 10Q filings.
Annual Ratios & Turnover Rates - Assets/Liabilities ratios, turnover
rates and sales ratios.
Quarterly Ratios & Turnover Rates - Assets/Liabilities ratios, turnover
rates and sales ratios.
Return on Equity Reports
There are two Return on Equity reports, presented annually for the last 5
years and quarterly for the last 8 quarters. These reports use the extended
DuPont model (ROE Decomposition).
The ROE Decomposition model measures a company's profitability and
helps to relate and interpret the financial ratios for asset management, debt
management and profitability. It also calculates return on shareholder equity:
ROE = After Tax Profit Margin x Total Asset Turnover x Equity Multiplier
The reports in this category include:
54 Internet-Based Reports
Annual Return on Equity - ROE Decomposition - 5 years.
Quarterly Return on Equity - ROE Decomposition - 8 quarters.
Doc-To-Help Standard Template
Risk Rating/Bankruptcy Reports
In addition, we have included two Risk Rating/Bankruptcy reports, presented
annually for the last 5 years and quarterly for the last 8 quarters. These
reports show what the company would be worth upon liquidation. The Net
Liquidation Value is the amount that could be realized by selling the assets of
a firm after paying the debt.
The reports in this category include:
Annual Risk Rating/Bankruptcy Report - displays annual growth
rates and components of Net Liquidation Value.
Quarterly Risk Rating/Bankruptcy Report - displays quarterly growth
rates and components of Net Liquidation Value.
Business Description & Management
Discussion Reports
Business Descriptions Reports
A complete overview of the business of the company from the last 10-K
filings.
Management's Discussion and Analysis Reports
Management's Discussion and Analysis report (Management's Discussion
and Analysis of Financial Condition and Results of Operations) is a report
from management to the shareholders that accompanies the firm's financial
statements in the annual report. This report explains the period's financial
results and enables management to discuss other ideas that may not be
apparent in the financial statements in the annual report.
Insider Trading Report
The most recent insider transactions, as reported to the SEC, are
summarized here. Insiders include major corporate officers, members of the
board of directors, and owners of 10% or more of any equity class of
securities.
Brokerage Research Reports and Their
Abstracts
Zacks summarizes the content of brokerage research reports made by the
analysts following the company. These abstracts include the sell-side
analysts recommendations and usually represent a 6-12 month outlook. This
report also provides the analyst's Track Record.
Our report library contains data from over 300 U.S. and Canadian brokerage
firms, providing research reports (and their abstracts) of more than 2,200
analysts covering 8,000+ companies.
Doc-To-Help Standard Template
Internet-Based Reports 55
Appendix
Company Overlays
Fundamental Overlays
EPS Surprises
Quarterly EPS Surprise - a measure of the deviation of Actual Quarterly EPS
from Last Quarterly EPS Estimate, calculated as ([ACT EPSQ-LAST EPSQ0]
/ Absolute Value of LAST EPSQ0) x 100.
Positive surprises are represented by green arrows and negative surprises
are represented by red arrows. The magnitude of the surprise is depicted in
the number of dashes comprising the arrow (a surprise of 0% is shown as
red and green triangles):
Up to 10% Surprise - one arrow
10-20% Surprise - two arrows
20-30% Surprise - three arrows
30-40% Surprise - four arrows
Above 50% Surprise - solid arrow line
Broker Recommendations
The average of analyst ratings for the company (Strong Buy = 1, Buy = 2,
Hold = 3, Sell = 4, Strong Sell = 5). This overlays uses and inverted scale.
Quarterly EPS
Quarterly Actual Earnings per Share.
12 Month EPS
12 Month - Actual Earnings per Share.
Annual EPS
Annual Actual Earnings per Share.
Return on Equity
ROE calculated as (12 - Month EPS / Book Value per Share).
Return on Assets
ROA calculated as (12 - Month EPS / Total Assets per Share).
Quarterly Sales
Quarterly Net Sales or Revenues.
Annual Sales
Annual Net Sales or Revenues.
Quarterly EPS Trend
Actual and Consensus Estimate Quarterly Earnings per Share.
12 Month EPS Trend
12 Month - Actual and Consensus Estimate Earnings per Share.
Quarterly Net Income
Quarterly Net Income Data.
Annual Net Income
56 Appendix
Doc-To-Help Standard Template
Annual Net Income Data.
Zacks Indicator
Zacks Indicator Equity selection model composite rank (1-99). The
companies that appear most attractive for purchase are ranked 1 and
companies with the worst predicted performance are ranked 99. Ranks
between 20 and 80 are considered neutral and should be ignored; any
changes in the score within this range should be ignored as well.
It is important to note that the Indicator is a relative ranking tool only. It is not
an absolute valuation tool. The Indicator does not measure real or absolute
value; instead, it predicts changes in relative market valuation.
This overlay uses an inverted scale.
Quarterly Operating Margin
The quarterly operating marginal percentage of gross sales less the cost of
goods sold and selling, general and administrative (SG&A) expenses.
Annual Operating Margin
The annual operating marginal percentage of gross sales less the cost of
goods sold and selling, general and administrative (SG&A) expenses.
Consensus Overlays
Consensus Overlays use mean EPS Estimate for the specified year based
on Current and Next Fiscal Year analysts estimates.
Index Overlays
The following Index plot overlays were calculated by Zacks using a value of
100 at the beginning of the time series of returns for each Index. Index plot
overlays include month-end data.
HFRI™ Indexes - Hedge Fund Research Transparent Indices, © 1999
Hedge Fund Research, LLC. "Using the detailed position data on
investment managers, Hedge Fund Research, Inc. selects pure style
managers for each index focusing on the defining characteristics of each
strategy".
HFRI™ Equity Hedge Index plot. This Index tracks performances of
those hedge funds, whose managers' investing style is purely Equity
Hedge, i.e., "consists of a core holding of long equities hedged at all times
with short sales of stocks and/or stock index options".
HFRI™ Equity Market Neutral Index plot. This Index tracks
performances of those hedge funds, whose managers' investing style is
purely Equity Market Neutral, i.e., "investing seeks to profit by exploiting
pricing inefficiencies between related equity securities, neutralizing
exposure to market risk by combining long and short positions".
HFRI™ Event-Driven Index plot. This Index tracks performances of
those hedge funds, whose managers' investing style is purely Event-Driven
("corporate life cycle"), i.e., "involves investing in opportunities created by
significant transactional events, such as spin-offs, mergers and
acquisitions, bankruptcy reorganizations, re-capitalizations and share
buybacks".
Lehman © Treasury Long Index plot. "The Lehman Treasury Long Index is
a subgroup of the Shearson Lehman Treasury Index based on maturity. (The
Doc-To-Help Standard Template
Appendix 57
Lehman Treasury Index consists of public obligations of the U.S. Treasury
with a remaining maturity of one year or more)".
MSCI EAFE® Index plot - The Morgan Stanley Capital International
Europe, Australasia, Far East Index. The MSCI EAFE® is a stock index
designed to "measure the investment returns of the developed countries
outside of North America".
Prudential © Style Indices (Large Growth, Large Value, MidCap Growth,
MidCap Value, Small Growth, Small Value):
Large Cap: ”The Prudential Large Cap Style Indices are selected from
stocks in the top 12 percentiles of market capitalization in the Compustat
universe.
Large-cap growth stocks have historical sales growth greater than 10%,
rank in the top half of the I/B/E/S forecast growth rate, and have low
payouts and debt/capital ratios.
Large-cap value stocks rank in the bottom 50% of the universe based on a
normalized P/E. Additionally, companies that are dividend-paying must
have sustainable dividend rates. Shares outstanding according to FactSet
are used to determine market value".
Mid Cap: "The Prudential Mid Cap Style Indices are created by screening
the eighth through twenty-fifth percentiles of market value in the Compustat
universe for companies with growth or value characteristics".
Mid-cap growth stocks "have historical sales growth greater than 10%,
rank in the top 50% of the I/B/E/S forecast growth rate, and have low
payouts and debt/capital ratios".
Mid-cap value stocks "rank in the bottom 50% of the universe based on a
normalized P/E. Additionally, companies that are dividend-paying must
have sustainable dividend rates. Shares outstanding according to FactSet
are used to determine market value".
Small Cap: "The Prudential Small Cap Style Indices are created by
screening the twentieth through forty-fifth percentiles of market value in the
Compustat universe for companies with growth or value characteristics".
Small-cap growth stocks "have historical sales growth greater than 10%,
rank in the top half of the I/B/E/S forecast growth rate, and have low
payouts and debt/capital ratios".
Small-cap value stocks "rank in the bottom 50% of the universe based on a
normalized P/E. Additionally, companies that are dividend-paying must
have sustainable dividend rates. Shares outstanding according to FactSet
are used to determine market value".
Russell Indexes - Copyright © Frank Russell Company 1995 - 1999. All
rights reserved.
Russell 1000® Index Total Return plot: The Russell 1000® Index
"measures the performance of the 1,000 largest companies in the Russell
3000 Index, which represents approximately 89% of the total market
capitalization of the Russell 3000 Index".
Russell 1000® Growth Index plot: The Russell 1000® Growth Index
index "measures the performance of those Russell 1000 companies with
higher price-to-book ratios and higher forecasted growth values".
58 Appendix
Doc-To-Help Standard Template
Russell 1000® Value Index plot: The Russell 1000® Value Index
"measures the performance of those Russell 1000 companies with lower
price-to-book ratios and lower forecasted growth values".
Russell 2000® Small Stock Index Total Return: The Russell 2000®
Index "measures the performance of the 2,000 smallest companies in the
Russell 3000 Index, which represents approximately 11% of the total
market capitalization of the Russell 3000 Index".
Russell 2000® Growth Index plot: The Russell 2000® Growth Index
"measures the performance of those Russell 2000 companies with higher
price-to-book ratios and higher forecasted growth values".
Russell 2000® Value Index plot: The Russell 2000® Value Index
"measures the performance of those Russell 2000 companies with lower
price-to-book ratios and lower forecasted growth values".
Russell 2500™ Index Total Return plot: The Russell 2500™ Index
"measures the performance of the 2,500 smallest companies in the Russell
3000 Index, which represents approximately 22% of the total market
capitalization of the Russell 3000 Index".
Russell 2500™ Growth Index plot: The Russell 2500™ Growth Index
"measures the performance of those Russell 2500 companies with higher
price-to-book ratios and higher forecasted growth values".
Russell 2500™ Value Index plot: The Russell 2500™ Value Index
"measures the performance of those Russell 2500 companies with lower
price-to-book ratios and lower forecasted growth values".
Russell 3000® Index plot: The Russell 3000® Index "measures the
performance of the 3,000 largest US companies based on total market
capitalization, which represents approximately 98% of the investable US
equity market".
Russell 3000® Growth Index plot: The Russell 3000® Growth Index
"measures the performance of those Russell 3000 Index companies with
higher price-to-book ratios and higher forecasted growth values. The
stocks in this index are also members of either the Russell 1000 Growth or
the Russell 2000 Growth indexes".
Russell 3000® Value Index plot: The Russell 3000® Value Index
"measures the performance of those Russell 3000 Index companies with
lower price-to-book ratios and lower forecasted growth values. The stocks
in this index are also members of either the Russell 1000 Value or the
Russell 2000 Value indexes".
Russell MidCap™ Index Total Return plot: The Russell Midcap™ Index
"measures the performance of the 800 smallest companies in the Russell
1000 Index, which represent approximately 35% of the total market
capitalization of the Russell 1000 Index".
Russell Midcap™ Growth Index plot: The Russell Midcap™ Growth
Index "measures the performance of those Russell Midcap companies with
higher price-to-book ratios and higher forecasted growth values. The
stocks are also members of the Russell 1000 Growth index".
Russell Midcap™ Value Index plot: The Russell Midcap™ Value Index
"measures the performance of those Russell Midcap companies with lower
price-to-book ratios and lower forecasted growth values. The stocks are
also members of the Russell 1000 Value index".
Doc-To-Help Standard Template
Appendix 59
Russell Top 200™ Index Total Return plot: The Russell Top 200™ Index
"measures the performance of the 200 largest companies in the Russell
1000 Index, which represents approximately 65% of the total market
capitalization of the Russell 1000 Index".
Russell Top 200™ Growth Index plot: The Russell Top 200™ Growth
Index "measures the performance of those Russell Top 200 companies
with higher price-to-book ratios and higher forecasted growth values. The
stocks are also members of the Russell 1000 Growth index".
Russell Top 200™ Value Index plot: Russell Top 200™ Value Index
"measures the performance of those Russell Top 200 companies with
lower price-to-book ratios and lower forecasted growth values. The stocks
are also members of the Russell 1000 Value index".
Standard & Poor's Indices - Copyright © 1999. The McGraw-Hill
Companies, Inc.
S&P 100 Index plot: The S&P 100 Index "measures large company U.S.
stock market performance. This market capitaliztion-weighted index is
made up of 100 major, blue chip stocks across diverse industry groups".
S&P 1500 Index plot: The S&P 1500 Index, also known as the S&P
SuperComposite 1500, is a combination of the S&P 500, MidCap 400, and
SmallCap 600 Indices. The S&P SuperComposite 1500 "represents 87%
of the total U.S. equity market capitalization".
S&P MidCap 400 Index plot: The S&P MidCap 400 Index "measures the
performance of the mid-size company segment of the U.S. market".
S&P SmallCap 600 Index plot: The S&P SmallCap 600 Index "measures
the performance of the small-size company segment of the U.S. market".
S&P 500 Total Return plot: The S&P 500 Index is "widely regarded as the
standard for measuring large-cap U.S. stock market performance". This
index includes a "representative sample of leading companies in leading
industries".
S&P500/BARRA Growth and Value Indices: "Companies in the S&P 500
index are split into two groups based on price-to-book ratio to create growth
and value indices. The Value index contains companies with lower price-tobook ratios, while the Growth index contains those with higher ratios".
S&P 500/BARRA Growth Index plot: a subset of the S&P 500 companies
with higher price-to-book ratios.
S&P 500/BARRA Value Index plot: a subset of the S&P 500 companies
with lower price-to-book ratios.
Wilshire Indices - © 1999, Wilshire Associates, Incorporated.
Wilshire 5000 Value-Weighted Total Perf Index plot: The Wilshire 5000
Equity Index "measures the performance of all U.S. headquartered equity
securities with readily available price data. Over 7,000 capitalization
weighted security returns are used to adjust the index. The Wilshire 5000
capitalization is about 81% NYSE, 2% AMEX, and 17% OTC".
The Wilshire 5000 Value-Weighted Total Perf Index is a total return of
index using capital weights.
Wilshire 4500 Equity Index plot: The Wilshire 4500 Equity Index "is the
Wilshire 5000 securities with the companies in the Standard & Poor's 500
60 Appendix
Doc-To-Help Standard Template
Index removed. The approximately 6,500 capitalization weighted returns
provide an excellent benchmark for "extended" fund managers".
Wilshire REIT Index plot: The Wilshire REIT Index includes Total Returns
for the Wilshire Real Estate Securities sub-index, the REIT Index, which
represents U.S. publicly traded Real Estate Investment Trusts.
Wilshire Style Indexes: "Wilshire Asset Management's indices are
derived from the largest 2500 securities, the Top 2500, of the Wilshire
5000 Equity Stock index".
The Large Company Universe: "The large company universe, the Top
750, consists of the largest 750 companies in the Wilshire
5000 and extends down to approximately the $1.8 billion market
capitalization level".
The Small Company Universe: "The small company universe, the Next
1750, consists of the remaining securities in the Top 2500,
and extends down to approximately the $244 million market capitalization
level".
Creating the Individual Indexes: "By screening each universe quarterly
for all companies which embody the characteristics of each style, Wilshire
creates its Style Indexes", three of which are included as overlays in ICA:
Large Cap Growth Index plot, Large Cap Value Index plot, and Small
Cap Value Index plot.
Key Variables: "Key variables used by the value index include
price/earnings ratio, price-to-book, and yield. Variables employed for the
growth index screenings include sales growth, return on equity, and
dividend payout".
Zacks Chart Definitions
Price & Surprise
This chart shows whether the stock price responds to EPS surprises.
Relative Price & Surprise
This chart overlays EPS Surprises with the stock price relative to S&P 500.
The chart shows whether the stock price responds to EPS surprises. An
upward sloping relative to S&P 500 price line indicates that stock is
outperforming the market, whereas the downward sloping line indicates that
the stock is under-performing the market.
Broker Recommendations
This chart shows whether the stock price responds to changes in broker
recommendations.
Price & Consensus
This chart shows whether the stock price responds to changes in consensus
estimates for the fiscal year.
Relative Price & Consensus
This chart overlays Consensus estimates with the stock price relative to S&P
500. The chart shows whether the stock price responds to changes in
consensus estimates for the fiscal year. An upward sloping relative to S&P
500 price line indicates that stock is outperforming the market, whereas the
downward sloping line indicates that the stock is under-performing the
market.
Doc-To-Help Standard Template
Appendix 61
Indicator & Relative Price
The Zacks Indicator is the estimate revision and earnings surprise model that
predicts the direction and magnitude changes in stock prices.
How the Indicator Ranks are Derived
Estimate revision activity and earnings surprises are measured for all
companies and a raw score is created. Companies are then ranked relative
to one another on a scale from 1 to 99 to create a composite. Indicator ranks
less than or equal to 20 are bullish, Indicator ranks greater than or equal to
80 are bearish, and all other Indicator ranks should be considered neutral
and ignored.
The Indicator & Relative Price chart overlays Indicator composite rank with
the stock price relative to S&P 500. An upward sloping relative price line
indicates that the stock is outperforming the market, whereas the downward
sloping line indicates that the stock is under-performing the market.
12 Month EPS
This chart shows whether the stock price responds to changes in Actual and
Consensus 12 Month EPS.
Performance Relative to M Industry
This chart shows the stock price performance versus relevant Zacks M
Industry median price index.
Performance Relative to X Industry
This chart shows the stock price performance versus relevant Zacks X
Industry median price index.
Performance Relative to Sector
This chart shows the stock price performance versus relevant Zacks Sector
median price index.
Performance Relative to DJIA
This chart shows the stock price performance versus the Dow Jones
Industrial Average.
Performance Relative to Russell 2000
This chart shows the stock price performance versus the Russell 2000 Index.
Performance Relative to S&P 100
This chart shows the stock price performance versus the S&P 100 Index.
Performance Relative to S&P 400
This chart shows the stock price performance versus the S&P MidCap 400
Index.
Performance Relative to S&P 500
This chart shows the stock price performance versus the S&P 500 Index.
Performance Relative to S&P 600
This chart shows the stock price performance versus the S&P SmallCap 600
Index.
Performance Relative to Wilshire 5000
This chart shows the stock price performance versus the Wilshire 5000
Index.
Performance Relative to NASDAQ
62 Appendix
Doc-To-Help Standard Template
This chart shows the stock price performance versus the NASDAQ
composite.
Zacks Sector and Industry
Designations
The following is a list of Zacks X (Expanded) Industries, Zacks Sectors, and
Zacks M (Medium) Industries designations.
Zacks X (Expanded) Sector Groups
0
1
2
3
4
5
6
7
8
Indices
Consumer Staples
Consumer Discretionary
Retail-Wholesale
Medical
Auto-Tires-Trucks
Basic Materials
Industrial Products
Construction
9
10
11
12
13
14
15
16
17
Conglomerates
Computer and Technology
Aerospace
Oils-Energy
Finance
Utilities
Transportation
Business Services
Unclassified
Zacks M (Medium) Industry Groups
0
1
2
3
4
5
6
7
8
9
10
11
12
13
14
15
16
17
18
19
20
21
22
23
24
25
26
27
28
29
INDICES
APPAREL
BEVERAGES
FOOD
PUBLISHING
SOAPS-COSMETICS
TOBACCO
CONS PROD-MISC STAPLES
HOME FURNISHING-APPLIANCE
LEISURE SERVICE
MEDIA
PHOTO EQUIPMENT & SUPPLIES
OTHER CONSUMER DISCRETIONARY
FOOD/DRUG-RETAIL/WHOLESALE
NONFOOD RETAIL-WHOLESALE
DRUGS
MEDICAL CARE
MEDICAL PRODUCTS
AUTOS-TIRES-TRUCKS
CHEMICALS & FERTILIZER
METALS-NON FERROUS
STEEL
PAPER
CONTAINERS & GLASS
INDUSTRIAL PRODUCTS-SERVICES
MACHINERY-ELECTRICAL
MACHINERY
POLLUTION CONTROL
BUILDING PRODUCTS
CONSTRUCTION-BUILDING SERVICES
Doc-To-Help Standard Template
31
32
33
34
35
36
37
38
39
40
41
42
43
44
45
46
47
48
49
50
51
52
53
54
55
56
57
58
59
70
COMPUTER-OFFICE EQUIPMENT
COMPUTER SOFTWARE-SERVICES
ELECTRONIC-SEMICONDUCTORS
ELECTRONICS
MISC TECHNOLOGY
TELECOMMUNICATIONS EQUIPMENT
TELECOMMUNICATIONS SERVICES
AEROSPACE-DEFENSE
COAL
ENERGY-ALTERNATE SOURCES
OIL MACHINERY-SERVICES-DRILLING
OIL-EXPLORATION&PRODUCTION
OIL-MISC
OIL-INTEGRATED
OIL&GAS PRODUCTION-PIPELINE
BANKS-MAJOR
BANKS & THRIFTS
FINANCE
INSURANCE
INVEST BKRS-MGRS
INVESTMENT FUND
REAL ESTATE
UTILITY-ELEC PWR
UTILITY-GAS DISTR
UTILITY-TELEPHONE
UTILITY-WATER SUPPLY
TRANSPORTATION-AIR
TRANSPORTATION
BUSINESS SERVICE
UNCLASSIFIED
Appendix 63
30
CONGLOMERATES
Zacks X (Expanded) Industry Groups
1
2
3
4
5
6
7
8
9
10
11
12
13
14
15
16
17
18
19
20
21
22
23
24
25
26
27
28
29
30
31
32
33
34
35
36
37
38
39
40
41
42
43
44
45
46
47
48
49
50
51
52
53
54
ADVERTISING
AEROSP/DEFENSE
AEROSP/DEF EQ
AGRI OPERATIONS
APPLIANCE-HSHLD
AUDIO/VIDEO PRD
AUTO -DOMESTIC
AUTO -FOREIGN
RET/WHL-AUTO PT
AUTO/TRUCK-ORIG
AUTO/TRUCK-REPL
BANKS-FOREIGN
BANKS-MIDWEST
BANKS-MONEY CTR
BANKS-NORTHEAST
BANKS-SOUTHEAST
BANKS-SOUTHWEST
BANKS-WEST
BEVERAGES-ALCOH
BEVERAGES-SOFT
BLDG&CONST-MISC
BLDG PRD-AIR/HT
BLDG PRD-DRS&TR
BLDG PRD-LTG FX
BLDG PRD-RT/WHL
BLDG PRD-WOOD
BLDG-CMT/CNT/AG
BLDG-HEAVY CNST
BLDG-MAINT & SV
BLDG-MBL/MFG&RV
BLDG-RSDNT/COMR
BRDCST-RADIO/TV
CABLE TV
CHEM-DIVERSIFD
CHEM-FIBERS
CHEM-PLASTICS
CHEM-SPECIALTY
COAL
COMP-GRAPHICS
COMP-MAINFRAME
COMP-MICRO
COMP-PERIPH EQP
COMP-SERVICES
COMP-SOFTWARE
CONTNRS-MTL/GLS
CONTNRS-PPR/PLS
COSMETICS&TLTRS
DIVERSIFIED OPS
ELEC COMP-SEMIC
ELEC-MISC COMPN
ELEC MSRNG INST
ELEC PRODS-MISC
ELEC-CONNECTORS
ELEC PARTS DIST
64 Appendix
55
56
57
58
59
60
61
62
63
64
65
66
67
68
69
70
71
72
73
74
75
76
77
78
79
80
81
82
83
84
85
86
87
88
89
90
91
92
93
94
95
96
97
98
99
100
101
102
103
104
105
106
107
108
ELEC-MILITARY
ENERGY-ALT SRCS
ENGINRG/R&D SVS
ENGINES-INT CMB
FERTILIZERS
FIBER OPTICS
FIN-CONS LOANS
FIN-INVEST BKRS
FIN-INVEST MGMT
FIN-LEASING COS
FIN-MTG&REL SVS
FIN-INVEST FUND
FIN-SVGS & LOAN
FIN-SBIC&COMMRL
FIN-MISC SVCS
FOOD ITEMS-WHLE
FOOD-CANNED
FOOD-CONFECTNRY
FOOD-DAIRY PRDS
FOOD-FLOUR&GRN
FOOD-MEAT PRODS
FOOD-MISC/DIVERS
FOOD-SUGAR&REFG
FUNERAL SVS&REL
FURNITURE
GLASS PRODUCTS
HOTELS & MOTELS
INDL AUTO/RBTCS
INSTRU-CONTROL
INSTRU-SCIENTFC
INS-ACC & HLTH
INS-BROKERS
INS-LIFE
INS-MULTI LINE
INS-PROP&CASLTY
LASERS-SYS/COMP
LEISURE&REC PRD
LEISURE&REC SVS
LINEN SPLY &REL
MACH TLS&RL PRD
MACH-CONST/MNG
MACH-ELEC UTILS
MACH-ELECTRICAL
MACH-FARM
MACH-GENL INDL
MACH-MATL HDLG
MACH-PRINT TRAD
MACH-THRML PROC
MED INSTRUMENTS
MED PRODUCTS
MED-BIOMED/GENE
MED-DRUGS
MED-GENERIC DRG
MED-HMO
109
110
111
112
113
114
115
116
117
118
119
120
121
122
123
124
125
126
127
128
129
130
131
132
133
134
135
136
137
138
139
140
141
142
143
144
145
146
147
148
149
150
151
152
153
154
155
156
157
158
159
160
161
162
MED-HOSPITALS
MED-NURSING HMS
MED-OUTP/HM CRE
MED-WHSL DRG/SN
MED/DENTAL-SUPP
MINING -GOLD
MINING -IRON
MINING -MISC
MINING -NON FERR
MINING -SILVER
METAL PROC&FABR
METAL PRD-DISTR
METAL PRD-FSTRS
MOVIE/TV PROD/DISTR
CON PRD-MISC DISCR
OFFICE AUTO&EQP
OFFICE SPPL&FRM
OIL-US RYLTY TR
OIL FLD MCH&EQP
OIL REFING&MKTG
OIL-C$ EXP&PROD
OIL-C$ INTEGRTD
OIL-FIELD SVCS
OIL-INTL INTGD
OIL-INTL SPCLTY
OIL&GAS-DRILL
OIL-PROD/PIPELN
OIL-US EXP&PROD
OIL-US INTEGRTD
COMP-OPTICL REC
PAINTS&REL PRDS
PAPER &REL PRDS
PAPER-BUS FORMS
PHOTO EQP &SUPP
POLLUTION CNTRL
PREC MTLS/JWLRY
PRINTING-COMMRL
PROTECTION-SFTY
PUBLSHG-BOOKS
PUBLSHG-NEWSPRS
PUBLSHG-PRDCALS
REIT-EQTY TRUST
REIT-MTGE TRUST
REAL ESTATE DEV
REAL ESTATE OPS
RETAIL-APP/SHOE
RETAIL-CATLG SH
RETAIL-CONS ELC
RETAIL-CNV STRS
RETAIL-DISCOUNT
RETAIL-DRUG STR
RETAIL-RESTRNTS
RETAIL-HOME FRN
RETAIL-JEWELRY
163
164
165
166
167
168
169
170
171
172
173
174
175
176
177
178
179
180
181
182
183
184
185
186
187
188
189
190
191
192
193
194
195
196
197
198
199
200
201
202
203
204
205
206
207
208
209
210
211
212
213
214
400
500
RETAIL-MAIL ORD
RETAIL-MJR DEPT
RETAIL-MISC/DIV
RETAIL-RGN DEPT
RETAIL-SUPERMKT
RETAIL-VENDING
RETAIL/WHSL CMP
RUBBER&PLASTICS
RUBBER-TIRES
SCHOOLS
SHOES&REL APPRL
SOAP&CLNG PREPS
STEEL-PIPE&TUBE
STEEL-PRODUCERS
STEEL-SPECIALTY
TELECOMM SVCS
TELECOMM EQUIP
TEXTILE-APPAREL
TEXTILE-HME FRN
TEXTILE-PRDUCTS
TOBACCO
TOOLS-HAND HELD
TOYS/GAME/HOBBY
TRANS-AIR FRGHT
TRANS-AIRLINE
TRANS-EQP&LSNG
TRANS-RAIL
TRANS-SHIP
TRANS-SERVICES
TRANS-TRUCK
UTIL-ELEC PWR
UTIL-GAS DISTR
UTIL-TELEPHONE
UTIL-WATER SPLY
WIRE&CABLE PRDS
COMP-NETWORKS
COMP-MINI
LEISURE&REC/GMG
TELECOMMCTNS-WIRELESS
COMP-STORAGE DEV
COMP-INTEGT SYS
BANKS-MAJOR REGIONAL
BUS SVCS
BUS INFO SVCS
CON PRD-MISC STAPLES
MEDIA CONGLOMERATES
ELEC-MFG MACHINERY
RET/WHLSL AUTO/TRUCK
ELECTRONIC COMMERCE
INTERNET CONTENT
INTERNET SERVICES
INTERNET SOFTWARE
INDICES
UNCLASSIFIED
Doc-To-Help Standard Template
Estimates Report Methodology
How WIN% is calculated
The analyst's WIN% is calculated by dividing the number of Wins by the
number of buy and sell ratings issued for the last five years:
Win % =
Total Number of Wins
Total Number of Recommendations
A "Win" is awarded if (1) a stock for which the analysts issued a buy rating
outperformed the equal weighted industry index during the period that the
stock was rated a buy or, (2) a stock for which the analyst issued a sell rating
under-performed the equal weighted industry index during the period where a
sell recommendation stood. In both cases, the performance of the stock and
the index include appreciation (depreciation) and dividends.
Example: Win% Calculation
Industry
Autos
Analyst
A
Average
B
Average
Stock/Count
Ford
Ford
Ford
DaimlerChrysler
DaimlerChrysler
2
Return/Count
5
3
4
3
11
5
Index
7
2
1
5
4
GM
DaimlerChrysler
Ford
3
8
3
2
3
9
2
4
Win
0
1
1
0
1
3
0
1
0
1
%
60
33
Individual Wins are calculated as follows:
1. Within a given industry, calculate the Holding Period Return for each
stock (HPRs) for which the analyst has issued a buy or sell rating:
For buy ratings:
HPRs =
P2 - P1 + D
P1
For sell ratings:
HPRs =
P1 - P2 - D
P1
where:
P1 = Closing Price on day bay/sell was issued by the analyst.
P2 = Closing Price on day buy/sell was removed by the analyst.*
D = Dividends, if any.
* If the rating is in effect at the end of the measurement period, P2 is the
closing price on the last day of the measurement period.
2. Calculate the Equal Weighted Holding Period Return for the industry
(HPRi) including dividends, assuming a long position for an identical
holding period as that used in the HPRs calculation for each
recommendation.
Doc-To-Help Standard Template
Appendix 65
3. Count a Win each time HPRs is greater the HPRi. Wins are expressed
as a percentage of the total number of recommendations.
Recommendations used in Calculating Win%:
Zacks standardizes recommendations using a 1 to 5 scale where: 1 = Strong
Buy; 2 = Buy; 3 = Hold; 4 = Sell; 5 = Strong Sell. If an analyst issues
separate ratings for the same stock over different investment periods, Zacks
uses the rating for the near term period.
When evaluating the performance of buy recommendations, if a rating is
downgraded from either a 1 (Strong Buy) or a 2 (Buy) to a 3 (Hold), the stock
is "sold" and the performance period for the buy is terminated. Zacks uses
the same convention when evaluating sell recommendations: if a rating is
changed from a 4 (Sell) or 5 (Strong Sell) to a 3 (Hold), the observation
period is closed.
Average Buy Return Calculations:
The average of all un-annualized returns calculated for the holding periods of
any and all of the analyst's buy recommendations during the period. Sell
ratings are ignored when calculating returns since most institutional money
managers are restricted from selling short.
The Return is calculated as follows:
The Sum of the HPRs for Analyst Buy Recommendations
Number of Buy Ratings Issued by the Analyst
Industry Return: The average of the equal weighted industry returns
calculated for each of the holding periods during which a buy rating was is
effect.
Excess Return: An approximation of a "wealth index," Excess Return
reflects the difference between the average return calculated for the analyst's
buy recommendations and the average returns of the equal weighted
industry index for the period during which the recommendations were in
effect. This measure is only calculated on the analyst's buy ratings. In the
case of ties, Excess Return is used as a secondary basis for the ranking.
Excess Return evaluates what an investor's profit could have been, if he or
she had diligently acted upon the analyst's buy recommendations.
66 Appendix
Doc-To-Help Standard Template
Technical Support
Zacks Technical Support is available 7 a.m. to 5 p.m. Central Time, Monday through
Friday (excluding market holidays). You can reach Zacks Technical Support at:
Phone:
800.767.3771, Select option 9
Fax:
312.630.9898
Internet E-mail:
[email protected]
Please provide a detailed description of the problem(s) you encountered, in which
wizard/module, when they occurred, and any error messages you received.
For more information about Zacks Investment Research, visit our Web Site at
http://zrs.zacks.com.
Doc-To-Help Standard Template
Technical Support 67
Glossary of Terms
Active Ticker
A ticker currently displayed in the Tickers pull-down menu.
Annual Analyst
The difference between the actual EPS and the analyst's EPS estimate
averaged over 12 month ends.
Annual Consensus
The difference between consensus estimate and actual EPS averaged over
12-month ends.
Cache
A temporary storage place on the hard drive for recently accessed data.
Chart Definitions
User-defined combinations of price charts and overlays.
Consensus
An average of all analyst estimates or recommendations (or a specific set of
analyst forecasts or recommendations as noted).
Default Browser
A user-preferred browser that is identified in the Windows Operating System
as the one to use for surfing the Net.
Delimited Text File Type
Separated by tab characters, commas, or spaces.
Most Accurate EPS Consensus
The most accurate EPS consensus (displayed in red) is computed by ranking
the analysts historical performance. The bottom third of analysts with the
lowest historical performance are not used. The most accurate EPS
consensus is the average of the top quartile of the analysts making forecasts,
for whom we have history, that did not rank in the bottom third historically.
Most Accurate Recommendations
The ranking criteria for historical ratings accuracy is Win%. A Win is
recorded for each analyst's recommendation that beat the performance of an
equal weighted industry index for all buy and sell ratings. Ties are broken by
measuring how much the average buy recommendation was in excess of the
average industry performance. The final results are expressed in terms of
Strong Buy, Buy, Hold, Sell, Strong Sell.
Overlays
Special fundamental data charts that are added to the standard price and
volume charts. Overlays will show how sensitive a stock is to any factor you
choose.
Doc-To-Help Standard Template
Glossary of Terms 69
Quarterly Analyst
The difference between the actual EPS and the analyst's EPS estimate at
the end of quarter.
Ratio Category
ICA uses fundamental data divided into six ratio categories: EPS Momentum,
Fundamental Ratios, Broker Recommendations, Growth Rates, Valuation,
and Price Momentum.
Ratio Set
A special file created using Ratios Set Editor in ICA. This file contains
custom set of fundamental ratios. By default, ICA uses Value.txv ratio set.
Taskbar
The taskbar is the bar on your desktop that has the Start button on it. Buttons
representing programs currently running on your computer appear on this
bar.
Ticker List
File that contains ticker symbols. Ticker lists are in a tab delimited format with
the extension *.txt. By default, ICA uses Myportf.txt Ticker List.
70 Glossary of Terms
Doc-To-Help Standard Template
H
Index
Historical Peer Analysis Charts 52
How WIN% is calculated 67
I
A
Actual EPS 44
Adding Absolute Aggregate Price Overlays 23
Adding Fundamental Overlays 22
Adding Index Price Overlay 24
Adding or Deleting Chart Gridlines 21
Aggregate Overlays 25
Analyst Rating History Plot 34
Annual EPS Accuracy Report 26, 36
Average Buy Return 33, 68
ICA Ticker Types 5
Implied Return 43
Index Overlays 58
Industry Return 68
Insider 3
Insider Trading Report 56
Internet-Based Reports 3, 10, 55
M
Management Discussion Reports 56
Market Risk 43
Mid Cap 59
B
Balance Sheet 55
Bankruptcy Reports 56
Best Buy Return 33
Beta 44
Broker Recommendations 43, 57
Business Descriptions Reports 56
P
C
Q
Chart Frequency 13
Chart Settings 13, 16
Clearing Temporary Internet Files 10
Company vs. Industry 9, 45, 46, 47
Consensus 30
Custom 31
Error 41
Overlays 58
Copy to Clipboard 8
Creating New Chart Definitions 22, 25
Creating Ratio Sets 47, 53
Custom Peer Group 49–50
Quarterly EPS Accuracy Report 26, 38–39
E
Editing Ratio Sets 48, 54
Estimates 9, 26
Current Fiscal Year 29
Next Fiscal Year 38
Quaterly 40
Zacks Rating 43
Estimates Report Methodology 67
Excess Return 30, 33, 68
Expected Return 43
Exporting ICA Reports 8
Doc-To-Help Standard Template
Peer Analysis 3, 9, 46–52
Peer Analysis Components 50
Peer Analysis Information Table 51–52
Peer Analysis Ratio Sets 51
Price Action 9, 11
R
Rating Performance Report 26, 31
Ratio Set Editor 53
Recommendation Performance 33
Return on Equity Reports 55
Risk Rating 56
S
Selecting Ratio Sets 48, 54
Shareholder Data 44
Small Cap 59, 62
Snapshot 9, 42
T
Ticker List 6, 7
U
Understanding Overlay Options 21
Using Chart Definitions 11, 25
Creating New Chart Definitions 22
Index 71
Zacks Chart Definitions 62
Z
Zacks Peer Group 49
Zacks Rank 28, 43
72 Index
Doc-To-Help Standard Template