1
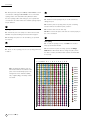
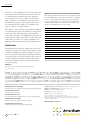
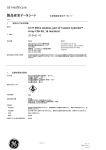
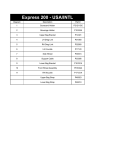
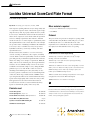
application note
728
microarrays
Lucidea Universal ScoreCard Plate Format
Lucidea Array Spotter
Key words: microarray, gene expression, Lucidea, cDNA
Other materials required
Gene expression profiling with microarrays is being widely used
to compare the expression levels of thousands of genes using a
single microarray slide. To properly evaluate microarray results,
it is necessary to minimize the variations in the measurements so
that accurate comparisons can be made within an experiment
and across multiple experiments. One method to minimize
variations is the use of control samples to quantitatively relate
the experimental data to the control data. The control samples
also provide a means of validating normalization. Normalization
is necessary to factor out differences in dye incorporation,
hybridization efficiency, scanner dye sensitivity, and other
experimental factors.
• Easy-to-Spot™ DNA Human 1.0 (Incyte Genomics)
Lucidea™ Universal ScoreCard™ is a set of 23 microarray
controls consisting of calibration, ratio, negative, and utility
controls. All the controls except the utility controls are artificial
genes that generate pre-determined signal intensities and ratios
that do not change across samples or experiments. While the
utility controls are also artificial genes, their signal intensities
and ratios are user definable. Utility controls can be used to
troubleshoot and estimate sample recovery during the RNA
purification process as well. All the controls are used for
validating and normalizing microarray data. They can also
be used to generate a calibration curve for determining limits
of detection, linear range, and the amount of mRNA in each
spot. Using Lucidea Universal ScoreCard with Lucidea Array
Spotter ensures high quality and accurate microarray results.
This application note describes how Lucidea Universal
ScoreCard can be used in association with Lucidea Array
Spotter to determine the quality of microarray data.
• 50% DMSO
Protocol
The protocol below represents an example for spotting cDNA
on Lucidea Microarray Reflective Slides. The protocol can be
modified by the user to accommodate the needs of the
experiment. It is recommended to use only 384-well barcoded
microplates from Amersham Biosciences for spotting.
1
●
Lucidea Universal ScoreCard target labelling
1.1. Add 2 µl of reference spike mix to the Cy™3 target
labelling of human heart mRNA.
1.2. Add 2 µl of test spike mix to the Cy5 target labelling
of human spleen mRNA.
1.3. Create an additional 1:5 ratio control using Utility 1 control.
Add 1 µl of a 1:5 dilution of Utility 1 spike to the human heart
mRNA labelling reaction. Add 1 µl of Utility 1 spike to the
human spleen mRNA labelling reaction.
1.4. Proceed with direct labelling and purification of the targets
using CyScribe First-Strand cDNA Labelling Kit.
1.5. Quantitate the concentration of the target.
2
●
Lucidea Universal ScoreCard spotting sample preparation
Products used
Lucidea Array Spotter
63-0040-09
Lucidea Spotting Pens, 24-pen set
63-0040-10
Lucidea Universal ScoreCard, 1000 hybridizations
63-0042-86
Lucidea Microarray Reflective Slides
CyScribe™
First-Strand cDNA Labelling Kit
384-well barcoded microplate
an
63-0050-26/Rev.A/2003-02 ● p1
inquire
25-8007-67
25-0199-34
Lucidea Universal ScoreCard spotting samples are lyophilized
in individual tubes to allow users the flexibility to resuspend the
samples in their choice of spotting buffer and customize the
format of the spotting plate pattern.
microarrays
2.1. Resuspend the samples in 600 µl of 50% DMSO to a final
concentration of 20 ng/µl. 50% DMSO is the recommended
spotting solution for Lucidea Microarray Reflective Slides.
For other spotting buffers and slide types, the required final
concentration of Lucidea Universal ScoreCard spotting samples
may be different.
5
●
Spotter setup
5.1. Install the Lucidea Spotting Pens pen set. Be careful not to
damage the pens.
5.2. Load the plates for spotting. Place the plate containing
Lucidea Universal ScoreCard in plate position 1.
3
●
5.3. Load the slides onto the slide tray.
Spotting plate pattern
5.4. Make sure that the plates and slides are seated properly in
the correct orientation.
3.1. Transfer 25 µl of each sample to a well in the barcoded
384-well microplate following the format shown in Figure 1.
6
●
3.2. Centrifuge the plate for 1 min at 2750 × g to spin down
the samples.
Start spotting
4
●
6.1. To start the spotting session, click Start in the Lucidea
Array Spotter Control window.
Spotting parameters
4.1. Create or edit a spotting protocol to the spotting parameters
in Table 1.
P O
6.2. If more than 12 plates are being spotted, the Change
Plates In timer will include when to change the plates, drain
the waste container, and fill the wash solutions and humidifier
if necessary.
N M L
K
J
I
H
G
F
E
D
C B
A
1
2
3
Fig 1. Spotting Plate Pattern setup for
the Lucidea Universal ScoreCard control
plate on the Lucidea Array Spotter. The
arrangement of the calibration (Calib),
ratio, negative (Neg), and utility controls
are shown.
4
5
6
Calib 01
Calib 02
Calib 03
7
Calib 04
8
Calib 05
9
Calib 06
10
11
Calib 07
12
Calib 08
13
Calib 09
14
Ratio 3
15
Ratio 4
16
17
Ratio 7
18
Ratio 8
19
Utility 1
20
Neg 1
21
22
23
24
an
63-0050-26 ● p2
Neg 2
microarrays
Table 1. Spotting parameters for Lucidea Array Spotter. The
spotting parameters are user-definable. For more information
please refer to the Lucidea Array Spotter User’s Guide (1).
Parameters
Total slides:
Total plates:
Spotting mode:
Replicates:
Repeats:
Complete last row:
Use default pitch:
Row pitch:
Column pitch:
Slide thickness:
Barcode enable:
Output file enable:
Humidity control:
Humidity setting:
Rows per block:
Columns per block:
Spots in last row:
cDNA
27
8
Normal
2
1
Yes
No
250 µm
250 µm
0.9–1.1 mm
✔
✔
✔
65% RH
8
16
16
7
●
Spotting complete
7.1. At the end of the spotting run, a message window will
appear stating “The spotting session is complete. Please
remove your sample plates and slides. If you click OK, the
humidifier will be turned off.” Leave the humidifier on by not
pressing OK.
7.2. Allow the slides to remain inside Lucidea Array Spotter for
30–60 min depending on the drying rate of the spotting solution
used. This step allows all the spots on the slides to dry under
the same humidity conditions.
good morphology and good reproducibility as seen when
visually comparing the spot intensities of duplicate spots. The
nine calibration controls span a range from 3 to 30 000 pg/2 µl
of spike. The four ratio controls have a targeted Cy3/Cy5 ratio
of 3:1 and 10:1 and the reverse ratio for both. The utility
control has a targeted Cy3/Cy5 ratio of 1:5.
Fig 2. A section of the microarray image. Cy3-labelled cDNA
heart (shown in green) and Cy5-labelled cDNA spleen (shown
in red) target were mixed and hybridized onto a spotted slide
with a total of 2688 human genes printed in duplicate. Shown
here are two duplicate blocks out of a total of 48 blocks of spots
on the whole slide. Row 1 of each block contains the calibration
(yellow boxed), negative (red boxed), ratio (green boxed), and
utility (blue boxed) controls from Lucidea Universal ScoreCard.
Rows 2 through 7 contain a duplicate set of 112 human genes
from Easy-to-Spot DNA Human 1.0.
The calibration controls can determine the dynamic range of
the slide. The concentrations of the calibration controls used
in this experiment span over four orders of magnitude. The
average signal intensities from the calibration control spots of
the experiment show that this slide has a dynamic range of
approximately 3–3.5 orders of magnitude, as seen in Figure 3.
For higher expressing genes, the DNA on the spot was
hybridized to saturation causing the fluorescence intensity to
plateau. For lower expressing genes, the signal of the spots
was not high enough above background to be quantitated
accurately.
Calibration Curve
7.3. Then press OK and unload the plates and slides and
remove the pen set as instructed by the Lucidea Array Spotter
User’s Guide.
The slides were fixed and hybridized following the slide manufacturer’s protocol. The slides were manually hybridized with
17 pmol of Cy3-labelled human heart and 17 pmol of Cy5labelled human spleen cDNA targets. Slides were imaged using
an GenePix™ 4000B Array Scanner. The slide images were
quantitated using ArrayVision™ 6.0 software.
Results
From Figure 2, the spotting quality of Lucidea Universal
ScoreCard controls and Easy-to-Spot DNA Human 1.0 genes
using Lucidea Array Spotter is shown. The spots all have
an
63-0050-26 ● p3
Average Signal Intensity (rfu)
10 000 000
Cy5
1 000 000
Cy3
100 000
10 000
1000
1
10
100
1000
10 000
100 000
Amount of RNA (pg)
Fig 3. Calibration curve from Lucidea Universal ScoreCard
calibration controls for the microarray slide. The average signal
was calculated for each calibration control. The signal intensities
for Cy3 and Cy5 have been background subtracted. Rfu is an
abbreviation for relative fluorescent unit and is a measure of
fluorescence intensity.
microarrays
The accuracy of the normalization protocol can be determined
from Lucidea Universal ScoreCard controls. This can be done
by comparing the normalized Cy3/Cy5 ratios against the
expected Cy3/Cy5 ratio of the controls. For each CyDye™
label, constant factor normalization was performed on the
quantitated data using the average signal from the spots as
the constant factor. The constant factor is divided into the
signal of each spot to normalize the data.
From Table 2, it can be noted that, in general, the normalization
procedure brings the Cy3/Cy5 ratio much closer to the expected
Cy3/Cy5 ratio than when using the raw signal intensities.
Calib 8 and Calib 9 have a low mRNA spike concentration of
10 and 3 pg/2 µl of spike, respectively. As a result, Calib 8 and
Calib 9 have spot signals close to background which causes
high signal variation and skewing of the normalization ratios.
Table 2. Lucidea Universal ScoreCard ratio analysis (Cy3/Cy5).
Calib stands for calibration. Expected ratios are determined from
the known mRNA spike concentrations. Raw ratios are calculated
from the observed Cy3 and Cy5 signal intensities. Normalized
ratios are calculated from the constant factor normalized Cy3
and Cy5 signal intensities. The ratios listed in the table are the
average of the Cy3/Cy5 ratios for each control.
Ratio Analysis (Cy3/Cy5)
Control (Cy3/Cy5)
Expected
Raw
Normalized
Calib 1
1.00
0.49
0.91
Calib 2
1.00
0.54
1.00
Calib 3
1.00
0.63
1.16
Calib 4
1.00
0.60
1.12
Calib 5
1.00
0.50
0.93
Calib 6
1.00
0.68
1.27
Conclusions
Calib 7
1.00
0.63
1.16
Calib 8
1.00
1.06
1.96
Lucidea Universal ScoreCard is an essential tool for microarray
analysis. Lucidea Universal ScoreCard controls make it possible
to validate normalization and generate calibration curves for
microarray data. Most importantly, having Lucidea Universal
ScoreCard controls on microarray slides allows the comparison
of data from multiple experiments. Together with Lucidea
Array Spotter, microarray data is generated with excellent
accuracy and quality.
Calib 9
1.00
0.88
1.63
Ratio 3
3.00
1.67
3.11
Ratio 4
0.33
0.16
0.30
Ratio 7
10.00
4.90
9.10
Ratio 8
0.10
0.06
0.12
Utility 1
0.20
0.08
0.15
References
1. Lucidea Array Spotter User’s Manual, Amersham Biosciences,
pp. 375–752 (2002).
Asia Pacific Tel: +852 2811 8693 Fax: +852 2811 5251 Australasia Tel: +61 2 9899 0999 Fax: +61 2 9899 7511 Austria Tel: 01 576 0616 22 Fax: 01 576 0616 27 Belgium
Tel: 0800 73 888 Fax: 03 272 1637 Canada Tel: +1 800 463 5800 Fax: +1 800 567 1008 Central, East, and Southeast Europe Tel: +43 1 982 3826
Fax: +43 1 985 8327 Denmark Tel: 45 16 2400 Fax: 45 16 2424 Finland & Baltics Tel: +358 (0)9 512 39 40 Fax: +358 (0)9 512 17 10 France Tel: 01 69 35 67 00
Fax: 01 69 41 96 77 Germany Tel: 0761 4903 291 Fax: 0761 4903 405 Italy Tel: 02 27322 1 Fax: 02 27302 212 Japan Tel: +81 3 5331 9336 Fax: +81 3 5331 9370
Latin America Tel: +55 11 3933 7300 Fax: +55 11 3933 7315 Middle East and Africa Tel: +30 210 96 00 687 Fax: +30 210 96 00 693 Netherlands Tel: 0165 580 410
Fax: 0165 580 401 Norway Tel: 2318 5800 Fax: 2318 6800 Portugal Tel: 21 417 70 35 Fax: 21 417 31 84 Russia & other C.I.S. & N.I.S. Tel: +7095 232 0250, 956 1137
Fax: +7095 230 6377 Southeast Asia Tel: +60 3 8024 2080 Fax: +60 3 8024 2090 Spain Tel: 93 594 49 50 Fax: 93 594 49 55 Sweden Tel: 018 612 1900
Fax: 018 612 1910 Switzerland Tel: 01 802 81 50 Fax: 01 802 81 51 UK Tel: 0800 616928 Fax: 0800 616927 USA Tel: +1 800 526 3593 Fax: +1 877 295 8102
Amersham Biosciences UK Limited
Amersham Place, Little Chalfont, Buckinghamshire, England HP7 9NA
Amersham Biosciences AB
SE-751 84 Uppsala, Sweden
Cy, CyDye, CyScribe, Lucidea, and ScoreCard are trademarks of the Amersham Biosciences Ltd
Amersham and Amersham Biosciences are trademarks of Amersham plc
ArrayVision is a trademark of Imaging Research Inc
Easy-to-Spot is a trademark of Incyte Genomics
GenePix is a trademark of Axon Instruments Inc
Amersham Biosciences Corp.
800 Centennial Avenue, PO Box 1327, Piscataway, NJ 08855 USA
Amersham Biosciences GmbH
Munzinger Strasse 9, D-79111 Freiburg, Germany
Amersham Biosciences (SV) Corp.
928 East Arques Avenue, Sunnyvale CA 94085 USA
an
63-0050-26 ● p4
© Amersham Biosciences Corp. 2003—All rights reserved
All goods and services are sold subject to the terms and conditions of sale of the company
within the Amersham Biosciences group which supplies them. A copy of these terms and
conditions is available on request.
www.amershambiosciences.com