1
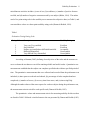
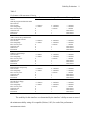
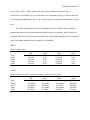
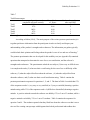
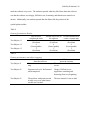
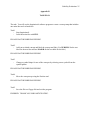
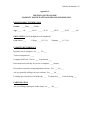
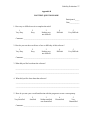
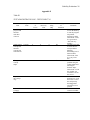
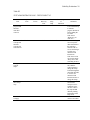
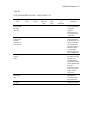
Posted by permission from student. Do not copy or reproduce. Usability Evaluation and Testing for Inspiration® Peggy J. Lau MMIS680 Human Computer Interaction Graduate School of Computer and Information Sciences Nova Southeastern University Usability Evaluation 2 Table of Contents Introduction......................................................................................................................................3 Test Plan Test Goal..............................................................................................................................4 Test Methodology ................................................................................................................4 Test Subjects ........................................................................................................................5 Task Selection......................................................................................................................6 Test Measurements ..............................................................................................................7 Test Lab .............................................................................................................................10 Usability Test Test Description .................................................................................................................10 Pretest Questionnaire Results ............................................................................................13 Test Subject #1 Test Results ..............................................................................................14 Test Subject #2 Test Results ..............................................................................................14 Test Subject #3 Test Results ..............................................................................................16 Testing Data Results ..........................................................................................................17 Posttest Questionnaire Results...........................................................................................19 Recommendations..........................................................................................................................21 Conclusion .....................................................................................................................................21 Appendices Appendix A........................................................................................................................24 Appendix B ........................................................................................................................25 Appendix C ........................................................................................................................26 Appendix D........................................................................................................................27 Appendix E Table E1 .......................................................................................................................28 Table E2 .......................................................................................................................29 Table E3 .......................................................................................................................30 References......................................................................................................................................31 Usability Evaluation 3 Introduction The International Standards Organization (ISO) defines usability in terms of user effectiveness, efficiency, and satisfaction. Effectiveness describes the extent to which a user accomplishes a task, efficiency refers to the resources consumed by the user in proportion to the accuracy and completeness of the task, and satisfaction measures the user’s perception of freedom from discomfort and the positive attitude towards the use of the interface (Jordan, 2001). Usability is a function of this interaction between the interface, user, and tasks to be completed. Designers attempt to achieve a high level of usability by employing an iterative design process using evaluation and testing to develop an interface that both supports and satisfies the user’s requirements. According to Preece, Rogers, & Sharp (2002), Tognazzini (2000) stated the design process that includes testing and design is the single validated methodology that produces reliable and successful design results. This usability testing process involves the systematic collection of data that determines the user’s interaction and response to using the interface to perform tasks under specified circumstances within a controlled environment (Preece et al., 2002). This paper provides a comprehensive account of the usability evaluation and testing performed on the software program, Inspiration®, which has been incorporated into the curriculum for nursing students attending Indiana Wesleyan University. Inspiration® has been used as a visual learning tool to promote critical thinking in the development of concept maps that serve as visual maps of the problems and interventions for patient care. The objective of this evaluation was to assess the usability of this interface based on the usability attributes with the greatest impact on student use and the development of concept maps (Nielsen, 1993). The author describes the planning process, test conduction, data collection and analysis, and the Usability Evaluation 4 interpretation of the testing results. Test Plan Test Goal Usability is a function of the interface attributes that determine if the interface is appropriate, effective, and supports users in their tasks. The goal of this usability test was to establish measures of usability for the software program, Inspiration®, based on the results obtained during the usability evaluation and testing process. Evaluation testing was used to observe the nursing students using the software and quantify their performance and identify difficulties that were encountered (Rubin, 1994). The usability for this interface was determined by the interface’s ability to meet or exceed the minimum usability rating (Nielsen, 1993). Test Methodology The evaluation testing performed on Inspiration® was a summative evaluation for the purpose of assessing the overall quality of the interface. This evaluation examined the finished design of the software to determine if the software met its stated goals of usability and to understand the interaction of the participant and interface by observing the software in use (Rosson & Carroll, 2002). The author, who served as the evaluator, had a significant knowledge base of the software interface through personal use and assisting students in the computer lab. This familiarity with the interface proved essential in understanding the selected tasks and user responses during the testing process (Nielsen, 1993). The usability testing consisted of the performance test that was designed to gather usability data through task analysis, observation, and the thinking-aloud method. According to Dumas and Redish (1994), task analysis involves refining tasks that the subject will perform into subtasks where each task has an objective, starting point, action or set of actions, and a stopping Usability Evaluation 5 point. Task analysis provides a framework for the representation of tasks that can used to study users, the actions and processes they use to achieve each task, and examine the factors or previous experience that shape the approach to task completion (Barnum, 2002). During the evaluation, the test subjects were given a list of steps to perform in order to complete a specific task and quantitative performance measures, such as time and error rates, were recorded. The routine tasks that were performed for this test were selected in an effort to explore potential usability issues with the interface. Observation involved viewing the test subjects during the completion of the test tasks. The observation method is the simplest usability method since it provides a means for usability analysis under natural circumstances (Jordan, 2001). By observing test subjects using the software, the evaluator was able to monitor the subjects in order to analyze their actions and determine the length of time that was spent on the different portions of each task (Preece et al., 2002). The thinking-aloud method was used as a means to collect qualitative data from the test subjects. Using this method, the evaluator asked the subjects to verbalize their thoughts, while they used the interface to perform the test tasks, and recorded their responses. This source of qualitative data provided a means to understanding the interaction between the user and the interface and the problems that were encountered. Although there are disadvantages associated with this method of usability evaluation (Jordan, 2001), the thinkingaloud method is one of the most commonly used usability testing methods (Ramey & Boren, 2001). Test Subjects The selection of the test subjects impacts usability testing results when the skill level of the test subjects does not closely represent the skill of an actual user (Nielsen, 1993). An actual user for the software program at the university was an undergraduate nursing student who used Usability Evaluation 6 the program on a limited basis to develop concept maps for course assignments. According to Dumas and Redish (1993), the user profile should attempt to encapsulate characteristics that are shared by all of the users and those that might make a difference in the usability test results. In an attempt to capture these characteristics, the user profile for a test subject for this usability test consisted of a student who was (a) female, (b) between the ages of 19 and 30, (c) proficient in general computer skills, (d) regular user of a computer, (e) of average mental and physical skills, and (f) novice user of the Inspiration software program. As has been shown (Nielsen & Molich, 1990), usability evaluations that consisted of three participants detected approximately 50% of the major usability problems that existed for an interface. Due to the modest nature of this evaluation, the author decided that limiting the testing to three participants would provide sufficient testing results. A group of potential nursing student participants was screened and the author selected the three students who best fit the user profile for testing. Task Selection According to Barnum (2002), the selection of tasks is commonly determined by criteria such as (a) first impressions, (b) first tasks, (c) frequently performed tasks, (d) critical tasks, (e) new tasks, and (f) problem areas. The testing time limit and number of participants are also considerations for the selection of tasks. Ideally, the choice of tasks to test should be based on the operationalized goals and the needs of the users (Barnum, 2002). The selection of testing tasks for this usability testing was based on the elements of the interface that had the greatest impact on student use, which included frequently performed tasks, critical tasks, and problem areas. The tasks that were selected used the tools in the Inspiration® software program to complete the following tasks in this natural order on an individual basis: Usability Evaluation 7 Start the program and label the main idea with text: The participant used either the icon located on the desktop or the menu item located on the Program menu to start the software. The program displayed the main idea concept in the middle of the diagram view screen. To label the main idea with text, the participant double clicked on the object and typed the desired text label. Add a new related concept and label the concept and link with text: The participant used the Create tool to add a new related concept by clicking on the appropriate direction arrow. After the concept was created, the participant double clicked on the concept object and link object and typed the desired text label. Change a concept shape using the shapes located in the symbol palette: The participant selected the concept object by clicking one time on the object. Alternate shapes for the concept object were located in the symbol palette, which was located on the left side of the screen. The student reviewed the potential alternate shapes by clicking on the forward or backward arrows located at the top of the symbol palette. The concept shape was changed by double clicking the selected new shape from the symbol palette. Reposition the concept map using the Position tool: The participant clicked on the Reposition tool and dragged the concept map to another location on the diagram view. Save the file to floppy disk and exit the program: The participant saved the file to a floppy disk by either clicking on the floppy disk icon located on the tool bar or the Save menu item on the File menu. Test Measurements The qualitative or subjective measurements that were collected and recorded from the author’s observation of the subject’s facial and verbal comments, interviews after the test, and Usability Evaluation 8 miscellaneous activities include: (a) ease of use, (b) usefulness, (c) number of positive features recalled, and (d) number of negative comments made by test subject (Rubin, 1994). The author used a five-point rating scale in the usability test to measure the subjective data (see Table 1) and converted these values to a three-point usability rating scale (Dumas & Redish, 1999). Table 1 Evaluation Testing Rating Scale Rating Value 1 2 3 4 5 Description Usability Rating Very easy/Very satisfied Easy/Satisfied Neither easy/satisfied nor difficult/dissatisfied Difficult/Dissatisfied Very difficult/Very dissatisfied Excellent Excellent Acceptable Unacceptable Unacceptable According to Barnum (2002), defining clear objectives of the tasks and the measures to use to evaluate the test data are crucial for attaining reliable and useful results. Quantitative test measurements establish that the subject can complete specified tasks within a specified period of time. The quantitative measurements that were collected and recorded from the performance test included: (a) time spent on each task and subtask, (b) percentage of tasks completed and not completed, (c) number of errors, (d) recovery time from errors, and (e) time using Help. Although the author observed the same aspects for each test subject during the performance test, the measurement criteria varied for each specific task (Dumas & Redish, 1993). The quantitative values and measurement criteria for measuring usability for this test that are listed in Table 2 followed a similar format to the one presented by Dumas and Redish (1993). Usability Evaluation 9 Table 2 Performance Measurement Criteria Excellent Task 1 Start the program and label the main idea with text Time for task Time using Help Error recovery time Selection error Other errors Frustration Task 2 Add a related concept and label the concept and link with text Time for task Time using Help Error recovery time Selection error Other errors Frustration Task 3 Change a concept shape Time for task Time using Help Error recovery time Selection error Other errors Frustration Task 4 Reposition the concept map Time for task Time using Help Error recovery time Selection error Other errors Frustration Task 5 Save the file to floppy Time for task Time using Help Error recovery time Selection error Other errors Frustration Acceptable Unacceptable < 2 minutes < 1 minute 0 0 0 0 2 - 3 minutes 1 - 2 minutes < 1 minute 1 1 1 > 3 minutes > 2 minutes > 1 minute More than 1 More than 1 More than 1 < 2 minutes < 1 minute 0 0 0 0 2 - 4 minutes 1 - 2 minutes < 1 minute 1 1 1 > 4 minutes > 2 minutes > 1 minute More than 1 More than 1 More than 1 < 1 minute < 1 minute 0 0 0 0 2 - 3 minutes 1 - 2 minutes < 1 minute 1 1 1 > 3 minutes > 2 minutes > 1 minute More than 1 More than 1 More than 1 < 2 minutes < 1 minute 0 0 0 0 2 - 3 minutes 1 - 2 minutes < 1 minute 1 1 1 > 3 minutes > 2 minutes > 1 minute More than 1 More than 1 More than 1 < 1 minutes < 1 minute 0 0 0 0 1 - 2 minutes 1 - 2 minutes < 1 minute 1 1 1 > 2 minutes > 2 minutes > 1 minute More than 1 More than 1 More than 1 The usability for this interface was determined by the interface’s ability to meet or exceed the minimum usability rating of Acceptable (Nielsen, 1993) for each of the performance measurement criteria. Usability Evaluation 10 Test Lab The field testing approach to test labs, “works best for summative evaluation to determine how well the product works in the real world for which it has been created” (Barnum, 2002, p. 145). Since the nursing students at Indiana Wesleyan University use the Inspiration® software program in the nursing computer lab to develop concept maps, this lab was selected as the location for the field test. The test lab where the participants worked was equipped with twenty computer workstations that had a configuration that included: Windows 98 platform, Pentium II processor, Intel MMX technology, 633MHz processor, 127 MB RAM, 8l83 GB hard drive capacity, floppy drive, 48X CD-ROM, IOMEGA Zip 100 storage capacity, 17” SVGA display monitor, networked HP 4050N printer, 10 Base-T T1 connection, LAN network, keyboard, and mouse. The lab was spacious and measured 35 feet in length and 24 feet in width. The room was well lit with overhead, fluorescent lighting and properly ventilated. The heating and air conditioning temperature control was set at 72º. The lab was clean, carpeted and freshly vacuumed. While the lab was comfortable and functional for as many as twenty students, only one workstation was utilized during the testing process. The workstation measured 42 inches in length, 30 inches in width, and 29 inches in height and was equipped with a padded, adjustable height chair on wheels. At the scheduled testing times, the door to the lab was locked and a closed sign was posted on the door to block the entry of other students. Usability Test Test Description According to Barnum (2002), it is very important for the evaluator to be pleasant, impartial, and consistent in all of the statements and actions. In order to provide a framework for Usability Evaluation 11 consistency, an evaluator checklist can be used to create a list of tasks and reminders in addition to establishing an overview of the orientation for the test subjects. The evaluator checklist (Barnum, 2002) in Table 3 was used to ensure that the usability tests were reliable and uniform for each of the three tests. Table 3 Evaluator Checklist WELCOME _____ Greet participant. _____ Close and lock the lab door. _____ Seat her at the testing workstation. _____ Make sure she is comfortable _____ Ask her if she has any questions or is she ready to begin. INSTRUCTIONS _____ Explain the purpose of the usability test and remind her that she is not being tested. _____ Hand out the informed consent form and ask her to read and sign. _____ Remind her that the test is confidential and that her name will not be used in the report. _____ Hand out the pretest questionnaire and ask her to complete the form. _____ Explain the test procedure. _____ Encourage her to think aloud as she is working through the task list. TESTING _____ Reset stopwatch. _____ Hand out the task list and the software user manual and ask her to begin. _____ Offer encouragement for thinking aloud. _____ Record completion times, comments, errors, and test subject actions. TEST COMPLETION _____ Hand out the posttest questionnaire and ask her to complete the form. _____ Encourage the student to provide any additional feedback regarding the software program. _____ Thank her for participating in the study. The usability tests were conducted on May 20, 2002 at 8:00 a.m., 11:00 a.m., and 1:00 p.m. with each test subject tested on an individual basis. The testing times were sufficiently spaced apart to provide the evaluator the time to reset the computer system, make additional Usability Evaluation 12 comments and notations, and organize the paper work for that session. A twenty-five minute time limit was imposed for each usability test due to the time constraints of the evaluator and the computer lab and to maintain control of the usability test. In the event a test subject was unable to complete any of the five tasks after five minutes, the subject would be asked to proceed to the next task on the list. For each of the three usability tests, the evaluator cordially greeted the student as she entered the lab and escorted her to the workstation where the usability test was performed. The evaluator had a good rapport with each of the test subjects since she had previously worked with each of the students for several semesters in the nursing computer lab. After making sure that the subject was comfortable and answered any questions, the evaluator explained the purpose of the usability test and reminded the participant that the software was being tested, not the student. The subject was asked to read and sign the informed consent form (see Appendix A) and to complete the pretest questionnaire (see Appendix C). The paperwork was collected and the evaluator described the testing procedure to the subject. The test subject was instructed that she would be completing a series of tasks, would be asked to stop after she completed each task, and would be prompted when to continue. The subject was encouraged by the evaluator to think aloud as she worked with the software program. The evaluator reset the stopwatch that was used to time each of the tasks and handed the subject the task list (see Appendix B) and software user manual. The subject was advised to access the Help Menu in the software or the user manual if she encountered any problems or questioned how to perform a specific task. The subject was reminded and encouraged to think aloud as she performed each task was directed the subject to begin. The evaluator quietly observed the test subject and did not speak or offer suggestions but recorded completion times for each task, comments, errors, and test subject actions (see Usability Evaluation 13 Appendix E). Once the task list was completed, the evaluator asked the subject to complete the posttest questionnaire (see Appendix D) and encouraged her to provide any additional feedback and suggestions regarding the software program. The test subject was thanked by the evaluator for her helpfulness and willingness to participate in the usability study. Pretest Questionnaire Results A brief pretest questionnaire was developed to gain basic demographic and background information about the test subjects and to determine their general computer skill level. The results of the pretest questionnaire are presented in Table 4. Table 4 Pretest Questionnaire Results Gender Test Subject #1 Female Test Subject #2 Female Test Subject #3 Female Age 20-29 20-29 20-29 Education 3 years of college 3 years of college 4 years of college Regular computer user Yes Yes Yes Years of computer use 5 4 8 Skill level Experienced Novice Experienced Hours of use per day 3 1 2 Previous Inspiration® experience No No No Willing to try new software Yes Yes Yes Learning style Learn by doing Read then do Learn by doing Willing to participate Yes Yes Yes Usability Evaluation 14 Test Subject #1 Test Results This test subject described herself as a female, third year college student who was a regular computer user for the past five years, possessed experienced skills, and had no previous experience using the Inspiration® software. The subject was willing to try new software and typically learned to use new software “by doing” through trial and error use (see Table 4). The subject arrived at the lab promptly and appeared to be very excited to participate in the study and stated, “Great, let’s get started.” When instructed to begin, she used the program icon located on the Windows desktop to start the program and did not have a problem entering the text label for the main idea and stated, “That was easy enough.” She looked at the various icons on the toolbar and located the Create tool and correctly used this tool to create the new concept. She also encountered no difficulty determining how to add text labels to the concept and link and stated, “This is so easy. I like this.” Again, she did not have a problem using the symbol palette to select an alternate shape but did not like the location of the window on the left side of the screen. She stated, “I wish this window was somewhere else on the screen.” To reposition the map, she did not use the Position tool but used a previously learned windows method of using the mouse to draw a box around the objects then dragging them to another location on the diagram view. The subject used the Save icon on the toolbar to save the concept map. The subject did not make any errors, use the user manual or the Help menu, and did not become frustrated and appeared to enjoy using the program during the test. The subject successfully completed all five tasks. Table E1 of Appendix E contains the results of the test administrator’s log of the testing process for this test subject. Test Subject #2 Test Results This test subject described herself as a female, third year college student who was a Usability Evaluation 15 regular computer user for the past four years, possessed novice skills, and had no previous experience using the Inspiration® software. The subject was willing to try new software and typically learned to use new software “by reading then doing” such as reading support materials then trying to use the software’s features and tools (see Table 4). When the subject arrived at the lab, she appeared nervous and hesitated at the door. She kept playing with her hair as she stood at the lab entrance and asked, “Where do you want me?” The test administrator attempted to put the subject at ease and made small talk as she accompanied her to the workstation. After the subject became visibly settled and more at ease, she was asked to begin. She used the program icon on the desktop to start the program and hesitated before adding the text label. As the subject tried to add a related concept, she deleted the label in the main idea but clicked the Undo icon to reverse the changes. The subject was unable to create a new concept on her own and used the user manual to find instructions. She became frustrated as she looked through the user manual since she was not able to readily locate the instructions. She sighed several times and stated, “This can’t be that hard.” and “Why can’t I find something in here?” The test administrator noticed that she paged past the instructions for this task that were located in the first section in the user manual. To change a concept shape, the subject did not realize that she could use the symbol palette and proceeded to search the menu to find a way to change the shape. Eventually, she decided to use the user manual to find instructions how to change the shape. The subject became frustrated again and kept frowning and sighing as she tried to figure out how to reposition the concept map. Initially she selected only one concept to move and could not determine how to move the map. She had difficulty finding information as she searched the Help menu for instructions. The subject used the Save icon on the toolbar to save the concept map. The subject made two errors, used the user manual Usability Evaluation 16 and the Help menu, and became frustrated on several occasions during the test. Overall, the subject did not appear to enjoy using the program and seemed relieved to complete the task list. The subject successfully completed all five tasks. Table E2 of Appendix E contains the results of the test administrator’s log of the testing process for this test subject. Test Subject #3 Test Results This test subject described herself as a female, fourth year college student who was a regular computer user for the past eight years, possessed experienced skills, and had no previous experience using the Inspiration® software. The subject was willing to try new software and typically learned to use new software “by doing” through trial and error use (see Table 4). The subject arrived at the lab promptly and appeared excited to participate in the study and stated, “Hi, this should be fun.” When instructed to begin, she used the program icon on the desktop to start the program and did not have a problem adding a text label to the main idea and stated, “I like this.” The subject started on the second task and added a new concept but quickly showed signs of frustration after she accidentally double clicked the mouse on the desktop in the diagram view and created a third concept. She used the delete button to delete the extra object. The subject did not use the Create tool to create the requested object, which automatically draws a link between the concepts. She used the Help menu to find instructions that would describe how to add the link. After she located the information, she did not encounter difficulties using the Link tool or labeling the objects. The subject looked around on the desktop and eventually noticed the symbol palette and realized she could use it to change the object shape. She appeared to like this tool and stated, “Wow, look at all of these shapes. This is really neat.” When the subject began the task to reposition the concept map, she again looked around on the desktop and found the Position tool, which she successfully used to reposition the map. The subject used the Usability Evaluation 17 Save icon on the toolbar to save the concept map. The subject made one error, used the Help menu, and become frustrated on only one occasion. Overall, she appeared to enjoy using the program during the test. The subject successfully completed all five tasks. Table E3 of Appendix E contains the results of the test administrator’s log of the testing process for this test subject. Testing Data Results The objective of this evaluation was to assess the usability of the Inspiration® interface based on the usability attributes with the greatest impact on student use in the development of concept maps. The attributes described in the ISO definition of usability, which include effectiveness, efficiency, and satisfaction, best define the attributes with the greatest impact. The metrics for measuring usability for each of these attributes include (a) effectiveness - the percentage of participants who completed each task correctly, mean number of errors for each task, and the number of test subjects who used Help, (b) efficiency – time to complete a task, time spent on errors, number of errors, and the time using Help, and (c) satisfaction – rating for satisfaction with ease of use to complete the tasks, rating for overall ease of use, rating for overall satisfaction with the software, and number of times the user expressed frustration (Rhodes, 2000). Data values were collected for each of the testing metrics. The mean testing values for the usability metrics that tested efficiency were computed (see Table 5). The mean testing values for each of the five tasks in Table 5 were converted to one of the three performance measurement criteria categories of Excellent, Acceptable, or Unacceptable using the performance criteria established in Table2. These performance values are contained in Table 6 and revealed that the software rated an Acceptable or Excellent usability performance measurement rating for each of Usability Evaluation 18 the five tasks. Table 7, which contains the value for the usability metrics that tested effectiveness, revealed that (1) 60% of the tasks were completed correctly, (2) 60% of the tasks were completed without errors, and (3) 40% of the tasks were completed without the use of Help tools. The goal of this usability test was to establish measures of usability for the software program that met or exceeded the minimum usability rating of Acceptable. Based on the test results for efficiency and effectiveness, all of the tasks’ performance ratings met or exceeded the study’s acceptable minimum level of usability of Acceptable. Table 5 Mean Testing Values Error Recovery Time 0.00 min 0.18 min 0.00 min 0.06 min 0.00 min Time Using Help 0.00 0.65 0.73 0.70 0.00 Mean Testing Values Converted to Performance Measurement Criteria Completion Number of Error Recovery Time Errors Time Task 1 Excellent Excellent Excellent Task 2 Acceptable Acceptable Acceptable Task 3 Acceptable Excellent Excellent Task 4 Excellent Acceptable Acceptable Task 5 Excellent Excellent Excellent Time Using Help Excellent Excellent Excellent Excellent Excellent Task 1 Task 2 Task 3 Task 4 Task 5 Completion Time 0.80 min 2.40 min 1.19 min 1.26 min 0.18 min Number of Errors 0.00 0.66 0.00 0.33 0.00 Table 6 Usability Evaluation 19 Table 7 Task Measurements Percentage of participants who completed each task correctly Task 1 100% Task 2 67% Task 3 100% Task 4 67% Task 5 100% Posttest Questionnaire Results Mean Number of Errors 0.00 0.66 0.00 0.33 0.00 Number of test subjects who used Help 0 2 1 1 0 According to Rubin (1994), “The main purpose of the written posttest questionnaire(s) is to gather preference information from the participants in order to clarify and deepen your understanding of the product’s strengths and weaknesses. The information you gather typically would include their opinions and feelings about the product’s ease of use and ease of learning.” The posttest questionnaire that was developed for this usability test (see Appendix D) contained questions that attempted to determine the ease of use, user satisfaction, and the software’s strengths and weaknesses. The questionnaire asked the test subject (1) how easy or difficult was it to complete the tasks, (2) what was their overall rating for the ease of use or difficulty of the software, (3) what the subject liked best about the software, (4) what the subject liked least about the software, and (5) what was their overall satisfaction rating. Table 8 contains the posttest questionnaire responses for questions 1, 2, and 5. The data in Table 8 revealed that 67% of the responses rated a 1 (very easy or very satisfied) or 2 (easy or satisfied) denoting a positive attitude rating while 33% of the responses rated a 4 (difficult or dissatisfied) denoting a negative attitude. A positive attitude towards the software was held by 67% or 2 out of 3 students, while a negative attitude was held by 33% or 1 out of 3 students. Table 9 contains the responses for question 3 and 4. The students reported what they liked best about the software was that it was a nice tool for creating concept maps with diagrams that looked professional and toolbars that Usability Evaluation 20 made the software easy to use. The students reported what they liked least about the software was that the software was choppy, difficult to use, frustrating, and that the user manual was unclear. Additionally, one student reported that she did not like the position of the symbol palette toolbar. Table 8 Posttest Questionnaire Results Ease of use to complete the tasks Test Subject # 1 2 (Excellent) Test Subject # 2 4 (Unacceptable) Test Subject # 3 2 (Excellent) Table 9 Overall ease of use of the software 2 (Excellent) 4 (Unacceptable) 1 (Excellent) Posttest questionnaire test subject responses Like Best about the software Test Subject #1 It is a nice tool to create a concept map. Overall satisfaction to create a concept map 1 (Excellent) 4 (Unacceptable) 1 (Excellent) Like Least about the software The toolbar on the side of the screen. Test Subject #2 Diagrams look nice. Professional when completed. Choppy. Difficult to use. Appearance confusing and frustrating from very beginning. Test Subject #3 The tool bars with pictures made it really easy to see what button was the one I needed. The user manual is clear as mud. Usability Evaluation 21 Recommendations The recommendations to enhance usability based on the posttest questionnaire responses and comments of the three participants included (a) locate the symbol pallet in a different position on the desktop area for easier access, (b) improve the readability of the user manual, (c) decrease the number of tools on the desktop to make the appearance less confusing, (d) toolbar should include only the main tools needed to create a concept map, (e) modify the Link tool so that it is easier to use, and (f) develop a wizard mechanism that could assist the novice user in adding a new concept. Conclusion The usability test is the most effective method for evaluating the usability of a software program since it allows the evaluator to observe the way the application is used, identify problems that arise or questions that are asked, distinguish the features that provide user satisfaction, and objectively measure user performance. The valuable information that is collected can then be used to create software that is easier to use and tailored to users’ needs (Web & Software Usability, 2002). The usability tests that were conducted with the three representative users of the interface did provide an effective method of usability evaluation for the Inspiration® program. The data that was collected during the three usability tests provided an objective means to measure the users’ performance and determine the usability of the software interface. The majority of the participants did not encounter any difficulty performing each of the tasks. The participant who did encounter difficulty during the usability test was the participant with the least amount of computer experience, possessed a lower skill level than the other participants, used a computer for the least amount of time each day, and appeared nervous at the Usability Evaluation 22 start of the test. The participant’s learning style of reading manuals and supporting materials then using the software also might explain the difficulty and frustration she encountered during the test. Even though this student became frustrated during the usability test, she offered positive comments in addition to the negative comments. The participant stated that she would like to use the program in the future to create concept maps but would first like to read the manual and then have time to become acquainted with the software. Usability testing was performed on the software program, Inspiration®, to determine if the interface was effective, efficient, and created satisfaction for the users. The quantitative results for the usability test revealed that all of the tasks’ performance ratings met or exceeded the study’s acceptable minimum level of usability of Acceptable. These quantitative results suggested that the design of the interface was effective to the degree that it supported the needs it was intended to meet and efficient in resource consumption by the user in proportion to the accuracy and completeness of the tasks (Jordan, 2001). The qualitative results revealed that the majority of the tasks’ ratings met or exceeded the study’s acceptable minimum level of usability of Acceptable. These qualitative results suggested that the design of the interface created user satisfaction in the user’s perception of freedom and a positive attitude towards the use of the interface (Jordan, 2001). Both the quantitative and qualitative findings led to the conclusion that the Inspiration® program had Acceptable to Excellent usability for all of the areas that were tested. This usability test reflected the findings of professional organizations that have judged the Inspiration® software program as the premier tool for visually developing ideas and organizing thinking (Awards, 2002). Usability Evaluation 23 APPENDICES Usability Evaluation 24 Appendix A INFORMED CONSENT FORM I agree to participate in the usability evaluation titled Usability Evaluation for Inspiration®, which is being conducted by Peggy Lau, under the supervision of Laurie P. Dringus, Ph.D., Graduate School of Computer and Information Sciences, Nova Southeastern University. I understand that this participation is entirely voluntary; I can withdraw my consent at any time without penalty and have the results of the participation, to the extent that it can be identified as mine, returned to me, removed from the evaluation records, or destroyed. The evaluation has been explained to me as follows: The purpose of the testing is to evaluate the usability of various aspects of the Inspiration® software program. The evaluator wishes to determine the ease of use of the software interface and the user’s perceptions. Participants will work at a computer where Inspiration® has been installed and be given tasks related to accessing the software. While the participant tries these tasks, she will directly be observed so the evaluator can review the participant’s interactions with the instruction and their comments during the interaction. The participant’s identity will be kept confidential in any reports generated from this testing. Any comments or expressions mad during the usability test may be used for the purpose of evaluating the software and showing the results of the research. ___________________________ Signature of Participant ___________________________ Date Usability Evaluation 25 Appendix B TASK PLAN The task: You will use the Inspiration software program to create a concept map that includes one main idea and a related idea. Task 1 Start Inspiration. Label the main idea with IWU. PLEASE WAIT BEFORE PROCEEDING. Task 2 Add a new related concept and label the concept and link. (Use NURSING for the text label for the new idea and use MAJOR for the text label for the link.) PLEASE WAIT BEFORE PROCEEDING. Task 3 Change a symbol shape for one of the concepts by selecting a new symbol from the symbol palette. PLEASE WAIT BEFORE PROCEEDING. Task 4 Move the concept map using the Position tool. PLEASE WAIT BEFORE PROCEEDING. Task 5 Save the file to a floppy disk and exit the program. FINISHED. THANK YOU FOR PARTICIPATING. Usability Evaluation 26 Appendix C PRETEST QUESTIONNAIRE USABILITY PARTICIPANT BACKGROUND INFORMATION DEMOGRAPHIC INFORMATION Gender: _____Male _____Female Age: _____ <20 _____ 20-29 _____ 30-39 _____40-49 _____50-59 _____ 60+ EDUCATION (Check the highest level completed): High School ____ College ____ (1 2 3 4) Graduate ____ (1 2 3 4) COMPUTER EXPERIENCE Regularly used a computer: Yes ____ No ____ Years of computer use: ____ Computer skill level: Novice ____ Experienced ____ How many hours each day do you use a computer: ____ (hours) Do you have experience using Inspiration software: Yes ____ No ____ Are you generally willing to try new software: Yes ____ No ____ Learning style (check one): Read then do____ Try then read ____ Learn by doing ____ PARTICIPATION Are you willing to participate in this study: Yes ____ No ____ Usability Evaluation 27 Appendix D POSTTEST QUESTIONNAIRE Participant #_____ Date___________ 1. How easy or difficult was it to complete the tasks? 1 Very Easy 2 Easy 3 Neither easy nor difficult 4 Difficult 5 Very Difficult Comment: ______________________________________________________________ 2. How do you rate the overall ease of use or difficulty of this software? 1 Very Easy 2 Easy 3 Neither easy nor difficult 4 Difficult 5 Very Difficult Comment: ______________________________________________________________ 3. What did you like best about the software? ________________________________________________________________________ ________________________________________________________________________ 4. What did you like least about the software? ________________________________________________________________________ ________________________________________________________________________ 5. How do you rate your overall satisfaction with the program to create a concept map: 1 Very Satisfied 2 Satisfied 3 Neither satisfied nor dissatisfied 4 Dissatisfied 5 Very Dissatisfied Comment: ______________________________________________________________ Usability Evaluation 28 Appendix E Table E1 TEST ADMINISTRATOR LOG - TEST SUBJECT #1 Completion Time Number of Errors Start the program and label the main idea with text 0.84 min 0 Error Recovery Time 0 Add a related concept and label the concept and link with text 1.42 min 0 0 0 No Change a concept shape 0.34 min 0 0 0 No Reposition the concept map 0.37 min 0 0 0 No Save the file to floppy 0.17 min 0 0 0 No Task Time using Help 0 Showed signs of frustration No Observer Comments Used the program icon on the desktop to start the program. No problem entering text label. Talk Aloud: “Great, let’s get started.” “That was easy enough.” Used the Create tool to create the new concept. Had no difficulty determining how to add text labels. Talk Aloud: “This is so easy. I like this.” Did not have a problem using the symbol palette and selecting an alternate shape. Talk Aloud: “I wish this window was somewhere else on the screen.” Did not use the Position tool. Used the mouse to select the concept map and dragged the selection to a new position. Used the Save icon on the icon toolbar. Usability Evaluation 29 Table E2 TEST ADMINISTRATOR LOG - TEST SUBJECT #2 Completion Time Number of Errors 0 Error Recovery Time 0 0 Showed signs of frustration No Start the program and label the main idea with text 1.03 min Add a related concept and label the concept and link with text 3.75 min 1 0.45 min 1.50 min Yes Change a concept shape 2.42 min 0 0 2.19 min No Reposition the concept map 2.58 min 1 0.20 min 2.10 min Yes Save the file to floppy 0.20 min 0 0 0 No Task Time using Help Observer Comments Used the program icon on the desktop to start the program. Hesitated before adding the text label. Talk Aloud: “Where do you want me?” Instead of adding a new concept she deleted the label in the main idea. Clicked Undo to reverse the changes. Used the user manual to find instructions. Talk Aloud: “This can’t be that hard.” “Why can’t I find something in here?” Did not realize that she could the symbol palette to change the shape. Looked through the menu then decided to use the user manual to find instructions how to change the shape. Initially only selected one concept to move. Could not figure out how to move the map and had difficulty finding information in the Help menu. Used the Save icon on the icon toolbar Usability Evaluation 30 Table E3 TEST ADMINISTRATOR LOG - TEST SUBJECT #3 Completion Time Number of Errors 0 Error Recovery Time 0 0 Showed signs of frustration No Start the program and label the main idea 0.54 min Add a related concept and label the concept and link with text 2.03 min 1 0.10 0.45 min Yes Change a concept shape 0.82 min 0 0 0 No Reposition the concept map 0.84 min 0 0 0 No Save the file to floppy 0.18 min 0 0 0 No Task Time using Help Observer Comments Used the program icon on the desktop to start the program. Talk Aloud: “Hi, this should be fun.” “I like this.” Accidentally double clicked the mouse in the diagram view and created a third concept but used the delete button to delete the object. Used the Help menu to figure out how to add the link. Searched through the menus to find a menu item for changing shapes. Located the symbol palette and changed the shape. Talk Aloud: “Wow, look at all of these shapes. This is really neat.” Looked on the desktop and eventually found the Position tool. Used the Save icon on the icon toolbar Usability Evaluation 31 References Awards. (2002). Retrieved April 24, 2002 from http://www.inspiration.com Barnum, C. (2002). Usability testing and research. New York: Longman. Dumas, J., & Redish, J. (1993). A practical guide to usability testing. Exeter, England: Intellect. Jordan, P. (2001). An introduction to usability. Philadelphia: Taylor & Francis. Nielsen, J. (1993). Usability engineering. San Diego: Morgan Kaufman. Nielsen, J., & Molich, R. (1990). Heuristic evaluation of user interfaces. Proceedings of ACM CHI’92, pp. 373-380. Preece, J., Rogers, Y., & Sharp, H. (2002). Interaction design: Beyond human-computer interaction. New York: John Wiley & Sons, Inc. Ramey, J., & Boren, T. (2001). Keep them thinking aloud: Two ways to conduct a verbal protocol and why it matters. Retrieved April 30, 2001 from http://www.upassoc.org/conf2001/downloads/aloud.pdf Rhodes, John. (2000). Usability Metrics. Retrieved May 5, 2002 from http://www.webword.com/moving/metrics.html Rossen, M., & Carroll, J. (2002). Usability engineering: Scenario-based development of humancomputer interaction. San Francisco: Morgan Kaufmann Publishers. Rubin, J. (1994). Handbook of usability testing: How to plan, design, and conduct effective tests. New York: John Wiley & Sons, Inc. Tognazzini, B. (2000). If they don’t test, don’t hire them. Retrieved May 1, 2002 from http://www.asktog.com/columns/037TestOrElse.html Web & Software Usability: Usability Test. Retrieved April 30, 2002 from http://www.usabilis.com/gb/method/test.htm