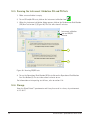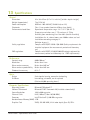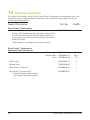
1
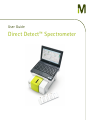
User Guide Direct Detect™ Spectrometer Notice The information in this document is subject to change without notice and should not be construed as a commitment by EMD Millipore Corporation (“Millipore”) or an affiliate. Neither EMD Millipore Corporation nor any of its affiliates assumes responsibility for any errors that may appear in this document. The M logo and Direct Detect are trademarks of Merck KGaA, Darmstadt, Germany. Millipore and Amicon are registered trademarks of Merck KGaA. Intel and Pentium are registered trademarks of Intel Corp. Windows is a registered trademark of Microsoft Corp. in the United States and/or other countries. Dell is a registered trademark of Dell Inc. Torx is a registered trademark of Acument Intellectual Properties LLC. Tween is a registered trademark of ICI Americas Inc. © 2012 EMD Millipore Corporation, Billerica, MA, USA. All rights reserved. 00000833, Rev. B, 03/12 Contents 1 Introduction................................................................................................................ 1 2 Components Supplied................................................................................................ 2 3 Symbols Used in this User Guide............................................................................... 3 4 Product Labeling......................................................................................................... 3 5 Safety Precautions..................................................................................................... 4 6 Installation.................................................................................................................. 4 6.1 Packaging.........................................................................................................................................................4 6.2 Site Requirements..........................................................................................................................................5 6.3 Installation Configuration...........................................................................................................................6 6.4 Unpacking and Setting up the Computer................................................................................................6 6.5 Unpacking and Setting Up the Direct Detect™ Spectrometer...........................................................6 7 Direct Detect™ Spectrometer Parts and Functions.................................................. 8 7.1 General Technical Features..........................................................................................................................8 7.2 Direct Detect™ Computer and Software............................................................................................... 10 8 General Guidelines................................................................................................... 11 8.1 Buffer components..................................................................................................................................... 11 8.2 Materials Required but Not Supplied.................................................................................................... 11 9 Direct Detect™ Assay-free Card and Sample Preparation..................................... 12 9.1 Direct Detect™ Assay-free Card ............................................................................................................ 12 9.2 Sample Preparation.................................................................................................................................... 13 10 How to Use the Direct Detect™ Spectrometer........................................................ 14 10.1 Accessing Direct Detect™ Software....................................................................................................... 14 10.2 Loading and Installing the Card.............................................................................................................. 15 10.3 Measurement............................................................................................................................................... 16 10.4 Removing the Card..................................................................................................................................... 18 11 Troubleshooting........................................................................................................ 19 11.1 General Information................................................................................................................................... 19 11.2 Problems Indicated by Hardware Diagnostics Icon........................................................................... 20 11.3 Problems Indicated by Instrument Status Light (top of instrument)............................................. 21 11.4 Problems Indicated by Instrument Validation Icon........................................................................... 22 Contents, continued 12 Maintenance............................................................................................................. 23 12.1 Replacing the IR Source............................................................................................................................ 23 12.2 Replacing the Desiccant............................................................................................................................ 26 12.3 Cleaning......................................................................................................................................................... 28 12.4 Description of Instrument Validation Tests.......................................................................................... 29 12.5 Running the Instrument Validation OQ and PQ Tests....................................................................... 32 12.6 Storage........................................................................................................................................................... 32 13 Specifications........................................................................................................... 33 14 Ordering Information............................................................................................... 34 15 Technical Assistance................................................................................................. 35 16 EC Representative..................................................................................................... 35 17 Standard Warranty................................................................................................... 35 1 Introduction The Direct Detect™ infrared (IR)-based quantification system is an innovative combination of softwarecontrolled instrumentation and EMD Millipore Corporation’s advanced membrane technology, optimized for the detection and quantification of proteins. Biomolecules are applied directly to a card-based hydrophilic polytetrafluoroethylene (PTFE) membrane that is transparent in most of the infrared spectral region. The Direct Detect™ system measures amide bonds in protein chains, accurately quantifying an intrinsic component of every protein without relying on amino acid composition, dye binding properties, or redox potential. Protein concentrations from 0.2 to 5 mg/mL can accurately be determined from a minimal sample volume (2 µL) without bio- or immuno-chemical staining. Sample analysis takes only minutes and in most cases can be performed directly from the buffered or native solution. The system is intended for research use only and is not for use in diagnostic procedures. It has been validated with proteins and cell lysates representative of those currently in use in research laboratories. Direct Detect™ Spectrometer User Guide 1 2 Components Supplied The Direct Detect™ system includes the following components: 1D 1F 1A 1C 1G 1E 1B 1H Figure 1. Components supplied 1A Direct Detect™ spectrometer 1B Instrument power adapter with 4 power cord/plug configurations (EU, UK, US, Japan) 1C Data cable (crossover cable for 10Base-T Ethernet standard, with RJ45 connectors) 1D Dell® Netbook computer with Direct Detect™ software installed 1E Computer power adapter with world-wide plug adapter 1F Netbook stand 1G Direct Detect™ Assay-free cards (package of 50) 1H Direct Detect™ spotting tray Desiccant pack replacement (1, not shown) Torx® TX20 screw driver for replacing the IR source (not shown) Direct Detect™ Spectrometer Quick Start Card (not shown) 2 Direct Detect™ Spectrometer User Guide 3 Symbols Used in this User Guide The following symbols are used throughout this user guide and/or on product labels, and the user shall abide by indicated requirements: Symbol Y Class I Laser Product Definition Warning alerts you to actions that may cause personal injury or pose a physical threat. Class I Laser product, complies with 21 CFR Chapter 1, Subchapter J i Read the documentation h f M Catalogue number Serial number Manufacturer CE conformity marking. Reference Declaration of Conformity for specific directives. Do not discard with common solid waste at end of life. Segregate with other waste electrical and electronic equipment (WEEE) and send to an appropriate facility for recycling. For information on recycling EMD Millipore Corporation electrical and electronic products in the European Union, please visit www.millipore.com/weee. Hot Surface 4 Product Labeling Direct Detect Spectrometer TM EMD Millipore Corporation 290 Concord Rd., Billerica, MA 01821 Input: 24V DC 2.0A (800) 645-5476 SN 00000001 12/2011 TM EMD Millipore Corporation 290 Concord Rd., Billerica, MA 01821 Input: 24V DC 2.0A (800) 645-5476 REF DDHW00010-00 SN 00000001 Manufactured: REF DDHW00010-00 Manufactured: Direct Detect Spectrometer 12/2011 Made in Germany For Research Use Only. Not for use in diagnostic procedures. Class 1 Laser Product, Complies with 21 CFR Chapter 1 Subchapter J. Made in Germany For Research Use Only. Not for use in diagnostic procedures. Class 1 Laser Product, Complies with 21 CFR Chapter 1 Subchapter J. Figure 2. Product label appears on both the back and the bottom of the instrument Direct Detect™ Spectrometer User Guide 3 5 Safety Precautions Review and understand the safety precautions below before installing and operating the Direct Detect™ spectrometer. ! WARNING ●● To avoid danger of electric shock, do not install the instrument in an area with a high humidity level. Refer to Site Requirements in section 6. ●● Do not touch the ethernet cable or universal power adapter plugs with wet hands. ●● To avoid potential shock hazard, choose the correct plug configuration and make sure that the power adapter is plugged securely into a properly grounded AC power outlet. Make sure that the connection between the cable and the instrument is secure. ●● Always ensure that the power supply input voltage matches the voltage available in your location. ●● Use only the power supplies that were supplied by EMD Millipore Corporation for use with the Direct Detect™ system. Use of other power supplies may damage the system. ●● Minimize power draw from other instruments on the same power circuit. ●● Do not use with flammable or explosive liquids. 6 Installation 6.1 Packaging Inspect the packaging for damage upon receipt. If there are any signs of damage, contact the responsible shipping company. ! WARNING: Do not put a spectrometer showing signs of damage into operation as this may result in severe personal injuries and/or property damage. Keep the original shipping boxes in case you need to return the spectrometer for servicing or repair. NOTE: Instruments will not be accepted for repair if not in original packaging. EMD Millipore Corporation will provide shipping boxes for a charge if original packaging has been discarded. 4 Direct Detect™ Spectrometer User Guide 6.2 Site Requirements The user must provide an installation site that meets the following requirements: Space requirement Environment Stable and horizontal base which is able to bear the weight of at least 8 kilograms (kg) A clearance of at least 25 centimeters (cm) [10 inches (in.)] at the spectrometer rear side Temperature range: 18–35 °C Humidity (non-condensing): less than 80% (relative humidity) Temperature variations: less than 1 °C/hour Do not install devices such as large electric motors, heaters, welding equipment, radio transmitting equipment, units emitting pulsed NMRs, or high-powered lasers in close proximity to the Direct Detect™ spectrometer. These devices can cause a spectrometer malfunction. Vibration Inductive electrical interference Power supply Make sure that these types of devices are not connected to the same electrical circuit as the Direct Detect™ spectrometer. Do not locate the Direct Detect™ spectrometer near vibration sources (centrifuges, vortexes, ventilation hoods, air conditioners, etc.), or in rooms with intense floor vibrations. Do not install the Direct Detect™ spectrometer near any sources of potential inductive electrical interference (e.g., pumps, switching motors, microwave ovens, etc.), sources of high energy pulses, or sources that might cause magnetic or radio frequency interference. Voltage range: 100 VAC to 240 VAC Frequency range: 50 Hz to 60 Hz Protection class: I The power supply unit automatically adapts to most power sources commonly used. Make sure that the power supply is easily accessible at all times. Connect the Direct Detect™ spectrometer only to a grounded power outlet. Take precautions to ensure uninterrupted power supply if there is the potential for power supply issues (e.g., brownouts, power surges, frequent thunderstorms, etc.) Direct Detect™ Spectrometer User Guide 5 6.3 Installation Configuration The Direct Detect™ spectrometer is configured to operate as a stand-alone unit connected to the supplied Netbook computer (PC) using the factory-set standard IP address (10.10.0.1). 6.4 Unpacking and Setting up the Computer Unpack the Netbook computer, power adapter, and world-wide plug adapter from the shipping box. Choose the plug adapter with the correct configuration for local requirements and attach it to the plug. Plug the low voltage (round) end of the power adapter into the power port of the PC, but do not plug the computer into a power outlet at this time. 6.5 Unpacking and Setting Up the Direct Detect™ Spectrometer Remove all components from shipping boxes and lay out on work surface. 6.5.1 Positioning and Connecting Components (Figure 3) 1. Place instrument on bench and put Netbook stand on top of instrument. The front tab of the stand fits into the slot on top of the instrument (5B in Figure 5). 2. Place Netbook computer on stand. 3B Direct Detect Spectrometer TM EMD Millipore Corporation 290 Concord Rd., Billerica, MA 01821 Input: 24V DC 2.0A (800) 645-5476 REF DDHW00010-00 SN 00000001 Manufactured: 12/2011 Made in Germany For Research Use Only. Not for use in diagnostic procedures. Class 1 Laser Product, Complies with 21 CFR Chapter 1 Subchapter J. 3C 3A Figure 3. Rear side - Connection ports 3. Turn the instrument/computer assembly so that the rear of the instrument is facing you (Figure 3). 4. Connect one end of the ethernet cable to the instrument ETH/LAN port (3A) and the other end to the PC network/LAN port (3B). 6 Direct Detect™ Spectrometer User Guide 6.5 Unpacking and Setting Up the Direct Detect™ Spectrometer, cont. 5. Connect the low voltage (round) end of the instrument power adapter to the power port of the instrument (3C). Secure the connector with the clamp. 6. Choose the instrument power cord with the correct plug configuration for local requirements and plug it into the power adapter. 7. Plug both the PC and instrument power cords into a grounded power outlet. ! WARNING: To avoid personal injuries and/or property damage caused by electrical power, connect the spectrometer and computer to a grounded power outlet. Make sure that this power outlet complies with IEC (International Electrotechnical Commission) regulations. 8. Turn on the PC. NOTE: The instrument is powered through the computer and does not have a separate ON/OFF switch. It should be left on and powered up at all times. 6.5.2 Initializing the Direct Detect™ Spectrometer 1. Refer to the Direct Detect™ Software User Guide for instructions on starting up the software and logging in (section 1.1). 2. During initialization, the laser, IR source, and detector are switched on. The IR source warms up, the scanner moves forward and backward several times, and tones once. This phase takes several minutes, and hardware diagnostics icon (Figure 4) is yellow. After the initialization has been completed successfully, the hardware diagnostics icon turns to green, but the instrument validation icon will be yellow. This indicates that the PQ test has expired and needs to be run. Refer to section 12.5 for instructions on running the PQ test. Instrument validation icon Hardware diagnostics icon Figure 4. Hardware diagnostics icon NOTE: If the status indicator on either the instrument or the software is red or remains yellow after initialization is complete and the PQ test has been run, refer to section 11, Troubleshooting. Direct Detect™ Spectrometer User Guide 7 7 Direct Detect™ Spectrometer Parts and Functions 7.1 General Technical Features 7.1.1 The Instrument The Direct Detect™ spectrometer is a small compact FTIR spectrometer designed for measuring IR absorbance. 5A 5B 5E 5C 5D 5F 5G Figure 5. Direct Detect™ spectrometer Definition 5A 5B 5C 5D 5E 5F 5G Instrument module (with integrated electronics and optics) Slot for Netbook stand tab Direct Detect™ automated card holder Card insertion alignment arrow Status light Sample drying indicator light Card insertion light 7.1.2 The Direct Detect™ Automated Card Holder The automated card holder (5C) accepts only the 4-sample Direct Detect™ Assay-free cards. The top of the card holder module contains two LED lights located at the bottom right corner (5F and 5G as viewed from the top). The bottom LED light (5G) is green whenever an Assay-free card is inserted properly. The top LED light (5F) is yellow whenever the drying system heater and fan are active. Periodically (default setting is 15 minutes) the software will initiate a reference measurement which must be performed without a sample card inserted in the card holder. If a card is found in the card holder the software will prompt you to remove it. 8 Direct Detect™ Spectrometer User Guide 7.1 Direct Detect™ Spectrometer General Technical Features, continued 7.1.3 Connecting Ports and LEDs The connecting ports (e.g. power, Ethernet) and the system diagnostic LEDs are on the back of the instrument (Figure 6). 6D 6A 6B 6C 6E 6F 6G 6H 6I 6J 6K Figure 6. Direct Detect™ Spectrometer rear side - Connecting ports and LEDs Type Definition 6A USB port Not available to user. For instrument service use only. 6B ETH/LAN port The ETH/LAN port connects the spectrometer to the Netbook computer, using the supplied data cable (cross over, 10Base-T with RJ45 ports). 6C TKD LED The green TKD LED indicates that the interferometer mirror is within the data acquisition range. When data acquisition is occurring, the light is bright green. The abbreviation TKD means Take Data. 6D ACC LED The yellow ACC LED indicates that the network is accessing the optics. During transition of measuring data the LED is light yellow. The abbreviation ACC means Access. 6E DIR/ERR LED In normal operation mode the DIR/ERR LED flashes pale red and indicates scanner movement. If the LED lights permanently bright red, there is an interferometer problem, e.g., missing laser signal. When this LED is permanently red no data acquisition is possible. The abbreviation DIR means Direction and ERR means Error. 6F External accessory port Not available to user. For instrument service use only. 6G TAP port Not available to user. For instrument service use only. Direct Detect™ Spectrometer User Guide 9 7.1 Direct Detect™ Spectrometer General Technical Features, continued Type Definition 6H CFG switch CFG is a four-fold DIP switch: #1 ON and #2 OFF: DHCP mode - use last DHCP address #1 OFF and #2 ON: use ON-IP address 10.10.0.1 #3: stay in boot loader, do not load the application program #4: reserved The abbreviation CFG means Configuration. 6I SBY/RES button Pressing this button for approximately 2 seconds, activates/ deactivates the stand-by mode. Pressing this button for more than 6 seconds resets the spectrometer to the original state. The abbreviation SBY means Standby and RES means Reset. Do not use unless instructed to do so by service personnel. 6J POWER port This port connects the spectrometer to the power supply via the supplied power adapter and power cord. The POWER port is for extra low-voltage connectors. Use only power cords/supplies that have been supplied by EMD Millipore Corporation. 6K Kensington lock slot The lock slot is an anti-theft lock for mobile hardware. Lock and cable are not supplied. 7.2 Direct Detect™ Computer and Software The Direct Detect™ spectrometer is designed to operate with the Direct Detect™ software that is pre-installed on the Netbook computer. For computer specifications, refer to section 13. Direct Detect™ software may be updated periodically. For information on the most up-todate software, go to www.millipore.com/directdetect. Register your instrument in order to receive notification about relevant software upgrades. WARNING: Do not install third-party software (screen savers, etc.) as this may impact the performance of the Direct Detect™ system. 10 Direct Detect™ Spectrometer User Guide 8 General Guidelines The Direct Detect™ spectrometer is recommended for use with protein samples ranging from 0.2 to 5 mg/mL. Although the instrument can measure protein concentrations from 0.1 mg/mL to around 30 mg/mL, the most accurate results are achieved within the recommended concentration range. Samples to be analyzed are introduced to the system using the Assay-free card which contains a novel IR transparent membrane. The recommended sample volume is 2 μL per spot position. 8.1 Buffer components The Direct Detect™ system is compatible with most commonly used buffers, detergents, and reducing agents, however, use of buffers which contain amides or amine functional groups may affect quantification. Examples of buffers and respective concentrations which interfere with the spectral region used for protein quantification are listed in the table below. Buffer Interfering Concentration (mM) Bicarbonate (divalent) ≥ 25 EDTA ≥ 10 Guanidine hydrochloride ≥ 8 Guanidine isothyocyanate ≥ 4 HEPES buffer (pH 7.5) ≥ 25 Sodium bicarbonate ≥ 50 Sodium hydroxide ≥ 100 Tris ≥ 50 Urea ≥ 2 Buffers containing more than 5% glycerol, SDS, and/or Tween® 20 surfactant should be avoided due to the excessive time required to achieve dryness. Although the instrument comes with pre-loaded calibration files, fresh calibration with the buffer used for protein preparation is recommended. 8.2 Materials Required but Not Supplied ●● Protein standards (Bovine Serum Albumin - National Institute of Standards & Technology SRM 927d (optional)) ●● Protein sample(s) ●● Fixed-volume precision pipette capable of precisely dispensing 2 µL and pipette tips NOTE: To minimize pipetting error, we recommend the use of a precision, fixed-volume pipette capable of dispensing 2 µL, for applying samples to the Assay-free card. Adjustable pipettes are not recommended. Direct Detect™ Spectrometer User Guide 11 8.2 Materials Required but Not Supplied, continued ●● Water, PBS, or other buffer (see section 8.1 for a list of buffers that interfere with protein quantification) ●● Printer (optional) 9 Direct Detect™ Assay-free Card and Sample Preparation 9.1 Direct Detect™ Assay-free Card All concentration measurements are performed using the Assay-free card (Figure 7). Figure 7. Direct Detect™ Assay-free card The card contains four hydrophilic polytetrafluoroethylene (PTFE) membrane positions sized for easy sample application and surrounded by a hydrophobic ring to retain analyzed sample within the IR beam. A 2 μL sample volume is recommended in order to assure proper sample application, drying, and measurement. By design, the positions on the card are numbered from 1 to 4, starting from the bottom. Position 1, by software default, is reserved for the “blank” measurement. The “blank” is the buffer used to resuspend the protein, but contains no protein. One or more of the remaining card positions are used for the protein samples. The Assay-free card can be inserted into the system and analyzed immediately after preparation. The Direct Detect™ spectrometer has a built-in drying system that will automatically dry the sample to the point where it will give an accurate reading. The first sample position will typically take the longest period of time to dry, with subsequent positions taking less time. Including drying time, the total measurement time for a card loaded with 2 μL samples does not exceed 5 minutes. The Direct Detect™ Assay-free card is intended for a one-time protein spotting. However, already prepared cards can be stored and read again. 12 Direct Detect™ Spectrometer User Guide 9.2 Sample Preparation In general, analysis of samples within the concentration range of 0.2–5 mg/mL can be performed directly from the buffered solution. Buffers containing more than 5% glycerol, SDS, and/or Tween® 20 surfactant should be avoided due to the excessive time required to achieve dryness. For analysis of samples with protein content above 5 mg/mL single step dilution is recommended. Concentration determination of samples below 0.2 mg/mL can be achieved after a simple spin concentration step using a centrifugal filter (e.g., Amicon® Ultra-0.5 device). Use of centrifugal filters is also recommended for buffer exchange when the original buffer contains high concentration of components with amide- or amine-containing functional groups (refer to section 8). Figure 8 is an example of a diafiltration protocol that concentrates the sample and reduces the Tris buffer concentration. Add 450 µL of 1X PBS or exchange buffer Spin to concentrate 500 µL of 0.1 mg/mL protein in 50 mM Tris 50 µL of 1 mg/mL protein in 50 mM Tris 50 mM Tris 500 µL of 0.1 mg/mL protein in PBS with 9.5 mM Tris Spin to concentrate 50 µL of 1 mg/mL protein in PBS with 9.5 mM Tris PBS with 9.5 mM Tris Figure 8. Buffer exchange and concentration using an Amicon® Ultra-0.5 device Direct Detect™ Spectrometer User Guide 13 10 How to Use the Direct Detect™ Spectrometer The instrument is controlled and operated by Direct Detect™ software installed on the Netbook computer. Samples are introduced to the instrument module by inserting the Direct Detect™ Assay-free card into the card holder (Figure 11). An alignment notch on one corner of the card ensures correct card insertion into the card holder. 10.1 Accessing Direct Detect™ Software The Direct Detect™ software can be accessed through the icon on the Notebook desktop (Figure 9). Figure 9. Direct Detect™ software desktop icon Each instrument user can be assigned a unique name and optional password (Figure 10). The measurements performed by each user are stored and recalled based upon the user name. Figure 10. Direct Detect™ login screen For detailed instructions on starting up the software, refer to section 1.1 of the Direct Detect™ Software User Guide. NOTE: A seven minute warm-up cycle is required after initial power-up and software activation. The software will wait for seven minutes before allowing a sample measurement to begin. When preparing to read samples, we recommend that you power up the instrument and start the software prior to preparing the sample cards. 14 Direct Detect™ Spectrometer User Guide 10.2 Loading and Installing the Card 1. Place the Assay-free card(s) on the spotting tray or other clean surface. Select an appropriate buffer blank, preferably the same solution in which the protein has been prepared. If that buffer is not fully characterized, select the closest buffer possible. Pipette 2 μL of the buffer solution to the default blank position on the card (position 1). 2. Pipette 2 μL of sample to sample positions 2 through 4 as needed. Unused positions can be loaded and read at a later time as long as the buffer blank is appropriate for them. Card positions can be labeled if desired. NOTE: The card can be allowed to dry at ambient conditions, however, the Direct Detect™ spectrometer has a built-in drying system that can automatically dry the sample to the point where it will give an accurate reading. 3. Insert the card vertically into the slot in the top of the card holder module with the card facing left and the alignment notch in the corner of the card oriented towards the center of the instrument. Figure 11. Inserting sample card The arrow on the bottom right side of the card should be aligned with the arrow on the Direct Detect™ card holder module (5D in Figure 5). Gently release the card and the instrument will accept it for analysis. When the card is inserted properly the instrument will respond by jogging the card holder up and down briefly. The bottom green LED on Direct Detect™ card holder module will light and the system will produce a brief tone confirming correct placement of the Assay-free card. NOTE: The software will not allow sample measurement if the card is not inserted properly. Direct Detect™ Spectrometer User Guide 15 10.3 Measurement For detailed instructions on setting up a sample measurement, refer to section 2.2 of the Direct Detect™ Software User Guide. 10.3.1 General Measurement Procedure 1. Complete the sample measurement setup (Figure 12). Check the “Dry sample card” box to allow the instrument to dry the sample. Figure 12. Sample information NOTE: The Direct Detect™ system comes with three preloaded calibration methods. These pre-existing methods may be used for all future measurements, however, we recommend preparation of fresh calibration method upon instrument installation (refer to section 4.2 in the Direct Detect™ Software User Guide). 2. Click on the Measure Card button (Figure 13). The sample measurement takes about a minute and the measurement progress is shown in the lower status bar. Figure 13. Measure sample 16 Direct Detect™ Spectrometer User Guide 10.3 Measurement, continued The result from each measured sample position is displayed in the “Last Sample Results” tab (Figure 14) of the main Direct Detect™ screen. Figure 14. Last sample results screen 3. For reporting options, refer to sections 2.4–2.6 of the Direct Detect™ Software User Guide. NOTE: Periodically the software will initiate a reference measurement which must be performed without a sample card inserted in the card holder. If a card is found in the card holder the software will prompt you to remove it. 10.3.2 Calibration The Calibration Method Wizard (in the “Options” menu) is used to create or modify calibration method files that will be used to perform the analysis of the Assay-free cards. To create a calibration method you will need to have previously collected spectra from a series of known protein concentrations. To compile these files select “Calibration mode (no analysis)” from the “Options” menu and follow the instructions for collecting calibration spectra in section 4.2 of the Direct Detect™ Software User Guide. Direct Detect™ Spectrometer User Guide 17 10.3 Measurement, continued Section 4.2 of the Direct Detect™ Software User Guide details how to use the Calibration Method wizard to create or modify a calibration method file (Figure 15). Figure 15. Calibration Method start page 10.4 Removing the Card After all 4 positions on the card have been read, the instrument will sound a tone. The card will rise to the initial insertion position and can be removed. CAUTION: Do not remove card during the reading. To stop a reading in progress, click on the Abort button (Figure 16). Figure 16. Abort button When a measurement has been aborted, the progress bar will display “Measurement Aborted”. After a short period of time, the instrument will return to “Measure Card” status. 18 Direct Detect™ Spectrometer User Guide 11 Troubleshooting 11.1 General Information The status of the Direct Detect™ spectrometer is indicated by both the instrument status light (located on the top right side of the instrument under the Netbook tray (Figure 5)) and the hardware diagnostics icon (located in the upper right corner of the Direct Detect™ Software user interface (Figure 17)). The status light and hardware diagnostics icon colors are typically the same at any given time, and indicate the following: Green Yellow Red Instrument is in proper operating condition (flashing green on the instrument indicates stand-by mode) Instrument is initializing or indicating a warning (e.g., IR source has not yet reached its operating temperature, the validity period of the instrument has expired, the air humidity inside the spectrometer is too high) Instrument has malfunctioned, or has a defective component, or an OQ/PQ test has expired or failed Instrument validation icon and OQ/PQ initiator Hardware diagnostics icon Figure 17. Direct Detect™ Software user interface Direct Detect™ Spectrometer User Guide 19 11.1 General Information, continued Click on the hardware diagnostics icon and the hardware diagnostics dialog opens (Figure 18). Figure 18. Hardware diagnostics dialog - Instrument Status More information on hardware diagnostics is available in section 5.1 of the Direct Detect™ Software User Guide. If an issue cannot be resolved with the help of this diagnostics section and/or the following troubleshooting tables, refer to section 15 for information on how to contact Technical Service. 11.2 Problems Indicated by Hardware Diagnostics Icon Symptom Cause Corrective Action Hardware diagnostics icon is yellow Spectrometer is still in the initialization phase. IR source has not yet reached its operating temperature. Wait until spectrometer initialization is completed (several minutes). The warm-up takes about 7 minutes. As soon as the IR source has reached its operating temperature the hardware diagnostics icon will automatically turn green. Wait until the warm-up is completed. To confirm IR source issue, click on the hardware diagnostics icon (Figure 17) to open the hardware diagnostics dialog (Figure 18). If IR source is indicated, refer to section 12.1 for instructions on how to replace it. Wait 30 minutes to 2 hours for desiccant to remove the humidity. If after 2 hours the icon is still yellow, refer to section 12.2, Replacing the Desiccant. IR source nearing end of operational lifetime Excessive humidity inside instrument 20 Direct Detect™ Spectrometer User Guide 11.2 Problems Indicated by Hardware Diagnostics Icon, continued Symptom Cause Corrective Action Hardware diagnostics icon is red Instrument test has failed. To determine which instrument component is causing the test failure, click on the hardware diagnostics icon (Figure 17) to open the hardware diagnostics dialog (Figure 18). If the laser, interferometer, electronics, automation, or detector is defective, contact Technical Service. If the IR source is defective, refer to section 12.1 for instructions on how to replace it. To find out which component is defective, click on the hardware diagnostics icon (Figure 17) to open the hardware diagnostics dialog (Figure 18). If the laser, interferometer, electronics, automation, or detector is defective, contact Technical Service. If the IR source is defective, refer to section 12.1 for instructions on how to replace it. Defective spectrometer component 11.3 Problems Indicated by Instrument Status Light (top of instrument) Symptom Cause Corrective Action Spectrometer status light does not light Spectrometer is not connected properly to the power supply. No voltage is applied Short circuit in the adapter of power cable. Spectrometer status light is yellow Spectrometer is still in the initialization phase. IR source has not yet reached its operating temperature. Spectrometer status light is red Instrument test has failed. Check the power cord connection at the power outlet and the power port on the back of the spectrometer (Figure 3). Confirm proper voltage is at the power outlet. A short circuit is accompanied by a “ticking” sound in the power adapter. Unplug the power cord immediately and contact Technical Service. Wait until spectrometer initialization is completed (several minutes). The warm-up takes about 7 minutes. As soon as the IR source has reached its operating temperature the status light will automatically turn green. Wait until the warm-up is completed. To determine which instrument component is causing the test failure, click on the hardware diagnostics icon (Figure 17) to open the hardware diagnostics dialog (Figure 18). If the laser, interferometer, electronics, automation, or detector is defective, contact Technical Service. If the IR source is defective, refer to section 12.1 for instructions on how to replace it. To find out which component is defective, click on the hardware diagnostics icon (Figure 17) to open the hardware diagnostics dialog (Figure 18). If the laser, interferometer, electronics, automation, or detector is defective, contact Technical Service. If the IR source is defective, refer to section 12.1 for instructions on how to replace it. Defective spectrometer component Direct Detect™ Spectrometer User Guide 21 11.4 Problems Indicated by Instrument Validation Icon Instrument validation problems are indicated by the Instrument Validation Icon (Figure 17). Symptom Cause Corrective Action Instrument validation icon is yellow An instrument validation test has expired. To find out which instrument validation test has expired, click on the instrument validation icon to open the instrument validation dialog. Refer to section 5.2 of the Direct Detect™ Software User Guide for details on instrument validation. Instrument validation icon is red An instrument validation test has failed. To find out which instrument validation test has failed, click on the instrument validation icon to open the instrument validation dialog. Refer to section 5.2 of the Direct Detect™ Software User Guide for details on instrument validation. 22 Direct Detect™ Spectrometer User Guide 12 Maintenance The Direct Detect™ spectrometer is a low-maintenance instrument and the operator can replace components with a limited service life. Replacing the IR source and desiccant are described in this section. ! WARNING Perform only the maintenance procedures described in this manual and observe the relevant safety precautions. Failure to do so may cause property damage or personal injury. Maintenance or repair procedures not described in this manual should be performed only by an EMD Millipore Corporation service engineer. Refer to the Technical Assistance section for information on contacting Tech Service. 12.1 Replacing the IR Source 12.1.1 IR Source Status Indicator The Direct Detect™ spectrometer is equipped with a highly-efficient, low-power, air-cooled infrared source with an average life span of 44,000 hours. As the end of this life span is approached, the hardware diagnostics icon turns yellow. When you click on the hardware diagnostics icon (Figure 17), the hardware diagnostics dialog appears and displays the message “End of lifetime is nearly reached” (Figure 18). Samples can still be measured, but performance and reliability may be compromised and the IR source (cat. no. DDSP00010-LA) should be replaced as soon as possible. If the source is defective, the hardware diagnostics icon turns red. When you click on this icon, the hardware diagnostics dialog appears and displays the message “No source is connected”. Samples can no longer be measured, and the IR source must be replaced. 12.1.2 Replacing the IR Source WARNING: During spectrometer operation the light source becomes very hot. To avoid burns, wait until the light source has cooled down before replacing it. 1. Unplug the instrument power plug. 2. On the back of the instrument, loosen the 4 cover plate Torx® screws with the Torx® TX20 screw driver supplied (Figure 19). Direct Detect™ Spectrometer User Guide 23 12.1 Replacing the IR Source, continued Torx® screws Figure 19. Removing the cover plate 3. Take off the cover plate. IR source IR source Torx® screws Source plug Alignment groove Figure 20. Removing the IR source 4. Loosen the two mounting screws on the IR source (Figure 20) with the Torx® screw driver. 5. Disconnect the green source plug (Figure 20). 6. Pull the source out from the spectrometer housing. 24 Direct Detect™ Spectrometer User Guide 12.1 Replacing the IR Source, cont. Alignment groove Alignment pin Figure 21. IR source removed from instrument 7. Insert the new IR source into the spectrometer housing. Make sure that the alignment pin fits into the alignment groove (Figure 21). 8. Secure the source by fastening the two Torx® screws (Figure 22) . 9. Plug the green source plug into the SRC female connector. Figure 22. Replacing IR source Torx® screws 10.Attach the cover plate and fasten the 4 Torx® screws (Figure 19). Plug the power plug to the power outlet again. Direct Detect™ Spectrometer User Guide 25 12.1 Replacing the IR Source, cont. After replacing the IR source, perform the Performance Qualification and Operational Qualification instrument tests as follows: 11.Click on the instrument validation button . 12.When the instrument validation dialog appears, click on the Performance Qualification Run Test button (1) (Figure 23). The test takes about 5 minutes. 1 2 Figure 23. Instrument validation dialog 13.After the test has finished, run the Operational Qualification test by clicking on the Operational Qualification Run Test Button (2). 14.If the instrument passes the test, the hardware diagnostics icon turns green. If the instrument fails, refer to section 5.1 in the Direct Detect™ Software User Guide. 12.2 Replacing the Desiccant Excessive humidity inside the spectrometer may cause H2O bands in the spectrum. To reduce H2O bands to a minimum, the air inside the Direct Detect™ instrument module is convectively dried with a desiccant enclosed in a small, removable, multichambered pack. If the desiccant is saturated and can no longer absorb humidity, it must be replaced. Both the hardware diagnostics icon (Figure 23) and instrument status light (on top of the instrument, 5E in Figure 5) will turn yellow. When you click on the hardware diagnostics icon (Figure 24), the hardware diagnostics dialog appears and displays the message 26 Direct Detect™ Spectrometer User Guide 12.2 Replacing the Desiccant, continued “Instrument internal humidity out of range” (Figure 24). Hardware diagnostics icon Figure 24. Hardware Diagnostics interferometer warning Measuring is still possible if the status light is yellow, but the desiccant should be replaced as soon as possible. Replace the desiccant as follows: 1. Unplug the power plug. 2. The desiccant is accessible from the rear side of the spectrometer (Figure 25). 3. Remove the cover plate from the rear side by loosening the 4 Torx® screws (Figure 19) with the Torx® screw driver supplied. 4. Take off the cover plate. Direct Detect™ Spectrometer User Guide 27 12.2 Replacing the Desiccant, continued Desiccant pack Figure 25. Replacing the desiccant 5. Pull out the used desiccant pack. A pair of tweezers may be helpful. 6. Remove the external packaging from the replacement desiccant pack. 7. Insert the desiccant pack properly into the spectrometer as shown in Figure 25. ! CAUTION: Do not cut or tear the pack into single pieces or ingest the desiccant. 8. Attach the cover plate and fasten the 4 Torx® screws again (Figure 19). 9. Plug the power plug into the power outlet again. After the new desiccant removes the moisture from the chamber (approximately 30 minutes), the instrument status light and hardware diagnostics icon will turn back to green. 12.3 Cleaning The outer spectrometer surface can be cleaned with a damp or dry cloth. Do not use detergents with organic solvents, acids, or bases! ! CAUTION: Do not try to clean the interior of the spectrometer as this may lead to serious spectrometer damage. 28 Direct Detect™ Spectrometer User Guide 12.4 Description of Instrument Validation Tests 12.4.1 Performance Qualification Test (PQ) The Performance Qualification test evaluates the spectroscopic performance and confirms proper function of the IR spectrometer. To ensure that the instrument is working properly, it is recommended that the PQ test be run on a weekly basis. The factory default interval for the PQ test is one week. One week from the last PQ test, the software will alert you to run the instrument PQ test again. You can use the instrument with an expired PQ test, but the software will query you each time a measurement is initiated, asking if you wish to proceed under the expired PQ condition. The PQ test protocol consists of the following three tests: ●● Signal-to-noise test - The signal-to-noise ratio determines the sensitivity of the spectrometer by calculating the average signal-to-noise ratio of ten 100% spectra. A 100% spectrum is the ratio of two successively acquired single-channel spectra with no sample in the sample compartment. The ratio of these two singlechannel spectra is used to generate a transmission spectrum. ●● 100% Line Test - This test verifies that the 100% line does not shift over time. It measures the maximum deviation of a 100% line within a larger frequency range. The average of ten measurements must not exceed the predefined limit. ●● Wavenumber Accuracy Test - This test ensures that the frequency calibration of the instrument is within the defined limits using an internal polystyrene standard sample. Direct Detect™ Spectrometer User Guide 29 12.4 Description of Instrument Validation Tests, continued Figure 26 shows a successful PQ test report. OVP - PQ Test Protocol Company: Operator: Instrument Type: Optics Configuration: Accessory: Instrument Serial Number: Instrument Firmw are Version: OPUS/DB Version: Overall Test Result Test expires: Test Date/Time: Test Spectra Path: Date of last PQ Reference Measurement Comment: MILLIPORE Default Alpha Sample Compartment RT-DLaTGS ZnSe Fibre 1 w ith: MIR, KBr, RT-DLATGS [Internal Pos.1] Millipore Direct-Detect M3 1.320_MDD_01 Oct 27 2011 OPUS 7.0 Build: 7, 0, 122 / DB: 7.0.105.1106 for OPUS 7.0 PASSED 12/25/2011, 3:12:41 PM (GMT-5) 12/15/2011, 3:12:41 PM (GMT-5) C:\Direct Detect\Validation\Data\20111215\151241 Signal to Noise Test Minim um Signal to Noise Lim it(area 1): 1000 Signal to Noise m easured: 3458 100% Line Test Maxim um 100% Line Deviation: 2.0 Measured 100% Line Deviation: 0.29 Wavenum ber Accuracy Test - Polystyrene (35.5 Deg. C, Peak is T. corr.) Sam ple Material: Specified Peak: Measured Peak: Corrected Peak: 1601.45 cm -1 1601.13 cm -1 1601.25 cm -1 Polystyrene Maxim um Deviation: 0.50 cm -1 Measured Deviation: 0.20 cm -1 Overall Test Result = PASSED and Signature Figure 26. PQ test Date report Date and Signature 12.4.2 Operational Qualification Test (OQ) The Operational Qualification test checks instrument performance and compares this performance to the instrument specifications. The OQ test is performed during final testing before an instrument is delivered to the customer. It should also be performed after each major repair, after replacement of optical components which may influence the instrument performance, and after maintenance has taken place. The factory default interval for the OQ test is 12 months. Twelve months from the last OQ test, the software will alert you to run the instrument OQ test again. You can use the instrument with an expired OQ test, but the software will query you each time a measurement is initiated, asking if you would like to proceed under the expired OQ condition. The OQ test protocol consists of the following four tests: ●● Wavenumber Resolution Test - This test verifies the achievable spectrometer resolution by measuring a single-channel (single-beam) spectrum of the water vapor available inside the spectrometer, using the maximum available resolution. 30 Direct Detect™ Spectrometer User Guide 12.4 Description of Instrument Validation Tests, continued ●● Signal Sensitivity Test - This test is the same as the PQ signal-to-noise test, except that the spectra are measured in a very small region (2200–2100 cm-1). ●● Energy Distribution Test - This test verifies the achievable frequency range and the energy at the maximum position of the single-channel spectrum. Absolute values of energy are measured at different wavenumber positions. These values are divided by the maximum value achieved, and compared to acceptance values indicated in percent. Optical components (e.g., detector, source, and beam splitter) as well as the card holder have an effect on the limits of the frequency range. ●● Wavenumber Accuracy Test - The wavenumber accuracy test verifies that the frequency calibration of the spectrometer is within defined limits. Water vapor is used for this test because it has extremely narrow bands, and the position of these bands can be measured with a very high degree of accuracy. Figure 27 shows a successful OQ test report. OVP - OQ Test Protocol Company: Operator: Instrument Type: Optics Configuration: Accessory: Instrument Serial Number: Instrument Firmw are Version: OPUS/DB Version: Overall Test Result Test expires: Test Date/Time: Test Spectra Path: Comment: MILLIPORE Default Alpha Sample Compartment RT-DLaTGS ZnSe Fibre 1 w ith: MIR, KBr, RT-DLATGS [Internal Pos.1] Millipore Direct-Detect M3 1.320_MDD_01 Oct 27 2011 OPUS 7.0 Build: 7, 0, 122 / DB: 7.0.105.1106 PASSED 12/16/2012, 9:32:23 AM (GMT-5) 12/16/2011, 9:32:23 AM (GMT-5) C:\Direct Detect\Validation\Data\20111216\093223 Water Vapor Band: Maxim um Resolution: 1554.35 cm -1 2.00 cm -1 Measurem ent Region, Start: Minim um S/N: 2200.00 cm -1 2000 Minim um Energy Value: Minim um Energy Value: 5.00% 0.20% Resolution Test Measured Resolution: 1.63 cm -1 Sensitivity Test Measurem ent Region, End: Measured S/N: 2100.00 cm -1 3446.07 Energy Distribution Test Energy at 7500.00 cm -1 Energy at 5000.00 cm -1 Energy at 500.00 cm -1 9.14% 4.67% 0.01% Wavenum ber Accuracy Test Water Vapor Expected Band: Maxim um Deviation: 1576.130 cm -1 0.050 cm -1 Figure 27. Overall OQ test report Test Measured Band: Measured Deviation: 1576.129 cm -1 0.001 cm -1 Result = PASSED Date and Signature Date and Signature Direct Detect™ Spectrometer User Guide 31 12.5 Running the Instrument Validation OQ and PQ Tests 1. Make sure card holder is empty. 2. To run OQ and/or PQ tests, click on the instrument validation icon . 3. When the instrument validation dialog appears, click on the Performance Qualification (PQ) Run Test button (1) (Figure 28). The test takes about 5 minutes. Instrument validation icon and OQ/PQ Initiator 1 2 Figure 28. Running OQ/PQ tests 4. To run the Operational Qualification (OQ) test click on the Operational Qualification Run Test Button (2). The test takes about a minute to run. For information on interpreting test failures, refer to section 11.4. 12.6 Storage Store the Direct Detect™ spectrometer and Assay-free cards in a clean, dry environment at 15–30 °C. 32 Direct Detect™ Spectrometer User Guide 13 Specifications General Dimensions Weight (approximate) Power consumption Electronics Environmental conditions Safety regulations EMI regulations 22 x 30 x 25 cm (8.7 x 11.8 x 9.8 in.) [width x depth x height] 7 kg (15.4 lbs) Maximal: 100–240 VAC, 50–60 Hz (max 2 A) Class 1 laser product (contains 850 nm laser diode) Operational temperature range: 18 °C–35 °C (64–95 °F) Temperature variation: max. 1 °C/h and max. 2 °C/day Humidity (non-condensing): less than 80% (relative humidity) Installation site: in a closed room, max. 2000 m above sea level Installation overvoltage category: II Pollution degree: 2 Complies with EN/IEC 61010-1/08.2002 (Safety requirements for electrical equipment for measurement, control and laboratory use) Complies with EN/IEC 61326/05.2004 (Electrical equipment for measurement, control and laboratory use - EMC requirements) Performance Spectral range Resolution Wave number accuracy Wave number reproducibility Photometric accuracy 6000–500 cm-1 Better than 2 cm-1 Better than 0.05 cm-1 Better than 0.01 cm-1 0.1% T Optics Design IR Source Sealed optics housing, convective desiccating Low voltage, air cooled, can be replaced (lifetime 44,000 operating hours) Computer Specifications Operating System Software Framework Screen Resolution Ethernet Cable Processor Random Access Memory (RAM) Graphics Card Microsoft® Windows® 7 Microsoft® .NET Framework 2.0 (installed automatically) 1024 x 600 or greater RJ45, 10BaseT (10 or 10/100 MBit) Intel® Pentium® II, 800 MHz or greater 2 GB XVGA, 256 Mb RAM, 32-bit color depth, Open GL, GDI+ Direct Detect™ Spectrometer User Guide 33 14 Ordering Information This section lists catalogue numbers for the Direct Detect™ spectrometer and replacement parts. See Technical Assistance section for contact information. You can purchase these products on-line at www.millipore.com/products. Product Description Cat. No. Qty/Pk DDHW00010-WW 1 DDAC00010-4P DDAC00010-8P DDAC00010-GR 50 x 4 50 x 8 50 Spotting Tray DDMISC010-ST 5 Netbook Stand DDMISC010-NS 1 Direct Detect™ IR Source** DDSP00010-LA 1 Direct Detect™ Desiccant Bag** ** Contact Technical Service to order (see Technical Assistance section) DDSP00010-DE 1 Direct Detect™ Spectrometer Direct Detect™ Spectrometer (includes instrument with power adapter*, Dell® Netbook computer with power adapter*, Ethernet cable, Netbook computer stand, 50-pack of Assay-free cards, spotting tray, spare desiccant bag, Torx® screw driver, Quick-Start Guide) * Power adapters are configured for multiple countries Direct Detect™ Spectrometer Replacement Parts/Accessories Direct Detect™ Assay-free Cards 34 Multiple colors Multiple colors Green Direct Detect™ Spectrometer User Guide 15 Technical Assistance For more information, contact the office nearest you. In the U.S., call 1-800-MILLIPORE (1-800-645-5476). Outside the U.S., go to our web site at www.millipore.com/offices for up-to-date worldwide contact information. You can also visit the tech service page on our web site at www.millipore.com/techservice. 16 EC Representative Millipore (UK) Ltd. Fleming Road, Kirkton Campus Livingston EH54 7BN UK 17 Standard Warranty The applicable warranty for the products listed in this publication may be found at www.millipore.com/terms (within the “Terms and Conditions of Sale” applicable to your purchase transaction). Direct Detect™ Spectrometer User Guide 35