1
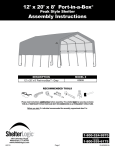
Larson Systems Inc.
SSS 3.13 User Manual
Statistical & Spreadsheet Interface Software
February, 2003
Part No. 060-1000-0039-00B
LARSON SYSTEMS INC.
SSS 3.13
Statistical & Spreadsheet
Interface Software
Operator’s Manual
LARSON SYSTEMS INCORPORATED
10073 Baltimore Street NE
Minneapolis, MN 55449-4425
This manual could contain technical inaccuracies or typographical errors. Changes are periodically
made to the information herein. These changes will be incorporated in new editions of the manual
COPYRIGHT © 2003 Larson Systems, Inc. (LSI)
All rights reserved. No part of this manual may be reproduced by any means without written permission
of the author except portions necessary for internal use only by the purchaser of the LSI system.
i
Table of Contents ................................................................................................................... Page
1.0 Introduction ............................................................................................................................................. 1
2.0 Installation ............................................................................................................................................... 1
3.0 Getting to know the SSS ................................................................................................................... 2-29
3.1 Demo Programs ................................................................................................................................ 2
3.2 Creating a Test ............................................................................................................................... 2-8
3.2.1 Test Specifications ................................................................................................................ 3-7
3.2.1.1 Command List .............................................................................................................. 3-7
3.2.1.1.1 Read Keyboard ...................................................................................................... 4
3.2.1.1.2 Read Serial Port ..................................................................................................... 4
3.2.1.1.3 Larson TST ......................................................................................................... 4-5
3.2.1.1.4 Larson Super DHT ................................................................................................. 5
3.2.1.1.5 Larson DHT/FDHT/CDHT/ECT .............................................................................. 6
3.2.1.1.6 Larson TWCS ........................................................................................................ 6
3.2.1.1.7 Larson Super TWCS .............................................................................................. 7
3.2.2 Specification Options ............................................................................................................... 7
3.2.3 Global Comments .................................................................................................................... 8
3.2.4 Saving the Test ........................................................................................................................ 8
3.3 Options ......................................................................................................................................... 9-17
3.3.1 File Options .............................................................................................................................. 9
3.3.2 Result Options ....................................................................................................................... 10
3.3.3 Setup Ports ............................................................................................................................ 11
3.3.4 Data Exchange ................................................................................................................. 11-16
3.3.4.1 Transfer Setup .............................................................................................................. 11
3.3.4.2 Communication Type .................................................................................................... 11
3.3.4.3 Action Performed .......................................................................................................... 12
3.3.4.4 Spread Sheet Program Setup....................................................................................... 12
3.3.4.5 Result Data Check List ................................................................................................. 12
3.3.4.6 DDE Link Setup ............................................................................................................ 12
3.3.4.7 Action Buttons ............................................................................................................... 12
3.3.4.8 Using DDE to Dynamically Program a Test ............................................................. 12-16
3.3.4.8.1 Available Commands ........................................................................................... 13
3.3.4.8.2 Test Point Commands ..................................................................................... 14-16
3.3.5 Miscellaneous ........................................................................................................................ 16
3.3.6 Excel Template .................................................................................................................. 16-17
3.3.7 Demos .................................................................................................................................... 17
3.3.8 About ..................................................................................................................................... 17
3.4 Getting Results .......................................................................................................................... 17-18
3.4.1 Saving Results ....................................................................................................................... 18
3.4.2 Loading Results ..................................................................................................................... 18
3.4.3 Clearing Results ..................................................................................................................... 18
3.5 Viewing Results ......................................................................................................................... 19-25
3.5.1 Individual Actual Results ........................................................................................................ 19
3.5.2 Individual Statistics ................................................................................................................. 19
3.5.3 Individual Test Point Graph .................................................................................................... 20
3.5.4 Lot Actual Results .................................................................................................................. 21
3.5.5 Lot Statistics ........................................................................................................................... 21
3.5.6 Histogram ............................................................................................................................... 22
3.5.7 X-Bar Graph ........................................................................................................................... 23
ii
3.5.8 Range Graph ......................................................................................................................... 24
3.5.9 Moving Average Graph .......................................................................................................... 25
3.6 Printing Results ............................................................................................................................... 26
3.7 Other Features ........................................................................................................................... 26-28
3.7.1 Merging Files.......................................................................................................................... 26
3.7.2 Window Layouts ............................................................................................................... 27-28
3.7.2.1 Selecting a Layout ........................................................................................................ 27
3.7.2.2 Creating/Modifying/Deleting a Layout........................................................................... 27
3.7.2.3 Layout Options .............................................................................................................. 27
3.7.2.4 Screen Positioning ........................................................................................................ 28
3.7.2.5 Reverting to Free Form ................................................................................................. 28
iii
1.0 Introduction
The SSS is a versatile tool to be used by engineers and QA departments. The SSS can be used to fine tune a new
product, monitor quality on the production floor, or to ensure vendor supplied parts meet your companies specifications.
The SSS features an easy to use graphical interface, DDE capability for easy communication with spreadsheet based
programs like Microsoft Excel, Excel Templates for more flexibility if you prefer Excel over the SSS, and now communicates with our Torque Wrench Calibrations Systems.
The SSS communicates with the entire line of Larson Hand Testers and also with virtually any device that sends an
ASCII data stream. It can also receive information from the keyboard.
The SSS is fully backward compatible with previous revisions of the SSS and is compatible with Microsoft Windows
9x, NT, 2000, and XP Pro.
2.0 Installation
3.13
C
To install software open "setup.exe"
Larson Systems Inc.
10073 Baltimore Street NE
Minneapolis, MN 55449-4425
www.larsonsystems.com
Phone:
763-780-2131
Toll-free: 1-877-780-2131
Fax:
763-780-2182
[email protected]
© 1998-2003 Larson Systems Inc.
All Rights Reserved
1
-02
V.
Windows 95 /
98 / NT / 2000
700
00
-0
08
8
Once the installation is finished you will have a new Program Group
called Larson Systems Inc in the Programs item of the Start Button. In
the Larson Systems Inc Program Group is a shortcut for the SSS. Use
this shortcut to launch the SSS program. There are other files that are
installed with the SSS.exe program but they are not given shortcuts.
SSS
Statistical &
Spreadsheet
Interface Software
01
The SSS comes on one CD-ROM. Put the disk in your CD-ROM drive
and run the Setup.exe program. The SSS installer will not autostart. The
installer will display a path to install the SSS at. You have the option of
changing this path. Once you are satisfied with the install path, continue
with the installation.
3.0 Getting to know the SSS
3.1 Demo Programs
The SSS comes with two demo programs that you can use to familiarize yourself with the SSS. These demos can be
accessed from the Run Demo menu within the main Options menu. This demo will automatically load and display
data showing different operations and views that the SSS can display.
3.2 Creating a Test
From the File menu select New. The SSS will ask you to confirm that you want to clear out all specifications and results.
Click OK to continue.
The Specifications Options will then be shown. From this window you can select what units to use for the Force, Length,
Torque, and Angle. You can also set the appropriate load capacity and maximum length of the Force/Length testers.
Set the appropriate load capacity to ensure proper display resolution.
2
3.2.1 Test Specifications
When the Test Specifications window is not shown you can open it from the Specifications menu items and choose
Test.
With this window you will program and view the entire test as well as choosing what test point to display for certain
graphical results. The SSS is capable of programming up to 99 test points. To change from one point to another you
can use either the Up/Down arrow or enter a Test Point number in the text box and click the Enter button.
Also from this window you can enter a Part Number. This part number will show up for every test point and is printed
out when a hard copy is generated. You can also enter comments for each test point. The comments will also be
printed out on the hard copy.
Use the Command drop down list to change the function of each test point. When you click on the command a list
will drop down where you can select one of seven commands available for the SSS.
3.2.1.1 Command List
The seven commands available for the SSS are listed in this section. Most of the command allow for a nominal
value and a tolerance to be entered. By entering a nominal value when available the SSS will generate a Resultant
Tolerance, how much difference the result was from the nominal. If a Tolerance is entered the SSS will generate a
Bad Low, Satisfactory, Bad High result for the test point and an overall Good/Bad test result.
Nominal and Tolerance values can be entered as either constants, number that the operator enters, variables, or
results of other test points. Constants are numbers the operator inputs that never change. Variables are storage
locations that can be created during the test that hold information.
Some commands allow units to be added to the results. Adding units to simple numerical results can increase
readability of the results.
3
3.2.1.1.1 Read Keyboard
With this test you can prompt the user to input
data from the keyboard. The data expected can
be either text data or numerical data. Numerical
data can have a nominal and tolerance specification applied to it. For either type of data you can
specify the prompt that the user sees when asked
to enter data. The nominal and tolerance numbers can be entered as constants, variables, or
results of test points. Constant zeros will result in
no tolerances being applied. The tolerance number can be expressed as a percentage or as whole
units. You can also specify what units the entered
data will have, force units, length units, no units,
or user defined units.
3.2.1.1.2 Read Serial Port
With this test you can bring in data from
external devices that are connected to
you computer. You must specify what
RS232 communication port the device is
connected to. If you do not know what
port you are using consult your I.T. department or computer supplier. Be sure
to enable the port with the correct communication protocols from the Port Setup
menu (see section 3.3.3). You must also
specify a delineation for the device. A
delineation is a character that the external device sends out that signals the receiving device (the SSS) that it is finished
sending data. Typical delineations are the
carriage return, the line feed, or the tab
character. A delineation could also be a
specific number of characters. If your
device does not provide any delineation you may use Delay. If Delay is used for a delineation the SSS will wait the
specified number of seconds after it receives the first character and then end the character gathering. Whatever
characters were sent within that amount of time is what it accepts for a result. Check the owner’s manual of you device
to verify what its delineation is.
You may also specify a nominal and tolerance value for the reading. Both number can be either constants, variable, or
results of other test points. The tolerance can be specified as either a percentage or whole units. You can apply units to
the reading also, either force units, length units, no units, or user defined units. The result of this test point is whatever
the external device sent over.
3.2.1.1.3 Larson TST
With this test you can get one piece of data from a Larson Torsion Spring Tester. The TST is capable of sending two or
more pieces of data at once but, as stated, this test only reads one piece of data. Multiple Larson TST tests can be
programmed to receive all possible pieces of data sent from a TST.
This test can either wait for new data sent from a TST (by using the Send button on the tester) or it can use data that was
sent over to a previous test point. If you are looking for one piece of data only or for the first piece of multiple pieces of
data you would want to select Wait for TST Send Button Press.. If you are looking for the second or later pieces of data
from a TST you would want to select Use Previously Send Data.
You must specify what RS232 communication port this test will be using because it is possible to connect more than one
TST to you computer.
4
Next you must specify what piece of data you want to capture. The TST is capable of having 4 different testing modes;
Manual, Peak, First Peak, and Two Point with Rate modes. For Manual, Peak, and First Peak modes are capable of
generating two pieces of information; torque and angle. The Two Point with Rate mode generates five pieces of data;
two sets of torque/angle readings and a Rate. You must choose what piece of information you wish to capture. If you
want both or all five you must have either two or five Larson TST test points defined. The first defined test point should
always have the Wait For TST Send Button Press button selected. The second or second, third, fourth, and fifth defined
tests point should always have the Use Previously Send Data button selected. Each test point should have a different
torque or angle selection selected.
For each torque or angle reading you can specify a nominal and tolerance to apply to the data from the TST. The
tolerance can be specified as either a percentage or as whole units. The units of the result will be either torque or angle
units.
3.2.1.1.4 Larson Super DHT
The Larson Super DHT is similar to the
Larson TST as far as the setup. The Larson
Super DHT is capable of five testing modes;
Manual, Peak, First Peak, Switch Contact,
and Two Point with Rate modes. Manual,
Peak, and First Peak modes can generate
2 readings, Two Point mode can generate
5 readings and Switch Contact mode can
generate 9 readings. If you want to capture all of the data for the Mode you are
testing in you must have 1 test point for
each reading. For each test point defined
you should select a different reading.
If the test point is capturing only 1 reading
or the first of multiple readings from a Super DHT send you should select the Wait
for SDHT Send Button Press. If the test
point is capturing the second or successive
readings from a SDHT send you should
select Use Previously Send Data selection.
For each reading captured you can specify a nominal and tolerance to apply to the data from the SDHT. The tolerance
can be specified as either a percentage or as whole units. The units of the result will be either force or length units.
5
3.2.1.1.5 Larson DHT/FDHT/CDHT/ECT
This command is used to receive information from any of the Larson DHT line of testers except for the Super DHT, it
has its own command. The FDHT only sends out Force. The other DHT testers can send out both Force and Length
data. You can optionally enter a nominal value and tolerance for the data you want to receive. If the tolerance value
is left as a zero no condition (Bad Low, Good, Bad High) is generated. If the Nominal value is left a zero no resultant
tolerance is calculated. The serial port the tester is connected to must be selected here.
When receiving the first piece of information from either tester the “Wait for DHT “Send” Button Press” option must
be set. This will force the SSS to wait until the operator has sent information from the tester.
If both Force and Length information is to be received two separate Larson DHT/CDHT commands (test points) must
be set up. The first command must have the option “Wait for DHT ‘Send’ Button Press” set. The second DHT/CDHT
command must have the option “Use Previously Sent Data” set. This will allow the second command to use the
same information that the first command used.
First Command
Second Command
3.2.1.1.6 Larson TWCS
The Larson TWCS only sends torque. You can set a nominal torque and tolerance for the reading. The tolerance can
be specified as a percentage or as whole units. A zero in
the tolerance specification results in not Bad Hi/Satisfactory/Bad Low results being calculated. A zero for the nominal specification results in no resultant tolerance being calculated. You must select what serial port the TWCS is connected to.
6
3.2.1.1.7 Larson Super TWCS
The Larson Super TWCS is similar to the Larson TWCS in that is only sends Torque data. However, the Super TWCS
can test in three different modes ; Manual, Peak, and First Peak. These mode are useful for testing the different types
of torque wrenches. You can optionally specify a nominal and tolerance value for the torque data being received. A zero
in the tolerance specification results in not Bad Hi/Satisfactory/Bad Low results being calculated. A zero for the nominal
specification results in no resultant tolerance being calculated. You must specify what serial port the Super TWCS is
connected to.
3.2.2 Specification Options
The Specifications Options allow you to select what units will be displayed for results. These units are for the operators reference, selecting units here will not change the units on the testers. The operator must be sure that the
units on the testers match the units selected here.
7
3.2.3 Global Comments
If there are any comments or notes you wish to
attach to the overall test sequence you can enter
then in the Specification Comments. To view these
comments select the menu item Specifications then
select Comments. Any text you enter here will be
on the specification printout. Once you open the
Global Comments window you will have a Cut/
Copy/Past button appear in the button bar. With
these buttons you can easily retrieve you comments from other applications, like a word processor. When you finish entering your comments click
OK.
3.2.4 Saving the test.
Once you have finished entering in all of you test specifications you should save the test. To do this either click the save
button in the button bar (the button with an arrow pointing to a floppy disk) or select the Save item from the File menu
item. From the Save As window you can select what directory to place the test and create a test name.
If you try to alter a test that was loaded from a disk you will receive a warning about that file being altered was loaded
from memory. If you do wish to alter the file you will have to clear out the file name and any results that are currently in
the SSS’s memory. The specifications will remain. When you finish altering the specifications you can overwrite an
existing specification file. If the specification file has results associated with it the results may become unusable. Be
careful about overwriting specification files!
8
3.3 Options
3.3.1 File Options.
When you go to save results that have been collected there are two ways to save them, either in a Larson Systems
standard or in a dBase III format. To select what format select the menu item Options and then select File Defaults.
The Larson Systems standard is an ASCII text, comma delineated text file able to be read from any text file viewer (Note
Pad, Word Pad, Microsoft Word, etc.). This file can also be easily read into Microsoft Excel if you wish further analysis
beyond the SSS’s capabilities.
If you have a dBase program and wish to view the results in that use the File Options to set up how the numerical results
are formatted in the result file.
9
3.3.2 Result Options
These sets of options control how
results are displayed on the monitor and on a printout. To change
these options from the Options
menu item select Results.
The SSS has two ways of viewing
results, either individually or in a
Lot. When viewing individual results you can see the results of
every test point for every test.
When viewing by Lot a number of
consecutive tests are grouped together and the average for each
test point is displayed. The SSS
is capable of loading multiple result files. With this feature you can
see many hours, days, or months
of tests at one time. When viewing results by Lot all of the result files loaded into memory are grouped together. This
means that if the number of results per result files is not even, a Lot results may include individual results from different
result files.
From the Result Options you can control how many individual tests are grouped into a Lot by changing the Lot Size
option. The other options below Lot size controls how many Lots are displayed on the various graphical Lot results.
For all of the graphical results the data is represented by points on a graph connected by lines. The points and lines have
two sizes, large or small. Use the Thick Lines and Big Symbols options to choose the line and point sizes.
You can use the Printer Orientation option here to specify how the graphs are printed out, either Portrait or Landscape.
This orientation is separate from the orientation for text data printout. Text data orientation is controlled from the Printer
Setup, which is under the File menu.
The background color of the graphs can be controlled from here. If you have a preference for graph colors you can
change and preview each color from here. To save toner or ink in your printer it is better to set the background to white,
this way no toner or ink will be used for the background.
With the “Changes in Lot Results display also change Individual Results Display” enabled anytime you view different lot
results the Individual Results display will change to reflect the first individual results in the group of Lot data.
With the “Changes in Individual Results display also change Lot Results display” option enabled, changing the Individual Results to different tests will cause the Lot Results display or any graphical Lot Results to change so that the last
lot displayed is the Lot that the Individual Results display is in, i.e. if the Lot Size is 5 and the Individual Results display
is showing the result for test 13, Lot 3 is displayed in the Lot Results displayed and the graphs show Lots 1 to 3.
With the “Keep Display Up-to-Date” option enabled any new results sent to the SSS will automatically be displayed in
the Results display and in any graphs that are displayed. This new data will be displayed in the Individual Actual display
and the last Lot will be displayed in the Lot Actual data.
With the Results Printout Setup section you can select what else besides results is printed out for each test. By
removing certain features you can increase the number of test points per line up to a maximum of 8 results. Tagged
results are results that a user had determined should not belong in any of the statistical or graphical calculations. From
here you have to option to display the tagged results or not.
When you have selected all of the options you want click on the OK button to close the window.
10
3.3.3 Setup Ports
For any external device that is connected to your computer you have to
define that port in the SSS and enable it before you can get information
from that device. To define the port,
open the Setup Ports from the Option
menu item. The SSS can handle up
to 10 serial ports. If your computer
does not have that many ports and
you try to enable one that does not
exist the SSS will generate a warning.
Use the Up/Down arrows or the text
box to select the different ports. For
each port you can give a short description in the Port Comments box. Each
of the different Larson devices listed
in the Device Type list will change the
protocols to a preset setting. These
preset setting are unalterable. If you
are using a device that is not from
Larson Systems you will have to use the Other device type and set the various protocols setting to the appropriate
settings. Check with your device manual for the correct protocol settings.
Once all of the ports are set click the OK button to finish setting up the ports and close the window. If a warning is
displayed that the port cannot be used it is usually because another device already has control of the serial port or the
serial port does not exist in your computer. If you have problems like this consult your I.T. department or computer
supplier.
3.3.4 Data Exchange
The SSS is capable of sending information directly to other
programs by using either Dynamic Data Exchange or by a
process of Keystroke Imitation called Send Keys. It is also
capable of receiving test setup commands using DDE. Select what type of communication you will be using to send
information from the Communication Type selections.
3.3.4.1 Transfer Setup
Once you have gone through a DDE setup you can save
that setup for future reference. You can select saved setups using the drop down list. The SSS will remember the
last Transfer Setup selected. If no Transfer Setups have
been added the SSS will remember each individual Data
Exchange Setup settings. The SSS has the ability to dynamically receive test information from another program.
This ability must be enabled here. If this ability is enabled
and not corresponding program is running the DDE link will
fail and error messages will be generated.
3.3.4.2 Communication Type
Here you can select what communication method is used
to send results out. When selecting DDE you will have the
ability to load a test from a spreadsheet also.
11
3.3.4.3 Action Performed
From here you can select what action will be performed
with the action button on the bottom of the setup window. Send Results will cause result data to be sent to
the spread sheet. Send Test will cause the current Test
Specifications to be sent to the spread sheet. Send Demo
Test will cause a demo test to be sent to the spreadsheet. The demo test will show how a test can be set up
in a spreadsheet for loading later. Load Test will cause a
test to be loaded from the spreadsheet. This is only
available when using DDE communication type. Alter
Macros will cause the Macro Definition window to open.
When using either communication method, it is necessary to tell the spreadsheet when to change the selected
cell and what cell to be the selected cell. This is done by
setting Pre- and Post-Amble Macros. Pre-Amble macros will be send before the result data. Post-Amble Macros will be
sent after the results data. Macros are comprised of keystrokes such Left, Right, Tab, or Enter. Alpha-Numeric keystrokes can also be added. For each piece of result data (Test Number, Data, Time, etc.) you can enter a different
Macro.
3.3.4.4 Spread Sheet Program Setup
When sending data to a spreadsheet the SSS will first look to see if the spreadsheet is running. If it is not, the SSS will
try to start it. The Spread Sheet Program contains the full path to your spreadsheet. It is a drop down list that will contain
previous program paths that have been added. If there are no paths that can be used you can create a new path by
clicking on the Browse button below the Sheet Name text box. This will allow you to select a new spreadsheet program
and path. The SSS also need to know the title of the spread sheet. The title is usually the program name and can be
found on the very top of the program window. The typical title for Excel is “Microsoft Excel.” The SSS will also need to
know what sheet the data will be sent to. In Excel the sheet names are typically on the bottom of the sheet in a tab-type
list.
Once you have entered the Spread Sheet Program and path, the Spread Sheet Title and the Sheet Name you can save
these three items by clicking on the Add button. This will result in a new item in the Spread Sheet Program drop down
list. You can use the Delete button to remove these three pieces of information for the setup that is shown. You can use
the Spread Sheet Program drop down list to select different setups to use or delete.
3.3.4.5 Result Data Check List
You can pick and choose what Result Data to be sent by checking or un-checking the individual result types.
3.3.4.6 DDE Link Setup
DDE can be used to send Result data to a spreadsheet and also to dynamically load test information. The cell where
result information is sent to is set in the “Cell to start sending to” text box. It should be formatted in “A1” format (Columns
represent by a letter and rows represented by numbers). When using DDE to load test data dynamically the SSS will
look at one spreadsheet cell and will look for a change in the data in that cell. The cell that is used is defined in the “Cell
to receive from” text box. Again, it uses “A1” formatting.
The SSS can hold multiple sets of results in memory at once. When the results are sent to a spreadsheet either the
Active Set or All Sets can be sent by selecting the setting . Result data can also be sent as it comes in, or “On The Fly”
3.3.4.7 Action Buttons
The left button will begin either a result Send or a test Load when clicked. Use the close button to exit Data Exchange
Setup.
3.3.4.8 Using DDE to dynamically program a test.
The SSS is capable of bidirectional communication with a spread sheet by using Dynamic Data Exchange. Within the
SSS Data Exchange setup the user can select a cell in the spreadsheet will be used for DDE dynamic test loading. This
link to this cell will try to be established when the SSS is first started, when the Data Exchange option is opened, when
the communication type is changed from Send Keys to DDE, and when the Receive From text box is changed. The
label above the Receive From text box in the DDE Link section will reflect the status of the link.
12
Once this link has been established it is possible for the spreadsheet to program a SSS test. The commands that the
spreadsheet has available to send to SSS are listed below with an explanation and the proper syntax. To send a
command to SSS simply enter the command in the proper syntax into the cell. The SSS will change the text in the cell
to the text “OK” when it is finished processing the command sent over. Commands are separated from the data with a
“|” (the “pipe” character). The “|” is needed even if the command to be sent does not have data.
3.3.4.8.1 Available Commands
1) Test Point
This command allows the user to select what test point will receive information. The syntax is “TP|x” where x is a
number from 1 to 99.
2) Memory Clear
This command will clear all specifications and results. The syntax is “MR0|”
3) Specified Length
This command will change the specified length for the selected test point. Some commands use the specified
length entries for other things than a length measurements. Typically it is used for Nominal value entries. The
Syntax is “SL|x.x” where “x.x” is the nominal value.
4) Specified Force
This command will change the specified force for the selected test point. Some commands use the specified force
entry for other things than a force measurement. Typically it is used to represent the units the test point is measuring, “F” for force, “L” for length, “T” for torque, or “A” for angle. The syntax is “SF|x” where “x” is either the units of
the measurement or a number depending on the command.
5) Specified Tolerance
This command will change the specified tolerance for the selected test point. The syntax in “ST|x.x”. The decimal
point is not necessary.
6) Specified Speed
This command will change the specified speed for the test point. The Speed entry for the test point typically
represents the serial port the command will use. The syntax is “SS|x” where “x” is either the serial port or another
number depending on the command.
7) Specified Incremental or Absolute Test
This command will change the measuring convention to either incremental or absolute for the specified test point.
The syntax is “SI|I” for incremental or “SI|A” for absolute. This setting is used differently for different commands.
8) Specified Miscellaneous
This command will change the miscellaneous entry for the selected test point. Command like Rate use the miscellaneous entry to store information. The syntax in “SM|x.x”.
9) Specified Comments
This command will change the comments for the selected test point. The syntax is “SO|xxx”. The data for this
command is strictly text although number can be entered.
10) Specified Part Number
This command will change the Part Number for the entire test. The syntax in “SP|xxx”. The data for this command
is strictly text although number can be entered.
11) Specified Command
This command will change the command for the test point (Read Keyboard, Read Serial Port, etc.). The syntax in
“SC|x” where x is a letter that represents a command. The list and explanation for the letters are in section 3.3.4.8.2.
12) Specified Length/Force/Torque/Angle Units
This command will specify Length and Force units for the test. The syntax is “MU|XY” where “X” is the representation
for Length units and “Y” is the representation for Force units. The length units available are “I” for inches and “M” for
millimeters. The force units are “L” for lbs., “N” for Newtons, “G” for grams, “K” for kilograms, and “O” for ounces.
The Angle units are “D” for degrees and “R” for revolutions. The Torque units are “L” for in lb, “N” N mm, “G” for gm
mm, “K” for Kg mm, “O” oz in, “F” ft lb, “M” N M, “B” for Kg M, “C” for Kg cm, and “I”.
13) Testing Direction
This command will set the testing direction to either Compression or Extension Testing. The syntax is “GE|X” where
X will be either “C” for compression testing or “E” for extension testing. This command may be used for different
setting depending on the command.
14) Load a Test from the Hard Drive
This command will make the SSS load a test from the hard drive. The drive specified can be either a local drive on
the computer or it can be a mapped network drive. The syntax is “LOAD|xxxx” where xxxx is a proper path and file
name for an existing SSS specification file. The proper path and file name should be in the form “DRIVE
LETTER:\FOLDER\SUBFOLDER\FILENAME.us1”.
An
example
would
be
“C:\Customer_X\Part_B\Build_2\Test_1.us1”
13
3.3.4.8.2 Test Point Commands
The SSS has seven commands available for programming. The following sections will explain what data is needed
for the Specified Command and also what other commands the test point can expect. All of the specifications
commands are not necessary, such as nominal values and tolerances, and will be listed as optional.
1) Read Keyboard
This command is represented by the letter “B”. This command will allow the user to input either a number or text
through the keyboard. If a number is entered a nominal value and a tolerance can be applied to it. Units can also
be supplied for the entered result. A user defined message can be shown to the user to prompt them to enter data.
The Numeric or Text entry option and the user defined prompt are stored in the Specified Miscellaneous. The syntax
is “SM|Yprompt” where “Y” is either an “N” for a numeric entry or a “T” for a text entry. “prompt” is the user supplied
prompt. The nominal value for a numeric entry is stored in the Specified Length. The nominal value can be either
a constant, a variable, or the result of a test point. An example of the syntax is “SL|C3.2” which represents a
constant of 3.2. The tolerance applied to the entered number is stored in the Specified Tolerance and can be either
a constant, a variable, or the results of a test point. An example of the syntax is “ST|VAVar” which represents a
variable named AVar. The tolerance can be expressed as a percentage (X%) or in whole units (+/- X). This is also
stored in Specified Tolerance and is represented as the case of the letters “C”, “V” or “R”. Lower case letters
represent whole units (+/-X) and upper case letters represent percentage (X%). The units that are applied to a
numeric results are represented in the Specified Force. The syntax is “SF|X” where “X” is either an “L” for Length
Units, an “F” for force units, an “N” for no units or an “Oxxxx” for other units and the “xxxx” is a user supplied unit.
2) Read Serial Port
This command is represented by the letter “Y”. This command will allow the SSS to get information from a device
through RS232. A nominal value and tolerance can be entered and units can be applied to the reading. The
delineation for the incoming RS232 data can be set along with what serial port is used. The nominal value is set in
Specified Length and can be either a constant, a variable, or the result of a test point. An example syntax is
“SL|C2.3” and represents a constant 2.3. The tolerance is stored in the Specified Tolerance and can also be a
constant, a variable, or the result of a test point. The tolerance can also be stated as a percent or as whole units.
Percentages are represented by a upper case “C”, “V”, or “R” and whole units are represented by lower case “c”, “v”,
or “r”. An example syntax is “ST|r2” which represents the results of test point 2 and in whole units. The units
assigned to the result is stored in Specified Force and is represented by either an “L” length units, an “F” for force
units, an “N” for no units, or an “Oxxxx” for other units and the “xxxx” is the user supplied units. An example of the
syntax is “SF|L” which represents length units. The serial port to use is stored in the Specified Speed and has the
syntax “SS|X” where “X” is the serial port number to be used and is between 1 an 10. The delineation used is stored
in the Specified Miscellaneous and has the syntax “SM|xx” where xx represents the delineation. The delineations
that can be used are a “C” for a comma, an “S” for a space character, a “T” for a tab character, an “e” for a semicolon,
an “a” for a carriage return, a “D” for a decimal point, an “lx.x” (lower case “L”) for a delay of x.x seconds, or an “Fx”
for fixed fields of x characters.
3) Larson TST
This command is represented by the letter “W”. This command allows communication to a Larson Torsion Spring
Tester. This command must specify the serial port the TST is connected to, a reading from the TST to read, and
whether the test point waits for new data or uses previously sent data. A nominal value and a tolerance are optional.
The serial port used is stored in Specified Miscellaneous and the syntax in “SM|X” where “X” is a number between
1 and 10 representing the serial port the TST is connected to. What to measure is stored in Specified Speed and the
syntax is “SS|z” where “z” is a letter that represents what to measure. “z” can be one of the following:
“A” for manual mode length,
“B” for manual mode force,
“C” for peak mode length,
“D” for peak mode force,
“N” for two point with rate first point length,
“O” for two point with rate first point force,
“P” for two point with rate second point length,
“Q” for two point with rate second point force,
“R” for two point with rate mode rate,
“S” for first peak length, or
“T” for first peak force.
14
Whether to wait for new data or used previously sent data is stored in Specified Absolute/Incremental and has the
syntax “SI|x” where x is “I” to wait for new data or “A” to use previously sent data. The optional nominal value is
stored in Specified Length. It can be given as a constant, a variable, or the result of a test point. An example syntax
is “SL|C12.3” which represents a constant value of 12.3. The optional tolerance is stored in Specified Tolerance and
can also be represented by a constant, a variable, or the results of a test point. It can also be specified in percentage
or as whole units. An example of the syntax is “ST|r4” which represents a tolerance of +/- the result of test point 4
and is in whole units. The “r” in the example represents the results of a test point and the case of the character, lower
in the example, represents whole units. An upper case “R” would have represented a percentage.
4) Larson Super DHT
This command is represented by the letter “U”. This command allows communication to a Larson Super DHT
Tester. This command must specify the serial port the Super DHT is connected to, a reading from the Super DHT
to read, and whether the test point waits for new data from the tester or uses previously sent data. A nominal value
and a tolerance are optional. The serial port used is stored in Specified Miscellaneous and the syntax is “SM|X”
where “X” is a number between 1 and 10 representing the serial port the Super DHT is connected to. What to
measure is stored in Specified Speed and the syntax is “SS|z” where “z’ is a letter that represents what to measure.
“z” can be one of the following :
“A” for manual mode length,
“B” for manual mode force,
“C” for peak mode length,
“D” for peak mode force,
“E” for contact mode free length,
“F” for contact mode first point length,
“G” for contact mode first point force,
“H” for contact mode second point length,
“I” for contact mode second point force,
“J” for contact mode third point length,
“K” for contact mode third point force,
“L” for contact mode fourth point length,
“M” for contact mode fourth point force,
“N” for two point with rate first point length,
“O” for two point with rate first point force,
“P” for two point with rate second point length,
“Q” for two point with rate second point force,
“R” for two point with ratemode rate,
“S” for first peak mode length, or
“T” for first peak mode force.
Whether to wait for new data or used previously sent data is stored in Specified Absolute/Incremental and has the
syntax “SI|x” where x is “I” to wait for new data or “A” to use previously sent data. The optional nominal value is
stored in Specified Length. It can be given as a constant, a variable, or the result of a test point. An example syntax
is “SL|C12.3” which represents a constant value of 12.3. The optional tolerance is stored in Specified Tolerance and
can also be represented by a constant, a variable, or the result of a test point. It can also be specified in percentage
or as whole units. An example of the syntax is “ST|r4” which represents a tolerance of +/- the result of test point 4
and is in whole units. The lower case “r” in the example represents tolerance in whole units. An upper case “R”
would have represented a percentage.
5) Larson DHT/FDHT/CDHT/ECT
This command is represented by the letter “N”. This command allows communication with a Larson DHT, FCHT,
CDHT, or ECT tester through RS232. The serial port that this command will use is specified in Specified Speed
and has the syntax “SS|x” where “x” is a number between 1 and 10 representing the serial port that will be used.
An optional nominal value can be defined and is specified in the Specified Length. It can be specified as a
constant, a variable, or the result of another test point. An example of the syntax is “SL|C1.23” which represents
a constant value of 1.23. An optional tolerance can also be entered. The tolerance is specified in the Specified
Tolerance and can be specified as a constant, a variable, or the result of a test point. It can also be specified as
a percentage or a whole number. And example of the syntax is “ST|R3” which represents the result of test point 4
used as a percentage. The upper case “R” is for percentage where a lower case “r” would have represented a
whole number. Newer DHTs can also send out Length data. This command can also read the length from these
testers. The value to read is specified in the Specified Miscellaneous and has the syntax “SM|x” where “x” is
either a 1 for Force readings or a 0 for Length readings. The Specified Force also needs to be set to specify what
15
to read and has the Syntax “SF|x” where “x” is either “F” for force readings or “L” for length readings. Since the
new testers can send out two pieces of data this command can be used to read both first and second pieces of
data by having one command wait for new data and the other use the previous data. To specify the command to
wait for new data the Specified Absolute/Incremental setting is set to a 1, the syntax is “SI|I” (letter i’s). To specify
the command to use the previous data use the syntax “SI|A”
6) Larson TWCS
This command is represented by the letter “O”. This command allow communication with a Larson Torque Wrench
Calibration System through RS232. The serial port that is to be used is specified in Specified Speed and has the
syntax “SS|x” where “x” is a number between 1 and 10 that represents the serial port that the TWCS is connected to.
An option nominal force can be specified and is specified in Specified Length. It can be specified as a constant, a
variable, or the result of a test point. An example of the syntax is “SL|C12” and represents a constant value of 12.
An optional tolerance is specified in the Specified Tolerance and the syntax is similar to the nominal value entry.
The tolerance can be specified as either a percentage or a whole number. The case of the letters “C”, “V”, or “R” in
the syntax represents how the tolerance is defined. An upper case “C”, “V”, or “R” represents a percentage number,
a lower case “c”, “v”, or “r” represents a whole number.
7) Larson Super TWCS
The Larson STWCS is set up similar to the Larson SDHT, #4. The difference is in the Specified Speed setting,
what data to read. The STWCS can send only Manual Force, “B”, Peak Force, “D”, or First Peak Force, “T”.
3.3.5 Miscellaneous
From the Miscellaneous item under the Options menu item there are 5 other option you can set.
First, you can have results sent automatically to a printer
as they come in. This can be specified for each port
separately.
Second, you can specify what is printed on the first two
lines of the printouts, typically it is your company name
and city.
Third, you can specify what is displayed in the title bar of
the SSS program itself. This may be comments about
what devices are connected to the SSS.
Fourth is how many lines per page will be printed out. You
can increase or decrease this as you like. Decreasing this
number will leave white space on the bottom of some of
the longer printouts.
Lastly is how many standard deviations will be used for
control limits. This number is typically 3 but can be set to
anything from 1 to 9.
Click OK when you are finished specifying these options.
3.3.6 Excel Template
The SSS 3.13 shipped with a SSS template that mimics many of the features the SSS has. This template does contain
macros and Excel may ask you if you want these macro enables. Larson does hope you consider us a trusted source for
the macros. The macros are coded in the Visual Basic Script language.
These macros are not protected. They are open to inspection and alteration. Larson Systems will hold no liability if
these macros are altered. It is advisable that at least one copy is saved in a secure location as a backup.
When you choose the Launch Excel Macro from the Options menu the SSS will try to start Microsoft Excel. If the SSS
cannot find the Excel.exe program it will ask you to find it. The SSS will try to start Excel with the SSS Template. If the
SSS cannot find the “UTM Template.xls” program you will have to find it. It should have been installed in the same
directory as the SSS program itself.
16
The SSS Template will load data from any SSS result file. The corresponding Specification file must be present in the
same directory for various features to work. The Template will automatically calculate statistics and can create similar
graphics as the SSS .
If you want features that the SSS does not have you can alter the SSS Template to create them.
3.3.7 Demos
The SSS comes with 2 interactive demos. These demos are here to help explain various features of the SSS . To start
any of the demos select the Options menu item, highlight the Run Demo item and another list will be presented next to
the main Option list. Select one of these 6 demos and it will start.
The demos consist of an explanation window that will feature comments and explanations. From this window you can
use the Next and Back window to scroll through the entire demo. Most of the demos will load a Demo program and
results that should be in the same directory as the SSS program. If the SSS cannot find these files the demos will not
work properly. As the demos proceed they will open various result windows and graphics and explain what they are.
It is suggested that you take a few minutes and got through each demo.
3.3.8 About
When you choose the About selection from the Option menu a small window will open up and will give the SSS revision
number and Larson Systems address and phone number. If you have any questions about how the SSS works please
feel free to call us.
3.4 Getting Results
After you have programmed in a test you can start the test one of three ways: by starting one full test, start stepping
through the program, or by starting a continuous loop.
When no test is being conducted the button with the red stop light will be highlighted with a bright blue background.
When you click one of the other buttons it will become highlighted with the bright blue background and the red light will
have the normal background.
The green stoplight is used to start one full test. The test sequence will go through all of the test points and display the
results when it is finished.
To step though the test click on the button with the footprints in it. This will force one and only one test point to be tested.
When that test point is finished the test will pause and you will be prompted to press the Step button again to test the next
test point. When all tests points are finished the results will be displayed.
The button with the two blue arrows pointing to each other represents a continuous loop. When one test sequence is
finished the results are displayed and another test is automatically started. You must press the red stop light to break the
continuous loop.
Once the results are gathered you have the option of tagging or un-tagging tests from the Actual Results, Individual
window.
When you have tagged or un-tagged all the tests desired save the data. Once the data is saved the Set ends and no
more tagging or un-tagging is allowed. Saving data is the only way to end a Set in Interactive mode.
17
3.4.1 Saving Results
To save data to the disk either press the
save button in the button bar (the button with an arrow pointing to a floppy
disk) or select Save from the File menu
when results are in the SSS’s memory.
Results are saved with the same file
name as the specifications but with numerical extensions. The extensions start
with .001 and will continue to .999. The
SSS will try to save the results with the
lowest number. It will fill in holes in the
numerical sequence if there are any, i.e.
if a directory contains the files Part.001
and Part.003 and new data is save to
the Part file it will be save with the name
Part.002. From the File Open window
you can sort all of the files in the directory by either name or date modified. If
you sort by date modified you will be
able to see if such a hole has been filled.
3.4.2 Loading Results
When data has been saved to a disk it can then be retrieved. To load data either click on the File Open button in the
button bar (the button with an arrow pointing away from a disk) or use the Open command from the File menu. You can
load multiple result files at one time. If files with different names are selected only one of those names are used to load
the files. The SSS cannot load different files into its memory. The File Open window will accept multiple, disconnected
selections.
When you load data you will be asked where new data should be located. Your choices are to save new data in new sets
and new files, continue to add new data to an existing set creating an increasing larger file, or to defer the question until
new data is gathered. This set of choices can also be changed at any time after results are brought into memory by
selecting the Save Options item under the File Menu.
3.4.3 Clearing Results
To remove all results from memory but retain the test select Clear Results from the Results menu. If there are no results
in memory the Clear Results item is not shown in the Results menu.
18
3.5 Viewing Results
Once results have been brought into SSS, either by loading results or performing tests, different types of data can be viewed.
3.5.1 Individual Actual Results
With Individual results you can view every test point result for every test.
You can view the Actual data by selecting Actual Data from the Individual
item under the Results menu item. This window will display all the test
point results for one test. You can maneuver from test to test by using
either the Up/Down arrow or text box for Test Points. You can use the Test
Point arrows to maneuver between Sets or you can use the Up/Down arrows and text box for Sets on the very bottom of the Actual Data window.
3.5.2 Individual Statistics
Statistics show how the Set of data has behaved. It contains the mean, range, standard deviation, CP, CpK, and other
things. To view this window select Statistics from the Individual item under the Results menu item. The statistics
displayed are for current Set selected from the Individual Results window.
19
3.5.3 Individual Test Point Graph.
The Individual Graph will display the results of one test point across all of the
tests in a Set. This will show how that one test point varies over the Set. To
view this graph select Individual Test Point Graph from the Individuals item
under the Result menu.
Below the graph is the Zoom In and Zoom Out buttons and a scroll bar.
When you Zoom In to a graph you are changing the maximum number of
tests that are displayed in the x-axis to roughly half of what is currently is.
Once you have zoomed into the graph you can use the scroll bar to change
the minimum x-axis value thereby changing to a different group of tests being
displayed. The Zoom In button will work until there are only two points being
displayed. You can then use the Zoom Out button to display more tests on
the graph. The Zoom Out button will stop working once all the tests are being
displayed on the Graph.
To change what test point results are being viewed select a different test point
from the Test Specification window. To change what Set is being view select
a different Set from the Actual Results, Individual window.
To change other parts of the graph click the Option button in the graph window. The first option in the Option window is the maximum number of labels.
Changing this changed the number of ticks on the x-axis. This will put more
or fewer labels on the graph. If there are too many labels on the graph you will not be able to distinguish between them.
Vertical lines can be extended from each tick mark on the x-axis. To show these, check the Vertical Lines check box.
Specification lines, the mean line and +/- 3 Sigma control lines can also be displayed by checking the appropriate
option. You can zoom into the y-axis by changing the maximum and minimum limits in this window.
You can also change the graph title from the SSS generated default. This title will appear on the printout.
When you change any option you can click Update to apply these changed options to the graph and leave the Option
window open. When you click OK the changes are applied and the Option window is closed.
Click on any point in the graph to display a small information window that will display the actual value, the values of any
specification, mean, or control line, and the condition of the point. Click anywhere else on the graph to remove this
information box.
20
3.5.4 Lot Actual Results
A Lot of data is a predetermined number of individual tests that are
grouped together. The result of this grouping is a mean value for all
of the individual test points in the group. The number of tests in a
lot is controlled from the Results item under the Options menu (Section 3.3.2). The Lot Size can be changed at any time since the
resultant means are based on the Individual results, and these cannot be changed once they are in the SSS (they can, however, be
Tagged if the set has not been saved or was not retrieved from
memory).
To see the Actual Data, Lot select Actual Data from the Lot item
under the Results menu. This will bring up the Actual Data, Lot
window. From here you can view the mean data from the lot grouping. The grouping will start with the first result from the first set and
continue to the last result of the last set. If the number of results in
a set is not a multiple of the Lot size then results from one set will be
combined with the results from a different set. If the number of
results in all of the sets is a multiple of the Lot size no Set overlapping will occur.
3.5.5 Lot Statistics
The statistics for the Lot data consist of the same statistic categories as the Individual Statistics. To see these statistics
select Statistics from the Lot item under the Results menu.
21
3.5.6 Histogram
The Histogram applies only to Lot data. It shows the
distribution of all the data based on the minimum and
maximum reading. The number of categories is controlled from an option within the Option window for
the Histogram. The Histogram graph also shows a
normal line that shows if the data is evenly distributed
or if it is loaded to one side of another.
To view the Histogram, select the Histogram item from
the Lot selection under the Results menu.
To change other parts of the Histogram click the Options button from the graph window..
Maximum Number of Frequency Labels Displayed
controls the y-axis labels, these show how many tests
fall into a specific range of values.
Number of Bars controls how many ranges of values between the minimum and maximum values there are, these are
displayed on the x-axis.
You have to option change the default title for the histogram. This title will appear on the printout.
Click OK when you are finished changing the options.
22
3.5.7 X-Bar Graph
An X-Bar graph is similar to the Individual Test
Point but uses the Lot data. To view the X-Bar
graph select X-Bar Graph from the Lot item under the Results Menu.
To change what test point is being viewed select
a different test point from the Test Specifications
window.
Below the graph are Zoom In and Zoom Out buttons. Use these buttons to decrease or increase
the number of lots displayed in the graph. Once
you have zoomed in use the scroll bar to shift to
different groups of lots. You can zoom into the
graph until two points are shown and you can
zoom out only until all of the lots are displayed.
To change other parts of the graph click the Option button to see other options you can change.
Since the R-Chart is closely related to the X-Bar graph, options for the R-Chart are within this Option window. They can
only be accessed if the R-Chart is being viewed.
There are three options that are for both X-Bar Graphs and R-Charts. You can have vertical lines on both, display
control limits on both, and synchronize them to each other. Control limits are based on an Estimated 3 Sigma formula.
When you synchronize the X-Bar and R graphs they become the same width, same height, and the X-Bar graph is
shown above the R-Chart. From this view each point in the X-Bar graph lines up with its corresponding point in the RChart.
For the X-Bar graph you can also see the Specification limits and an X-Double Bar line, the mean of all the means
plotted.
You can zoom into the y-axis by specifying maximum and minimum limits and change the default graph title by specifying a new title. This title will appear on the print out.
Click Update to view the changed options without closing the Options window or click OK to enable the changes and
close the Options window.
Click on any point in the graph to display a small information window that will display the actual value, the values of any
specification, mean, or control line, and the condition of the point. Click anywhere else on the graph to remove this
information box.
23
3.5.8 Range Graph (R-Chart)
A Range graph displays the range of values within
one lot; this shows how variable the data is within
the lot. To view the Range Graph select R Chart
from the Lot item under the Results menu.
Below the Graph itself are a Zoom In and a Zoom
out button. With these buttons you can reduce
the number of lots displayed on the graph, this
will allow you to view a section of the graph in
more detail. Once you Zoom in a scroll bar will
appear to allow you to move between sections of
the graph. You can Zoom In until only two points
are displayed and you can Zoom Out only until
all points are displayed.
To view the control options for the R-Chart click
on the Options button above the graph.
Because the X-Bar and R-Chart graph are closely
related three options are shared with the X-Bar
graph. Vertical lines are display from each tick mark on the x-axis, which represents each lot. Control lines can be
viewed with the data. Control lines are based on an Estimated 3 Sigma formula. The X-Bar and R-Chart graphs can be
synchronized. This means that the graphs become the same width and height and are horizontally aligned with each
other. The X-Bar graph is displayed above the R-Chart. When one is moved or resized the other is similarly moved and
resized.
There are three options that pertain only to the R-Chart. The Range Mean line shows the average of all the Ranges. You
can zoom into the y-axis by changing the y-axis minimum and maximum. You can also change the default R-Chart title.
This title appears on the printout.
When you are finished changing any of the options click Update to view the changes without closing the Options window
or OK to enable the changes and close the Options window.
Click on any point in the graph to display a small information window that will display the actual value, the values of any
specification, mean, or control line, and the condition of the point. Click anywhere else on the graph to remove this
information box.
24
3.5.9 Moving Average Graph.
The Moving Average Graph shows trends over a group of lots by averaging together a certain number of Lots then moving one Lot down and
averaging together another group. Example, it the moving size is 5 Lots
1 to 5 are averaged and plotted for location 5, then Lots 2 to 6 are averaged and plotted for Lot 6, 3 to 7 for 7, 4 to 8 for 8, and so on. This
method tends to dampen out one time spikes in the readings.
To view the options available for the Moving Average Graph click on the
Options button above the graph. Vertical lines can be shown from each of
the tick marks on the x-axis, the Lot Number line. Control limits can be
view with the plot. Control limits come from an Estimated 3 sigma formula like the X-Bar and R-Chart. A Mean line can be shown on the plot.
The Mean line is the average of all the points plotted. The y-axis can be
zoomed into by changing the y-axis minimum and maximum. The default
graph title can also be changed. This title appears on the printout. The
Moving Group size can be changed from here. This controls how many
Lots are grouped together for each point plotted.
When you have finished changing any of the options click the Update
button to see the changes to the graph without closing the Options window or click OK to enable the changes and close the Option window.
Click on any point in the graph to display a small information window that will display the actual value, the values of any
specification, mean, or control line, and the condition of the point. Click anywhere else on the graph to remove this
information box.
25
3.6 Printing Results
Every result and graph window has a print button. Click on any Print button to print out the contents of the particular
window. The text based printouts are the Test Specifications, the Sorting Table, Individual Actual Results, Individual
Statistics, Lot Actual, and Lot Statistics. The graph printouts are the Individual Test Point Graph, the F Vs L graph, the
X-Bar graph, the R-Chart, the Histogram, and the Moving Average Graph.
The SSS also has an Overall Print button. It is the button with a printer symbol in it in the button bar. This button will
cause every open window to print. It is a quick way to print out a combination of windows. The SSS has the ability to
create predefined combinations of windows. See section 3.7.2, window layouts.
3.7 Other Features
3.7.1 Merging Files
If you have a group of results files that you would like to be stored as one large file instead of multiple small files the SSS
has a utility that can merge multiple files into one large file. To start this utility click Merge File under the File menu.
To start you can pick what drive and directory your files are in. When you highlight a specification file from the Specifications Files list any result files will be listed in the Result Files list. From the Result Files list you can select all of the
files you want merged into one. The Result Files list allows multiple and disconnected selections. Once you have
selected all of the files to merge together you must select what name to call the merged files. In order to open the
merged files you must retain the same name but you can change the numerical extension. You can choose an existing
file from the Destination File list or create a new extension from the Destination File text box. When you have selected
a destination file you can merge the files together. To merge the files and stay in the Merge Results File utility click the
Merge & Stay button. To merge the files and exit the utility click Merge & Close. To exit the utility click Cancel.
26
3.7.2 Window Layouts
With Window Layouts you can select a predefined combination of result windows to be displayed and you can also
define where each window appears. The UTM ships with 5
layouts already in memory. The default layout is Free Form.
Free Form enforces no layouts. Windows are brought up
in no specific place and in no particular combination. The
only windows that are automatically shown are the Individual Actual Results and Individual Statistics. These windows are automatically brought up in Free Form when the
first results of the first set are gathered.
3.7.2.1 Selecting a Layout
To select any Window Layout click the Layout Button from the button bar, it is the button with the generic graphs on it;
it is also the farthest button to the right in the button bar. You will be prompted to select a layout from the Setup Name
drop-down list. To start the layout click OK, to abort the layout click Cancel. When you click OK and there are results
in memory the windows selected in the layout will open and be placed in their predetermined locations. If no results are
in memory the result windows will not be displayed.
3.7.2.2
Creating/Modifying/
Deleting a Layout
To create a layout select the Define Layout
from the Edit Custom Layout item under the
Window Menu. You can select an existing
layout or create a new one. To create a new
layout click the Add New Layout button. You
will be prompted to give a name to this layout. Click OK to continue the creation.
If you no longer use a layout you can remove it from the list. First select the layout
you want removed from the Layout name
drop down list. Next click the Remove Old
Layout button. You will be prompted to confirm the removal of the layout. To finish the
removal click OK. To leave the layout in
the list click Cancel.
Once you have created a new layout or selected an existing layout you can choose
what windows are opened for the layout. Do
this by checking the boxes next to the window name in the Window used in current
Layout list.
3.7.2.3 Layout Options
There are two options associated with each layout. If they are enabled they are processed each time the Layout button
from the button bar is clicked. The first is the option to open the File Open window. If this option is enabled the File
Open window is opened when a new layout is selected.
The second option is to automatically start a test. If a test is loaded into memory, either by creating it or loading it from
memory, the test will be started.
27
3.7.2.4 Screen Positioning
Once you have a layout defined you can determine where each window will appear and save that window placement.
You will first have to load results in memory in order to see the result windows. Do this by either creating and running a
test or loading results from memory.
When results are in memory bring up the layout by clicking on the Layout button from the button bar (the far right button
with the graphic symbols in it) and selecting a layout from the list. The windows in the layout will open up either in a
default position if it is a new layout or their previously determined position if it is an existing layout. Position and size the
windows as you want them
When the windows are in the position you want then click the Arrange Windows item from the Edit Custom Layouts
under the Windows menu. You will be prompted to arrange the windows the way you want them. Click OK to save the
window placement or Cancel to abort the placement. If you choose to abort the layout is still saved, the existing
placements are simply not changed.
3.7.2.5 Reverting to Free Form
You can revert to Free Form layout one of two ways. The first is to click on the Layout label next to the Layout button in
the button bar. The second is to click the Layout button and open the Choose Layout prompt. Below the drop down list
is a Free Form check box. Check this box and the drop down list is disabled and becomes grayed out. Click OK and the
Free Form layout is enabled.
No windows are closed, repositioned, or resized when you revert to the Free Form layout.
28
Larson Systems Inc.
763-780-2131
10073 Baltimore Street NE
1-877-780-2131
Minneapolis, MN 55449-4425
Fax: 763-780-2182
www.larsonsystems.com
[email protected]