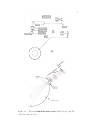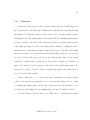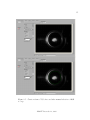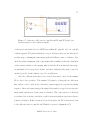
1
Stochastic Transport in PPCD Discharges
by
You Ming Yang
A dissertation submitted in partial fulfillment of the
requirements for the degree of
Master of Science
(Physics)
at the
University of Wisconsin – Madison
2010
i
Contents
1 Introduction
1.1
The Reversed Field Pinch . . . . . . . . . . . . . . . . . . . . . . . . .
2 Thomson Scattering
1
1
6
2.1
Beamline . . . . . . . . . . . . . . . . . . . . . . . . . . . . . . . . . . .
2.2
Laser Power Supply Upgrade . . . . . . . . . . . . . . . . . . . . . . . . 20
3 MST Plasma Characteristics
6
31
3.1
Improved Confinement Discharges . . . . . . . . . . . . . . . . . . . . . 31
3.2
Mode Activity and Electron Temperature Evolution . . . . . . . . . . . 31
3.3
Equilibrium Reconstruction using MSTFit . . . . . . . . . . . . . . . . 42
4 Summary and suggestions for future work
57
4.1
Summary . . . . . . . . . . . . . . . . . . . . . . . . . . . . . . . . . . 57
4.2
Suggestions for refinements and future work . . . . . . . . . . . . . . . 59
A Alignment
66
B FLPSCS Interface
72
ii
C Mode Analysis
81
D MSTFit Misc.
86
D.1 Transport Calculations . . . . . . . . . . . . . . . . . . . . . . . . . . . 86
E Calculating χst
89
F Island width calculation
91
1
Chapter 1
Introduction
1.1
The Reversed Field Pinch
The Reversed Field Pinch 1 (RFP) is a type of plasma confinement device used in
the pursuit of understanding the physics that govern magnetically confined plasmas.
RFP’s are characterized by a toroidal shape with an often circular cross section, and a
low externally applied toroidal field. In an RFP, the equilibrium field configuration is
one where the toroidal magnetic field is strongest at the core, falling off radially and
eventually reversing, while the poloidal field increases radially (fig 1.1). The reversal
of the toroidal field gives the RFP (Reversed Field Pinch) its name.
The field configuration of the RFP arises from the solution to Taylor’s 2 equilibrium in a cylinder, which can be obtained by minimizing energy with global magnetic
helicity held constant, this is approximately the case in conditions where the timescale
for energy dissipation is much shorter than the dissipation of global magnetic helicity.
Meeting this criteria results in the requirement that ∇ × B = λB. One may set λ to a
constant and take the curl of this equation in a cylindrical basis, to arrive at solutions
to the magnetic field to be Bessel functions. These solutions are similar to the fields
DRAFT December 19, 2010
2
Figure 1.1: Illustration of RFP field configuration.
seen in an RFP. It is important to note that the plasma current is proportional to
B with ∇ × B = µ0 J, and as plasma pressure is related to the current and B by
J × B = ∇P we see that this requires plasmas in a Taylor equilibrium to have a flat
pressure profile:
∇P = J × B =
λ
∇×B
= B×B =0
µ0
µ0
As real RFP’s do not have perfect cylindrical symmetry, have higher plasma pressure
in the core than the edge, and are heated ohmically, they do not operate in the Taylor
equilibrium configuration, instead constantly relaxing towards that state.
The Madison Symmetric Torus 3 (MST) is one such RFP, with a major radius
of 1.5m, and a minor radius of 0.52m. MST plasma discharges are heated ohmically,
with plasma current primarily being driven toroidally in the core. During MST operation, the plasma can be seen relaxing towards the Taylor equilibrium. The field
configuration of an RFP such as MST can be described by a parameter q(r) =
At the radial locations where the q becomes rational or q =
m
,
n
rBφ
.
RBθ
unstable modes reside
and can grow, the dominant modes being m=1 modes. These modes are driven by the
DRAFT December 19, 2010
3
gradient in the parallel current, and form islands centered on the rational surfaces.
In a standard discharge, the overlap of these islands result in a stochastic equilibrium field throughout the entire plasma, resulting in very high energy transport. The
Rechester-Rosenbluth 4 model of stochastic transport describes this stochastic energy
diffusion (for a collsionless plasma) as a double-diffusion process by which particles,
tied to the magnetic field lines diffusing radially proportional to the radial component
of stochastic field Dm ∼
b2r
,
Bz2
collide and transfer energy at a rate proportional on the
electrons’ parallel thermal velocity:
χe,stoch ∼ Dm
λmf p
τcollision
= Dm vT e
Stochastic energy transport in MST has been successfully compared this model by
Biewer et al. 5 .
One method of improving energy confinement on MST is to reduce the stochasticity of the plasma, thereby reducing the stochastically driven transport. This is
done by reducing the plasma’s own drive to reduce the gradient in the parallel current
profile. To do this, we apply an external current profile control method called Pulsed
Poloidal Current Drive 6 (PPCD). PPCD inductively drives poloidal current in the
edge (where it is the parallel current) of the plasma. This modification of the current
profile offers a dramatic improvement in plasma properties 7 , including the reduction
of island widths and a correspondingly lower level of stochasticity, the elimination of
sawtooth crashes, healed flux surfaces, and much higher core electron temperatures as
a result of a dramatic improvement in electron energy confinement. While PPCD discharges show much better performance on the metrics of energy confinement and peak
DRAFT December 19, 2010
4
core plasma temperature, they also exhibit high shot-to-shot variability between discharges that have very similar starting conditions. This shot-to-shot variability offers
an opportunity to examine the impact of stochasticity on varying confinement quality.
Understanding, and predicting the causes of this disparate behavior will also benefit
not only the optimization of PPCD, but more advanced current drive techniques in
the future.
A diagnostic that has been crucial in helping illuminate the behavior of RFP
plasmas such as those in MST is the Thomson Scattering 8 diagnostic. Thomson scattering (TS) is the process by which charged particles are accelerated by an incident
electromagnetic field, and re-emit radiation due to that acceleration, scattering the
incident wave. The frequency of the incident wave is shifted by the velocity of the
charged particle and the direction of scatter. By comparing the spectrum of scattered
photons to what one would expect with a Maxwellian distribution at a given temperature, the temperature of the scattering particles can be gleaned. In low field magnetic
plasma confinement devices such as those in the Madison Symmetric Torus (MST),
passive diagnostics such as Electron Cyclotron Emission (ECE) do not work as the
plasma is overdense, and diagnostics such as Soft X-Ray (SXR) experience contamination from aluminum lines 9 . Therefore, Thomson scattering is an invaluable tool for
accurately determining the electron temperature of the plasma in these devices. In
MST, the incident electromagnetic wave is a monochromatic Laser beam at 1064nm
that travels 15m through an enclosed beamline, ultimately passing through the plasma
volume (see Chapter 2) and scattering off of the electrons. The scattered light from
21 radial positions is collected and from this data a temperature profile of the plasma
DRAFT December 19, 2010
5
can be created.
This thesis will describe the implementation of various upgrades, to both the
beamline and laser system, that have streamlined the day-to-day operation of the system. Additionally, a pulse-burst upgrade to the laser system has greatly increased
the amount of temperature data that can be collected during each MST discharge or
shot, allowing for resolution of fast plasma dynamics for fluctuation measurements
(Stephens 10 ), and the time-resolved evolution of the plasma electron temperature
profile. The latter capability has allowed for unprecedented single-shot analysis of
discharges that have a high shot-to-shot variability, such as Pulsed Parallel Current
Drive (PPCD) discharges. Single-shot analysis of PPCD performance suggests a possible correlation between performance and m=1, n=8-15 magnetic fluctuations, near the
reversal surface. An investigation of the effect of stochastic transport in this improved
confinement regime is presented.
DRAFT December 19, 2010
6
Chapter 2
Thomson Scattering
2.1
Beamline
The Thomson scattering diagnostic on MST currently uses two commercial Spec-
tron 11 (SL858) lasers located in a laser room across a public hallway from the MST
experiment. After exiting the laser head, the laser beam is directed underneath and
across the hallway which separates Thomson scattering from MST, over and above
the machine, and finally down vertically through the machine vessel, as can be seen in
figure 2.1 (Reusch et al. 12 ). A seven-element lens is used to focus scattered laser light
onto 21 optical fiber bundles. This scattered light travels to filter polychromators 13 ,
containing filters that select out specific wavelength regions to pass onto avalanche
photodiode detectors.
The incident laser beam undergoes 5 turns before scattering off of the plasma,
and the overall length of the beam path is over 15m. With this setup the beam
alignment can be observed to drift throughout the course of the day. This drift is
more pronounced during summers, and has been attributed to thermal expansion
and contraction the building undergoes in various parts of the 15m beamline. If left
DRAFT December 19, 2010
7
DRAFT
December
19, 2010
Figure 2.1: TS Beam Path
from
clean room
to MST (above), and TS
collection optics (below).
8
Figure 2.2: Illustrations of good alignment and poorly aligned scattered
laser signal relative to optical fiber bundle.
uncorrected, the beam can drift out of the field of view of the collecting optics (2.2),
resulting in reduced scattered light and poorer quality of data.
To counteract this, the beamline is equipped with remotely actuated turning
mirror mounts and CCD cameras, mounted as shown in figure 2.3. The beam spots
of the lasers incident on the turning mirrors are imaged by the CCD cameras.
During day-to-day operation, a Thomson Scattering operator would monitor the
alignment and beam position. When the beam deviated from the center of of the
turning mirror, a command could be sent to a turning mirror earlier in the beamline
to adjust the position of the beam spot. Hardware limitations of the camera imaging
equipment allow only one beam spot on one turning mirror can be imaged per laser fire.
Additionally, the variations in orientation of mirror-mounts, motor control hysteresis,
and camera positioning setups between turning mirror stages meant that the same
commands sent to different turning mirror stages could have very different impacts on
DRAFT December 19, 2010
9
Figure 2.3: Mirror mount and Pulnix Camera in a beamline.
how they changed the beam alignment.
Due to these difficulties, ensuring proper alignment of the beamline required
constant supervision by an experienced Thomson scattering operator. At the start
of the day, the operator would find the ideal beam position for optimum collection
of scattered photons. As the day progressed, the operator would need to correlate
any deviation in beam alignment with a reduction in scattered photons, suggesting a
misalignment. Then the user would input the appropriate commands to the turning
mirrors to readjust the beam positions to what was optimal. Building on this system,
an automation upgrade to the alignment system was implemented.
DRAFT December 19, 2010
10
2.1.1
Calibration
In principle, the positions of the beam spots in the stage above MST (stage m in
fig 1.1) and in the beam dump (d) determines the path that the beam takes through
the machine. To adjust the position of the beam spot above the the machine requires
adjusting the tilt of the turning mirror on the East Wall (w); adjusting turning mirror
at stage w will also affect the beam’s subsequent path (m) and final position in the
beam dump (d), imaged by the beam dump camera. Similarly, adjusting the tilt of
turning mirror m just changes the final position of the spot d. The tilt of the turning
mirrors are adjusted via orthogonal directions subsequently referred to as directions
Aw and Cw for the wall, and Am and Cm for above the machine. Due to their varying
orientation, adjusting just one stage in one direction (for example Am , will have an
impact on both the X and Y positions of the beam center in subsequent stages. We
can write Xm and Ym , Xd and Yd as the coordinates (in pixels) of the beam center as
recorded by the Pulnix cameras.
Using coefficients a, c to convert from units of translation to change in pixel
position, and using the representation axwm to represent the change in X as a result
of adjusting the turning mirror on the wall, on the stage above the machine etc., we
can write the relationship between adjustments in A’s and C’s with X’s and Y ’s.
For the changes in X,Y in stage above MST due to a change in the turning
DRAFT December 19, 2010
11
mirror located at the East Wall:
Xm = axwm Aw + cxwm Cw
Ym = aywm Aw + cywm Cw
(2.1)
The beam dump can be affected by two turning mirror stages:
Xd = axwd Aw + cxwd Cw + axmd Am + cxmd Cm
Yd = aywd Aw + cywd Cw + aymd Am + cymd Cm
Here, it is also useful to note that for the beam dump, Xd and Yd are modified
by changes in both the wall turning mirror stage, as well as the stage above MST.
However, changes from the wall stage are generally unwanted, and instead corrected
for by the above MST stage.
Calibration was performed by taking repeated measurements of changes in X
and Y on the stages above MST and in the beam dump by adjusting A and C at
the wall and above MST, then the coefficients were computed and hardcoded into the
auto-alignment software. It is also important to note that there is often a fair amount
of hysteresis in the turning mirror motors, such that for example, moving 1000 units
in A and then -1000 units in A will not result in returning to the original position. As
such, the above a’s and c’s must be solved for twice, once in positive moves in A and
C and again for the opposite direction.
DRAFT December 19, 2010
12
2.1.2
Alignment Algorithm
Much of the calibration and implementation of the automated alignment pro-
cedure relies on the use of the National Instruments Image Acquisition (NI-IMAQ)
development package, of which the following functions were highly utilized for this
purpose: a function to calculate the geometric center of intensity of a black and white
image in a selection region of interest, the ability to store and retrieve custom regions
of interest and data. The implementation for the automated alignment setup was then
broken down into two components:
Once ideal alignment had been achieved via manually adjusting the turning
mirrors, a ”create-reference” program would be executed to record the beam positions
on each turning mirror for each laser. A region of interest (ROI) for each turning
mirror is selected to calculate the beam center (used to crop out bright scattered
artifacts from mirror mounts, reflections, etc.), then the ROI and center of the beam
spot is saved to a reference file.
An ”autosteering” program is then used for day-to-day operation. After a data
taking discharge, the camera is triggered with individual laser pulses, recording the
location of the beam on each of the turning mirrors. The beam center is then calculated
using the same ROIs as those stored in the reference files, and the new beam center
compared to the stored reference position. If the pixel deviation (X’s and Y ’s) is higher
than 10 pixels total on any stage, the turning mirrors are adjusted via the calibration
calculated above. The end result is an automated beam alignment program that
requires much less user supervision than the previous iteration.
DRAFT December 19, 2010
13
Figure 2.4: An example of using the calibrations to fix mis-alignment in
the stage above MST.
2.1.3
Alignment Implementation
This section refers to the implementation of the alignment algorithm within Lab-
view. Small Labview icons and their features will be described, and a more complete
back-panel can be seen in the appendix (A).
The initial alignment of the TS system is an involved process discussed elsewhere 14 , and will only be briefly outlined here. The mirrors in the Spectron beamline
are replaced with dichroic mirrors that allow propagation of visible HeNe diode lasers–
to which the 1064 beam is aligned–down the beamline, through MST, and into the
beam dump. The bundle of collection fibers are aligned to a beam probe that is inserted into MST from the beam dump port. In general, with the incident laser beam
DRAFT December 19, 2010
14
exiting through the same port that the beam probe is inserted through, a rough alignment can be achieved which results in at least some scattered laser light to be within
the FOV of the fibers. Additional manual adjustments of the turning mirrors allows
the user to maximize the number of collected photons. This last step is currently
unavoidably time consuming, as it requires a plasma for the incident laser beam to
scatter off of, allowing only one or two adjustments total every few minutes.
Once optimum alignment has been achieved, the next step is to create calibration
files used in the automated alignment program. A Labview VI was created for such
a purpose, and has a front panel which allows the user to select a specific turning
mirror stage and laser to create references for. The full FOV of the camera captures
the scattered light of not only the beam spot imaged on the turning mirror, but also
additional artifacts due to scattered light, such as the mirror mount and sometimes
reflections of the camera itself. To most effectively utilize NI-IMAQ’s built-in intensityaveraging subVI, the camera image is displayed on the front panel, and the user may
select an outline within the image to be cropped to a specific ”region of interest (ROI)”
for processing (2.5).
In the back panel, upon execution the program waits on a ”camera acquire”
trigger which acquires what a specific camera stage sees within a 16ms time window.
This trigger is sent to the camera right before a laser of interest is fired, allowing for
the selection of one laser beam on one camera stage. This acquired image is displayed
on the front panel where the user selects an outline to use as an ROI. This ROI serves
as an image mask, cropping out any of the image beyond the selected region. The
remaining region is then input into the NI-IMAQ Centroid subVI, which does the
DRAFT December 19, 2010
15
Figure 2.5: Create reference VI, before and after manual selection of ROI
to crop.
DRAFT December 19, 2010
16
Figure 2.6: Reference image mask file used for auto-alignment.
aforementioned intensity averaging, giving the pixel locations of the intensity centroid
which calculates the center of the intensity in the X and Y directions as:
X =
Σx ∗ I(x)
ΣI(x)
(2.2)
(2.3)
Y
=
Σy ∗ I(y)
ΣI(y)
(2.4)
Where x and y represent a pixel’s coordinates and I(x, y) is the numerical value of the
intensity for a pixel at that given x or y position, and the sum is taken over all pixels.
For the eight bit pixels used in the alignment code, the intensity can range from 0 to
255, where 0 is a black pixel with no energy and 255 is a white pixel with the most
energy.
As the orientation of the cameras and mirrors vary between stages, a different
image mask is created and used for each mirror stage.
The output of this routine is stored as a proprietary IMAQ data file format,
which simply consists of the image mask (stored as a .png) and X-Y pixel coordinate
DRAFT December 19, 2010
17
Figure 2.7: Reference call to motor-controller subVI, with X-Y pixel deviations in stages m and d taken as inputs.
of the laser beam (embedded as ASCII data within the .png file 2.6). As each file
contains separate X-Y pixel information, one per each laser, there are two files stored
per laser stage containing the same image mask and different center coordinates. Very
often, the relative alignment of the components in the beamline–such as the orientation
of the cameras relative to the turning mirrors and the fiber mount and lens setup–
are undisturbed for long periods of time, and these calibration files may be used for
extended periods of time without a need for recalibration.
Once the calibration files have been created, they may be used by the runtime
VI for day-to-day operation. The runtime VI begins by loading the six calibration
files, and proceeds to wait on six consecutive camera triggers in a specific laser firing
sequence. After each camera trigger, the imaged laser pulse is cropped by its respective
image mask, and the new beam center is calculated. The beam center for both lasers
is calculated for each stage, and their overall deviation from their respective reference
points is calculated. If this deviation is beyond 10 pixels, the XY deviations are sent
to the calibrated motor-controller subVI which corrects for alignment (2.7).
DRAFT December 19, 2010
18
Figure 2.8: Previous beam-line alignment interface, consisting of two separate VI’s. One VI images the beam spot (right), the other offers manual
controls for the user to correct for beam mis-alignment (left).
In this subVI, the previously calculated movement-to-pixel calibrations have
been hardcoded. The X-Y pixel deviation inputs to this VI are multiplied by their
appropriate calibration factor, and sent to the motor controller for automated alignment. A copy of the back-panel along with calibration values can be found in the
Appendix (A).
The end result is the automated (2.9) optimization of a manual laser alignment correction method that eliminates the need for an experienced TS operator to
constantly observe and manually correct the beam alignment (2.8), and the new capability to record optimum alignment positions and automatically adjust to them on
subsequent run-days.
DRAFT December 19, 2010
19
Figure 2.9: Automated beam-line alignment program with beam spot images for both lasers for stages w, m, and d.
DRAFT December 19, 2010
20
2.2
Laser Power Supply Upgrade
As previously mentioned, a major upgrade to the Spectron laser Thomson scat-
tering system has been the replacement of the old commercial power supplies with
one made by UW-Madison’s Physical Sciences Lab, allowing for improved operational
versatility of the Spectron lasers over the previous commercial incarnation. The new
power supply features fast IGBT switched capacitor banks that can be fired at various
pulse width and duration. This system is composed of a capacitor chassis, pulse drive
chassis, capacitor control box, and master control box. The heart of the control system
is C/Assembly code programmed onto Rabbit microprocessor boards. These boards
perform various functions such as controlling IGBT pulse duration and timing, setting
capacitor charge voltage and simmer toggle, as well as performing various status and
error checks. This power supply was used in conjunction with two Jorway 221-A timing modules, which are capable of generating a 16 second long sequence of pulses with
1µs resolution. The fruits of the labor that went into the Spectron TS system is the
capability to operate at a variety of ”pulse-burst” modes 15 where multiple laser pulses
can be achieved with one flashlamp pulse, enabling laser pulse repetition rates from
1kHz-12.5kHz per laser. The two Spectron lasers were also operated in an interleaved
format on a regular basis, resulting in 2kHz-25kHz data acquisition rates. Achieving
these modes of operation involves direct control over both the flashlamp as well as
Pockels cell timing.
DRAFT December 19, 2010
21
2.2.1
Python Interface
The control and timing system of the power supply is referred to as the Flash
Lamp Power Supply Control System (FLPSCS) and interfaces with a PC via simple
serial communication for setting parameters such as pulse width, pulse delay, flashlamp
voltage, etc. for each channel, as well as querying various statuses like capacitor charge
and simmer status. While robust, the serial communication scheme requires the user
to manually enter numerous commands and status checks per each channel. For the
Spectron lasers, four channels were used for each laser (8 channels total), and for the
Fast Thomson 16 , all 19 channels of the power supply would ultimately be used.
The FLPSCS was programmed to take properly formatted serial commands, and
send a response immediately after. Voltage programming commands are received with
a confirmation, a query for previous settings returns the set value, and status or error
checks give the corresponding state of the system. Aside from the solicited responses,
there are additional unsolicited responses the FLPSCS is capable of sending. Between
discharges the system performs a self-diagnostic error check for a potential Gate Driver
Board fault, and will send an unsolicited error message if such a fault exists. The same
occurs if the emergency stop is triggered. Additionally, if the system is in E-stop mode,
or Run mode, it will not send any responses to the user.
This motivated the creation of a graphical user interface that could automate
many of the aforementioned tasks, develop the best implementation to interface with
the control system, as well as reduce the workload required of a TS operator when
programming the power supply for the desired mode of operation.
DRAFT December 19, 2010
22
Figure 2.10: Flow chart for FLPSCS Control Interface.
DRAFT December 19, 2010
23
For ease of use, testing and modification, a GUI interface in Python was created.
The back-end was programmed in Python, and the front end utilized PyQT, a Python
wrapper around the QT graphics package. Formatting of the serial commands and
graphical implementation aside, the main efforts of the power supply interface went
into the method of handling the serial I/O.
Taking advantage of Python’s multi-threading capabilities, the I/O communication was broken down into four main parallel threads(2.11): a serial-send thread,
and a serial-read thread, a sorting thread, and a status checking thread. The sending
thread would monitor an internal command queue, and send any commands from the
command queue to the FLPSCS, with a built in delay that allowed the FLPSCS to respond with its expected solicited response. The receiver thread would monitor inputs
on serial port, and send all responses to a response queue that is then processed by a
sorting thread, which identifies the response and updates the appropriate status indicator. The status-checking thread periodically fills the command queue with queries
for charge voltage, simmer status, and other various updates.
When the status thread is operating, there is a ”thread lock” on the status
thread that ensures it has priority for populating the command queue. When a user
programs the system for operation, the program thread requests the lock, waiting for
the status check to finish first if necessary, and then proceeds to fill the command
queue with programming commands. A similar lock is used for the serial-send thread
itself to disable the sending of commands when the system is in Run mode.
DRAFT December 19, 2010
24
Figure 2.11: Algorithm for FLPSCS Control page 1.
DRAFT December 19, 2010
25
Figure 2.12: Algorithm for FLPSCS Control page 2.
DRAFT December 19, 2010
26
2.2.2
Timing Algorithm and Implementation
The design of the upgraded power supply system already allows for repeated
triggering at ∼1ms intervals, allowing for much more potential than the commercial
power supplies. However, many different components of the TS system had to be
coordinated together for the Spectron lasers to fully take advantage of the new power
supplies. While the timing could have been implemented in a variety of ways –and is
indeed in the process of being upgraded to a more compact system– a very functionally
elegant solution was implemented with the hardware available at the time.
The main focus of proper timing implementation is the capability of reliably and
consistently generating 2J laser pulses, while at the same time minimizing the stress
on the flashlamps. As previously mentioned, the timing scheme for the Fast Spectron
is controlled by two Jorway J221-A modules, and the FLPSCS Master Control chassis.
An MST trigger to begin TS data collection is sent to one of the two Jorway modules. This module is used to control the ”macro” (∼ms) timing and determines the
frequency of the flashlamp burst pulses. Once the macro Jorway triggers the master
control chassis of the power supply, there is a ∼10µs jitter for the drive system to respond before initiating the flashlamp pulses. Once the flashlamp bursts begin, a sync
pulse, with a ∼1µs jitter relative to the flashlamps, is sent to the the second ”fast”
J221 module, which then with triggers the Q-switch and digitizers on order ∼µs timing, generating a laser pulse and digitizing any data from the scattered signal. This
method allows the lasers to be Q-switched within ∼1µs of their optimal charge time
and digitize at the proper time with respect to the flashlamp bursts, minimizing the
DRAFT December 19, 2010
27
Figure 2.13: Flow chart for FLP timing of a pulse-burst sequence.
time that the flashlamps are on, while ensuring optimal pumping of the rods before
lasing. This implementation allowed for the capability of taking data at rates ranging
from 2kHz, to 25kHz in ”pulse-burst” mode (fig 2.13).
The Jorway J221-A modules function by receiving two input arrays, one for time
(µs) after an input trigger, and one to turn any number of channels (referenced via bitnumber+1) high-low corresponding to that time. For example, two arrays consisting
of: (0,5,10) and (6,2,0) would have the Jorway turn on channels 3 and 2 on at t=0,
and then leave only Ch. 2 on after t=5µs, then turning everything off at t=10µs. The
Jorway modules are interfaced with GPIB via low-level Labview drivers.
DRAFT December 19, 2010
28
2.2.3
Timing Schemes
By using the basic pulse-burst hardware and timing scheme above, the simple
modification of certain parameters such as flashlamp pulse widths and delays, and fast
J221 triggering, allows for a variety of TS operation modes.
Single Pulse Operation(fig 2.14): The most basic and commonly used mode
of operation is the interleaved mode of two lasers firing in Single-Pulse mode. In this
mode after the MST trigger, the macro J221 sends master triggers spaced 1ms apart
to the FLPSCS. For each master trigger received by the FLPSCS –after a 10µs jitter–
at t=0 the four channels driving the first laser’s flashlamps fire for a 150µs duration
pulse. At t=140µs (to allow for an optimum population inversion in the rods) the
fast J221 triggers the Q-switch for the first laser and digitizers. After a 500µs delay,
the four channels driving the second laser’s flashlamps fire for a 150µs duration pulse.
140µs into the second pulse, at t=640µs, the fast J221 triggers the digitizers and Qswitch for the second laser. This results in two pulses spaced 500µs apart repeating
every 1ms for 2kHz operation.
Triple Pulse Operation(fig 2.15): An excellent demonstration of the pulseburst mode of operation is the interleaved mode of two lasers firing in Triple-Pulse
mode. In this mode after the MST trigger, the macro J221 sends master triggers
spaced 1ms apart to the FLPSCS. For each master trigger received by the FLPSCS
(after a 10µs jitter) at t=0 the four channels driving the first laser’s flashlamps fire for
a 310µs duration pulse. At t=140µs (to allow for an optimum population inversion in
the rods) the fast J221 triggers the Q-switch for the first laser and digitizers. Each laser
DRAFT December 19, 2010
29
Figure 2.14: Two lasers interleaved in Single-pulse mode capable of 2kHz
operation for 15ms.
pulse only partially depopulates the rod, and after a short 80µs repopulation period
another laser pulse of 2J energy can be fired again. The Q-switch and digitizers are
triggered again at t=220µs and t=300µs. For the second laser, a pulse delay of 40µs
is used. The second laser’s lamps are fired for the same 310µs duration pulse. The
fast J221 triggers the digitizers and Q-switch for the second laser at t=180µs, 260µs,
340µs. This results in two pulses spaced 40µs apart repeating every 1ms, allowing
25kHz burst operation for 6 pulses, every 1ms.
DRAFT December 19, 2010
30
Figure 2.15: Two lasers interleaved in Triple pulse pulse-burst mode capable 25kHz operation for 6 pulses every 1ms.
DRAFT December 19, 2010
31
Chapter 3
MST Plasma Characteristics
3.1
Improved Confinement Discharges
As previously mentioned, the gradient in parallel current can be a drive for the
instabilities that degrade energy confinement. One means of improving confinement
is therefore to reduce the gradient which drives the instabilities by techniques such as
Pulsed Poloidal Current Drive (PPCD). By externally driving parallel current along
the edge of the plasma(3.1), PPCD attempts to flatten the parallel current profile.
While extremely effective 17 , PPCD discharges have high shot-to-shot variability. The
same plasma current, density, and PPCD programming can often result in disparate
temperature evolution.
3.2
Mode Activity and Electron Temperature Evolution
The reduced fluctuations levels from PPCD result in much smaller island widths,
and a correspondingly lower level of stochasticity throughout the majority of the
plasma, as can be seen in the results of a field-line tracing simulation using inputs
from PPCD discharges (3.2). Thermal transport in the core of the plasma is much
DRAFT December 19, 2010
32
Figure 3.1: Cartoon of current profile control from 2009 MST proposal.
higher than what is predicted by the stochastic model, and is assumed to be via
another mechanism (possibly electrostatic 18 ), but its discussion is beyond the scope of
this work. There is however a region radially inward from the reversal surface where
the calculated stochastic transport is of the order of the measured transport 5 . It can
be seen that in this region, the shape of the q-profile is such that even when the
fluctuations are greatly reduced, many small amplitude fluctuations may still overlap,
creating a stochastic region (3.3). The focus of this thesis will be on comparing the
thermal transport in this region with the stochastic model for high current PPCD
discharges.
Because of the reduction of fluctuations in PPCD discharges, and the high nnumber of the modes in the stochastic region, the modes of interest have very small
DRAFT December 19, 2010
33
Figure 3.2: A comparison of transport in Standard vs. PPCD discharges
taken from 2009 CMPD and CMSO Winter School Lecture by Dr. Sarff.
Green line is calculated stochastic transport, vs. measured transport.
Figure 3.3: A q-profile of a standard discharge, showing the calculated
widths of magnetic islands centered in their rational surface. The island
widths are greatly reduced in PPCD discharges, and core stochasticity is
small, however stochasticity near the reversal surface can still dominate
transport.
DRAFT December 19, 2010
34
amplitudes. The smallness of these mode amplitudes mean that the mode data requires
a more careful treatment of the measured magnetic signals to arrive at the proper
fluctuation amplitudes. In this regime, small error fields that arise during a plasma
discharge are often on the order of the measured fluctuations, and correcting for this
contribution is crucial to the understanding of transport in this regime.
DRAFT December 19, 2010
35
3.2.1
The toroidal Array on MST
The magnetic field in MST, as measured by the toroidal array, can be written
as an infinite sum of its Fourier components (see Appendix C):
B(φ) =
∞
X
cn cos(nφ − δcn )
n=0
The field is measured unintrusively by an array of 64 passive magnetic coils 19 that
are spaced evenly along the toroidal direction of MST, at poloidal angle 241, allowing
it only to resolve the n-number of the mode. The finite number of physical coils used
to measure the field also limit the resolution of the n number. By spatially Fourier
decomposing the signal, 64 coefficients from the summation can be determined 20 ,
allowing modes up to n-31 to be resolved. Modes with n-number greater than 31
will have their fluctuation amplitudes and energy aliased into the resolved n modes,
however the small amplitudes of the higher-n modes are on the order of digitizer bit
noise 21 , and contribute little to the overall mode amplitude.
In PPCD discharges the fluctuation amplitudes can be reduced to a point where
variations in the coil-to-coil calibrations require a more careful and specific treatment
of the mode amplitudes, as stationary error fields can obscure the amplitude of a
measured fluctuation. While real effects of stationary fields on fluctuations (such
as causing mode locking) can occur and have a real physical impact on the plasma,
examining the impact of these modes on PPCD plasma discharges is beyond the scope
of this work.
DRAFT December 19, 2010
36
When stationary and slowly varying error fields (xn , yn or zn =
p
x2n + yn2 )are
present in the array (See appendix C.0.3), the calculated mode amplitude becomes:
Bn2 = [a2n (t) + b2n (t)] + (x2n + yn )2 + 2[an (t)xn + bn (t)yn ]d
or
Bn2 = Cn2 + Zn2 + 2Cn Zn cos(δZ − δC )
It can be seen that an error-field can change the amplitude of the calculated mode
amplitude from the database value to what is actually present, as well as altering the
time dependence due to its non-rotating nature. In low fluctuation level situations,
a careful analysis of the fluctuating signal is then very beneficial. A mode analysis
script by John Sarff performs such a treatment.
We can write the field measured by the coils, including the error field, as:
B(φ) =
X
cn cos(nφ − δc ) + zn cos(nφ − δz )
We choose a time-window t1 to t2 (order ∼1ms) to perform the mode analysis, and
average the total field measured during this period.
R t2 P
< B(φ) >=
t1
cn cos(nφ − δc ) + zn cos(nφ − δz )dt
t2 − t1
Because the fluctuations of interest are rotating quickly past the coils in this time
window (it is noted if they are found not to be rotating later in the analysis, and
the specific discharge being analyzed is omitted from the data set), their amplitude
DRAFT December 19, 2010
37
averages out to zero, leaving just the stationary error-field amplitude measured by
that coil.
R t2 P
< B(φ) >=
t1
Zn cos(nφ − δz )dt
t2 − t1
=
X
Zn cos(nφ − δz )
By subtracting this component from the raw measured signal, we are left with just
the fluctuating component of the signal:
B(φ, t)− < B(φ) > =
X
Cn (t)cos(nφ − δc ) + Zn cos(nφ − δz )− < B(φ) >
=
X
Cn (t)cos(nφ − δc ) + Zn cos(nφ − δz ) − Zn cos(nφ − δz )
B(φ, t)− < B(φ) > =
X
Cn (t)cos(nφ − δc )
The result is an overall lower fluctuation level that is less influenced by the
presence of stationary error fields (3.4).
DRAFT December 19, 2010
38
Figure 3.4: RMS mode amplitudes of n=8-16 tearing modes, comparing
database fluctuation amplitudes vs. fluctuation amplitudes corrected for
stationary fields.
DRAFT December 19, 2010
39
3.2.2
Core Temperature and mode activity
The Te profiles of PPCD discharges exhibit a flat region from the core to mid-
radius, suggesting high transport that ties core Te behavior to the mid radius. This
connection between behavior in the core and mid-radius offers a strong motivation to
examine the impact of transport in the stochastic mid-radius region directly on the
behavior of the core electron temperature. It should be noted here that the proper
calculation of stochastic transport, such as performed in Biewer et al. 5 , is an involved
process not within the scope of this work. However, because stochastic transport
2
relies on the the diffusion of magnetic field lines as given by 4 : Dm ≈ mR Bbr2 , much
z
information could still be gained by a proper examination of the measured fluctuations
in the Te gradient region.
To examine the potential impact of stochastic transport on PPCD performance,
core temperatures from high current PPCD shots from June 30, 2009 were plotted
against the RMS sum of their n=8-16 mode amplitudes. All of the discharges from the
set had the same voltage and timing programming, although the start and end times
for good PPCD would vary. Specific shots of moderate to good quality PPCD during
times starting 12-14ms and ending 17-20ms were chosen. Core electron temperature
was plotted with the RMS n=8-16 mode amplitudes, and showed a clear positive
correlation between a high core temperature of a specific discharge and a low RMS
mode amplitude in the stochastic region (3.5): Plotting the core Te vs. the core n=5-7
modes (3.6) shows very little correlation between core Te and fluctuation amplitude.
The next step in the investigation involved a local transport analysis in the region
DRAFT December 19, 2010
40
Figure 3.5: Core temperature of various PPCD discharges vs n=8-16 RMS
fluctuation amplitude.
Figure 3.6: Core temperature of various PPCD discharges vs n=5-7 RMS
fluctuation amplitude.
DRAFT December 19, 2010
41
of interest (the stochastic region where the n=8-16 modes reside). This process relied
on the use of a 2D equilibrium reconstruction code called MSTFit, which is outlined
below.
DRAFT December 19, 2010
42
3.3
Equilibrium Reconstruction using MSTFit
MSTFit is a 2D equilibrium reconstruction code which solves the Grad Shafranov
equation in a torus:
∆∗ ψ = −µ0 R2
dp
1 dF 2
−
dψ 2 dψ
Where
F (ψ) = RBφ
∂
∆ ψ=R
∂R
∗
1 ∂ψ
R ∂R
+
∂ 2ψ
∂Z 2
The plasma current, pressure, and reversal and pinch parameters are taken as
inputs, and a current profile is created from this input. If there are additional diagnostics such as MSE 22 or probe measurements, the data is compared to expected
values for the MSTFit generated equilibrium, and used in a χ2 minimization routine
to additionally constrain the fit. The pressure input is the straightforward product of
electron (from Thomson scattering) and ion temperature and density. A full write-up
of how MSTFit works is presented in Anderson’s thesis 23 .
DRAFT December 19, 2010
43
3.3.1
Fitting
Due to the high core electron temperatures associated with high current PPCD
discharges, and current limitations with TS hardware’s ability to properly resolve those
temperatures, the Te profile in the core of a high current PPCD discharge often has
quite a bit of structure, and large error bars. It was beyond the scope of this work to
determine whether this structure was real and occurring in the plasma, or systematic
and an artifact of the diagnostic. Therefore, rather than using a spline fit (one that
offers more freedom in fitting) for the electron temperature profile, a polynomial fit –
which makes a relatively good assumption that the Te profile is flat from the core to
the mid radius, and still captures the characteristics of the temperature gradient in
the mid-radius – was used for the Te profile allowing for a consistent and reliable fit
between different sets of data (3.7)
Te (ψ) = (Te,core − Te,edge )(1 − ψ a )b + Te,edge
The model generates the best fit possible by adjusting the domain ψ, and parameters
a, and b. Varying ψ adjusts the position of the gradient, while a (∼ 4)and b (∼ 1.2)
adjust the steepness of the falloff.
While robust, the polynomial model can only fit monotonically decreasing functions with one gradient region. As a result, many PPCD discharges that appear to
have two flat top regions–a large flat core and a smaller flat region located near the
reversal surface(3.8)–were omitted from the dataset due to the inaccuracy of the tem-
DRAFT December 19, 2010
44
Figure 3.7: Example of a free spline fit on the left versus the polynomial
temperature fit on the right.
perature fit in this region. It is worth mentioning that there is strong motivation
for a capability to better resolve and fit this region, as cursory observations suggest
that possibly all PPCD discharges show this behavior to some extent. Additionally,
the highest performing PPCD discharges seem to strongly correlate to a pronounced
double flattening of the profile, suggesting the possibility of two radially separated
transport barriers resulting in better core energy confinement.
Once the magnetic equilibrium that best fits the data is generated, a local transport analysis can be performed.
DRAFT December 19, 2010
45
Figure 3.8: An electron temperature profile displaying two pronounced
gradient regions (centered around r 0.3m and r 0.4m), resulting in a poor
temperature profile fit.
3.3.2
Transport
The transport of thermal energy within the plasma can be broken down into
conductive and convective components:
5
Qe = χe ne ∇Te − Γe Te
2
The energy transport resulting from particle flux is generally a small contribution
to the overall transport, additionally, particle flux measurement data from MST’s Dα
array was unreliable from the day the 500kA PPCD discharge data set was taken.
To verify the smallness of the convective contribution to energy transport, an RFX
particle transport reconstruction code was applied to data from one time point in one
specific discharge to estimate the convective transport contribution to the overall χe ,
DRAFT December 19, 2010
46
Figure 3.9: A plot of χe with and without particle transport contributions.
and can be seen to be very small (3.9). Therefore, convective transport contributions
have been omitted from the following transport calculations, and the the task becomes
to properly calculate the local heating and loss terms in order to solve for:
χe =
−Qe
ne ∇Te
Where Qe is the total electron heat flux:
Qe =
PΩ − Ẇe − Petoi − Prad
4π 2 rρ
Where the terms in the numerator are the volume-integrated values of: ohmic
heating power, change in electron thermal energy, electron-to-ion collisional losses,
and radiative losses, and the denominator is the surface area of the torus enclosing
the volume. With the current profile generated by MSTFit, it is possible to calculate
R
the local ohmic heating in the plasma by PΩ = ηJ 2 dV . The change in thermal
energy Ẇe was set to zero for this calculation, as all of the data points for the PPCD
data set were either from periods of constant or increasing Te . Setting Ẇe = 0 in
these situations at most results in an overestimation of the value of χe . Alternatives
DRAFT December 19, 2010
47
to the omission of Ẇe are discussed in the summary section. Electron to ion loss Petoi
is based on a simple collisional model, and the radiated power Prad is empirically set
to be proportional to the ohmic heating power. More detail is offered in the appendix
(C).
In order to properly identify the region of interest in the plasma to examine
the local transport with respect to fluctuation-induced stochasticity, we examine the
q-profile generated by MSTFit. The rational surfaces, radial locations at which the qprofile becomes rational q =
m
,
n
give the positions at which the fluctuations of interest
reside. The m=1, n=8-16 tearing modes would be centered on radial locations where
q=1/8, 1/9, etc. As any stochastic transport would be the result of an overlap of the
islands centered on these locations, χe is evaluated at the geometric mean of the n=815 rational surface locations. A plot of the local χe vs. the n=8-15 mode amplitudes
shows that χe scales linearly with the squared sum of the fluctuation amplitudes (3.10).
DRAFT December 19, 2010
48
Figure 3.10: A plot of local χe vs. rms fluctuation amplitudes of n=8-16
modes.
DRAFT December 19, 2010
49
Figure 3.11: A plot of the m=1, n=-11 eigenmode for Br, Bt, and Bp.
3.3.3
χe and stochasticity limits
This is a good moment to compare this result with an estimate of the expected
transport due to a stochastic field. The stochastic energy transport in a collisionless
plasma can be expressed as: χe,stoch = vT e Dm where vT e is the thermal velocity, and the
˜2
magnetic diffusion Dm of a stochastic field is given by Dm = Lac <Bbr2> . And Lac is the
0
auto-correlation length of the stochastic field, and can be approximated as Lac ≈
π
∆kk
~
where ∆kk is the spread in the mode spectrum and kk = ~k · B.
As the values for the equilibrium and perturbed field must be evaluated in the
stochastic region of the plasma, we make use of the equilibrium generated by MSTFit,
as well as calculated linear eigenmodes of the m=1 n=8-15 fluctuations, allowing us
to locate the region of interest for our calculations and convert from the measured b˜t
at the wall to the b˜r local to the region of interest (3.11).
DRAFT December 19, 2010
The spread in the mode spectrum
24
(appendix E) ∆k|| =
∂
n
∆r ∂r
R
h
m RBθ
n r|B|
50
i
B + |B|φ rs
can be numerically evaluated using the q-profile and equilibrium Bθ , Bφ profiles generated by MSTFit. ∆r is defined to be a fluctuation’s mode radial width. The
interpretation of this value is expanded upon later.
The MSTFit equilibrium allows us to directly evaluate the field in the gradient
region (∼0.45T). From the eigenmode plots previously calculated by Sovinec 25 , it is
possible to convert the toroidal fluctuation amplitude measured at the wall to that
of the radial amplitude in the stochastic region. We see that the b˜r of a specific
eigenmode at its rational surface within the plasma is on the order of 2-3 times the b˜t
measured at the wall. The thermal velocity is a simple conversion from the measured
electron temperature Te .
The one parameter that is not well constrained by data in the calculation for
stochastic transport is the mode radial width ∆r. The mode radial width can be interpreted as a variety of values, from the full width half maximum of the fluctuation’s
radial eigenfunction, to a tearing mode’s island width. The radial component of fluctuations on MST, while peaked at their specific rational surfaces, also span the minor
radius of the plasma. A half-width of the fluctuation for the n=8-16 fluctuations would
have ∆r ∼ 0.2m. The ∆r term can also be interpreted as the island width associated
with the fluctuation.. As χe,stoch scales directly with what we choose for this value, it
is important to note its effects. For an initial estimate, a calculation with ∆r taken to
be ∼ 0.1m, on the order of an n ∼ 10 island, results in a reasonable autocorrelation
length of Lac ≈ 1m. The calculated stochastic transport for this value of ∆r gives a
χe,stoch approximately twice that which is measured (3.12).
DRAFT December 19, 2010
51
Figure 3.12: A plot of measured χe (red) vs. χe obtained from the previous
calculation.
Instead the mode radial width was adjusted for one data point (one time point
in, one discharge) such that the experimental and calculated χe agreed; this resulted in
∆r ∼ .14m, and an autocorrelation length Lac ∼ 0.5m. This value of ∆r was used for
all of the data points. Plotting the calculated χe,stoch and measured χe,meas against
b2r
B2
data (3.13) clearly shows strong agreement between measured and calculated stochastic transport.
As this analysis uses local values for all of the parameters in the transport calculations, it was possible to expand the calculation beyond the data set where the core
Te tracked with n=8-16 modes. The same calculations for the measured and expected
stochastic transport was applied to all of the properly fit data points available. The
inclusion of these additional data points show more scatter between the core Te relative to RMS fluctuation amplitude (3.14), however the agreement between measured
DRAFT December 19, 2010
52
Figure 3.13: A plot of measured χe (red) vs. calculated stochastic χe for
select data points.
DRAFT December 19, 2010
53
transport and expected stochastic transport remains clear (3.15).
DRAFT December 19, 2010
54
Figure 3.14: Core temperature of various PPCD discharges vs n=8-16 RMS
fluctuation amplitude for all data points.
This demonstrates a strong argument for the presence of stochastic thermal
transport in the mid-radius region of PPCD discharges, even in the case of very low
relative fluctuation amplitudes.
Because the choice of ∆r allowed the calculation to fit the measured data so well,
it is important examine the implications of this value. Generally, the autocorrelation
length is of the order of a field line’s transit length. At the core where the field is
completely toroidal, the autocorrelation length is on the order of the major radius
Lac ∼ πR ∼ 5m. At the reversal surface where the field is compeltely poloidal, we
have Lac ∼ πa ∼ 1.5m. The small Dm that results from our choice of ∆r and the
resulting small Lac suggests that our calculation for stochastic transport was applied
in in a regime of very low field stochasticity. A calculation of the island overlap
DRAFT December 19, 2010
55
Figure 3.15: A plot of measured χe (red) vs. calculated stochastic χe for
all data points.
DRAFT December 19, 2010
56
Figure 3.16: The q-profile from a representative data point with calculated
island widths for n=8-16 fluctuations.
(Appendix F) using the q-profile from a representative data point (3.16) confirms that
the islands are small, while there is still an overlap between neighboring islands. The
calculated Chirikov 26 stochasticity parameter (Appendix F) for this region is almost
exactly unity.
DRAFT December 19, 2010
57
Chapter 4
Summary and suggestions for future work
4.1
Summary
While many approximations were made in the previous calculations to arrive at
these results, the clear χe ∼ br 2 B scaling characteristic of stochastic transport clearly
showed through. And although stochastic energy transport is the dominant energy
transport mechanism in standard discharges in MST due to the large fluctuation amplitudes, it is evident from this work that stochastic energy transport is still capable
of describing the behavior seen in the mid-radius of the plasma in PPCD discharges, a
regime of very low fluctuation amplitudes. The agreement between experimental and
calculated stochastic transport is seen in all of the data points in the data set, and for
discharges where high core transport results in a flat Te profile to the mid-radius, the
stochastic transport at the mid-radius becomes a strong determinant in the evolution
of the core electron temperature.
It is very interesting to note that stochastic transport in MST is generally associated with poor energy confinement 27 due to the large fluctuation amplitudes in
standard discharges. However in this situation the stochastic transport mechanism
DRAFT December 19, 2010
58
plays a significant role even in regimes of very low magnetic fluctuation amplitudes;
2
where very small transport (χe ∼ 10 ms ) still scales following what is predicted by the
Rechester-Rosenbluth model for stochastic transport. The result is that the regions
of stochastic transport in these PPCD discharges exhibit some of the lowest transport
in the plasma.
In line with what Biewer 5 saw in his work, the stochastic transport mechanism
is applicable in regimes of very low fluctuation amplitudes, as long as the field is still
stochastic. What is interesting in this situation is that estimates of the island widths
for the n=8-16 regions in our 500kA PPCD data set, and the spacing between rational
surfaces, suggest that the island overlap and resulting stochasticity is actually quite
small. This is reflected in the value which we set our mode radial width as well. The
strong agreement between our data and the model for stochastic transport that should
be at its limit of applicability greatly encourages additional investigation.
Some further refinements are suggested in the following pages for a more detailed
investigation into probing the limits of the stochastic transport mechanism.
DRAFT December 19, 2010
59
4.2
4.2.1
Suggestions for refinements and future work
Measured transport calculation refinements
Two approximations were made when calculating the measured transport: set-
ting the change in electron thermal energy Ẇe = 0, and omission of the convective
term in the power balance equation.
One of the reasons setting Ẇe = 0 in the power balance equation was necessary
because large errors result from taking the time derivative of Te data points, which
already have inherently large error bars due to the high plasma temperatures. As
previously mentioned, for the PPCD data set, this results in an over-estimate of χe
as the stored thermal energy is either constant or increasing throughout the enhanced
confinement period. However, short of hardware improvements to the TS system itself,
there still exist a few approximations that can still be made to either minimize the
effect of omitting Ẇe , or offer a more reasonable lower bound to Ẇe .
One method is to take advantage of the characteristic that is prominent in many
PPCD discharges: the plateauing of core Te . This can occur at any point in the
discharge, and generally the temperature profile remains mostly unchanged for the
remaining duration of the enhanced confinement period. Barring significant changes
in the density profile between time points, selecting data points from only this plateau
period would lend much more accuracy in omitting the change in thermal energy term.
Unfortunately this method automatically excludes using the best performing PPCD
discharges from the data set, as the core temperature and stored electron energy for
DRAFT December 19, 2010
60
those discharges steadily increase until the end of PPCD.
For certain PPCD discharges, there also exist periods of steady and smooth Te
increase throughout the core and mid-radius of the plasma. For discharges where the
density profile does not vary much during this period, it is possible to arrive at an
estimate of the Ẇe term by taking a linear time derivative between data points.
For the particle balance, as previously noted, there exists a particle transport
reconstruction code ported from RFX that is capable of utilizing MSTFit’s Dα array
data to more accurately correct for the convective term in the transport calculations.
Still, this contribution was seen to be small in the handful of data points it was
previously applied to.
4.2.2
Stochastic transport calculation
For a more rigorous calculation of the expected stochastic transport, a direct
numerical simulation of select PPCD discharges via field line tracing is required. By
using the linear eigenmodes calculated via DEBS, which solves the nonlinear MHD
equations in a cylindrical geometry. The magnetic field configuration can be calculated
by the field-line tracing routine MAL, using the DEBS results and measured fields as
inputs. Previously 5 , this has allowed for the direct calculation of the radial excursion
D 2E
∆r
∆r a field line undergoes, allowing for the calculation χe,M AL = vTe 2∆L
as a direct
comparison to χe,stoch given by the Rechester-Rosenbluth model. However, the above
equation for χe is only assumed valid for regions of high stochasticity. A numerical
calculation of the of χe,M AL compared with χe,meas and χe,stoch in this case would give
insight into the the applicability of stochastic transport in this regime, as well as allow
for a better estimate of the actual stochasticity of the field in the mid-radius.
DRAFT December 19, 2010
61
Figure 4.1: tbpp.
Probing the limits of stochastic energy transport
The previous refinements would improve the accuracy the results seen for the
500kA PPCD discharges, and also be useful in the many other operating regimes
MST is capable of. An examination of peak core Te with respect RMS fluctuation
amplitudes for four different operating modes–500kA PPCD, 500kA standard, 400kA
PPCD, and 400kA standard discharges–shows a clear continuation of relationship seen
previously (4.1). The same analysis done in this thesis could easily be applied to those
different operating regimes, and would greatly increase our understanding of the scope
of applicability of the stochastic energy transport mechanism.
DRAFT December 19, 2010
62
Bibliography
1. J.S. Sarff, J.C. Sprott, and L. Turner. Equilibrium studies of a poloidal divertor
pinch with a reversed toroidal field. Phys. Fluids, 30(7):2155–62, March 1987.
2. S. Ortolani and D. Schnack. Magnetohydrodynamics of plasma relaxation. 1993.
3. R. N. Dexter, D. W. Kerst, T. W. Lovell, Prager. S. C., and J. C. Sprott. The
madison symmetric torus. Fusion Technol., 19(1):131–139, 1991.
4. A. B. Rechester and M. N. Rosenbluth. Electron heat transport in a tokamak with
destroyed magnetic surfaces. Physical Review Letters, 40(1):38–41, Jan 1978.
5. T. M. Biewer, C. B. Forest, J. K. Anderson, G. Fiksel, B. Hudson, S. C. Prager,
J. S. Sarff, J. C. Wright, D. L. Brower, W. X. Ding, and S. D. Terry. Electron heat
transport measured in a stochastic magnetic field. Phys. Rev. Lett., 91(4):045004,
Jul 2003.
6. J.S. Sarff, S.A. Hokin, H. Ji, S.C. Prager, and C.R. Sovinec. Fluctuation and
transport reduction in a reversed field pinch by inductive poloidal current drive.
Phys. Rev. Lett., 72(23):3670–73, June 1994.
DRAFT December 19, 2010
63
7. B.E. et al. Chapman. Reduced edge instability and improved confinement in the
mst reversed-field pinch. Phys. Rev. Lett., 87(20):205001, Nov 2001.
8. D J Den Hartog and M Cekic. Meas. Sci. Technol., 5:1115–1123, 1994.
9. N.E. Lanier, S.P. Gerhardt, and D.J. Den Hartog. Low-cost, robust, filtered
spectrometer for absolute intensity measurements in the soft x-ray region. Rev.
Sci. Instrum., 72(1):1188–91, Jan 2001.
10. H.D. Stephens. Electron Temperature Structures Associated With Magnetic Tearing Modes in the Madison Symmetric Torus. PhD thesis, University of Wisconsin
at Madison, 2010.
11. SpectronLaser. User manual for sl858g nd:yag laser system.
12. J.A. Reusch, M.T. Borchardt, D.J. Den Hartog, A.F. Falkowski, D.J. Holly,
R. O’Connell, and H.D. Stephens. Multipoint thomson scattering diagnostic for
the madison symmetric torus reversed-field pinch. Review of Scientific Instruments, 79(10):10E733 (5 pp.), Oct. 2008.
13. H. D. Stephens, M. T. Borchardt, D. J. Den Hartog, A. F. Falkowski, D. J. Holly,
R. O’Connell, and J. A. Reusch. Calibration of a thomson scattering diagnostic
for fluctuation measurements. Review of Scientific Instruments, 79(10):10E734 (5
pp.), Oct. 2008.
14. TS alignment section of MST plasma wiki. http://hackserver.physics.wisc.
edu/wiki/index.php/TS_Alignment.
DRAFT December 19, 2010
64
15. D. J. Den Hartog, J. R. Ambuel, M. T. Borchardt, J. A. Reusch, P. E. Robl, and
Y. M. Yang. Pulse-burst operation of standard nd:yag lasers. to be published in
Journal of Physics: Conference Series, 2010.
16. W.S. Harris, D.J. Den Hartog, and N.C. Hurst. Initial operation of a pulseburst laser system for high-repetition-rate thomson scattering. Rev. Sci. Instrum.,
81:10D505, 2010.
17. J.S. Sarff, N.E. Lanier, S.C. Prager, and M.R. Stoneking. Increased confinement
and β by inductive poloidal current drive in the reversed field pinch. Phys. Rev.
Lett., 79(1):62–5, Jan 1997.
18. J. Lei, P.M. Schoch, D.R. Demers, U. Shah, and K.A. Connor. Core electrostatic
fluctuations and particle transport in a reversed-field pinch. Phys. Rev. Lett.,
89(27):275001, Dec 2002.
19. A.F. Almagri, S. Assadi, S.C. Prager, J.S. Sarff, and D.W. Kerst. Equilibrium
studies of a poloidal divertor pinch with a reversed toroidal field. Phys. Fluids B,
4(12):4080, Aug 1992.
20. D. Craig. Magnetic mode analysis in MST, 2005.
21. T. M. Biewer. ELECTRON THERMAL TRANSPORT IN THE MADISON SYMMETRIC TORUS. PhD thesis, University of Wisconsin at Madison, 2002.
22. D. Craig, D. J. Den Hartog, G. Fiksel, V. I. Davydenko, and A. A. Ivanov. First
charge exchange recombination spectroscopy and motional stark effect results from
DRAFT December 19, 2010
65
the madison symmetric torus reversed field pinch. volume 72, pages 1008–1011.
AIP, 2001.
23. J. K. Anderson. Measurement of the Electrical Resistivity Profile in the Madison
Symmetric Torus. PhD thesis, University of Wisconsin at Madison, 2001.
24. J.A. Krommes, C. Oberman, and R.G. Kleva.
25. C.R. Sovinec. Magnetohydronynamic Simulations of Noninductive Helicity Injection in the Reversed-Field Pinch and Tokamak. PhD thesis, University of Wisconsin at Madison, 1995.
26. G.M. Zaslavsky and B.V. Chirikov. Sov. Phys. Usp.
27. J.S. Sarff, S.A. Hokin, H. Ji, S.C. Prager, and C.R. Sovinec. Fluctuation and
transport reduction in a reversed field pinch by inductive poloidal current drive.
Phys. Rev. Lett., 72(23):3670, 1994.
28. B.E. et al. Chapman. Generation and confinement of hot ions and electrons in a
reversed-field pinch plasma. Plas. Phys. Controll. Fusion, 52:12048, 2010.
DRAFT December 19, 2010
66
Appendix A
Alignment
DRAFT December 19, 2010
67
Figure A.1: align-create-front.
DRAFT December 19, 2010
68
Figure A.2: align-create-back.
DRAFT December 19, 2010
69
Figure A.3: align-runtime-backtop.
DRAFT December 19, 2010
70
Figure A.4: align-runtime-backbot.
DRAFT December 19, 2010
71
Figure A.5: align-calib-back.
DRAFT December 19, 2010
72
Appendix B
FLPSCS Interface
#I n i t i a l i z a t i o n s
””” This i s t h e code used t o manage t h e FLPSCS power supply , i t w i l l be a b l e t o
a d d r e s s a l l o f t h e FLPSCS f u n c t i o n s , however i t i s i n t e n d e d t o be i m p o r t e d i n t o
a n o t h e r s c r i p t , o r GUI , and f e d i n p u t s from t h e r e . Note t h a t a l l t i m i n g i s
somewhat o r d e r o f magnitude , a s time . c l o c k g o e s by t h e cpu c l o c k which v a r i e s
between computers , and a l s o time . s l e e p has ˜1ms a c c u r a c y ”””
im po rt t h r e a d i n g , s e r i a l , Queue , time , c t y p e s
mainbaton = t h r e a d i n g . Lock ( )
s e n d b a t o n = t h r e a d i n g . Lock ( )
dwps=c t y p e s . c u l o n g ( 0 )
dwpc=c t y p e s . c u l o n g ( 1 )
pb=c t y p e s . c b y t e ( )
qb=c t y p e s . p o i n t e r ( pb )
#modi
#l o a d t h e d e v i c e d r i v e r f o r t h e USB D−i / o board
a=c t y p e s . w i n d l l . L o a d L i b r a r y ( ’ a d s a p i 3 2 ’ )
p s h o r t=c t y p e s . c u s h o r t ( )
i=c t y p e s . c u l o n g ( 0 )
d h a n d l e=c t y p e s . c l o n g ( )
d h a n d l e 2=c t y p e s . p o i n t e r ( d h a n d l e )
c=a . DRV DeviceOpen ( i , d h a n d l e 2 )
#C r e a t e l i s t s o f commands f o r programming , c h e c k i n g s t a t u s , and on / o f f :
#n u l l a t p o s i t i o n z e r o s h i f t s i n d i c e s c h a n l i s t [ 1 ] and [ 2 ] t o match l a s e r s
c h a n l i s t =[ ’ n u l l ’ ]
c h a n l i s t . append ( r a n g e ( 2 , 6 ) ) # l i s t o f c h a n n e l s f o r i t e r a t i n g t h r o u g h
c h a n l i s t . append ( r a n g e ( 6 , 1 0 ) )
p r o g l i s t =[ ’ SetPulseWidth ’ , ’ S e t P u l s e D e l a y ’ ]
s t a t u s l i s t =[ ’GetEOC ’ , ’ GetSS ’ , ’ GetGDBFault ’ ]
s e t l i s t =[ ’GetEOC ’ , ’ GetSS ’ ]
c a l i b l i s t =[[] ,[3836 ,3831 ,3835 ,3803] ,[3845 ,3852 ,3822 ,3868] ,\
[.082 ,.08 ,.11 ,.1] ,[.124 ,.073 ,.068 ,.02]]
l1cal = []
l2cal = []
f o r i in range ( 4 ) :
l 1 c a l . append ((10 − c a l i b l i s t [ 3 ] [ i ] ) / c a l i b l i s t [ 1 ] [ i ] )
l 2 c a l . append ((10 − c a l i b l i s t [ 4 ] [ i ] ) / c a l i b l i s t [ 2 ] [ i ] )
DRAFT December 19, 2010
73
slopes =[[] , l1cal , l2cal ]
””” C r e a t e a l l o f t h e i n t e r n a l v a r i a b l e s we w i l l need .
c s q = commands t o be s e n t
brq = b u l k r e s p o n s e s
srq = status responses
c r q = command r e s p o n s e s
e r q = e r r o r r e s p o n s e s ( c u r r e n t l y not implemented )
drq = dgh r e s p o n s e s
sq = simmer queue
RT = used t o t e s t t h e run mode t o g g l e
”””
c s q = Queue . Queue ( )
b r q = Queue . Queue ( )
s r q = Queue . Queue ( )
c r q = Queue . Queue ( )
e r q = Queue . Queue ( )
d r q = Queue . Queue ( )
st
= Queue . Queue ( )
c c s t = Queue . Queue ( )
rt
= Queue . Queue ( )
#modi
p s e r = s e r i a l . S e r i a l ( ’COM1’ , 1 9 2 0 0 )
d g h s e r = s e r i a l . S e r i a l ( ’COM2’ , 1 9 2 0 0 )
#Main t h r e a d
c l a s s f l p s c s ( t h r e a d i n g . Thread ) :
”””We b e g i n by c r e a t i n g a c l a s s f o r t h e FLPSCS , which w i l l c o n t a i n a l l o f our
I /O f u n c t i o n s
S t a r t i n g t h i s c l a s s w i l l s t a r t background i n n e r c l a s s e s t h a t c h e c k f o r r e c e i v e d
messages , and t h e PLC t r i g g e r t h i s c l a s s w i l l a l s o have f u n c t i o n s t h a t c a l l
t h r e a d s t o p e r f o r m s o l i c i t e d a c t i o n s ( s e t programming , run mode ) ” ” ”
init
( s e l f , status = ’ ’ , se t t i n g s = ’ ’):
def
#Connect t o t h e FLPSCS , DGH module , and PLC t r i g g e r
#s e r i a l s p e c s : 32 b y t e s . 19200 bps , 8 data b i t s , 1 s t o p b i t , no p a r i t y .
#E v e r y t h i n g e x c e p t bps and portname a r e d e f a u l t s i n p y s e r i a l .
#A u t o m a t i c a l l y opens p s e r i f p o r t i s not none
s e l f . status = status
self . settings = settings
t h r e a d i n g . Thread .
init
( self )
p r i n t ’FLPSCS backend i n i t i a l i z e d ’
reader ( ) . start ()
sorter ( ) . start ()
#OUTPUT QUEUE:
#c s q w i l l be t h e l i s t o f commands t o be s e n t , e i t h e r f o r q u e r i e s o r programming
#INPUT QUEUES:
#brq i s t h e b u l k s e r i a l r e c e i v e d queue , which t a k e s i n a l l s e r i a l data from t h e f l p s c s
#s r q i s t h e s t a t u s r e c e i v e d queue , s o r t e d from brq , t h i s data w i l l update t h e UI
#c r q i s t h e command r e c e i v e d queue , s o r t e d from brq
# s e n d b a t o n w i l l be a l o c k t h a t p r e v e n t s run−mode t o g g l e w h i l e s e n d i n g commands
# mainbaton p r e v e n t s q u e u e i n g up o f commands when i n run mode .
d e f run ( s e l f ) :
sender ( ) . start ()
# plca ( ) . start ()
plcb ( s e l f . status ) . start ()
#s e t unused d e l a y s t o 100 us
f o r i in range ( 9 , 2 0 ) :
c s=comsyn ( ’ SetPulseWidth ’ , ’ 0 ’ , i , ’ ’ , 1 0 0 )
c s q . put ( c s )
c s=comsyn ( ’ SetPulseWidth ’ , ’ 0 ’ , 1 , ’ ’ , 1 0 0 )
DRAFT December 19, 2010
74
c s q . put ( c s )
#S e t c o n t i n u o u s mode
#modi
d g h s e r . w r i t e ( ’ $1DO0400\ r \n ’ )
time . s l e e p ( . 1 )
d g h s e r . w r i t e ( ’ $1SB0B\ r \n ’ )
time . s l e e p ( 4 )
#modi
status ( s e l f . status ). start ()
simmerrun ( ) . s t a r t ( )
ccsrun ( ) . start ()
#Programming t h r e a d
c l a s s command ( t h r e a d i n g . Thread ) :
def
init
( s e l f , laser , input ) :
t h r e a d i n g . Thread .
init
( self )
s e l f . input = input
self . laser = laser
d e f run ( s e l f ) :
mainbaton . a c q u i r e ( )
f o r i in range ( 4 ) :
#c r e a t i n g i n p u t : ∗ 0 s e t o u t p u t v o l t a g e nn vvvv
c s=comsyn ( ’ SetOutputVoltage ’ , ’ 0 ’ , c h a n l i s t [ s e l f . l a s e r ] [
abs ( ( s e l f . i n p u t [ 0 ] [ i ] / 1 0 . − c a l i b l i s t [ s e l f . l a s e r + 2 ] [ i ] ) /
c s q . put ( c s )
#c r e a t e i n p u t : ∗ 0 s e t width / d e l a y nn vvvv
f o r i i in range ( 2 ) :
i f s e l f . i n p u t [ 1 ] [ i ∗2+ i i ] < 4 5 0 :
c s=comsyn ( p r o g l i s t [ i i ] , ’ 0 ’ , c h a n l i s t [ s e l f . l a s e r ] [ i ]
else
c s=comsyn ( p r o g l i s t [ i i ] , ’ 0 ’ , c h a n l i s t [ s e l f . l a s e r ] [ i ]
c s q . put ( c s )
i], \
slopes [ s e l f . laser ] [ i ]))
, ’ ’ , s e l f . i n p u t [ 1 ] [ i ∗2+ i i ] )
, ’ ’ , ’150 ’)
time . s l e e p ( 4 )
#c s=comsyn ( ’ GetPulseWidth ’ , ’ 0 ’ , c h a n l i s t [ s e l f . l a s e r ] [ i ] , ’ ’ , s e l f . i n p u t [ 1 ] [ i i ] )
# c s q . put ( c s )
#time . s l e e p ( . 2 )
t i c 1=time . c l o c k ( )
”””
w h i l e time . c l o c k () − t i c 1 <5:
try :
c= c r q . g e t ( 0 )
i n d=c . f i n d ( ’ PulseWidth ’ )
i f i n d != −1:
p r i n t c [ i n d +11: i n d +13]
p r i n t c [ i n d +14: i n d +20]
else :
pass
except :
pass
”””
mainbaton . r e l e a s e ( )
#S t a t u s t h r e a d
class
s t a t u s ( t h r e a d i n g . Thread ) :
#t h r e a d which w i l l send ” query f o r s t a t u s ” commands i n t o t h e
def
init
( s e l f , status = ’ ’):
s e l f . status = status
t h r e a d i n g . Thread .
init
( self )
DRAFT December 19, 2010
c s q , u n l e s s i n run mode
75
d e f run ( s e l f ) :
while 1:
mainbaton . a c q u i r e ( )
s e l f . t i c 1=time . c l o c k ( )
f o r i in range ( 4 ) :
for i i in s t a t u s l i s t :
c s=comsyn ( i i , ’ 0 ’ , c h a n l i s t [ 1 ] [ i ] )
c s q . put ( c s )
c s=comsyn ( i i , ’ 0 ’ , c h a n l i s t [ 2 ] [ i ] )
c s q . put ( c s )
#send out s e r i a l commands , but f o r now j u s t p r i n t
t i c 1=time . c l o c k ( )
mainbaton . r e l e a s e ( )
”””
d l i s t i s d e f a u l t l i s t o f c h a n n e l s and c o l o r s
c l i s t i s l i s t of channels that r e c e i v e responses
s l i s t i s l i s t o f s t a t u s e s , t o be p a r s e d a s f a u l t s , and c o n v e r t e d i n t o c o l o r s
”””
d l i s t =[]
c l i s t =[]
s l i s t =[]
c l i s t 2 =[]
s l i s t 2 =[]
c o l o r s =[]
colors2 =[]
w h i l e time . c l o c k () − t i c 1 <8:
echan=0
stat =’’
v o l t a g e =0
try :
time . s l e e p ( . 1 )
s= s r q . g e t ( 0 )
i f s . f i n d ( ’EOC’ ) ! = − 1 :
s s=s . f i n d ( ’EOC’ )
chan=s [ s s +10: s s +12]
s t a t=s [ s s +13: s s +14]
chan2=i n t ( chan )∗2 −4
chan=i n t ( chan )∗3 −6
c l i s t . append ( chan )
s l i s t . append ( s t a t )
c l i s t 2 . append ( chan2 )
s l i s t 2 . append ( s t a t )
e l i f s . f i n d ( ’ SS ’ ) ! = − 1 :
s s=s . f i n d ( ’ SS ’ )
chan=s [ s s +9: s s +11]
s t a t=s [ s s +12: s s +13]
chan2=i n t ( chan )∗2 −3
chan=i n t ( chan )∗3 −5
c l i s t . append ( chan )
s l i s t . append ( s t a t )
c l i s t 2 . append ( chan2 )
s l i s t 2 . append ( s t a t )
e l i f s . f i n d ( ’GDB’ ) ! = − 1 :
s s=s . f i n d ( ’GDB’ )
chan=s [ s s +15: s s +17]
s t a t=s [ s s +18: s s +19]
chan=i n t ( chan )∗3 −4
c l i s t . append ( chan )
s l i s t . append ( s t a t )
else :
p r i n t ’ oops ’
except :
DRAFT December 19, 2010
76
pass
#c r e a t e an a r r a y o f a l l Yellow s t a t u s c o l o r s t h e l e n g t h o f our c h a n n e l l i s t
temp = [ ]
f o r i in range ( 2 4 ) :
temp . append ( ’Y’ )
d l i s t . append ( temp )
temp = [ ]
f o r i in range ( 2 4 ) :
temp . append ( i )
d l i s t . append ( temp )
temp = [ ]
f o r i in range ( 1 6 ) :
temp . append ( ’Y’ )
d l i s t . append ( temp )
temp = [ ]
f o r i in range ( 1 6 ) :
temp . append ( i )
d l i s t . append ( temp )
#i f t h e s t a t u s i s Simmering , No f a u l t , o r Done c h a r g i n g , i n d i c a t o r s a r e g r e e n
#e l s e t h e i n d i c a t o r s a r e red , i f t h e r e s p o n s e i s timed out , i t w i l l be y e l l o w
f o r i in range ( len ( c l i s t 2 ) ) :
i f s l i s t 2 [ i ]== ’S ’ :
c o l o r s 2 . append ( ’G’ )
e l i f s l i s t 2 [ i ]== ’N ’ :
c o l o r s 2 . append ( ’R’ )
e l i f s l i s t 2 [ i ]== ’D ’ :
c o l o r s 2 . append ( ’G’ )
e l i f s l i s t 2 [ i ]== ’C ’ :
c o l o r s 2 . append ( ’R’ )
else :
p r i n t ’ oops ’
f o r i in range ( len ( c l i s t ) ) :
i f s l i s t [ i ]== ’S ’ :
c o l o r s . append ( ’G’ )
e l i f s l i s t [ i ]== ’N ’ :
i f c l i s t [ i ]%3==2:
c o l o r s . append ( ’G’ )
e l i f c l i s t [ i ]%3==1:
c o l o r s . append ( ’R’ )
e l i f s l i s t [ i ]== ’D ’ :
c o l o r s . append ( ’G’ )
e l i f s l i s t [ i ]== ’C ’ :
c o l o r s . append ( ’R’ )
e l i f s l i s t [ i ]== ’F ’ :
c o l o r s . append ( ’R’ )
else :
p r i n t ’ oops ’
s e l f . status ( d l i s t [1] , d l i s t [0] , d l i s t [3] , d l i s t [ 2 ] )
s e l f . status ( clist , colors , clist2 , colors2 )
time . s l e e p ( 4 )
#Manual t o g g l e s
#manual t o g g l e o f f a k e PLC t r i g g e r
c l a s s fakerun ( ) :
init
( self ):
def
s e l f . i n d i e =0
DRAFT December 19, 2010
77
d e f go ( s e l f ) :
i f s e l f . i n d i e ==0:
s e l f . i n d i e =1
r t . put ( 1 )
else :
r t . put ( 0 )
s e l f . i n d i e =0
#t o g g l e o f CCS p a r t 1
class ccstog ( ) :
init
( self ):
def
s e l f . ccs =[ ’ ’ , ’ ’ , ’ off ’ , ’ off ’ , ’ off ’ , ’ off ’ , ’ off ’ , ’ off ’ , ’ off ’ , ’ off ’ ]
d e f go ( s e l f , ccsnum ) :
i f s e l f . c c s [ ccsnum ]== ’ o f f ’ :
s e l f . c c s [ ccsnum ]= ’ on ’
c c s t . put ( ccsnum )
e l i f s e l f . c c s [ ccsnum ]== ’on ’ :
s e l f . c c s [ ccsnum ]= ’ o f f ’
c c s t . put ( ccsnum ∗( −1))
else :
p r i n t ’ h o l y c r a p CCS e x c e p t i o n ’
#t o g g l e o f CCS p a r t 2
c l a s s c c s r u n ( t h r e a d i n g . Thread ) :
d e f run ( s e l f ) :
while 1:
ccsnum=c c s t . g e t ( )
mainbaton . a c q u i r e ( )
i f ccsnum >0:
a=comsyn ( ’ EnableCCS ’ , ’ 0 ’ , ccsnum )
c s q . put ( a )
else :
a=comsyn ( ’ DisableCCS ’ , ’ 0 ’ , abs ( ccsnum ) )
c s q . put ( a )
time . s l e e p ( . 3 )
mainbaton . r e l e a s e ( )
#To gg le o f simmer p a r t 1
c l a s s simmertog ( ) :
def
init
( self ):
s e l f . sim = [ ’ ’ , ’ ’ , ’ o f f ’ , ’ o f f ’ , ’ o f f ’ , ’ o f f ’ , ’ o f f ’ , ’ o f f ’ , ’ o f f ’ , ’ o f f ’ ]
d e f go ( s e l f , simmernum ) :
i f s e l f . sim [ simmernum]== ’ o f f ’ :
s e l f . sim [ simmernum ] = ’ on ’
s t . put ( simmernum )
e l i f s e l f . sim [ simmernum]== ’on ’ :
s e l f . sim [ simmernum ] = ’ o f f ’
s t . put ( simmernum ∗( −1))
else :
p r i n t ’ h o l y c r a p simmer e x c e p t i o n ’
#Tog gle o f simmer p a r t 2
c l a s s simmerrun ( t h r e a d i n g . Thread ) :
d e f run ( s e l f ) :
while 1:
simnum=s t . g e t ( )
mainbaton . a c q u i r e ( )
i f simnum >0:
a=comsyn ( ’ EnableSS ’ , ’ 0 ’ , simnum )
c s q . put ( a )
p r i n t ’ e n a b l i n g ’ , simnum
else :
DRAFT December 19, 2010
78
a=comsyn ( ’ D i s a b l e S S ’ , ’ 0 ’ , abs ( simnum ) )
c s q . put ( a )
p r i n t ’ d i s a b l i n g ’ , simnum
time . s l e e p ( . 3 )
mainbaton . r e l e a s e ( )
#Background t h r e a d s
c l a s s s e n d e r ( t h r e a d i n g . Thread ) :
d e f run ( s e l f ) :
#s h o u l d send s e r i a l o f q t . get , f o r now p r i n t
while 1:
c s= c s q . g e t ( )
# mainbaton . a c q u i r e ( )
sendbaton . acquire ( )
while 1:
#modi
pser . write ( cs )
print cs
”””
i f c s . f i n d ( ’ S e t P u l s e D e l a y 05 ’) != −1:
sendbaton . r e l e a s e ( )
mainbaton . r e l e a s e ( )
break
e l i f c s . f i n d ( ’ S e t P u l s e D e l a y 0 9 ’ )! = −1:
sendbaton . r e l e a s e ( )
mainbaton . r e l e a s e ( )
break
e l i f c s . f i n d ( ’ GetGDBFault 0 9 ’ )! = −1:
sendbaton . r e l e a s e ( )
mainbaton . r e l e a s e ( )
break
e l i f c s . f i n d ( ’ SetPulseWidth 19 ’) != −1:
sendbaton . r e l e a s e ( )
mainbaton . r e l e a s e ( )
break
else :
c s= c s q . g e t ( )
”””
try :
c s= c s q . g e t ( 0 )
except :
sendbaton . r e l e a s e ( )
# mainbaton . r e l e a s e ( )
break
time . s l e e p ( . 3 )
#Thread which w i l l c o n t i n u o u s l y c h e c k f o r a PLC t r i g g e r , and upon r e c e i v i n g one ,
#w a i t f o r o t h e r p r o c e s s e s t o f i n i s h b e f o r e l o c k i n g them out
c l a s s p l c b ( t h r e a d i n g . Thread ) :
def
init
( self , status ):
t h r e a d i n g . Thread .
init
( self )
s e l f . f l a g =0
s e l f . status = status
#c h e c k s <i n t e r f a c e > f o r PLc t r i g g e r
d e f run ( s e l f ) :
while 1:
time . s l e e p ( . 2 0 )
try :
a=r t . g e t ( 0 )
i f a==1:
#p r i n t ’ R e c e i v e d runmode r e q u e s t ’
i f s e l f . f l a g ==0:
DRAFT December 19, 2010
79
s e l f . f l a g =1
mainbaton . a c q u i r e ( )
sendbaton . acquire ( )
p r i n t ’ run mode ’
#modi
d g h s e r . w r i t e ( ’ $1SB09 \ r \n ’ )
e l i f f l a g ==1:
pass
#t h i s p o r t i o n a c q u i r e s t h e c s q l o c k s o t h a t s t a t u s and command bu tt on
#ca nn ot a c c e s s i t
#t h e brq j o i n w i l l make s u r e t h e b u l k r e s p o n s e queue i s empty ,
#f o r now we assume t h i s s t a r t s f i l l i n g up w h i l e c s q i s b e i n g f i l l e d .
#DO: send s e r i a l command f o r run mode
#e l i f t r i g g e r o f f
e l i f a==0:
i f s e l f . f l a g ==1:
p r i n t ’ o f f runmode ’
s e l f . f l a g =0
#modi
d g h s e r . w r i t e ( ’ $1CB09\ r \n ’ )
time . s l e e p ( . 2 )
mainbaton . r e l e a s e ( )
sendbaton . r e l e a s e ()
e l i f f l a g ==0:
pass
except :
pass
c l a s s r e a d e r ( t h r e a d i n g . Thread ) :
””” C l a s s which w i l l r e a d a l l s e r i a l communications i n t o t h e
s o r t i n t o v a r i o u s s o l i c i t e d and u n s o l i c i t e d l i s t s ”””
def i n i t ( s e l f ) :
t h r e a d i n g . Thread .
init
( self )
s e l f . s t a r t e d =0
d e f run ( s e l f ) :
while 1:
#modi
#p a s s
a=p s e r . r e a d l i n e ( )
print a
”””
i f a . f i n d ( ’ Power On I n i t Complete ’ ) ! = − 1 :
i f s e l f . s t a r t e d ==0:
s e l f . s t a r t e d =1
status ( ) . start ()
e l s e :”””
#modi
b r q . put ( a )
class
s o r t e r ( t h r e a d i n g . Thread ) :
d e f run ( s e l f ) :
while 1:
b= b r q . g e t ( )
i f b . f i n d ( ’ Set ’ ) ! = − 1 :
c r q . put ( b )
e l i f b . f i n d ( ’ PulseWidth ’ ) ! = − 1 :
c r q . put ( b )
e l i f b . f i n d ( ’ MonitorVoltage ’)!= −1:
s r q . put ( b )
e l i f b . f i n d ( ’ Status ’)!= −1:
s r q . put ( b )
else :
e r q . put ( b )
DRAFT December 19, 2010
b r q , and then
80
#f u n c t i o n t h a t p u t s command i n p u t s i n t o p r o p e r s y n t a x f o r FLPSCS communication
d e f comsyn ( cmd , i d = ’ 0 ’ , nn = ’ ’ , vv = ’ ’ ,ww= ’ ’ ) :
#t a k e s i n command , d e v i c e ID , d e v i c e number/ s t a t u s b y t e e t c ,
#and v o l t a g e f o r PulseWidthSet only , ID d e f a u l t s t o z e r o , nn and vv a r e o p t i o n a l
#n o t e t h a t d e v i c e ID comes a f t e r cmd , s i n c e d e f a u l t v a l u e s a r e annoying i n python
i f vv ! = ’ ’ :
vv =”%.4d” % vv
i f nn ! = ’ ’ :
nn =”%.2d” % nn
i f ww! = ’ ’ :
ww =”%.6d” % ww
a = ’ ∗ ’+ s t r ( i d )+ ’ ’+ s t r ( cmd)+ ’ ’+ s t r ( nn )+ ’ ’+ s t r ( vv)+ s t r (ww)
# f i l l out w h i t e s p a c e
a = a+(29− l e n ( a ) ) ∗ ’ ’+ ’ $ ’ + ’ \ r ’ + ’ \ n ’
return a
DRAFT December 19, 2010
81
Appendix C
Mode Analysis
We can express the magnetic field measured by the toroidal array coils as:
B(φ) =
∞
X
an sin(nφ) + bn cos(nφ)
n=0
where:
1
an =
π
Z
1
bn =
π
Z
2π
B(φ)sin(nφ)dφ
φ=0
2π
B(φ)cos(nφ)dφ
φ=0
DRAFT December 19, 2010
82
or alternatively, we can let:
∞
X
B(φ) =
cn cos(nφ − δcn )
(C.1a)
n=0
=
∞
X
cn [cos(nφ)cos(δcn ) + sin(nφ)sin(δcn )]
n=0
=
∞
X
[cn cos(δcn )]cos(nφ) + [cn sin(δcn )]sin(nφ)
n=0
=
∞
X
bn cos(nφ) + an sin(nφ)
n=0
(C.1b)
Giving:
cn cos(δcn ) = bn
cn sin(δcn ) = an
tan(δcn ) =
an
bn
andc2n (cos2 (δcn ) + sin2 (δcn ))
c2n = a2n + b2n
cn =
p
a2n + b2n
(C.2)
and
δn = arctan(
DRAFT December 19, 2010
an
)
bn
(C.3)
83
C.0.3
Error Fields
We can add Fourier decomposed stationary error fields xn , yn to our coil measurements as follows:
B(φ, t) =
X
an (t)sin(nφ) + bn (t)cos(nφ) +
X
xn sin(nφ) + yn cos(nφ)
(C.4)
which can be expressed as (supressing the (t) terms):
B(φ) =
X
(an + xn )sin(nφ) + (bn + yn )cos(nφ)
(C.5)
X
Cn cos(nφ − δc ) + Zn cos(nφ − δz )
(C.6)
or
B(φ) =
Here, we have added a time-dependence to the an s and bn s to distinguish them
from the stationary error fields. We may repeat the same procedure outlined above
to convert this signal into a total mode amplitude, cosine, and phase Bn cos(nφ − δB ).
If using equation A.5:
B(φ) = Bn cos(nφ − δB )
= Bn [cos(nφ)cos(deltaB ) + sin(nφ)sin(δB )]
= [Bn cos(δB )]cos(nφ) + [Bn sin(δB )]sin(nφ)
X
B(φ) =
(an + xn )sin(nφ) + (bn + yn )cos(nφ)
DRAFT December 19, 2010
84
As with before, this results in (inserting time dependence back in):
Bn =
p
(an (t) + xn )2 + (bn (t) + yn )2
Bn =
p
(a2n (t) + b2n (t)) + (x2n + yn )2 + 2(an (t)xn + bn (t)yn )
(C.7)
and
δB = arctan
(an (t) + xn )
(bn (t) + yn )
We may derive this using equation A.6 as well:
B(φ) =
X
Cn cos(nφ − δc ) + Zn cos(nφ − δz )
= Cn [cos(nφ)cos(δc ) + sin(nφ)sin(δc )]
+Zn [cos(nφ)cos(δz ) + sin(nφ)sin(δz )]
= [Cn cos(δC ) + Zn cos(δz )]cos(nφ)
+[Cn sin(δC ) + Zn sin(δZ )]sin(nφ)
DRAFT December 19, 2010
(C.8)
85
Similar to before, from Bn cos(nφ − δB ) this results in:
Bn cos(δB ) = Cn cos(δC ) + Zn cos(δz )
Bn sin(δB ) = Cn sin(δC ) + Zn sin(δz )
Bn2 = Cn2 cos2 (δC ) + Zn2 cos2 (δz )
+Cn2 sin2 (δC ) + Zn2 sin2 (δz )
+2Cn Zn [sin(δC )sin(δZ ) + cos(δC )cos(δZ )]
giving
Bn2 = Cn2 + Zn2 + 2Cn Zn cos(δZ − δC )
δB = arctan(
Cn sin(δC ) + Zn sin(δz )
)
Cn cos(δC ) + Zn cos(δz )
(C.9)
(C.10)
The above result is identical to the formulation Darren Craig used in the mode analysis
write-up. Regardless of the flavor of expressing the stationary error fields, it is clear to
see the impact of the error fields on not only the mode amplitude, but also the phase
of the mode.
DRAFT December 19, 2010
86
Appendix D
MSTFit Misc.
Note: MSTFit solves the Grad-Shafranov equation by solving for the parallel current
density:
Jφ =
2πF F 0
+ 2πRP 0
µ0 R
It does so by iteratively creating a set of flux surfaces, solving for F, and taking
Te and ne data to create a P 0 profile.
D.1
Transport Calculations
Z
PΩ =
E · J dV
(D.1)
(ηJ · J) dV
(D.2)
ηJ 2 dV
(D.3)
Z
=
Z
=
(D.4)
DRAFT December 19, 2010
87
Figure D.1: Ti profile used for fitting and transport calculations.
where η is the neoclassical Spitzer restivity. As η depends on the Z-effective
profile, an assumed profile for Z-effective that is flat in the core and decreasing at the
edge has been applied to all the equilibrium reconstructions. Zef f and Ti profile 28 :
(D.1)
Loss terms include electron-to-ion collision losses:
Petoi = 3
me ne (Te − Ti )
mi
τcoll
where τcoll is the classical electron-ion coulomb collision time, as well as radiative
loss which is empirically scaled to PΩ
Prad (r) = PΩ Crad
r 8
a
where is a coefficient Crad is based off data from the bolometer.
DRAFT December 19, 2010
88
By combining all of these terms, we can arrive at the local electron heat flux Qe :
Qe =
PΩ − Ẇe − Petoi − Prad
4π 2 rρ
Dividing this value by the density and temperature gradient allows us to arrive
at a thermal transport coefficient χe :
χe =
−Qe
ne ∇Te
MSTFit also generates a q-profile from the reconstructed equilibrium, using the
definition q =
rBz
.
RBφ
DRAFT December 19, 2010
89
Appendix E
Calculating χst
χe = vT e Dm
Dm = Lac
Lac ≈
< B̃r2 >
B02
π
∆kk
k·B
|B|
1 m
n =
Bθ + Bφ
|B| r
R
mBθ
nBφ
=
+
r|B| R|B|
n m RBθ
Bφ
=
+
R n r|B| |B|
k|| =
where
q
|B| =
Bθ2 + Bφ2
DRAFT December 19, 2010
(E.1)
(E.2)
(E.3)
(E.4)
90
and
∆k||
∂k|| = ∆r ∂r rs
which gives
∆k||
∂ m RBθ
Bφ n
∆r +
=
R
∂r n r|B| |B| rs
DRAFT December 19, 2010
91
Appendix F
Island width calculation
The island width was calculated using the equation:
s
wmn = 4
rmn b̃mn 1
n Bθ |q0mn |
(F.1)
The modes were assumed to be dominated by m=1 fluctuations. The values
for rn , Bθ , and |q0n | were taken from the MSTFit generated q-profile, its derivative,
and equilibrium field profile, and the local b̃r,mn was obtained from reprocessed edge
coil data, scaled using the same eigenfunctions as with the χe,stoch calculations. The
DRAFT December 19, 2010
92
Chirikov stochasticity parameter was calculated using the equation:
s=
1 wn+1 + wn
2 rn+1 − rn
(F.2)
For the representative data point, the stochasticity parameter between islands
was:
n and n + 1
s
8 and 9
1.22
9 and 10
1.19
10 and 11
1.22
11 and 12
1.05
12 and 13
0.99
13 and 14
1.09
14 and 15
1.06
15 and 16
2.27
DRAFT December 19, 2010