1
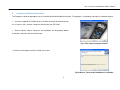
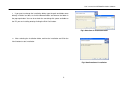
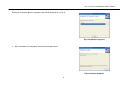
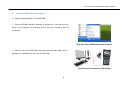
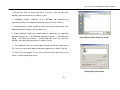
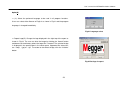
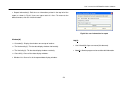
NET200
User’s manual for NET200 Emulation Software
User’s manual for NET200 Emulation Software
Copyright
This user’s manual contains copyright materials.
All rights to this user’s manual are reserved for and belong to Megger Ltd. Copying, distributing
or providing any part of the user’s manual offline or online is illegal and strictly prohibited.
To copy any part of the user’s manual onto any
recording media electronically, physically, in photos, in writing, etc., prior written authorization must be obtained from Megger.
Contents,
specifications, features, functions, and designs included in this user’s manual are subject to change without notice at the manufacturer’s own
discretion as part of our ongoing effort to improve the product.
NOTICE
Megger Ltd. reserves the right to change or update the contents of this manual and change the specifications of its products at any time without
prior notification.
Every effort has been made to keep the information in this manual current and accurate as of the date of publication or revision.
However, no guarantee is given or implied that the document is error free or that it is accurate with regard to any specification.
It is escential that every user who will be using the ‘NET200 Emulation Software’ understands how to use and operate the Megger NET200.
User’s manual for NET200 Emulation Software
CONTENTS
1.
INTRODUCTION TO NET200 EMULATION SOFTWARE................................................................... 1
2.
INSTALLATION OF NET200 EMULATION SOFTWARE .................................................................... 2
3.
HOW TO USE NET200 EMULATION SOFTWARE............................................................................. 6
3.1.
Communication between PC and NET200................................................................................. 6
3.2.
Opening data files ................................................................................................................... 12
3.3.
Analysis of data files................................................................................................................ 14
3.4.
Reporting of measurement results ........................................................................................... 14
User’s manual for NET200 Emulation Software
4.
PROGRAM DISPLAY AND MENU ................................................................................................... 16
4.1.
Data display window................................................................................................................ 16
[Autotest] Tab page........................................................................................................................... 16
[TDR] Tab page ................................................................................................................................ 18
4.2.
Program menu ........................................................................................................................ 19
File(F)............................................................................................................................................... 20
Edit(E) .............................................................................................................................................. 22
View(V) ............................................................................................................................................ 22
Option(O) ......................................................................................................................................... 23
Window(W)....................................................................................................................................... 24
Help(H)............................................................................................................................................. 24
4.3.
Program toolbar ...................................................................................................................... 25
Open data file(
)........................................................................................................................... 25
Save data file(
)............................................................................................................................ 25
Print report(
Create report(
Download data(
)............................................................................................................................... 25
) ............................................................................................................................ 25
).......................................................................................................................... 25
User’s manual for NET200 Emulation Software
1.
Introduction to NET200 Emulation Software
The NET200 Emulation Software is a PC based program running on Microsoft Windows® that enables the user to analyze the waveform data
generated by the NET200. It does this by downloading the results data stored on the instrument to the PC through USB communication.
Recommended PC specifications
- Display resolution: 1024 x 768 pixels or greater
- CPU: Intel Pentium 500MHz or better
- RAM: Minimum128MB
- HDD: Minimum 30MB (this will depend on how many test results you wish to save to your PC)
- OS: Windows 98, Windows Me, Windows 2000, Windows XP, Windows Server 2003
1
User’s manual for NET200 Emulation Software
2.
Installation of NET200 Emulation Software
The Program installation procedure uses the familiar Microsoft Windows® interface. The program is installed by running the installation wizard.
①
Insert the supplied CD-ROM into your CD drive and wait for the disk to auto
run. If auto run fails, execute ‘setup.exe’ directly from the CD-ROM.
②
Please read the notices and terms and conditions for the program before
installation, and then click the ‘Next’ button.
Fig.1 Title step of program installer
③ Click the ‘Next’ button from the installer title screen.
Fig.2 Notices, Terms and Conditions of instalation
2
User’s manual for NET200 Emulation Software
④
If you want to change the installation folder, type the path and folder name
directly in‘Folder’ text box, or click the‘Browse’button and choose the folder in
the pop-up window. You can also check the remaining disk space available on
the PC you are installing onto by clicking the‘Disk Cost’ button.
Fig.3 Selection of installation folder
⑤
After selecting the installation folder, confirm the installation and Click the
‘Next’ button to start installation.
Fig.4 Confirmation of installation
3
User’s manual for NET200 Emulation Software
During the installation process a progress bar will be displayed as in Fig. 5.
Fig.5 Installation in progress
⑥
After installation has completed, click the‘Close’button to exit.
Fig.6 Installation Complete
4
User’s manual for NET200 Emulation Software
⑦
When the installation of the NET200 Emulation Software is successfully
completed, the‘NET200 Emulation Software’item will be created on the
program menu and desktop.
Fig.7 NET200 Emulation Software program menu item
5
User’s manual for NET200 Emulation Software
3.
How to use NET200 Emulation Software
3.1. Communication between PC and NET200
①
Execute NET200 Emulation Software by choosing it’s icon from the start
menu, or by clicking on the desktop icon (if one was created at time of
installation).
Fig.8 Execution of NET200 Emulation Software
②
Connect your PC to NET200 using USB communication cable which is
provided as a standard accessory with your NET200.
Fig.9 Connection between PC and NET200
6
User’s manual for NET200 Emulation Software
③
When the NET200 is connected to PC for the first time, the ‘Found New
Hardware Wizard’ pops up as shown in Fig. 10. Select ‘No, not this time’ option
for Windows Update connection.
Fig. 10 Found New hardware Wizard
④
Select ‘Install the software automatically (Recommended)’ option for wizard
operation as shown in Fig.11.
Fig.11 Wizard operation selection
7
User’s manual for NET200 Emulation Software
The wizard will help the system identify and install the correct driver
automatically as shown in Fig.12.
Fig.12 Searching for the proper device driver
⑤
If the hardware installation warning message as shown in Fig.13 pops up,
please select the ‘Continue Anyway’ button.
Fig.13 Hardware installation warning message
8
User’s manual for NET200 Emulation Software
⑥
When the driver for the device is successfully installed, the user will see the
installation finished message as shown in Fig.14.
Once the driver has been installed and the device has been set up on
your PC, you will not need to run this routine again.
Fig.14 Hardware driver installation finished
⑦
In the main menu of NET200, press the ‘Setup’ button and select
‘Communication’ to get ready to communicate.
⑧
data(
Click ‘File(F) > Download Data(D)’ in program menu or ‘Download
)’ button in toolbar of NET200 Emulation Software. After the physical
connection between PC and NET200 is established, the download data
selection window pops up as shown in Fig.15. The user can check or uncheck
each item to decide whether to download or not. Click the ‘OK’ button to
proceed.
9
Fig.15 Download data selection
User’s manual for NET200 Emulation Software
⑨
After selecting the data type to download, the program enters
communication ready status and stands by until the communication start
button(‘Start(F2)’ button or ‘OK’ button on the NET200) is pressed.
Fig.16 Communication ready
⑩
When communication with the NET200 is established, the program starts
to download the measurement data as shown in Fig.17.
Fig.17 Measurement data download
10
User’s manual for NET200 Emulation Software
After data download and import are completed, the data display window as
shown in Fig.18 is displayed. The user can view and analyze the imported
recorded data in an easy to interpret format.
Fig.18 Data download and transform complete
Received data can be saved as a NET200 data file format(Extension: *.nce) on
the user’s PC by clicking ‘File(F) > Save(S)’ in program menu or the ‘Save data
file(
)’ button from the toolbar.
Fig.19 Downlaod data save
11
User’s manual for NET200 Emulation Software
3.2. Opening data files
Click ‘File(F) > Open(O)’ in the program menu or ‘Open data file(
)’ from the
toolbar. User can load any NET200 data file(Extension: *.nce) by searching in
folder browser. The data file also can be loaded by dragging and dropping the
target file from any windows folder to the program area.
Fig.20 Open data file
12
User’s manual for NET200 Emulation Software
The user can select one or several files at the same time by using Ctrl, Shift or
Alt keys. If four data files are selected at the same time, each data file will be
displayed in separate windows as shown in Fig.21.
Fig.21 Data files loaded in separate windows
13
User’s manual for NET200 Emulation Software
3.3. Analysis of data files
The Data display window has two tab pages, which are ‘Autotest’ and ‘TDR’.
[Autotest] displays measurement data acquired from the ‘Auto Test’ on the NET200 which contains test list and corresponding results (i.e. length,
continuity, 10BASE-T, 100BASE-TX, 1000BASE-T) in detail. Users can readily determine whether test cables are qualified by viewing the test list.
[TDR] displays data from the ‘TDR’ function from the NET200, which are waveform list and actual waveforms relating to each test. In the
waveform window, horizontal axis scales distance can be displayed in meters or feet (user-selectable). The distance is calculated using VOP.
VOP is a parameter that characterizes the speed at which an electrical signal passes through the cable. Please refer to user’s manual of NET200
for further information about VOP.
Vertical axis scales voltage in mV(mili-volts). Two vertical cursors are provided to help user measure specific position and distance between them.
Waveform can be zoomed and moved by using the mouse cursor.
For more detailed explanations, please refer to Chapter 4.
3.4. Reporting of measurement results
The user can create a report for the analyzed measurement results, which can be printed as a hardcopy or be exported to various document file
formats. Select the target data display window and click ‘File(F) > Create Report(R)’ in program menu or ‘Create report(
)’ button in the toolbar,
and you will see the created report in preview window as shown in the example in Fig.22.
To print the report, click ‘File(F) > Print Report(P)’ in program menu. The printed document will be exactly the same as shown in preview window.
To export the report, click ‘File(F) > Export Report(E)’ in the program menu. Exported document format can be ‘*.PDF(Portable Document
Format)’, ‘*.DOC(Microsoft Word)’, ‘*.RTF(Rich Text Format)’, or ‘*.HTML(HTML 4.0)’.
14
User’s manual for NET200 Emulation Software
Fig.22 An example of created report
15
User’s manual for NET200 Emulation Software
4.
Program display and menu
4.1. Data display window
[Autotest] Tab page
Fig.23 shows the main data screen, which displays performed test name and
location, length, continuity, VOP, 10BASE-T, 100BASE-TX, 1000BASE-T, and final
qualification for each test. A detailed explanation for each part is shown below.
Fig.23 Autotest tab page
16
User’s manual for NET200 Emulation Software
① Data Selection Tab: There are 2 tabs displayed, which are Autotest andTDR. Each tab is displayed when corresponding data is available from
download. Tabs will only be displayed if the user has selected that download data category as shown in Fig.15. Each tab is opened by clicking on
the tab names.
② Distance Unit: The NET200 application supports two distance units, which are meter(m) and feet(ft). The user can change the unit of measure
at anytime, and then all the distance and length related measurement results will be recalculated automatically and displayed in the chosen unit
of measure.
③ Test List: This displays index number, test name, length, and final qualification. Length, which is displayed in the result area, represents the
minimum value of the four pair lengths. When a length measurement is not performed, the length shows‘?’. The program decides whether the
test cable is qualified or not by using the 10BASE-T, 100BASE-TX, 1000BASE-T test results. If there is at least one‘FAIL’ in the test results, the
program decides that test cable is qualified, otherwise the test cable is classed as unqualified. Note that any aborted test results will be excluded
in this process.
④ Test Result: Auto test performs 5 measurements at the same time which are length, continuity, 10BASE-T, 100BASE-TX, 1000BASE-T. Appart
from measurement results it displays test name, location, VOP value which is used as a parameter to calculate the lengths. All the measurement
results are displayed for each pair. If a measurement is not performed, the result will be marked as ‘?’. Lengths are calculated based on the
chosen distance unit, and shown with cable end status which can be ‘Open’ or ‘Short’. Continuitie is displayed in units of kΩ. If the value is higher
than 50kΩ, it is shown as ‘Open’. If lower than 200Ω, it is shown as ‘Short’. 10BASE-T, 100BASE-TX, 1000BASE-T measurements determine
whether the test cable is suitable for each Ethernet protocol and displays the result as ‘PASS’ or ‘FAIL’. If the test cable is too short to measure,
the measurement is aborted and the result will become ‘ABORT’.
17
User’s manual for NET200 Emulation Software
[TDR] Tab page
As shown in Fig.24, this displays measured waveform and related VOP,
①
threshold voltage and pulsewidth. In the waveform window, horizontal axis
scales distance and vertical axis scales voltage. User can measure the specific
position and distance using two vertical cursors.
Detailed explanations for each area of this screen are shown below.
②
③
④
Fig.24 TDR tab page
① Waveform Window: Measured waveform is plotted on a graph, including horizontal axis scales distance(m or ft) and vertical axis scales
voltage(mV). Multiple waveforms can be analyzed in identical scales. User can zoom and move the waveform by mouse control. To magnify the
waveform, click the left button and drag from the top left corner to the bottom right corner of the target area. To move the waveform, click the right
button and drag to any location you wish to inspect. To restore the waveform to the default condition, double click inside the waveform window
area. Two vertical cursors are provided that the user can move to the desired position by clicking and dragging.
② Cursor Information: ‘Cursor1’ and ‘Cursor2’ are displayed in red and blue respectively. Their positions from the starting point (at zero in the
horizontal axis) and distance between cursors are displayed.
18
User’s manual for NET200 Emulation Software
③ VOP Setup: VOP(Velocity Of Propagation) is the speed of the electrical waves propagating through a cable, which depends on the cables
unique characteristics, is displayed as a percentage(%). Select the desired waveform from the list, select one of VOP options and the waveform
will be redrawn based on the altered VOP value. To apply VOP setup to multiple waveforms, just select the waveforms in waveform list using Ctrl,
Shift, Alt keys. Program provides 3 fixed VOPs, 66.6%, 78.0%, 82.0%, and a user defined VOP.
User defined VOP can be set by selecting ‘User VOP’ from VOP options
which pops up the VOP set window as shown in Fig.25. The user can then
type the desired value into the text box, which will be applied to selected
Fig.25 User VOP set
waveforms.
④ Waveform List: This displays index number, test name, test location, pair, VOP, Threshold, and pulsewidth. The check box next to index
number decides the visible option of the corresponding waveform. If checked, the waveform will be shown. If unchecked, the waveform will be
hidden. Pair, VOP, Threshold, and pulsewidth are the parameters used to perform the measurement on the NET200, but VOP can be changed by
the user at any time.
4.2. Program menu
The Program menu uses the familiar Microsoft Windows® interface. It
comprises 7 main menus, File(F), Edit(E), View(V), Option(O), Utility(U),
Window(W), Help(H).
Fig.26 Program menu
19
User’s manual for NET200 Emulation Software
File(F)
① Open(O): Load a saved measurement data file. File extension should be
‘*.nce’. For a detailed explanation, please refer to section 3.2.
② Save(S): Store the downloaded data or modified data file. To save the
modified data file, the user selects the save option as shown in Fig.27.
Fig.27 Save option
User can then select the directory and name of file as shown in Fig.28.
Fig.28 Save data file
20
User’s manual for NET200 Emulation Software
③ Save As(A): Save the active data file to a new file. User can select the
directory and name of the file as shown in Fig.28.
④
Download Data(D): Copnnect to the NET200 and download the
measurement data. For a detailed explanation, please refer to section 3.1.
⑤ Create Report(R): Create a report for all the active measurement data. For a
detailed explanation, please refer to section 3.4.
⑥ Export Report(E): Export the created report to a document file. Supported
document formats are ‘*.PDF(Portable Document Format)’, ‘*.DOC(Microsoft
Word)’, ‘*.RTF(Rich Text Format)’, ‘*.HTML(HTML 4.0)’. Users can select the
directory and name of the document as shown in Fig.29.
⑦
Fig.29 Export report to PDF file format
Print Report(P): Print the created report through any printer installed on the
PC. Users can set the print options and printer properties as shown in Fig.30.
⑧
Exit(X): Exit the program. Ensure that any measurement data you wish to
retain is asved correctly prior to exit.
Fig.30 Report print option
21
User’s manual for NET200 Emulation Software
Edit(E)
①
Select All(A): Select all the items in the active test list or waveform list.
②
Delete(D): Delete selected item(s) in active test list or waveform list. Users can select multiple items at once using Ctrl, Shift, Alt keys. Note
that deleted items can not be recovered.
③
Edit Test Name(N): Change the test name of the selected item(s) in activated test list or waveform list. Users can select multiple items as in
the ‘Delete’ function.
④
Edit Test Location(L): Change the test location of the selected item(s) in activated test list or waveform list. User can select multiple items as
in the ‘Delete’ function.
View(V)
①
Toolbars(T): Show or hide the toolbar at the top of the program window.
②
Status bar(S): Show or hide the status bar in the bottom of the program window.
22
User’s manual for NET200 Emulation Software
Option(O)
①
(L): Select the preferred language to be used in all program functions.
Users can select either Korean or English as shown in Fig.31 and the program
language is changed immediately.
Fig.31 Language select
② Report Logo(R): Change the logo displayed in the right top of the report as
shown in Fig.32. The user can alter the image by clicking the ‘Search’ button
and browse to the directory where the target file is located. The selected image
is displayed in the preview box in the center pane. Supported file extensions
are ‘*.bmp’, ‘*.jpg’ or ‘*.gif’. To restore to the default image, click the ‘Initialize’
button.
Fig.32 Set logo in report
23
User’s manual for NET200 Emulation Software
③ Report Information(I): Edit the user information printed in the top left of the
report as shown in Fig.33. Users can type a total of 3 lines. To restore to the
default content, click the ‘Initialize’ button.
Fig.33 Set user information in report
Window(W)
Help(H)
①
Cascade(C): Display the windows one on top of another.
②
Tile Horizontally(V): Tile the data display windows horizontally.
① User’s Manual(M): Open user manual (this document).
③
Tile Vertically(H): Tile the data display windows vertically.
② About(A): Show the program version and other brief information.
④
Close All(L): Close all the data display windows.
⑤
Window List: Show a list of the opened data display windows.
24
User’s manual for NET200 Emulation Software
4.3. Program toolbar
The Program toolbar uses the familiar Microsoft Windows® interface. It
comprises 5 items, Open data file, Save data file, Print report, Create report,
Fig.34 Program toolbar
Download data.
Open data file(
)
Save data file(
Print report(
Create report(
Download data(
Perform the same function as ‘File(F) > Open(O)’ in program menu.
Perform the same function as ‘File(F) > Save(S)’ in program menu.
)
Perform the same function as ‘File(F) > Print Report(P)’ in program menu.
)
Perform the same function as ‘File(F) > Create Report(R)’ in program menu.
)
)
Perform the same function as ‘File(F) > Downlaod Data(D)’ in program menu.
25