1
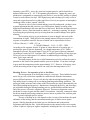
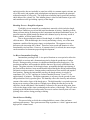
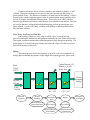
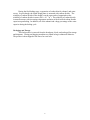
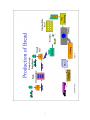
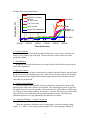
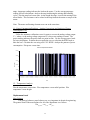
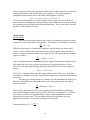
2213
Engineering Experiments Utilizing an Automated Breadmaker
By
Robert P. Hesketh, C. Stewart Slater, and Carol Rea Flynn,
Chemical Engineering, Rowan University, Glassboro NJ 08028-1701
Prepared for 2001 ASEE Annual Conference Session 2213, June 26, 2001
Breadmaking is a technology with a long history, starting with the Egyptians baking
loaves of bread over 6000 years ago. Since then, the process of bread making has
become fully automated through the use of bulk transportation of ingredients, large
mechanical mixers, conveyors, environmentally controlled proofing chambers, high
efficiency ovens, cutters, and packaging equipment. This process of bread making can be
classified into several unit operations including particle transport, mixing, fermentation,
and baking. This industrial process has been fully automated in the relatively new bench
top breadmaking machines. At Rowan we have used breadmaking machines for a
number of experiments starting with freshman level mass balances, reverse engineering,
data acquisition, to upper level heat transfer, biochemical reactions, and mixing. These
relatively modest priced machines also have the added advantage of filling the laboratory
with the ever pleasing aroma baking bread!
This paper contains descriptions of the experiments that have been conducted with
breadmakers and presents methods for incorporation of these ideas into existing
engineering courses.
Purpose:
The breadmaker uses many chemical engineering principles. Data acquisition,
which is useful to anybody in engineering, and can be taught at a freshmen level, heat
transfer, which can be done at a junior level, and many others that we will not discuss
here. In this workshop we will show you experiments starting from a freshman level data
acquisition, to juniors level heat and mass transfer.
Background:
Introduction
The Egyptians made the first loaves of bread over 6000 years ago. Since then, the
process of bread making has become fully automated through the use of bulk
transportation of ingredients, large mechanical mixers, conveyors, environmentally
controlled proofing chambers, high efficiency ovens, cutters, and packaging equipment.
The process of bread making can be separated into a series of unit operations –
transportation of materials, mixing, fermentation, and baking. Each unit operation has
mechanical / electrical function and/or chemical reactions associated with the unit
operation.
Raw Materials & Addition of Ingredients
Bulk handling of ingredients is commonplace. Raw materials are packaged in
large bags, tanks, vats, etc. and brought to the bakery via truck, refrigerated tank system,
or rail car. Commercial bakeries are equipped to store ingredients in humidity and
temperature controlled silos, tanks, and warehouses.
The ingredients are added to the “mix” or batch in several different ways. Dry
ingredients are generally weighed and dumped into the batch via large rolling troughs.
Liquid ingredients are typically metered and flow into the batch via a piping system.
Mixing
Mixing is the second step in the baking process. The manner, which it is carried
out, determines the state of dispersion of ingredients and, in turn, the efficiency of
processing and quality of the final product.
Most bread processes incorporate the premixing of the dry ingredients. This
ensures uniformly distributed ingredients, especially small quantity ingredients such as
salt, sugar, or vitamins. Premixing prevents localized concentrations of minor ingredients
and reduces the total mixing time, hence, reducing the heating that normally accompanies
the thorough and lengthy mixing of dough.
Incorporation of water – Liquid Phase
When water is added to dry flour, it is adsorbed, initially, to form a one-phase
system with the flour; this water is “said to be bound”. The dry gluten, a constituent of
flour, swells in water. When the water content reaches a value in the region of 30-35%
by weight, a second aqueous phase appears. This is a liquid phase, which dissolves
soluble flour components, which becomes dispersed in dough during mixing. The liquid
phase provides the medium for reactions to take place in the dough and for carbon
dioxide to dissolve and diffuse to the gas cells. The importance of the liquid phase for
gas production in fermenting dough is to provide the aqueous solution of sugar to “feed”
the yeast.
Proper amount of water provides an aqueous phase, which is dispersed not
continuous. The aqueous phase remains dispersed in dough if the water content remains
below approximately 35% by weight. With increase water content above 35%, the
electrical conductivity shows a dramatic increase, indicating a continuous phase rather
than a dispersed liquid phase.
Bulk Fermentation or “Rest” Period – Biotechnology of Yeast
Bulk fermentation incorporates the 6000-year-old biotechnology of yeast.
Fermentation begins when the yeast is added to a solution of sugar, water, and milk.
Baker’s yeast is a unicellular, eukaryotic micro-organism belonging to the fungi and
usually the strain of the species Saccharomyces cerevisiae. Two types of baker’s yeast
are compressed yeast or fresh yeast and dried yeast. Most commercial bakers utilize the
traditional compressed yeast, which has high gas production, but is perishable and has a
short shelf life. Dried yeast can be found in two forms – active dry yeast (ADY) and
2
instant dry yeast (IDY). Active dry yeast has irregular particles, which should be rehydrated with water at 35 – 45° C for optimum gas production. Instant dry yeast’s gas
production is comparable to compressed yeast; however, once the IDY package is opened
it must be used within a few days. IDY high porosity and rod shape gives easy access of
water and oxygen that results in a rather rapid loss of activity on exposure to atmospheric
conditions, hence a short “opened” shelf life.
The precise role of yeast in bread making is not fully understood, yet there is now
a general agreement that the yeast has a two-fold function, namely leavening of the
dough and contributing to the taste and flavor of the bread. Before the mechanical action
of kneaders / mixers, yeast functioned in a third role, “maturing or ripening” the dough
by utilizing the gas-producing activity to bring about the essential changes in the gluten
structure.
The leavening activity or gas production of yeast in dough is the result of the
fermentation of sugars. With glucose as the starting material, this process involves a
sequence of enzymatic reactions, the sum of which can be represented as follows:
C6H12O6 (Glucose) + 2 ADP + 2 P
2 C2H5OH (Ethanol) + 2 CO2 + 2 ATP + 2 H20
According to this equation, about 0.29 grams of carbon dioxide or leavening gas, is
produced per gram of glucose fermented. At a dough temperature of 30 C and at
atmospheric pressure, this would mean 276 ml of CO2 per gram of glucose fermented.
According to a study by H.W. Van Dam, ADY is capable of producing 160 ml of gas per
285 mg of yeast in a time span of 165 minutes in standard dough consisting of flour,
water, yeast, sugar, and salt.
The main purpose for the rest or bulk fermentation period is to allow the water to
penetrate to the center of the granules and the yeast to re-hydrate. Yeast does not begin
to grow until the temperature reaches approximately 30°C. However, if the mixer is not
cooled, the mixing action of large mixers can easily raise the temperature to 30°C.
Å
Kneading Process – Incorporation of Air or Gas Phase
The incorporation of air during the mixing is a vital step. These bubbles form the
nuclei for gas cells, which later expanded as carbon dioxide from the fermentation
process diffused into them. No new cells develop after the mixing/kneading processes,
only subdivision of existing cells occurs during punching and molding operations. The
grain (gas bubble structure) and volume of the final product are largely determined by the
end of the kneading/mixing process. Batch mixers continually draw new, and often large,
gas air bubbles during the mixing/kneading process, and the bubbles enfolded near the
end of the process will not be completely dispersed. This uneven dispersion creates
bread that is courser in grain and the crumb is less uniform. Generally, commercial white
breads are manufactured using continuous process mixers to produce fine, uniform grain
structure bread with high specific volume.
The ease of beating in air cells depends on the viscosity of the medium, the speed
and nature of the mixing, and the concentration and types of surface-active agents
present. Stability depends on the initial gas size distribution and on the natural
surfactants stabilizing the film. Lipids and proteins are the natural surface-active agents
of flour. Lipids are a group of organic compounds, including the fats, oils, waxes, sterols,
3
and triglycerides, that are insoluble in water but soluble in common organic solvents, are
oily to the touch, and together with carbohydrates and proteins constitute the principal
structural material of living cells. The lipids form a lamellar liquid crystal line structure,
which behave like a plastic fat. This lamellar phase is ideal for stabilization of gas cells
and contributes to the gas holding capacity of the dough.
Kneading Process - Dough Development
For highly viscous materials or pseudoplastic materials, which includes dough,
laminar flow conditions prevail and the major mechanism of mixing / kneading is shear.
Shear performs mixing by drawing out the components into thinner and thinner layers. In
practical terms the gluten strands are drawn into a thinner layer by the rotary action of
blades, paddles, or helical metal ribbons.
Due to the pseudoplastic nature of bread dough, it is difficult to design an
efficient mixer. With bread dough, the viscosity and mixing velocity, two of the most
important variables affecting power input, are independent. The apparent viscosity
decreases with increasing rate of shear. Therefore, mixer speed and duration is often
formulated by trial and error. However, if constant velocity is utilized, the motor torque
can be monitored to determine proper dough development.
1st Rise or Intermediate Proofing
Intermediate proofing or the 1st rise period functions as a rest period to allow the
gluten fibrils to reorient and a fermentation period to begin the production of carbon
dioxide. During proofing, moisture is redistributed throughout the dough piece. Gas
production continues, and expands the bubbles that were previously established in the
dough. The gluten structure of the dough relaxes, presumably through repositioning of
the protein fibers that have been stretched and distorted during the mixing and kneading.
Enzymatic reactions continue, forming maltose and dextrose from starches and peptides
from proteins. During the intermediate proofing, the dough mixture is raised to a
temperature 28°C to 30°C and kept at a relative humidity between 70 and 75 % for
approximately 10 minutes. The higher temperature is necessary for the growth of yeast
and production of the by-product gases. The humidity affects the elasticity and moisture
content of the surface layers of the dough piece. The high humidity is required to prevent
drying out or crusting of the surfaces of dough pieces during the time they are in the
enclosure. On the other hand, if the humidity is allowed to rise near the dew point, there
will exist the danger of the water condensing on the surface of the dough. This will cause
spotting on the finished bread surface and a decrease in surface elasticity that will cause
splitting of the surface during proofing or baking.
Punch Down or Molding
This process helps to divide the existing bubbles to create a finer and more
uniform grain structure. Finer grain structure helps to produces a “white” appearance and
high specific volume bread.
4
Commercial bakeries utilize dividers, rounders, and molders to produce a “loaf”
of bread. During the dividing process much of the gas is pressed out and cutting of
gluten strands occurs. The function of rounders is to heal some of this damage. A ball is
formed by the rounder which has surface areas of oriented gluten that are partially dried
by loss of moisture and addition of dusting flour. This layer acts as a fairly effective
barrier to gas diffusion and allows carbon dioxide to accumulate in the interior. Thus the
gas vesicles that have collapsed and subdivided during previous processing are once
again inflated. A result of dividing, rounding, and molding is that the grain becomes
finer and more uniform.
Final Proof, Pan Proof, or Final Rise
Pan proofing or final rise is the stage in which a piece of dough, having
previously undergone mechanical manipulation establishes the form of the final product.
Once again, expansion and moisture redistribution takes place during pan proofing. The
dough begins to fit itself to the pan contours and establish a layer of coalesced vesicles
that will be the basis of the crust.
Baking
The baking process serves two functions, to provide oven rise or expansion of
dough, and to transform the structure of the dough with separate gas cells, into a solid
sponge-like structure in which the gas cells are interconnected. The ease of dough
expansion or oven rise is aided by the decrease in dough viscosity between room
temperature and 60° C. The bread dough continues to rise in the oven, through carbon
dioxide production by yeast during the first stage of baking. TheCarbon
production
of gas
stops
Dioxide,
CO
2
Water
when the yeast is inactivated by heat at a temperature of about 55°
C. Oven
is also
Ethanol,
C2Hrise
6OH
70-80F
the expansion of occluded gas as a result of the increase in temperature.
loaf will
Water, HThe
20
21-27C
continue to expand until the resistance to deformation is greater than the gas pressure.
Starch gelatinization and evaporation of water from the surface cause the formation of a
hard surface layer, the crust, which obstructs expansion. Starch gelatinizaton is the most
obvious explanation for the transformation of the viscous dough into a predominately Slicing
solid baked product. The dramatic increase in viscosity begins to occur at temperaturesWrapping
Dry
Mix 60°C and 75°C. This is revealed by the dramatic increase in viscosity.
between
Storage
70F-80F
Yeast
70F-80F
Material
Transport
100F-110F
38C - 43C
Mixing
Kneading
Chemical Reaction
Gluten Formation
Fermentation
Rise
Baking
Heat Transfer
Heat Transfer
Chemical Reaction
Fermentation
5
350F-375F
177C-191C
Chemical Reaction
Gelatinization
Packaging
of Product
During the final baking stage, evaporation of carbon dioxide, ethanol, and water
occurs. In yeast dough, the liquid dough phase is saturated with carbon dioxide. The
solubility of carbon dioxide in the dough is on the same order of magnitude as the
solubility of carbon dioxide in water (0.81 x 10 –3 m3). The solubility of carbon dioxide
in water decreases with increasing temperature and most of the dissolved carbon dioxide
vaporizes upon baking. In addition, all of the ethanol and a large percentage of the water
vaporize during the baking cycle.
Packaging and Storage
The final product is removed from the bread pan, sliced, and packaged for storage
and shipment. Cutting and bagging machines are found in large commercial bakeries.
The product is then shipped to the stores for retail sale.
6
7
Description of Breadmaker Components
Bread Pan – Aluminum alloy bread pan
with nonstick coating. The dimensions of
the pan are 5.29” x 5.29” x 5.49” The
tapering and rounded corners of the pan
produces an approximate volume of 2230
cm3.
Oven Chamber and Heating Element –
The dimensions are 7” x 7 ½” x “. A
single 430 W heating element with 49.6
KΩ at 25°C encircles the oven chamber.
The resistance of the element decreases as
it heats up.
Vent and Lid - The unit has a 2 13/16” x
13/16” vent in the lid to exhaust the gas
vapors from the heating chamber. The lid
is plastic on the outside with an inner
metal insert on the interior of the
chamber. The lid is equipped with a 1/8”
thick, 2 ¾” square sight glass.
Motor and Pulley - ECM Motor CA-161200-T, 01R06, 120 V 60 HZ 30 W.
Motor Shaft
1755 RPM Full
1300 RPM Pulse Speed
Pulley Ratio
130 teeth on kneading blade shaft / 20 teeth on motor shaft
= 6.5 Turn down ratio
Kneading Blade Rotation
270 RPM Full
200 RPM Pulse Speed
Motor Load – No load
0.58 Amps
67 Watts
Mixer Blade
Motor Drive
Shaft
T = 2.37 Nm
n = 1755
T = 0.36 Nm
n = 270
2
13
Control Board - The breadmaker has two circuit board consists of Liquid Crystal
Displays, Push Switches, Resistors, Capacitors, a buzzer, Fuses, Diodes, Quench arcs, a
8
coil, and a microchip. The unit has temperature feedback, timer capability, and 14
preprogrammed modes.
Framework and Part Construction – The lid and control panel shell of the breadmaker is
formed out of a high temperature and impact resistant plastic. The side and bottom of the
unit is stamped out of stainless steel. The side panels have been power coated to resist
scratching. Rubber pads help to absorb the vibration caused by mixing and kneading.
Experimental Procedure:
This laboratory experiment is divided into several parts. It begins with material
appropriate for a freshman level class, followed by sophomore material, then material for
a junior level class. The freshman portion involves data acquisition, simple calculations,
and taking measurements. The sophomore and junior level portions involve advanced
calculations, modeling systems, and mass and energy balances.
Freshman Level Material
1 - Volume of Bread Pan
In order to calculate the final volume of the bread you must know the initial
volume of the pan; therefore the first step we take is to measure the volume of the pan.
With the kneading blade in the bread pan, fill the bread pan with rice until the rice is level
with the top of the bread pan. Use a graduated cylinder to measure the volume of this
rice.
2 - Addition of Ingredients and Setting of Breadmaker for a 1 Lb. Loaf
Convert the standard white bread ingredient measurements into standard gram
masses, and calculate the standard weight formulation percentage.
Water
Salt
Butter
Flour
Dry Milk
Sugar
Yeast
235.0
6.0
225.0
140.0
100.0
200.0
656.0
g / cup
g / tsp
g / cup
g / cup
g / cup
g / cup
g/L
6.50
1.00
1.00
2.25
1.00
1.00
1.25
8 oz
48 tsp
16 tbsp
1 tsp
=
=
=
=
1 cup
1 cup
1 cup
4.92 mL
oz
tsp
tbsp
cup
tbsp
tbsp
tsp
Total Mass
9
Standard Mass (g)
190.9
6.0
14.1
315.0
6.3
12.5
4.0
548.8
Percent Mass
34.8%
1.1%
2.6%
57.4%
1.1%
2.3%
0.7%
100.0%
Weigh the empty bread pan and kneading blade, then weigh and add the ingredients in
the following order:
1. Water – Use 250 ml beaker to measure out approximately 200 ml. Add the
standard weight amount – 190.9 grams to the empty bread pan.
2. Salt – Use the small plastic containers to weigh out the standard weight amount –
6 grams.
3. Butter – Use a plastic knife and a small plastic container to weigh out the
standard weight amount – 14.1 grams.
4. Flour – Add the flour directly to bread pan. Tare the scale to zero after weighing
the bread pan with ingredients 1-3 and add the standard weight amount – 315.0
grams.
5. Sugar - Use the small plastic containers to weigh out the standard weight amount
– 12.5 grams.
6. Yeast – Form a small hole in the top of the flour. This will contain the yeast and
keep the yeast away from the liquid until the mixing stage begins. Use the small
plastic containers to weigh out the standard weight amount – 4 grams.
Classic White Bread Ingredients
1.1%
0.7% 1.1%
2.3%
57%
Flour
2.6%
35%
Water
Yeast
Salt
Dry Milk
Sugar
Butter
Water
Flour
Percentage by weight
Once the ingredients have been measured and placed in the pan, weigh the pan
with the ingredients in the pan.
Next place the bread pan into the oven chamber with the pan turned a little
counterclockwise. To lock the pan in position, turn the pan clockwise (in the direction
marked “Lock” on the pan). Make sure the pan has been set securely in the oven
chamber to ensure proper mixing and kneading. Close the lid.
Plug the breadmaker into the outlet. The number “0:00” will flash on the display.
Choose the proper setting on the breadmaker:
1. Depress the Stop to clear the display.
2. Depress the Select button until the display reads 3. This is the Regular Light
Setting on the Regal Breadmaker.
Do not press start at this time.
10
3 - Data Acquisition Setup:
The breadmaker experiment will use two computers for data acquisition. The first
computer will be used to record the temperature of the bread using thermocouples, and
the second will be used to record the power usage of the breadmaker during the entire
run. Two computers are necessary in this experiment because they record data over
different time intervals and use different sampling rates.
On Both Computers:
Once the computer is turned on, open Microsoft Excel. While the program is still
loading, you will be asked if you want to open DaqView. Opt “yes”. Once the program
has completed loading depress the DaqView button in the taskbar to activate the
DaqView menu. Press “File”, then “Open”, and open the file named “settings.daq”.
4 – Beginning Data Collection
Once the experiment has been properly set up, begin data collection as follows.
Simultaneously depress both the start button on the breadmaker, and the manual trigger
on computer #2. Do this by clicking on the green arrow in the top right of the Excel
screen, then clicking the button that pops up reading “Manual Trigger”. “2:40” will
appear on the breadmaker display.
When the timer on the breadmaker reads “2:00”, insert the thermocouples into the
dough. Then press the manual trigger on the second computer. (At the 1:37 mark, you
will need to remove the thermocouples for two minutes while the breadmaker kneads.)
Please note that the DaqView program will automatically turn itself off, and write data
into Excel.
5- Saving Data and Ending Computer #1 and #2A
Once the data has been collected press the save button. This will save your data in
a file called data.xls.
11
Example Data Acquisition Results
Bread Pan Outside Wall
Inside Wall of Heating
Chamber
2.5" from Center
200.0
Temperature (°C)
180.0
160.0
Pan Wall
1 7/8" from Center
140.0
Wall
Bread 1
Bread 2 & 5
Center of Bread
120.0
Exterior Wall Breadmaker
100.0
80.0
60.0
40.0
Ext. Wall
20.0
0.0
Mixing
Cycle
0:00:00
Rest
Cycle
Knead
Cycle
0:30:00
First Rise
Cycle
1:00:00
Second Rise
Cycle
1:30:00
Baking
Cycle
2:00:00
2:30:00
Time (hr:min:sec)
6 - Volume of Bread
Once the bread is finished baking, and has had time to cool, pour rice into the pan
until it is level with the top of the pan. Then measure the volume of the rice with a
graduated cylinder.
7 – Mass Balance
Weigh the bread, and find the mass of the gases that left the bread by subtracting the
mass of the ingredients.
8– Moisture Content
To find the amount of water in the bread, to complete the mass balance, put the baked
bread into an oven to completely dry it out. After at least 12 hours in the oven weigh the
bread, and subtract this weight from the final weight of the bread to find the amount of
water that was in the bread.
9 – Volume of Gas Retained
Given the volume of the dough from prior experiments, subtract the volume of the
baked bread to obtain the volume of gas retained. Next calculate the volume of gas that
the added amount of yeast can generate. Research states the ADY produces 160ml of gas
per 285mg of yeast in approximately 165 minutes. Calculate the loss of gas retention and
yeast efficiency due to punching and poor gluten holding capacity. This indicates a
minimum amount of CO2 gas generated by the difference in volume.
10 - Amperage Readings – Analog Conversions
Utilize the wattmeter calibration curve for amperage to correct the analog voltage
output. Y =, where x is the analog voltage output and Y is the amperage readings in
12
amps. Amperage reading indicates the load on the motor. Use the average amperage
reading for later calculations. Analyze the amp load during the mixing and kneading
cycles. Plot the amp load versus time. As the dough develops, it resists the turning of the
mixer blades. This resistance can be related to the amp load on the motor or torque of the
motor.
Note: The motor and heating element never run at the same time.
11 - Power Consumption Readings – Analog Conversions and Analysis of Power
Consumption Cost
Utilize the wattmeter calibration curve for watts to correct the analog voltage output.
Y =, where x is the analog voltage output and Y is the power readings in watts. The
power reading indicates the power load at a point in time. Use the average power loads
for later calculations. Evaluate the area under the curve to calculate the KWH used to
bake the loaf. Calculate the cost using a $0.1215 /KWH. Analyze the pattern of power
consumption. Plot power versus time.
Power Consumption of Breadmaker
500.00
400.00
Power (W)
300.00
200.00
100.00
2:38:25
2:34:49
2:31:13
2:27:37
2:24:01
2:20:25
2:16:49
2:13:13
2:09:37
2:06:01
2:02:25
1:58:49
1:55:13
1:51:37
1:48:01
1:44:25
1:40:49
1:37:13
1:33:37
1:30:01
1:26:25
1:22:49
1:19:13
1:15:37
1:12:01
1:08:25
1:04:49
1:01:13
0:57:37
0:54:01
0:50:25
0:46:49
0:43:13
0:39:37
0:36:01
0:32:25
0:28:49
0:25:13
0:21:37
0:18:01
0:14:25
0:10:49
0:07:13
0:03:37
0:00:01
0.00
-100.00
Time
12 – Temperature Analysis
Plot the temperature versus time. Plot temperature versus radial position. Plot
temperature versus height.
Sophomore Level
Mass Balance
Like Energy balances, mass balances are very important in chemical engineering.
The general form of the mass balance for all of the ingredients is as follows.
Σmingedients = mbread + m gasses
13
Since we know the mass of the ingredients, and the mass of the bread, then we can easily
complete this balance, and find the mass of the exit gases. We can also perform a
component balance on the water in the bread, which appears as follows.
mwater in flour + m water = mwater in bread + mwater in gas
To solve this mass balance we use the literature values for mass of water in flour, the
mass of water as an ingredients is known, and we can find the mass of water in the bread
by evaporating it out, and taking the initial and final mass. Then we can easily calculate
the mass of water that left as a gas.
Junior Level
Energy Balance
There are several energy balances that a junior level student can perform, such as
a balance over the bread, and over the machine. The balance over the bread is as follows.
dE
= E in − E out
dt
Where the only energy in is through the wattmeter, and the energy out can be called
‘Losses’. Since we know that not all of the energy from the heater reaches the loaf of
bread we can put a constant in front of the energy in term. This means that our equation
appears as follows.
dE
= ζ * Watts − Losses
dt
Since we know that the air surrounding the bread dough is hotter than the dough itself, it
follows that the only losses are those from the gasses leaving the dough as it cooks.
Since H2O is the only significant gas that leaves the bread, the Losses term changes as
follows.
Losses ≈ − H H 2O * m H 2O
If m*Cp*T is substituted for E then the energy balance can be solved, if Cp, mass flowrate of the gas, enthalpy of the gas, initial and final temperature, and initial and final time
are known.
The other type of energy balance is a balance over the breadmaker instead of over
the bread. The balance over the bread maker has the same general form, but instead
evolves as follows.
dE
= Wattmeter − Losses
dt
In this case we know that all of the watts are going into the breadmaker, and that the
losses term encompasses gasses, and convective losses due to heat transfer. To find the
heat transfer coefficient we approximate the surfaces of the breadmaker as smooth
horizontal and vertical plates. We can further simplify the calculations by using
approximate equations. As such the calculations are as follows.
Horizontal Surface: h = 1.32(
∆T 1/4
)
L
14
∆T 1/4
)
(From p 358 of Heat Transfer by J.P. Holman)
L
Where ∆T is the difference between air temperature and wall temperature (if the
temperature at the center of the wall is used calculations are still accurate), and L is the
length of one side of the square surface. Although these numbers are approximations, the
approximation is very good. Once all of the convective heat loss coefficients have been
found, you can find the heat loss through each of the surfaces, sum them, and also add the
heat loss for the gasses leaving. Once this is done, you will have completed the energy
balance.
Vertical Surface: h = 1.42(
Alternative Studies:
Viscosity of Dough During Mixing, Kneading, and Dough Development
As the dough develops, it resists the turning of the mixer blades. This resistance
can be related to the amp load on the motor or torque of the motor. The resistance can
also be measured by a Cup-Type Viscometer; measure the viscosity at different stages of
mixing.
Environment - Water
Water is a major ingredient of bread and the quality of the water affects the
quality of the bread. Measure the pH and conductivity of the water. Measure the
hardness. Use distilled or RO water to make the bread. Compare the quality of the
bread.
Environment – Gas Evolution
Measure the CO2 and Ethanol Emissions. The gauge-type instrument reads the
pressure developed in a sealed bomb after a given time, while the manometric apparatus
allows the lab to follow the evolution of gas as a function of time. The manometric
equipment is less expensive. Research bakery emission regulations.
Particle and Bubble Size Distribution
Analyze the particle size distribution of the bread. Vary mixing time to establish
effect on grain size.
15
Materials of Construction
Investigate materials of construction such as, nonstick coating, ceramic fiber seal,
aluminum alloy bread pan, plastic parts, rubber feet, etc. Investigate improving the
quality of product and / or cost by material substitution and upgrade.
Design Improvements
Test different possible design improvements to optimize the bread making process.
These improvements could include finding the optimal temperature for yeast activity,
reducing oven temperature, controlling the humidity of the dough as it cooks, and many
other things.
16
Bibliography:
Blanshard, JMV; Frazier, PJ; and Galliard, T. (1986) Chemistry and Physics of Baking.
Published by The Royal Society of Chemistry.
Kirk-Othmer. Concise Encyclopedia of Chemical Technology. Published by Wiley
Interscience Publication.
Jess. (1996). Selecting a Bread Machine. Published by Ohio State University
Extension.
Matz, Samuel A. (1992). Bakery Technology and Engineering. Published by Van
Nostrand Reinhold.
Staff. (1995). Reference Source 95-96. Statistical Reference Manual and Specification
Guide for Commercial Baking. Milling and Baking News. Published by Sosland
Publishing Co.
Staff. (1997). Regal Kitchen Pro Collection Automatic Breadmaker Guide and
Cookbook for Model K6744. Published by Regal Ware, Inc.
Staff. (1995). Omega RH70-BE Handheld Temperture and Humidity Indicator
Operator’s Manual. Published by Omega Engineering.
Staff. Instruction Manual for WD-768 2 KW, 20A Digital Wattmeter. Published by
Vector-Vid, Inc.
Staff. Daqbook/Daqboard/DaqPCMCIA User’s Manual.
Biographical Information
C. Stewart Slater is Professor and Chair of Chemical Engineering at Rowan University. He received his
B.S., M.S. and Ph.D. from Rutgers University. Prior to joining Rowan he was Professor of Chemical
Engineering at Manhattan College where he was active in chemical engineering curriculum development
and established a laboratory for advanced separation processes with the support of the National Science
Foundation and industry. Dr. Slater’s research and teaching interests are in separation and purification
technology, laboratory development, and investigating novel processes for interdisciplinary fields such as
biotechnology and environmental engineering. He has authored over 70 papers and several book chapters.
Dr. Slater has been active in ASEE, having served as Program Chair and Director of the Chemical
Engineering Division and has held every office in the DELOS Division. Dr. Slater has received numerous
national awards including the 1999 and 1998 Joseph J. Martin Award, 1999 Chester Carslon Award, 1996
George Westinghouse Award, 1992 John Fluke Award, 1992 DELOS Best Paper Award and 1989 Dow
Outstanding Young Faculty Award.
Robert Hesketh is Associate Professor of Chemical Engineering at Rowan University. He received his
B.S. in 1982 from the University of Illinois and his Ph.D. from the University of Delaware in 1987. After
his Ph.D. he conducted research at the University of Cambridge, England. Prior to joining the faculty at
Rowan in 1996 he was a faculty member of the University of Tulsa. Robert’s research is in reaction
engineering, novel separations including supercritical fluids and ultrafiltration, green engineering, an the
17
chemistry of gaseous pollutant formation and destruction related to combustion processes. Robert employs
cooperative learning techniques in his classes. His teaching experience ranges from graduate level courses
to 9th grade students in an Engineering Summer Camp funded by the NSF. Robert’s dedication to teaching
has been rewarded by receiving several educational awards including the 1999 Ray W. Fahien Award, 1998
Dow Outstanding New Faculty Award, the 1999 and 1998 Joseph J. Martin Award, and four teaching
awards.
Carol Rea Flynn was a graduate student at Rowan University and now works for Wheaton.
18