1
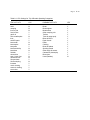
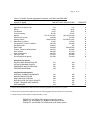
Page # II- 1
USERS' MANUAL
PART II. MI-REC SOFTWARE
The MI-REC system consists of a set of utilities and customized procedures for estimating the economic
impacts of recreation and tourism using the Micro-IMPLAN program. MI-REC will help you to (1) define your
recreation and tourism problems in terms amenable to the application of input-output models, (2) prepare
recreation and tourism spending data for use with IMPLAN, (3) bridge and margin recreation and tourism
spending data to the IMPLAN sectors, (4) carry out impact analyses within IMPLAN, (5) aggregate models or
IMPLAN reports to highlight sectors affected directly or indirectly by recreation and tourism spending, and (6)
summarize, interpret and report the results of an economic impact analysis.
CHAPTER 6. MI-REC SOFTWARE OVERVIEW
MI-REC Utilities
INSTALLATION & SET-UP
STANDARD MI-REC PROCEDURES
CHAPTER 7. ESTIMATING RECREATION AND TOURISM SPENDING
Trip Spending Estimator -- TRIP.XLS
Structure of the Workbook
Summary of Procedures
Steps to Estimate Spending and Economic Impacts
Durable Goods Spending Estimator-- DRBL.XLS
MI-REC Spending Data Sets
Creating new spending data sets
CHAPTER 8. ESTIMATING REGIONAL ECONOMIC IMPACTS
Estimating a model
Impact Analysis
Retrieving or Importing Activity Databases & Scenarios Files
Entering Activity Levels & Scale Factors
Estimating Impacts of Current Scenario
Viewing & Aggregating Reports
Alternatives for Generating Activity Database and Scenario Files
Notes on LPC’s (Local Purchase Coefficients)
Adjusting MI-REC to Years After 1990
Page # II- 2
CHAPTER 6. MI-REC SOFTWARE OVERVIEW
MI-REC UTILITIES
The MI-REC system is a collection of files and utilities designed to work with the IMPLAN system
(version 91-F). Three kinds of files/utility programs are provided. These utilities are designed to work together,
with consistent definitions of spending categories and units of analysis across the different programs and data files.
(1) Recreation/Tourist Spending Estimator. Excel 5.0 workbooks TRIP.XLS and DRBL.XLS will help
you to estimate changes in spending based upon per unit spending profiles for different types of visitors (recreation
market segments) and estimates of the number and types of visitors affected by an action. The programs also
includes a built in IMPLAN scenario generator, creating an ASCII file that can be imported into IMPLAN to
bridge the spending data to IMPLAN sectors. After running an impact analysis within IMPLAN, aggregated
impact reports may be imported back into the Excel workbook to create a summary report. The spreadsheets also
can serve as a stand-alone utility to simulate direct spending effects of various actions. Several standardized tables
and graphs are provided for summarizing spending effects -- in total, by spending category, and by visitor segment.
(2) Recreation/Tourism Spending Data Sets. A set of visitor spending data sets are provided for use with
the spending estimators. These data sets were developed from surveys at water-based recreation facilities. One set
of spending profiles comes from surveys at recreation sites along the Upper Mississippi River System. These data
represent a diverse array of recreation sites and recreational activities. Another set of profiles was developed from a
sample of visitors to US Army Corps of Engineer reservoirs across the country. Analysts may use the data sets that
are provided, modify these to better fit an intended application, or assemble corresponding data sets from their own
visitor surveys and other sources. The spending data sets represent spending in 1990 dollars. Using BLS Price
indices the spending data may be adjusted to any year between 1990 and 1995. For consistency with IMPLAN
reports, we recommend adjusting spending data to the year of the model estimated in IMPLAN.
(3) Micro-IMPLAN Utility files. Several customized MI utility files are provided for use with the
spending estimators and recreation data sets. These files are used to bridge the recreation spending data into
IMPLAN's 528 sectors (MI Activity Database and ASCII Scenario import files) and to aggregate sectors to
highlight those most affected by recreation & tourism (MI Aggregation Templates). Utilities are provided for both
trip-related and durable goods spending.
This manual provides step-by-step instructions on how to use these utility programs with Micro-IMPLAN.
Guidance on regional economic concepts and methods are provided in Part I of the MI-REC manual. In Part I, we
also include tips for defining a problem, forming appropriate regions for an impact analysis, and summarizing and
interpreting the results of an economic impact analysis.
This version of MI-REC is designed to work with Version 91-F of Micro-IMPLAN and 1990 (or more
recent) IMPLAN databases. This manual should be used with the Micro-IMPLAN User's Manual. We do not
attempt to duplicate information provided there, although we do summarize the key MI steps necessary for a basic
analysis. Our orientation here is to provide a somewhat standardized set of procedures for novice IMPLAN users.
Both MI and the MI-REC utilities are quite flexible tools that can be readily customized and adapted to particular
uses by experienced analysts. In the interests of keeping things simple for first-time users, this manual will stress a
relatively standardized and basic set of analyses. After some experience with the MI-REC and IMPLAN systems,
you will discover many ways of adapting the spreadsheets, databases, and procedures to your own needs and
problems.
Page # II- 3
We assume a basic knowledge of Excel 5.0. As the TRIP.XLS and DRBL.XLS workbooks includes many
specialized macros in the form of visual basic modules they will not readily convert to other spreadsheets. These
workbooks integrate a number of spreadsheets and utilities from an earlier Lotus 1-2-3 version of MI-REC.
INSTALLATION/SET-UP
1. You should have the Micro-IMPLAN program installed on your hard disk. Users will also need a copy
of Excel 5.0 for Windows..
2. Copy (or UNZIP) all of the MIREC files to a MI-REC subdirectory on your hard drive.
3. Move or Copy the IMPLAN Utility files to your IMPLAN directory. IMPLAN looks for aggregation
templates and activity database files in a UTILITY subdirectory for a given year. e.g. If you have the
1990 IMPLAN matrices in a directory called MI91-F on drive C, the 1990 utilities will be located in
C:/MI91-F/1990/UTILITY. Copy the 1990 MI-REC aggregation templates and activity database files
to this subdirectory. e.g. using DOS copy commands,
copy C:\MI-REC\*90.tpl c:\MI91-F\1990\UTILITY
copy C:\MI-REC\*90.act c:\MI91-F\1990\UTILITY
copy C:\MI-REC\*90.asc c:\MI91-F\1990\UTILITY
If you are using 1993 IMPLAN data files, copy the 93 versions of these files to C:\MI91-F\1993\UTILITY.
copy C:\MI-REC\*93.tpl c:\MI91-F\1990\UTILITY
copy C:\MI-REC\*93.act c:\MI91-F\1990\UTILITY
copy C:\MI-REC\*93.asc c:\MI91-F\1990\UTILITY
*.TPL files are aggregation templates (to aggregate IMPLAN sectors)
*.ACT files are activity database files (to bridge to IMPLAN sectors)
*.ASC files are ASCII files to import a scenario into IMPLAN
The IMPLAN program will look in its own UTILITY subdirectories for these files and store any activity database
or aggregation template files in those subdirectories. IMPLAN stores Scenario files in the Model Directory from
which they are generated. The Excel spreadsheets and spending data may remain in the MI-REC directory or any
directory that is easily accessed from Excel. Simply change the default directory in Excel to the MI-REC directory
to retrieve these files. As you use the TRIP and DRBL.XLS files to estimate spending and impacts, we recommend
saving the results in the IMPLAN model directories. This way all of the files associated with a particular analysis
will be in one place and you will not accidentally mess up the original TRIP and DRBL.XLS files. ALWAYS keep
a backup of these original files in a safe place to restore the MI-REC system.
Page # II- 4
STANDARD MI-REC PROCEDURES; FOUR STEPS TO CARRYING OUT AN IMPACT ANALYSIS
There are four basic steps for carrying out an economic impact analysis using the MI-REC and Micro-IMPLAN
Systems.
Step 1. Define the problem. Specify the action or policy question that will direct the analysis. Specify what is
causing the change and the types of impacts of interest. From this determine
a.
b.
c.
d.
e.
f.
The number and types of visitors affected, appropriate visitor segments, and segment shares.
The appropriate study area or region.
The types of visitor spending to include, e.g. trip spending, durable goods purchases.
The most important economic sectors & appropriate levels of sectoral aggregation for the analysis.
The most relevant measures of economic impacts.
Tolerable levels of error/accuracy in the results.
Step 2. Estimate the change in spending associated with the action.
Within Excel, retrieve the TRIP.XLS spending estimator . Follow the instructions on the first page of the
workbook to carry out the analysis. Briefly,
Select or edit a set of spending profiles on the SPEND page,
Price adjust the data to the year of the intended model, if necessary
Enter visits and segment shares on the VISITS page,
Save an IMPLAN import scenario from the resulting spending estimates on the IMPLAN page.
Save the TRIP.XLS workbook with a new name.
See Chapter 7 for specific spreadsheet procedures.
Step 3. Estimate the regional economic effects of the change in spending. The estimation of impacts is carried
out using Micro-IMPLAN. Using MI, you estimate a model for the desired region and then estimate the impacts of
the change in spending on this model.
a. Estimate a model for the region. Follow the procedures in the Model Construction portion of
the MI menu.
i.
ii.
iii.
iv.
v.
vi.
Choose, create or import a model
Select the study area, if creating a model
Construct the social accounts.
Construct input-output accounts.
Estimate the multipliers.
View model status or edit documentation.
Page # II- 5
b. Estimate the impacts of a change in spending. Proceed to the Impact Analysis section of MI.
i. In Tools, retrieve or import an activity database or scenario containing the
information for bridging the spending data to MI sectors.
ii. In Edit, check the per unit spending figures in “Edit activity Levels” and enter the
scale factor (number of visits in the chosen units).
iii. In Analysis, estimate the impacts of this scenario.
iv. In Views , you may inspect (view) and aggregate the impact reports.
Step 4. Interpret and communicate the results. Finally, you must interpret the results and communicate them to
various audiences. The IMPLAN reports and spending data can be easily manipulated within the TRIP.XLS
workbook to create customized report tables. Use the IMPORT IMPLAN REPORTS button on the INSTRuction
page of the Excel workbooks (TRIP.XLS, DRBL.XLS) to bring aggregated IMPLAN impact reports into the
spreadsheet. A standard summary report is automatically produced when the IMPLAN reports are imported into
the Excel workbooks. Tips on assembling reports are provided in Chapter 5.
The TRIP.XLS workbook is the principal tool for estimating recreation trip spending (step two above).
DRBL.XLS performs a similar role for durable goods spending. These workbooks are described in Chapter 7. The
Micro-IMPLAN system along with the MI-REC IMPLAN Utility files complete the impact analysis (step 3). The
IMPLAN procedures and use of MI-REC utilities for recreation and tourism analysis are summarized in Chapter 8.
Steps one and four of this four step approach to economic impact analysis are not as easily "canned". The problem
definition and interpretation of the results are, however, the most important steps of any analysis. These steps will
require your own insights into how to structure the problem and how to best convey the results to intended users or
audiences. Further guidance on these steps are provided in Part I of this manual.
Page # II- 6
Chapter 7. Estimating Recreation & Tourism Spending
Most of the MI-REC tools for estimating spending and economic impacts associated with recreation and
tourism have been packaged into two Microsoft Excel 5.0 Workbook files. These workbooks and supporting
spending data files are described in this chapter. TRIP.XLS handles trip spending while DRBL.XLS handles
purchases of durable goods such as boats and recreational vehicles.
These Excel files replace several Lotus 1-2-3 spreadsheets in the earlier versions of MI-REC. The Excel
workbooks combine a number of formerly separate spreadsheets into a single multi-page notebook. A number of
features have been added to complete the spreadsheet interface with IMPLAN version MI-91-F. In addition to the
spending estimation routines, the Excel workbooks can generate scenario files that can be directly imported to
IMPLAN. An ASCII version of an IMPLAN scenario file may be created directly from the spending estimates on
the spreadsheet. After importing this file to IMPLAN and running the IMPLAN impact routine, aggregated
IMPLAN impact report files may be added to the Excel workbook. Parsing routines to import IMPLAN impact
report files into Excel have been integrated into the workbook. Spending data, impact reports and base year data
are then combined into a standard report on a summary page. The spreadsheet handles up to 12 visitor segments.
The TRIP.XLS and DRBL.XLS spreadsheets estimate total spending by visitors to a site, region or set of
sites. The user must enter the number and kinds of visitors attracted to the site. The spending profile for a typical
visitor is then calculated as a weighted average of spending profiles of each visitor segment, with segment shares
used as weights. Segment spending profiles are drawn from a database constructed from recent (mostly 1990)
spending surveys at different types of recreation sites. These profiles may be edited or local spending data more
appropriate for a given application may be used.The profiles may be price adjusted to a more recent year using BLS
price indices. In the Excel workbooks, the spending estimators have been extended to also produce the IMPLAN
scenario file and summarize the results of an impact analysis by importing the IMPLAN impact reports back into
the spreadsheet.
Trip Spending Estimator -- TRIP.XLS
Structure of the Workbook
1.The procedures for estimating trip expenditures are divided across several pages in TRIP.XLS. This makes the
spreadsheet easy to move around in by using Page Tabs at bottom. Separate pages are set up for different sections of
the spending estimator as follows:
TRIP.XLS Workbook Pages - Spending section
INSTR
SPEND
VISITS
AVGSP
TOTSP
IMPLAN
Instructions
Spending data (Tables 1 and 2)
Entering vists and segment shares
Table of average spending profiles (Table 3)
Total spending tables (Table 4)
IMPLAN inputs (Table 5)
2. An IMPLAN scenario “import” file may be created directly from the spreadsheet via a button on the IMPLAN
page. This file can be used to transfer spending and visit data in ASCII format from the spreadsheet to IMPLAN.
This information is retrieved in IMPLAN using the “import activities as a scenario” procedures.
Page # II- 7
3. Customized Dialog boxes have been created for importing IMPLAN impact report files and printing various
MI-REC reports. Aggregated IMPLAN impact reports can be imported back into the Excel workbook at the touch
of a button and organized on pages for DIRECT, INDIRECT, INDUCED, and TOTAL impacts. The model base
year report (in aggregated form) is also imported to a BASE90 page.
EXCEL Workbook Pages - IMPLAN Reports section
DIRECT
INDIRECT
INDUCED
TOTAL
BASE
Direct Effects (SCN.9A3 Report)
Indirect Effects (SCN. 9A4 Report)
Induced Effects (SCN. 9A5 Report)
Total Effects (SCN. 9A6 Report)
Base Year Summary ( MODEl.9A1 Report)
4. Key user inputs and results are gathered together in a summary page (SUM) that covers both spending and
impact results. Ratio multipliers and capture rates are automatically computed. Estimated impacts are reported as a
percentage of base year economic activity. Graphs of selected results are included and additional graphs may be
created and printed by choosing the “Create Graphs” button on the INSTR page. Experienced spreadsheet users
will find it easy to modify the summary pages or automate their own analyses and reporting formats.
As we combine data from both the spending and IMPLAN impact report pages, it is important that the
two sets of data be consistent including the year for which estimates are made. If you use 1990 data to estimate the
IMPLAN model, all impact reports will be in 1990 dollars. They will be in 1993 dollars if you use the 1993
structural matrices and 1993 county data files. You should therefore price adjust the spending data to the year of
the IMPLAN model. A pushbutton on the spending page price adjusts the 1990 spending data to any year up to
1995.
EXCEL Workbook Pages - SUMMARY section
SUM
Summary Page Combining Spending & Impact Results
Summary of Procedures for TRIP.XLS
•
To run the program, load Excel 5.0 for Windows and open the TRIP.XLS workbook.
•
We assume the user is familiar with Excel 5.0 for Windows sufficiently to move around between pages, enter
information, edit cells, display and print graphs, select pushbuttons and complete Dialog boxes. You may
move between pages by selecting the pushbuttons or left clicking on a page tab at the bottom.
•
Follow the steps on the INSTRuction page of the TRIP.XLS workbook. Use pushbuttons or page tabs to move
around or for help on a given page. A printed copy of each page of the TRIP.XLS workbook is included in
Appendix A.
Page # II- 8
STEPS TO ESTIMATE SPENDING AND ECONOMIC IMPACTS
A. CHOOSE OR EDIT A SET OF SPENDING PROFILES. Spending profiles for up to 12 visitor
segments may be included in an analysis. The default spending profiles and segments on the SPEND page
represent visitors to U.S. Army Corps of Engineers recreation projects in 1990. To adjust spending to a more recent
year push the price adjustment button on the SPEND page and select the desired year.
Spending is divided into two tables: Table 1 reports average spending within 30 miles of the destination,
Table 2 reports average spending for the entire trip (both within 30 miles and en route outside 30 miles). The
average, total and pecent columns at the far right are computed based upon segment share and total visit data
entered on the VISIT page. The average spending is a weighted average of the segment columns using segment
shares as weights.
There are three options for entering spending data:
(1) Import a set of spending data using the IMPORT button. You may use spending data from another
site, as is. The default spending profiles in the TRIP.XLS workbook are national averages estimated from a sample
of visitors to 12 U.S. Army Corps of Engineers projects around the country. (See Appendix C for definitions of
segments and more background on the data.) These profiles may be applied, as is. In using the defaults, the
assumption is that the spending profiles of each segment at the study site will be similar to those of the
corresponding segment at an "average" site ( or more precisely, the same as the average spending for a given
segment at the 12 reservoirs surveyed).
To apply spending profiles from a different spending data set, select a data file with profiles that will
represent spending patterns for the intended application, generally those from a similar type of region and facility
with visitor segments similar to those in the current application. Use the IMPORT button on the SPENDing page
to import a new set of spending data. After selecting the IMPORT button, identify the desired spending data file
and click OK in the file open dialog box. The import feature is set up to retrieve spreadsheet files with a “T12”
extension. Spending data sets are single page Excel 4.0 worksheets. Some earlier versions are in Lotus-1-2-3 WK1
format.
(2) Edit Spending data. You may also edit the spending data in the default profiles or any other data set
that you have imported in step (1). To edit a cell, simply move to the cell, type the new value and press ENTER.
The spending data is not protected. By editing the data, you may adjust the defaults for any known differences
between the intended application and the situation where data were gathered. For example, one might apply price
indexes to update profiles over time (you may use our price indices for this or your own), or account for differences
in prices between the two areas. One might also adjust spending levels for individual categories to better capture
the study area. For example, one might delete boating expenses for application to an area with no boating, or
increase spending on amusements for an area with numerous putt-putt golf, amusement parks and the like.
Adjustments may be based on judgement, selected local information, or even a formal spending model. To edit
spending data under the pushbuttons, press the “Move Buttons” button.
(3) Use your own data. If you have data more appropriate for the intended application (e.g. -- a survey of
visitors to the area or site in question or a similar site), you may enter these data onto the SPENDing page. If you
are replacing all the segments and spending data, we recommend creating your own spending data spreadsheet
using the BLANK spending data files. The BLANK datafiles are Excel worksheets for entering spending data for
use within MI-REC. Retrieve the BLANK.T12 spreadsheet, as a separate workbook. Enter your data using this
spreadsheet as a template and then save the file as an Excel worksheet, keeping the original T12 file extension.
The resulting spending data file can then be imported into the TRIP.XLS workbook using the import spending data
button. Data must be in the exact format of the BLANK.T12 template to import correctly and match up with the
MI-REC bridging procedures. By using the MI-REC spending categories you can avoid what can be a tedious job
Page # II- 9
of creating a customized activity database file for your own set of spending categories. See Appendix C for more
information on creating your own spending files.
Several important pieces of information are included at the top of the spending page and are retrieved
with each spending data file that you may import:
•
Names of the segments - files may contain up to 12 segments. The segment names appear at the top of
each column.
•
•
Units for spending data : Cell G1 indicates units (party trip, person-day, household, etc.)
Year of Spending data : Cell L1 indicates the year of the data. This cell will change if you price adjust
the data.
Source of the data : A brief indicator of where the spending data came from. 12LAKES indicates data
from the survey of CE visitors at reservoirs and UMRS data from visitors to Upper
Mississippi River System. Both are 1990 data.
•
B. ENTER THE NUMBER OF VISITS on the VISITS page. Next move to the VISIT page. Here you
enter the number of visits and the distribution of visits across segments (segment shares). Enter the Number of
Visitors affected in Cell E3 and segment shares in Cells C8-C19. Be sure to enter segment shares as percentages.
These should sum to 100% at the bottom. The number of visits or trips by each segment are computed in column E
by multiplying the segment share times total visits.
Note that the units for estimating use or visits must correspond to the units for the spending data on the
SPENDing page. The default spending is in dollars per party trip, so when using default spending profiles, visits
must be the number of party trips. Spending on a party day basis are also available. You may change the units of
analysis to person days, party days, person trips, boats, households or any other appropriate units as long as you
are consistent in using the same units for use as for spending. Remember the spreadsheet will multiply your
estimate of visits times the spending profiles to get total spending.
For example, in estimating spending of boats at a marina, one could use the “boat” as the unit of analysis.
Spending should then be entered as an annual average spending per boat on the SPEND page and visits and shares
on the VISIT page should be in terms of the number of boats or occupied slips. If spending figures are averages per
trip to the marina, then use and segment shares must be based on trips.
C. INSPECT AND EXPORT SPENDING ESTIMATES. Spending averages and totals are
automatically computed based on the information you entered in steps A and B. The AVGSP and TOTSP pages
contain spending averages and totals. These results will be reflected in any graphs you produce. At the bottom of
the INSTRuction page are buttons to print selected tables or create graphs. The IMPLAN page contains the
spending vector(s) (Table 5) and scale factors to be entered in IMPLAN’s “edit activity levels” procedure for an
impact analysis. To proceed with an economic impact analysis, goto to the IMPLAN page and first verify that the
summary results are correct.
The three columns in Table 5 on the IMPLAN page are weighted averages of the segment spending
profiles from Table 1 and Table 2. These represent the spending of an “average” visitor computed using the
segment shares entered on the VISIT page as weights. The columns are per visit final demand vectors , one for
spending within 30 miles, one for total trip spending, and a “custom “ column for regions in between 30 miles and
the entire trip. For local impact analysis, we typically use the “Within 30 mile” column. The “Total trip” column
could be used for a statewide analysis if all visitors come from within the state. The Custom column may be used to
generate spending estimates for other size regions.
To form a spending vector for a “custom” region, enter a percentage at the top of the Custom column. The
entries are computed as all the spending within 30 miles plus the custom percent of the spending outside 30 miles.
Custom Pct = 0 yields the 30 mile region figures, Custom Pct=100% yields the Total trip figures, and a Custom Pct
of 50% yields spending halfway between the two. This might approximate spending within a 60 mile radius of the
Page # II- 10
destination if we knew that half of the spending outside 30 miles took place within the 30-60 mile band. Actual
surveys were used to identify the portion of spending by each segment within 30 miles of the destination.
To transfer the spending information in Table 5 to IMPLAN, simply press the “SAVE SCENARIO as
IMPLAN Import File” button on the IMPLAN page. Choose which of the three columns of spending figures you
want to paste into the IMPLAN scenario file: within30 miles, totals, or the customized region. When asked,
provide a path and filename for the ASCII file (e.g. C:\MI-REC\SCEN.PRN). Click OK to save this scenario file in
ASCII format. Procedures for retrieving this file in IMPLAN are explained in Step E below. Before saving the
scenario, you should check that you have price adjusted the spending data to the year of your IMPLAN model. The
year is indicated at the top of the page. Go back to the spending page to convert dollars from to a different year.
D. SAVE the Workbook. You should then save the entire workbook, changing the name from TRIP.XLS to a
name that reflects your application (e.g. MYAPP.XLS). There is a SAVE button the INSTRuction page. If you
have already created a model in IMPLAN for the region of interest, you may save the file within the MODEL
directory. This keeps all your data for a particular model in one place. If you will be running impact analyses in
IMPLAN, you will be returning to Excel and retrieving this file in Step E below. You are now ready to switch to
IMPLAN. Exit Excel, Exit Windows and load IMPLAN. If you have adequate memory in your machine, you can
minmize the Excel application and run IMPLAN as a DOS application from within Windows.
E. BRIEF IMPLAN PROCEDURES (See Chapter 8 for details). IMPLAN is used to estimate the
secondary effects of the spending on the regional economy. IMPLAN will also put the spending into
standard economic sectors, identifying which sectors are impacted directly or through secondary
effects. IMPLAN also helps to translate sales effects to income and employment measures of impact.
To estimate the regional economic effects of the spending within IMPLAN you must
1. Estimate a model for the study region of interest. Then go to the Impact Analysis procedures.
2. Retrieve the scenario saved in Step C above.
a. In Tools, select Retrieve, Import Activities as... , Scenario.
b. Enter the path and name of the appropriate ASCII import file saved in Step C above.
c. Provide a name for the scenario file
d. Clear memory
e. Retrive activities as a Scenario - choose the scenario you named in 2c above.
3. Go to Editing submenu.
a. Check that spending data were correctly transferred by comparing the entries in “Edit
Activity Levels” with Table 5 from TRIP.XLS. (IF YOU ACCIDENTLY GO INTO
“EDIT ACTIVITIES”, PRESS CTRL ENTER TO GET OUT).
b. In the Scaling section, enter a Scale factor equal to the number of visits (or other
units). This will multiply the levels of spending for each activity by the scaling
constant, yielding total spending. (You may check this by returning to “Edit
Activity Levels”. Be careful you do not scale twice. IMPLAN will reset the scale
factor to 1.0 after multiplying.
4. Run impacts of this scenario and then aggregate the base year and impact report files using the TRIP
aggregation template. See Chapter 8 for details.
F. IMPORT IMPLAN report files back into the Excel Workbook. After completing Step E, Quit IMPLAN
and Reload the saved Excel Workbook from Step D. On the INSTRuction page, select the IMPORT
IMPLAN impact reports button to retrieve the aggregated IMPLAN reports. This macro first requests the
name of the Direct Effects Report (Looks for *.9A3 files). Choose the directory where these are located
(IMPLAN puts the reports in the MODEL directory) and select the *.9A3 file corresponding to the scenario
of interest. The Scenario name is determined from the prefix for this file and corresponding *.9A4, *.9A5,
Page # II- 11
and *.9A6 files are also retrieved. Finally the macro requests the name of the aggregated base year report
(MODEL.9A1, where MODEL is the name of the model). This should be in the same model directorysimply select it and click OK. The four impact reports and base year report will be imported to the
corresponding pages in the Excel workbook.
When importing the impact reports back into the Excel workbook, BE SURE TO CHOOSE THE
SCENARIO CORRESPONDING TO THE ACTIVE TRIP SPENDING WORKBOOK so that the IMPLAN
impact reports will match the spending data. (See Chapter 8).
G. Summarize and print results. Information from the spending and impact pages are gathered on a SUMmary
page. Pushbuttons are provided on the INSTRuction page to print the SUMmary page or create additional
graphs.
H. Running additional scenarios. The Excel workbook is designed to contain only a single scenario. After
importing IMPLAN reports you should save the workbook again. You now have all the inputs and results of
your impact analysis in a single workbook.
After the IMPLAN reports are imported, you cannot make changes to any of the spending or visit
information, as any such changes will not be reflected in the IMPLAN results pages. To estimate impacts for
a different scenario, return to the INSTRuction page and CLEAR IMPLAN REPORTS. This erases the
IMPLAN page and any extra graphs that may have been created. You may now define a new scenario and
repeat the steps starting at A. Be sure to first save the workbook if you want to preserve the first scenario.
Durable Goods Spending Estimator -- DRBL.XLS
The durable goods spending estimator uses the same format and procedures as the trip spending estimator. A more
complete documentation of this workbook is in progress. The following summarizes the major differences between
DRBL.XLS and TRIP.XLS:
1. Spending categories represent the major kinds of durable goods purchased by visitors.
2. Spending profiles in most of UMRS and 12Lakes datasets are on the same party-trip basis, as trip spending.
These profiles yield total spending on durables in a given one year period, when multiplied by the annual
number of visits (trips). The profiles were generated by dividing the cost of durable items purchased within
the previous year and brought to a site, by the number of trips each party had made to any Corps of Engineers
sites within the past year.
3. Special procedures are required to distinguish between purchases of new durables vs used equipment. Used
goods are further divided between purchases from dealers and purchases from households. These extra
computations are made on the IMPLAN page.
4. The bridge table for durable goods is quite different from that for trip spending, although the procedures for
creating an IMPLAN scenario are the same.
Page # II- 12
SPENDING DATA SETS
Spending data sets are constantly being expanded and revised. The files provided with MI-REC and documentation below
cover spending data gathered for the U.S. Army Corps of Engineers in 1989-1990. These files import into Excel 5.0 using
the import spending data set button on the SPENDing page. The original Lotus version of MI-REC included six and 12
segment versions of spending templates and data files. All of the files below can be imported by the corresponding
TRIP.XLS or DRBL.XLS workbooks. The 12 segment versions work best as the Excel workbooks are set up to handle up to
12 segments.
Spending Data Files
The recreation spending estimators rely on a set of spending profiles that represent the average spending of
particular kinds of visitors to a given site or region. The segments play a critical role in the model, as the segments capture
differences in spending across different kinds of visitors. Segments are one key to generalizing spending across different
sites and regions.
A default set of spending profiles (and segments) is included in the TRIP.XLS workbook. These default figures
may be adjusted for a particular application or they may be replaced by alternative data sets. Each spending data set is
organized in a standard file format, necessary for properly importing the data to the spending spreadsheets.
Tables 1 and 2 from the TRIP.XLS workbook (see Appendix A) illustrate a typical spending data sets for trip
spending. The segment names appear across the columns and spending categories down the rows. Each template includes
two such tables, the first (labeled Table 1) is spending within the local region, while the second (labeled Table 2), is total
spending, including spending inside and outside the local area.
The data sets assembled to date rely on a common set of variables for defining segments, each of which is
important in explaining differences in spending. The MI-REC system, however, can handle any set of non-overlapping
(mutually exclusive) market segments for which spending profiles are available. Available data files include:
6 Segments
12 Segments
Source
Trip Spending Files
UMRS1.T6
UMD&M.T6
12LAKES.T6
12LAKES.T12
LANIER.T12
SHELBY.T12
PRIEST.T12
and nine more CE projects*
UMRS On-Site Survey
UMRS Dock & Marina Survey
USACE National Survey
USACE National Survey
USACE National Survey
"
"
"
Durable Goods Spending Files
UMRS1.D6
UMD&M.D6
12LAKES.D6
UMRS1.D12
12LAKES.D12
UMRS On-Site Survey
UMRS Dock & Marina Survey
USACE NAtional Survey
USACE National Survey
Page # II- 13
Blank (Zero) Spending Files
BLANK.T6
BLANK.D6
BLANK.T12
BLANK.D12
Use these templates to create
your own spending data files
* 12 segment trip spending data files are available for each of the 12 lakes sampled in the 1989-90
national survey. These files have a T12 file extension with an abbreviated lake name as the file prefix. See
Appendix C for details.
* Earlier versions of these data files may be in *.WK1 format and may not include the year of the data in
cell L1. Simply enter the year (1990) in cell L1 after importing so the price adjustment and IMPLAN
scenario generator will work correctly.
Creating New Spending Data Sets
The BLANK versions of the spending data templates should be used in creating new spending data files,
as they are in the proper format with appropriate range names and spending categories. To create your own
spending data files for use with MI-REC, Simply retrieve the appropriate BLANK template from your spreadsheet
program, and enter segment names and spending profile data in the unprotected cells. When finished save the file
with a new name, but maintain the *.T12 file extension. (You will need to override the default WK1, XLS or other
spreadsheet extension.). We recommend saving data files as single page Excel 4.0 worksheets. These new data sets
can then be imported into the TRIP.XLS or DRBL.XLS workbook.
You needn't complete all entries on the BLANK data templates. If you have only one segment, leave the
remaining eleven columns with zeros. You may also enter data in only some of the spending categories. Match the
categories from your own spending data or surveys to those on the BLANK template as best you can in order to
obtain the proper bridging to IMPLAN sectors.
Page # II- 14
Chapter 8. Estimating Regional Economic Impacts
The Micro-IMPLAN program is used to estimate the regional economic effects of a change in spending.
Readers are referred to the Micro-IMPLAN manual for details of the Micro-IMPLAN procedures. For convenience,
we provide an abbreviated summary of the basic IMPLAN procedures here, and provide details only for a few
procedures that are somewhat unique to using IMPLAN with MI-REC, namely the importing of recreation
spending scenarios and the use of MI-REC aggregation templates to highlight recreation and tourism sectors.
To estimate impacts of a change in spending associated with recreation and tourism activity, you should
have first estimated the total spending change using the MI-REC Spending Workbooks (TRIP.XLS or DRBL.XLS)
and saved this spending as an IMPLAN import scenario. Within IMPLAN you will estimate a model for the study
region, import the spending scenario, estimate impacts of the spending change on the region’s economy, and then
aggregate the IMPLAN impact reports.
You must first load the MI program. The Model construction and Impact analysis submenus take you
through the primary steps for estimating multipliers and impacts. You must first create or select an input-output
model for your study region within the Model construction submenu. Then use the Impact analysis submenu to
apply your spending estimates to this model and view the results.
ESTIMATING A MODEL. Step 3-A. Estimate a model for the region by following the procedures in the Model
Construction portion of the MI menu.
1. Choose, create or import a model
2. Select the study area, if creating a model.
If creating a model, you will need to have the IMPLAN county data files for each county to be included in
your study region. These files may be on floppy disks or stored in a directory on your hard disk. You must
go to the Utilities section of the main MI menu and Import a Data File Directory before you can access
the data files. Simply enter the drive and/or path and name of the directory where data files are stored.
You are then ready to select files from this directory back in the Model construction menu.
3. Construct the social accounts- choose construct initial accounts. Answer Y or N to optional reports.
4. Construct input-output accounts. Pick construct unaggregated I/O accounts.
5. Estimate the multipliers.
6. View model status - a check of what has been completed.
IMPACT ANALYSIS. Step 3-B. Estimate the impacts of a change in spending. Go to the Impact Analysis section
of MI and complete the following four steps.
1. Retrieve or import an activity database or scenario file
2. Enter or verify activity levels and add a scale factor
Page # II- 15
3. Estimate impacts of the current scenario
4. View and aggregate reports
STEPS FOR ESTIMATING IMPACTS
Step 1. Retrieving or Importing Activity Database and Scenario Files.
In Tools, you must retrieve the bridging information for recreation spending by retrieving an
activity database or a scenario. An activity database includes only the information for bridging
spending categories into IMPLAN sectors, while a corresponding scenario also includes the
particular spending levels for each activity and a choice of whether or not to apply LPC's to this
spending. LPC's are briefly explained following this section.
To accomodate a range of possible applications, there are several options for retrieving activity
database or scenario files. The recommended approach when using MI-REC is to import an
activity database as a scenario using the ASCII file created in the Excel workbook. This option
brings in the spending levels and year of spending data, while also setting LPC ‘s appropriately,
including setting LPC’s for retail trade sectors to 1.0 . Four other options are summarized at the
end of this chapter, along with further explanation of LPC’s.
OPTION A. Import a MI-REC Recreation Spending Scenario. Use this procedure to import
the scenario file created with the MI-REC Excel workbooks (Step C in Chapter 7)..
a. In Tools, select
Retrieve Activities,
Import Activities as
Scenario.
b. Enter the path and name of the appropriate ASCII import file (PRN extension) or
browse and select the file in the Dialog Box (The IMPLAN keystrokes for this
section are ALT-F to switch to file box, ALT-D to select or change Directory/path,
use cursors to select the desired directory or file)
Choose the (*.PRN) file you created in TRIP.XLS to import the scenario
c. Assign a file name to the scenario you are creating, e.g. SCNAME. IMPLAN will
append the SCN extension to your filename and store it in the MDNAME (model)
directory as SCNAME.SCN. Click OK and then back out of menus with two ESC’s.
d. From Tools menu, select Clear Memory.
e. Then select
Retrieve Activities,
From a Scenario,
Retrieve Entire Scenario.
You should see the scenario filename you entered in step c on the list of scenario files
for this model. Select it.
f. Proceed to Step 2 where you should check the spending data in Edit Activity Levels
and must enter the scale factor (number of visits) for your scenario.
Page # II- 16
WARNING!! You must repeat all of these steps if you wish to create a similar scenario in a
different model. Do not copy scenario files between models as they contain the RPC/LPC
settings and margins for a particular model. If you forget to Clear Memory and Retrieve the
Scenario in Step d, your active scenario will contain only the final activity (spending category).
Simply go back and complete Step d to import the full scenario.
Step 2. Entering Activity Levels and Scale Factors
Go to the Edit section,
a.. In Edit Activity Levels, you may enter or edit levels of spending for each activity. If you used
the recommended option in Step 1 to import the spending vector, simply verify that the entries
are correct. The spending levels for each activity should correspond to those in Table 5 on the
IMPLAN page of the MI-REC spreadsheet. Also the LPC settings should correspond to those in
Table 8-1.
If entering spending manually, simply enter the levels of spending from Table 5 of the
MI-REC spending estimator spreadsheet. Also set LPC’s as recommended in Table 8-1, if they
are not already set. CAUTION - Use CTRL ENTER to close the Edit Activity Levels dialogue
box. DO NOT USE THE ESCAPE KEY as this may erase everything you entered.
b. Go to Tools and save the database as a scenario. Be careful to change the scenario name if
generating multiple scenarios to avoid overwriting a scenario file.
c. Go back to Edit and Scale the scenario, enter the total number of party visits associated with
the change as the scale factor. MI multiplies this scale factor times the levels entered in step a
above for each activity. (Be careful not to scale twice as MI resets the scale factor to 1 after
making the multiplications.) If you go back to Edit Activity Levels the numbers should equal
the scale factor times the per party visit spending levels that you entered.
d. Exit the Edit section. (use ESC key to back out).
Note - These recommended procedures save the database as a scenario prior to adding the scale factor.
This makes it easy to evaluate a change of scale by retrieving the scenario with per party visit activity levels and
entering a new scale factor. The model is linear so that a doubling of scale simply multiplies all output totals by
two. If your results show little or no impact, make sure you didn't forget the scale factor. Outputs are in millions of
dollars, so you won't see much impact from less than 1,000 party trips unless you have some very big spenders.
Step 3. Estimate impacts of the Current Scenario
Use the cursor to move to the Analysis command on the impact analysis menu. Simply
press ENTER and answer Yes to estimate the impacts of the current scenario.
Step 4. View and aggregate the results.
Go to the Views section. IMPLAN produces a base year report for the region you have
defined and six other reports for each scenario you run. The base year report file has the
model name (MDNAME) as its prefix, while other reports use the scenario name
(SCNAME) for the file prefix.
Page # II- 17
MDNAME.901 is the base year report giving total output, income, employment and
other measures of economic activity for given year in the region you have defined.
SCNAME.902 shows the dollars entered into each IMPLAN sector as a change in final
demand for the scenario "SCNAME". This report is from the old mainframe version of
IMPLAN and isn’t very useful. Don't try to aggregate this report.
SCNAME.903
SCNAME.904
SCNAME.905
SCNAME.906
SCNAME.907
reports the direct effects of the change
reports indirect effects
reports induced effects
reports total effects (direct+indirect+induced)
ignore this report, it isn’t implemented yet
Each of the impact report files and the base year report may be viewed and aggregated across sectors
within MI. They are ASCII files that can be read by most wordprocessing packages or printed directly from DOS
or WINDOWS. Note that all tables are 132 columns wide and should therefore be printed in compressed mode on
an 80 column printer.
As most models will contain from 100 to 528 sectors, these reports can be lengthy, if left in unaggregated
form. Combined with the lack of title locks for row and column labels in the MI report viewer, this makes them
hard to read on the screen. We recommend aggregating the reports to focus on the sectors impacted by recreation
and tourism spending. Default aggregation templates are provided for use with trip spending (TRIP90.TPL or
TRIP93.TPL), durable spending (DRBL90.TPL or DRBL93.TPL) or both (DRTP90.TPL or DRTP93.TPL). You
may revise these templates or develop your own using the instructions in the MI manual for creating and editing
aggregation templates. The templates readily convert to any year after 1990, but must be located in the given year’s
UTILITY subdirectory for IMPLAN to find them. They cannot be used for 1985, as the IMPLAN sectorization
changed between 1985 and 1990.
To aggregate reports,
1. choose the Aggregate a report option within Views
2. choose a suitable aggregation template from the list. ( Note- If the default templates TRIP90,
DRBL90, and DRTP90 are not listed, copy these files to the MI/1990/UTILITY subdirectory
from the MI-REC disks). We rename the templates if they are to be used for a different year, e.g.
TRIP93.TPL for 1993.
TRIP90
DRBL90
DRTP90
use with trip spending
use with durable goods spending
use with both trip & durable
You must aggregate reports one at a time within MI. After aggregating, MI changes the character in the
middle of the report file extension from 0 to A to indicate an aggregated report, e.g. the aggregation of
SCNAME.903 becomes SCNAME.9A3. These aggregated reports are appended to the bottom of the report list
(scroll down to see all reports) and can then be viewed using VIEW A REPORT. For example, select the
SCNAME.9A3 file to view the aggregated report of direct effects. The three MI-REC aggregation templates are
summarized in Table 8-2.
Page # II- 18
Alternatives for Generating Activity Database and Scenario Files.
The following three alternatives can also be used to create recreation activity database and scenario files
within IMPLAN. The recommended procedure in Step 1 above will be called “Option A”. The IMPLAN
procedures for creating activity databases “From the Current Model” or from PCE data can also be quite
useful. See Chapter 4 of the IMPLAN manual for details.
Option B. Retrieving a scenario. IMPLAN scenarios are simply activity database files,
to which a set of activity levels and LPC settings have been added. When you add spending levels
and LPC settings to the TRIP90 and DRBL90 activity databases in option B, you create a
scenario. These scenarios may be saved and subsequently retrieved (In the Tools section of
IMPLAN's impact analysis routine) for further use. Be aware that scenario files are saved in the
model directory and are accessible only to the model in which they were created, while the
activity database files are stored in a Utilities subdirectory of MI and may be retrieved from any
model. After retrieving a scenario, verify the spending levels by inspecting them in “Edit
Activity Levels”. If you saved a scenario before adding scale factors, remember to scale the
scenario before estimating impacts.
Option C. Retrieving an Activity Database. The MI-REC bridging and margining
information contained in the import files can also be retrieved directly.
a. In Tools, select
Retrieve Activities,
From an Activity Database,
Retrieve Entire Database or Selected Activities
Choose one of the following MI-REC Activity Database files.
TRIP90
DRBL90
for trip spending
for durable spending
(This retrieves file TRIP90.ACT)
(This retrieves file DRBL90.ACT)
These files must have been copied to the MI91-F/1990/UTILITY subdirectory during
MI-REC installation to be accessible within IMPLAN. (Corresponding 1993 versions
must be put in the 1993/UTILITY subdirectory).
b. In the Edit menu, goto Edit Activity Levels and enter the spending levels for each
activity. You must also set LPC’s according to Table 8-1 if you use this option. Then
enter the scale factor (number of visits) for your scenario. Note that this option will
NOT set retail trade LPC’s to 1.0, resulting in some retail spending being incorrectly
assigned to imports. This is one reason why option A is preferred.
c. Return to Tools to save this activity database as a Scenario. Saving as a scenario
saves both the bridging and margining information as well as the spending levels.
The scenario will be saved in the current MODEL directory and can only be used
with that MODEL. If you wish to estimate impacts of different scales of activity, we
recommend saving the scenario before applying the scale factor. Then you can easily
retrieve the scenario, set the scale factor and estimate impacts.
Option D. Create your own database and scenario files. You may also follow the
instructions in the Micro-IMPLAN manual (Chapter 4). In this case, you must create your own
activity database, enter activity levels and choose the appropriate LPC settings. If you are not
Page # II- 19
experienced with bridging and margining procedures or IMPLAN's edit activities commands,
you should use options A or B. Even experienced users will generally find it more efficient to
retrieve and edit the MI-REC TRIP or DURABLE activity databases rather than starting from
scratch when creating database files for recreation and tourism applications. The MI-REC
databases can be edited in the “Edit Activities” section of IMPLAN’s impact module. Simply
retrieve or import them first using Options A, B or C above.
Notes on LPC's (Local Purchase Coefficients)
LPC's are local purchase coefficients, indicating the portion of spending that accrues to the local economy.
A Y for "Yes" in the edit activity levels procedure applies the region's RPC (the default values for LPC’s) to the
entered activity level to estimate how much of this spending accrues to the study region (See MI-REC Appendix H
and the IMPLAN manual for a discussion of RPC's). The MI-REC spending data files have already determined
from survey data what portion of visitor spending is made within a "local area". The definition of the "local area"
may vary with the spending data set being used. For trip spending we have consistently used a 30 mile radius of the
site to define spending in the local area. For many applications this will roughly correspond with counties in the
immediate vicinity of the site. This does not, however, fully account for local purchases (LPC's).
The rule of thumb in using LPC's with the MI-REC data is that LPC's should be applied to spending
categories that bridge within Micro-IMPLAN to production (vs retail or service) sectors. Table 8-1 gives the
spending categories for which we recommend using LPC's. Spending categories that bridge to primarily retail
trade or service sectors (e.g. hotels and restaurant spending) should not have LPC's applied. The reason behind this
is that $100 of spending on hotels is put directly into the IMPLAN hotel sector, and all of this is received by hotels
within the region. A $100 expense for groceries, on the other hand, is bridged to production, retail, wholesale, and
transportation sectors. While the local grocery store receives the $100, MI does not put the $100 into a "grocery
store" sector. Various portions of the $100 are entered into agricultural, food processing, wholesale and
transportation sectors, only some of which may accrue to businesses within the region. By entering Y for an LPC,
the regional RPC's for each of these commodities are applied to this spending. RPC's measure the proportion of
final demand (spending) in a given sector satisfied by firms within the region. For those spending categories for
which LPC's are applied (those with a Y), we assume the LPC for tourist spending is the same as the overall RPC
for the region. That is, if 50% of the final demand for dairy products in the region is satisfied within the region
(the RPC), we assume 50% of tourist's dairy purchases are also supplied by local dairy farmers (the LPC). The
remainder are imports and are not included in the tourism final demand vector.
Option A for retrieving database and scenario files automatically sets the LPC’s. Option A also sets the
LPC’s for all retail trade sectors to 1.0. While RPC’s for retail trade sectors are usually near one for most regions,
they can be less than one and significantly so for rural counties without a major retail center. Since tourists are
reporting money spent in local retail establishments, all of the retail margin associated with these purchases should
be entered as local final demand. This means that the LPC on retail trade sectors should be set to 1.0. Adjusting
these within IMPLAN is a tedious process. The import feature overcomes this problem. If you do not use option A,
you may be losing from 5-10 % of the impacts in retail trade sectors.
The setting of LPC's can have a significant effect on the estimated impacts of visitor spending. Trip
impact estimates will generally be 20-40% lower when LPC's are set as in Table 8-1. The effect is much larger
when estimating the impacts of durable goods puchases as LPC's are applied to all but one durable good
spending category. IMPLAN's RPC estimates are generally quite low for durable goods sectors, as durables are
rarely manufactured in the regions where they are purchased.
Page # II- 20
Table 8-1. LPC Settings for Trip & Durable Spending Categories
TRIP ACTIVITY
LPC
DURABLE ACTIVITY
LPC
hotel
camping
food on site
food off-site
gas & oil
auto rental/repairs
tires
auto/RV parts
boat rental
boat repairs
boat parts
boat launch/slip
boat fares
fish bait
ammunition
spec. & attr. fees
recreation fees
film purchase
film developing
footwear
men's clothing
women's clothing
souveniers
N
N
N
Y
Y
N
Y
Y
N
N
Y
N
N
Y
Y
N
N
Y
N
Y
Y
Y
Y
Boats
Boat engines
Motorhomes
Other camping veh.
Trailers
Tents & camp equip.
Bikes & ORV's
Rods & reels
Rifles
Clothing
Boots & waders
Sporting Goods
Other equip & access.
Cameras & photoequip
Binoculars
Used (Dealers)
Y
Y
Y
Y
Y
Y
Y
Y
Y
Y
Y
Y
Y
Y
Y
N
Page # II- 21
Table 8-2. MI-REC Sectoral Aggregation Templates; 1985 AND 1990 SECTORS
INDUSTRY NAME
AGGREGATED SECTORS
a
b
Agriculture Forestry & Fish
Mining
Construction
Food Processing
Apparel
Auto Parts & Access.
Sporting Goods
Manufacturing (Other)
Transportation, Comm. & Utilities
Wholesale trade
Retail Trade
Finance, Insurance & Real Estate
Auto Services
Other Amusements
Services, Other
Gov't Enterprise & Special
1985 SECTORS 1990 SECTORS
TEMPLATE
1-27
28-65
66-75
82-130
131-151,247-254
240,404
79,80,425,433
76-445
446-459
460,461
462,463
464-470
492-494
495-501
472-515
516-528
1-27
28-47
48-57
58-107
108-124,222-229
215,386
297,299,413,421
125-432
433-436
447
448-453,455
456-462
477-479
483-489
464-509
510-528
td
td
td
t
t
td
td
td
td
td
td
td
t
t
t
td
Individual Trip Sectors
HOTELS AND LODGING PLACES
EATING & DRINKING PLACES
AMUSEMENT AND RECREATION
PETROLEUM REFINING
471
491
502
235
463
454
488
210
t
t
t
t
Individual Durable Sectors
INTERNAL COMBUSTION ENGINES
SHIP BUILDING & REPAIR
BOAT BUILDING & REPAIR
MOTORCYCLES, BICYCLES & PARTS
TRAVEL TRAILERS AND CAMPERS
MOTORHOMES
331
408
409
411
412
414
308
392
393
395
397
388
d
d
d
d
d
d
a. Excludes relevant individual sectors listed below and sectors within aggregates above (food proc. to sp. goods).
b. Excludes relevant individual sectors listed below and sectors within aggregates above (auto services & oth. amusements).
c. t indicates included in TRIP templates, d in DRBL templates, td in both.
TRIP85.TPL and TRIP90.TPL highlight trip spending sectors
DRBL85.TPL and DRBL90.TPL highlight durable goods sectors
TPDR85.TPL and TPDR90.TPL include both trip & durable sectors
Page # II- 22
ADJUSTING MI-REC TO YEARS AFTER 1990
The MI-REC system was developed to work with the 1990 IMPLAN data sets and version 91-F of the
IMPLAN program. Since the spending data were gathered in 1990, no price adjustments were required when
using 1990 IMPLAN structural matrices and county data files. There are two adjustments you will need to make to
use MI-REC with models later than 1990.
First, the MI-REC activity database and aggregation template files must be put in the appropriate
IMPLAN UTILITY subdirectory. As there have been no changes in IMPLAN sectorization since 1990, the MIREC aggregation templates and activity database files readily convert to any year after 1990. You can simply
change the file name on the aggregation templates from TRIP90.TPL to TRIP92.TPL, for example, when copyng
the file to the MI91-F/1992/UTLITY subdirectory. IMPLAN will also adjust the activity database files to the year
of the model when you retrieve them, but we recommend saving the activity database with the new model year if
you intend to use it regularly with a different year’s model. (For the convenience of users, we include both 1990
and 1993 versions of aggregation templates and activity database files. The 1990 versions of the activity database
files assume all spending is entered in 1990 dollars and the 1993 versions assume 1993 dollars. These files should
be put in the IMPLAN UTILITY subdirectory for the corresponding year.
Second, the MI-REC 1990 spending data files should be adjusted to the year of the intended model to
which you will apply final demand changes. Although the IMPLAN program will automatically adjust any changes
in spending to the year of the model using its own price deflators, the SUMmary page in the MI-REC Excel
workbook will be incorrect if spending data on the SPENDing pages are not adjusted to the same year as the
IMPLAN impact report pages. For example, if you use 1990 spending data sets with a 1993 model, spending
information will be in 1990 dollars while all the impact results will be in 1993 dollars.
The simplest way to resolve this problem is to price adjust the spending data in the Excel workbook to the
year of the IMPLAN model. We have added a push-button on the SPENDing page to adjust spending to any year
between 1990 and 1995. Simply click this button, select the year of the intended model, and click OK. The year of
the spending data must also be entered in cell L1 of the SPENDing page for the price adjuster to work properly.
This year is updated whenever a price adjustment is made. The set of price indices for adjusting each spending
category to years between 1990 and 1995 were selected from Bureau of Labor Statistics price indices.
If you intend to use 1990 IMPLAN county data, then you can use the 1990 spending data files without
adjustment. Before saving an IMPLAN import scenario on the IMPLAN page, be sure the cell at the top reads
1990 for “year of the data”. This year is pasted into the scenario file that is exported to IMPLAN.
If you intend to use 1993 IMPLAN data, then you can import a 1990 spending data file and then price
adjust it to 1993. Before saving an IMPLAN import scenario on the IMPLAN page, be sure the cell at the top
reads 1993 for “year of the data”. If not, go back to the spending page and price adjust the data.
You may also create your own spending data files for any year and then retrieve these in TRIP.XLS. Be
sure to enter the year of the data in cell L1 of any spending data files you create. Use the BLANK spending
templates to be sure your files are in the proper format. Your own files can also be price adjusted to different years
using the button on the SPENDing page.
If you wish to estimate impacts for a year beyond those for which IMPLAN data sets are available, we
recommend using the IMPLAN model year for your spending data and assuming that spending and model
structure have not changed substantially between the two years. For example, if you are estimating impacts for
spending that occurred in 1995 using a 1993 model, you should theoretically price adjust the spending data to
1993. All results are then in 1993 dollars. As many users of the results will find the reporting of 1995 impacts in
1993 dollars somewhat confusing, it may be preferable to simply ignore any price changes between the two years
and assume that prices and spending did not change much between 1993 and 1995. In this case, you should enter
1993 on the spreadsheet for the year of the data, or IMPLAN will deflate it back to 1993 from 1995.