1
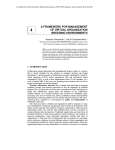
0
Concordia University
Department of Mechanical Engineering
MANU419 Erosion Rig
User Guide
Supervisor: Dr. Medraj
By:
Alfredo Martinez-Iglesias
Billy Marquez
Concordia university
8/27/2012
1
Table of Contents
Table of Figures ............................................................................................................................................. 2
1.
Introduction .......................................................................................................................................... 3
2.
Erosion Rig............................................................................................................................................. 4
2.1
ER Specifications: .......................................................................................................................... 4
2.1.1 Software and Components for Control Station Computers......................................................... 6
2.2
Erosion Rig Component Breakdown ................................................................................................. 8
2.3
Drive System ............................................................................................................................. 8
2.3.1 Issues and Discussion ................................................................................................................. 11
2.4
Vacuum System ....................................................................................................................... 13
2.4.1
Pump Start-up ..................................................................................................................... 14
2.4.2
Pump End Cycle................................................................................................................... 14
2.4.3
Recommendations .............................................................................................................. 14
2.5
Water Injection System ........................................................................................................... 15
2.5.1 Recommendation....................................................................................................................... 17
2.6.
Lighting and Imaging System .................................................................................................. 18
2.6.1 Location of View Ports ............................................................................................................... 19
2.6.2 Lighting System .......................................................................................................................... 20
2.6.3 Strobing SCHOTT LLS .................................................................................................................. 21
2.6.4 Imaging System .......................................................................................................................... 23
3.
Technical Issues........................................................................................................................... 26
3.1. Measuring Droplet Size Distribution ................................................................................................ 26
3.2
Measuring Jet Breakup Length ................................................................................................... 26
3.3 Turbulence within the ER .................................................................................................................. 26
4.
Summary and Conclusion ................................................................................................................... 29
5.
References .......................................................................................................................................... 30
2
Table of Figures
Figure 1: Erosion rig user operating station.................................................................................................. 4
Figure 2: Erosion rig and main distribution box ............................................................................................ 4
Figure 3: Control Station close up view ........................................................................................................ 6
Figure 4: Screenshot of SpinIII user interface for ER .................................................................................... 7
Figure 5: ENCS internet hub D7 with Ethernet jacks no. 215 and 216 ......................................................... 7
Figure 6: Inlet Compressed Air ...................................................................................................................... 8
Figure 7: Drive and Brake Inlet...................................................................................................................... 9
Figure 8: Drive and Brake Lines..................................................................................................................... 9
Figure 9: Drive system in the Erosion Rig...................................................................................................... 9
Figure 10: Rotor with low speed samples ................................................................................................... 10
Figure 11: Chamber Isolation Valve ............................................................................................................ 10
Figure 12: Scavenge and Vent valve ........................................................................................................... 11
Figure 13: Chamber Drain Valve ................................................................................................................. 11
Figure 14: Sogevac SV 25B rated for 100gph of water vapor ..................................................................... 13
Figure 15: Vacuum pump connection to Tee .............................................................................................. 13
Figure 16: Schematic of the water injection system................................................................................... 15
Figure 17: Lexan Polycarbonate test chamber, connected vacuum pump and undergoing a
shadowgraphy test of 600micron nozzle .................................................................................................... 16
Figure 18: Shadowgraphy test showing overall set-up and operator monitory imaging acquisition on
Computer 2. ................................................................................................................................................ 16
Figure 19: Recommended stand should lower and raise ¼” SS tube shown .............................................. 17
Figure 20: Image of VP 1 above scavenge tank .......................................................................................... 19
Figure 21: Image of VP 2 above safety relay box ........................................................................................ 19
Figure 22: VP 3 located on top of ER lid...................................................................................................... 19
Figure 23: ER 4 located underneath rotor chamber ................................................................................... 19
Figure 24: Front panel controls for SCHOTT LLS – LED light source............................................................ 20
Figure 25: Back panel controls for SCHOTT LLS – LED light source ............................................................. 20
Figure 26:
SCHOTT LLS light source set-up on VP 3 using small articulate arm ................................... 21
Figure 27:
SCHOTT LSS light source set under VP 4 using Manfrotto arm......................................... 21
Figure 28:
SCHOTT LLS light source set up on VP 1 using tube mount ................................................ 21
Figure 29:
Manfrotto variable friction magic arm borrowed from Dr. Dolatabadi ............................. 21
Figure 30: Vieworks camera must be unplugged prior to removing lens and capping. ............................. 24
Figure 31: Once Lens removed cap camera to protect CCD chip. .............................................................. 24
Figure 32: Camera and lenses correctly disassembled ready for storage .................................................. 24
Figure 33: Plastic storage drawer were camera and lenses should be arranged and kept for storage. .... 24
Figure 34: Injected water being deflected by turbulence........................................................................... 27
3
1. Introduction
This document has been written to serve as a user guide to the Barbour Stockwell Incorporated (BSI)
Erosion Rig (ER) along with its accompanying imaging system. It will also include technical issues
identified along with recommendation made during the set-up phase of the rig, and is a compilation of
information that was obtained through informal means either directly from BSI or through practical use.
To date BSI has not provided the Thermodynamics of Materials Group (TMG) at Concordia University
with the following documentation:
1. User manual for the ER
2. Maintenance manual for ER
3. Standard Operating Procedures for the ER
This report is meant to serve as temporary documentation until BSI provides TMG with the full
literature pertaining to the ER. The Section 2 of this report will provide an overview of the ER along with
a breakdown by subsystems whose functionalities will be reviewed. Issues will be raised in this section,
along with some recommendations. Section 3 will discuss more general technical issues pertaining to
the ER. Section 4 will provide a summary of recommendations, and actions to be taken for future work.
4
2. Erosion Rig
The ER was designed to evaluate the resistance to water impingement erosion of various materials.
The rig operates by means of a pneumatic turbine that spins a titanium rotor on which samples are
attached. The samples can be spun to a maximum of 20 000 RPM, corresponding to a linear speed of
approximately 500m/s. Water is introduced into the unit by means of a water injection system in a
manner that impacts the samples, causing erosion. The ER is novel in that it will allow the observation of
a water spray impacting on a surface through several viewing ports. The water injection system should
generate discrete droplets of known size. This will allow for the study of liquid droplet erosion (LDE) on
samples as well as water jet erosion (WJE).
2.1
•
•
•
•
•
•
•
•
•
•
•
ER Specifications:
The ER can be stopped by pressurizing the vacuum chamber. (i.e. If the chamber vacuum is
insufficient high speeds cannot be reached).
The ER is fully pneumatic; all mechanical systems are driven by air.
The ER designed to operate with a 100psi and 200CFM compressed air source.
The ER can reach a maximum of 20 000RPM.
Two tachometers used to measure the RPM of the turbine shaft.
The rotation speed should be steady within 0.5% and measured within 0.1%.
Water injection system can generate discrete droplets or liquid jets.
Water injection mass flow will not exceed 100gph; currently this limit is set by the vacuum
pumps water ingestion limit.
The ER allows for LDE as per ASTM G73-04.
Erosion will occur solely on BSI designed samples.
In the case of an emergency two emergency shutdown switches can be found at either the
control station or on the rig lid.
Computer 1
Computer 2
Main
Distribution Box
Erosion Rig
Control Station
Figure 1: Erosion rig user operating station
Figure 2: Erosion rig and main distribution box
6
Figure 1 shows the user operating station where the rig operator can simultaneously control
both the ER and the image acquisition system using Computer 1 and Computer 2 respectively. The
Control Station was provided by BSI and is connected to the Main Distribution Box that stores most of
the electrical components (e.g. PLC) of the rig. A close up of the Control Station is shown in Figure 3, that
includes a key On/Off switch, an emergency stop button, an emergency stop reset button, and a LCD
display connected to the rigs tachometer no. 2. When the emergency stop button has been pressed the
E-Stop light (red) is turned on. The E-stop reset button must then be depressed once the danger has
passed and the system is to be used anew.
A BNC type plug was installed by TMG staff that outputs 0 to 12V step function received from
the rigs tachometer no. 2. The ER tachometers are SPECTEC Gear Position type sensors that detect the
presence (12V) and absence (0V) of ferrous gear teeth. The BNC was to be used for the imaging system
that will be described in detail later on in Section 2.6.
BNC connector
Figure 3: Control Station close up view
Note: In the case of an emergency, two emergency stop buttons can be used either the one on the
Control Station or the ER lid. Emergency procedures along with regular operating procedures will
be described in an accompanying document labeled Erosion Rig Standard Operating Procedures
(ER SOP).
2.1.1 Software and Components for Control Station Computers
Computer 1 is used solely to run the ER user interface, Spin III, provided by BSI. The software was
recently updated corrected certain bugs in August 2012. A second update will be required that would
allow user control of the Chamber Isolation Valve, in order to Isolate the vacuum pump. There are other
small bugs that could be corrected though they are not of immediate concern. These bugs will be
discussed in the ER SOP accompanying this document. A screen shot of Spin III is shown in Figure 4, and
a full description of the program can be referred to in the ER SOP.
Computer 2 is used to acquire data from the imaging system, control the lighting system, and to post
process any collected data with MatLab or other computational software. Computer 2 has had the
following hardware components added to it:
• Intel PRO/1000 PT Dual Port Server Adapter; that adds two extra Ethernet connections to the
computer, bringing the total to three. One of these Ethernet slots is reserved for the imaging
system, another for ENCS internet connection, the other is undesignated.
7
•
•
•
MSC-202A1; 2-Port RS-232 PCI Express Card; adds the capability of two serial RS-232 connection
to the computer. One of these connections was used to control the SCHOTT LLS lighting unit
that will be further described in Section 2.6.
OCZ Vertex 3: 2.5” Solid State Drive (SSD); this product was recommended by Bock Optronics Inc
due to its high data transfer capabilities. During high speed imaging, the camera will send large
volumes of data to the computer hard disk for storage. Conventional hard disks may not be able
to handle these volumes, and thus the SSD was recommended.
Ralink Technology Wireless LAN Card; this WIFI card came with the computer. It is mentioned
here since this piece of hardware may be easily overlooked by future employees of TMG. The
WIFI capabilities may serve some purpose in future work.
Computer 2 has been registered with ENCS and has had the following software packages installed on it:
o Solidworks
o Catia
o MatLab
o Microsoft Office
Note: ENCS registered computers are eligible to receive ENCS software and IITS technical support
when needed. IITS also reformats computers if requested by operator, which may be desirable
once computer performance deteriorates.
Figure 4: Screenshot of SpinIII user interface for ER
Note:
• Computer 1 has not been registered by ENCS but has been connected to the ENCS network by
IITS. Theoretically the computer should be registered but as long as no technical support is
requested the status quo can continue.
• Internet connections are done through an Ethernet hub labeled (N) D7 located on a lab wall. The
hub has two jacks 215 and 216. IITS programs each jack to accept a single registered computer.
Computer 2 has been registered to jack 215 and Computer 1 to jack 216; each computer must
receive its internet connection from its designated jack. See Figure 5.
Figure 5: ENCS internet hub D7 with Ethernet jacks no. 215 and 216
8
2.2
Erosion Rig Component Breakdown
The erosion rig shown in Figure 2 can be broken down into the following systems:
1.
2.
3.
4.
Drive System
Vacuum System
Water Injection System
Lighting and Imaging System
2.3
Drive System
The ER requires a 100psi and 200CFM compressed air source in order to operate. Concordia’s
regular compressed air lines did not meet the design requirements and so a special compressed air line
was installed in EV13.205 and connected to the rig. The compressed air runs through a 1in copper pipe
that connects two pressure gauges and a regulating valve as shown in Figure 6.
Should be
maintained at 100
PSIG at all times
Drops below
100psi once rig is
operating
Figure 6: Inlet Compressed Air
The pressures before and after the regulator should be maintained at 100 psig although once
the ER is started the pressure slightly drops. The compressed air line continues until it reaches a split
that allows the air to run through two tubes for the drive and brake and a line to the operating valves.
Both tubes are fitted with solenoid valves that will open and close during the driving process or the
braking process. Figure 7 shows this split to the tubes.
9
Compressed air to
the solenoid
Compressed air
inlet tube split
Solenoid Vales for
drive and brake
Figure 7: Drive and Brake Inlet
The system allows the ER to rotate its rotor in either the clockwise or counter clockwise
direction. This process allows the samples to be tested on both sides to accumulate more data for a
single sample. Once the drive is engaged the solenoid valve opens and allows the compressed air to
enter the turbine chamber and begin spinning the turbine. This turbine is connected to a shaft that in
turn rotates the rotor with its attached samples inside the working chamber. This process can be seen in
Figures 8 to 10.
Turbine Casing
Compressed air line
drives rotor under
clockwise operation
Rotor with
Sample
Drive Shaft
Figure 8: Drive and Brake Lines
Figure 9: Drive system in the Erosion Rig
10
Figure 10: Rotor with low speed samples
The tube split shown in Figure 7 bleeds air from the main drive line to the operating valves. This
allows the rig to use the same compressed air to operate various actuators and solenoid valves
throughout the system. The first valve to always be switched to the OPEN position is the chamber
isolation valve, which allows the vacuum pump to begin depressurizing the working chamber. Figure 11
shows the valve and how it connects the vacuum pump to the chamber.
Line from vacuum
pump inlet to Tee
connection
Chamber
Isolation Valve
Pneumatic line
to valve
Figure 11: Chamber Isolation Valve
The second valve to be opened during a typical test on the ER is the scavenge tank isolation
valve. Upon opening of this valve the scavenge tank will begin to depressurize until it attains the same
pressure as in the rotor chamber. Once both the rotor chamber and the scavenge tank equalize,
reaching identical pressures, the system automatically opens the third valve which is the chamber drain.
This allows all accumulated water in the testing chamber to be drained out into the scavenge tank. The
sequence described begins automatically when using the ER software prior to droplet testing. Once
testing is complete and the turbine has come to a complete stop, the final valve to be operated is the
11
scavenge tank vent valve. Once the vacuum pump is shut off the two chambers, rotor and scavenge
tank, must be re-pressurized in order to allow the rig door to open. The scavenge tank vent valve allows
the whole system to return to atmosphere pressure. Figures 12 and 13 show all three valves and their
connections.
Scavenge Tank
Chamber Drain
Chamber Drain
Solenoid
Scavenge Tank Vent
Valve
Figure 12: Scavenge and Vent valve
Scavenge Tank
Isolation Valve
Figure 13: Chamber Drain Valve
2.3.1 Issues and Discussion
After carrying out tests on the ER, concerns regarding the drive system have been identified. As
noted earlier the compressed air seems to vary once the rig is in operation, dropping below the design
pressure of 100psi. This pressure drop can reduce the overall torque that the turbine is able to generate
thus limiting its maximum speed. For example during the tests the air pressure dropped to about 84
psig, which in turn allowed the rotor to only reach a maximum speed of 7000 rpm. Note: that there may
be causation but not a correlation between line pressure and speed since the chamber was not
vacuuming to design pressures. Hence the presence of air may be causing excess drag on the rotor,
which in turn does not allow it to reach design speeds. Another concern with low line pressure is that
the solenoid valves were not function properly. Some valves had insufficient line pressure and thus were
unable to open to the full open position. If the system detects that the valves are only partially open
then a safety override automatically closes the valve. To avoid shutting down the test, the turbine was
set to “coast”, which would mean the compressed air into the turbine would stop and allow the turbine
to just coast, which would allow the pressure to increase in the line and then be used to operate the
actuator to open the valve. Once the valve is opened the line to the turbine can then be re-opened in
order to run the turbine.
13
2.4
Vacuum System
The Vacuum system begins at the SOGEVAC SV 25B pump shown in Figure 14. The vacuum
pump uses a ballast valve, bronze knob located beside inlet that allows water vapors to escape the hot
vacuum pump oil. The ballast valve on the SV 25B model is “always open.” The bronze knob is a porous
structure that allows air to enter, and acts as a screen preventing the ingestion of large particulates.
Other models may have adjustable valves with several open positions or simply an either opened or
closed
Note: The Sogevac SV 25B is designed to be able to purge water from its oil as long as the
ingestion rate of water vapor is less than 100gph.
Pump inlet
connects to rotor
chamber and
scavenge tank
Pump exhaust
Ballast valve
Figure 14: Sogevac SV 25B rated for 100gph of water vapor
The pump inlet is connected to both the rotor chamber and the scavenge tank by a Tee in the
inlet line. Two solenoid valves, the Chamber Isolation Valve and Scavenge Tank Isolation Valve dictate
what chamber is vacuumed. Figure 15 shows the Tee along with the Chamber Isolation Valve. The
Scavenge Tank Isolation Valve cannot be seen in this image as it is located further to left over the
scavenge tank.
Line to
scavenge
tank
Chamber
Isolation
valve
Tee connected to:
vacuum inlet, rotor
chamber, scavenge
tank.
Vacuum
Inlet
Figure 15: Vacuum pump connection to Tee
14
The standard sequence for the opening and closing of the solenoid valves has already been discussed in
Section 2.3.
2.4.1
Pump Start-up
The vacuum pump needs to be warmed up for 30 min prior to the running of any test. This will allow
the oil in the pump to teach ~70C at which point the pump is able to vent any moisture that gets
ingested by the pump and mixed in the oil. During the heat up cycle, the pump should be isolated. That
is, the Chamber Isolation Valve and the Scavenge Tank Isolation Valves must be closed. This will allow
the pump to operate under no load conditions, and begin to warm up.
Note: BSI should modify SPIN III in order to allow for the vacuum pump to run in isolation mode. As of
now it is impossible to do so, since the program opens the Chamber Isolation Valve once the
pump is turned on. To manually isolate the valve, disconnect the compression hose, and block
the inlet of the pump with a piece of aluminum metal sheet. To increase seal rub small amount of
vacuum grease on aluminum plate, and engage the vacuum pump. This procedure may damage
vacuum hose and should not become a standard operating procedure.
2.4.2
Pump End Cycle
During a typical ER test cycle the pump will be ingesting water that will be trapped in the vacuum
pumps oil. If the amount of water ingested exceeds 100gph (gram per hour) the pump will not be able to
purge/vent the water from its oil. This water will then accumulate in the oil changing its color from
transparent to creamy. The change in oil quality will be apparent through the oil level gauge window at
the bottom of the pump. The water in the oil accumulated during a cycle should be purged by isolating
the pump and allowing it to run for a minimum of 30min. If the oil is still creamy allow pump to run for a
longer duration, overnight if necessary.
Note: Constant use of the vacuum pump with oil contaminated with water can lead to the deterioration
of components and seals. Components are cast iron and may rust or seize if the pump is left idol
with water laden oil for long periods of time.
2.4.3
Recommendations
All vacuum pumps exhausting into a closed environment are supposed to have filtering systems
on the exhaust to eliminate the buildup of vacuum oil fumes that may harm operators. In the current
set-up no such filtration system exists and the pump is exhausting into the laboratory. Recommended
action:
1 – To purchase a vacuum pump exhaust filtration unit.
2 – To extend a line from the exhaust into the turbine exhaust system.
It is recommended that the pump user manual be read and a maintenance schedule/log be
developed; the same log could be implemented for all the pumps in EV 13-205 laboratory. Components
such as filters, valves, O-rings, need to be routinely checked and replaced when needed to ensure the
longevity of the devices.
15
2.5
Water Injection System
The water injection system was purchased from Simulent, a Computational Fluid Dynamics
(CFD) software development and engineering consulting company. They are a spin-off from the
University of Toronto’s Centre for Advanced Coating Technologies (CACT). A schematic of the purchased
system can be seen in Figure 16.
Additional carbon
filter installed here
Figure 16: Schematic of the water injection system
For more details regarding components, and water system set-up please refer to the system User Guide
provided by Simulent. The document can be found within the MANU 419 folder on Comp. 2. TMG staff
modified the system by replacing the ¼” nylon tubing with a compact design using ¼” stainless steel
tubing. A component to the system was also added: a 5micron activated charcoal filter.
The person to contact within Simulent is:
Hamideh Parizi, PhD., P. Eng
Simulent Inc
416.979.5544 ext. 1001
http://www.simulent.com
Simulent provided the water injection system with no specific information regarding breakup lengths,
and flow rates at atmospheric conditions. Since the effect of vacuum on breakup length and droplet size
where unknown to TMG staff a small Lexan Polycarbonate test chamber was designed. The chamber
would allow water to be injected in an environmental with pressures identical to those used during ER
testing. The chamber was designed to operate at 30mbar and can be seen in Figures 17 and 18. The
chamber was used to obtain preliminary breakup lengths, and droplet sizes for the three nozzles
provided by Simulent (i.e. 600um, 400um, 200um).
16
Figure 17: Lexan Polycarbonate test chamber, connected vacuum
pump and undergoing a shadowgraphy test of 600micron nozzle
Figure 18: Shadowgraphy test showing overall set-up and
operator monitory imaging acquisition on Computer 2.
17
2.5.1 Recommendation
The data acquired through the set-up shown in Figure 18 was preliminary. Improvements should
be made regarding imaging blurring, that is most likely caused by an exposure time that is too large for
the phenomena being observed. Droplet diameters where measured manually using a simple MatLab
algorithm. This algorithm needs to improve in order to automatically measure droplet diameters over
many pictures and provide a historical distribution or average of measured droplet sizes. If it is
determined that image processing is incapable of providing this detailed information, then the
Multiphase Flow & Thermal Spray Laboratory (MFTSL) PDPA system could be used to measure droplet
size distribution.
The droplet generator must be lowered and raised due to account for two factors. The first is
the breakup length. The second is to reduce the displacement that the jet undergoes due to turbulence
while traveling towards the samples. To effectively/accurately
control the height of the nozzle a stand should be developed
that can control the location of the nozzle head. The stand
would be able raise and lower ¼” stainless steel tube from
which the nozzle head is attached. The stand would have a
graduated knob to indicate the height from either the sample
of the top of the ER lid.
The water that is injected into the rig will be drained
into the scavenge tank. Some of this water will find its way
into the vacuum pump. A preliminary measurement was
performed at a flow rate of 0.8ml/s at 10 000RPM, 140gph
were unaccounted for. This water was assumed to be
absorbed by the vacuum pump. It is recommended that
further tests be performed in order to measure the amount of
water being vaporized and finding its way to the pump.
¼” tube to
be lowered
and raised
Figure 19: Recommended stand should lower
and raise ¼” SS tube shown
18
2.6.
Lighting and Imaging System
The ER was designed to be able to observe and record images of the LDE or WJE phenomena. The rig
was designed with several viewing ports (VP) to allow adequate lighting and imaging of the rig interior.
The following section will discuss:
• 2.2.6.1 The location of VP
• 2.2.6.2 The lighting system recommended by Bock Optronics Inc
• 2.2.6.3 The imaging system sold to TMG by Bock Optronics Inc
• 2.2.6.4 The triggering system to control both lighting and imaging system
• 2.2.6.5 Recommendations
Note: Bock Optronics Inc sold TMG both lighting and imaging systems. The scope of Bock Optronics
contract with TMG was unclear to the staff that worked in the ER set-up. Contractual scope will
dictate the responsibilities held by Bock Optronics regarding set-up, debug, etc, that were and
will be required during the set-up of the ER. The Bock Optronics employee that TMG worked
with was:
Mike Faulkner, C.V.P.
Bock Optronics Inc
Tel: 450.662.9889
Fax: 450.662.9063
[email protected]
19
2.6.1 Location of View Ports
The ER was designed with four View Ports (VP), two of which face each other with one over the
scavenge tank (VP 1) and the other on the opposing side (VP 2) as shown in Figures 20 and 21
respectively. VP 2’s line of sight is in level with the sample holder and is thus is the main view port to be
used for imaging LDE. VP 1 is over the line of sight of its opposing view port, VP 2, allowing for either
imaging or lighting from across the rotor chamber.
VP 1
VP 2
Figure 20: Image of VP 1 above scavenge tank
Figure 21: Image of VP 2 above safety relay box
VP 3 and 4 are located on-top of the ER lid and on the bottom of the rotor chamber respectively, as
shown in Figures 22 and 23. VP 3 can be used to either to illuminate the LDE process or to image the
phenomena. VP 4 is located underneath the rotors arm slightly before the sample holder and has a
cylindrical sleeve within the chamber to reduce water accumulation that would obstruct
imaging/lighting of the sample holder. Due to the location of VP 4 it is difficult if not impossible to obtain
a line of sight with the LDE process and thus this port may be used for indirect lighting.
VP 4
VP 3
Figure 22: VP 3 located on top of ER lid
Figure 23: ER 4 located underneath rotor chamber
20
2.6.2 Lighting System
The lighting system sold to TMG was a single SCHOTT LLS – LED Light Source. For detailed
technical specifications please refer to the User Manual that can be found in MANU 419 folder. The
SCHOTT LLS lighting unit can be controlled in four ways; manually using the from panel controls,
remotely through Ethernet or serial RS-232 connection, or through the analog multi-port located on the
back panel of the device. Software for either RS-232 or Ethernet control was installed on Computer 2
shown in Figure 1. The installation CD can also be found with the other MANU 419 documentation.
Figure 24: Front panel controls for SCHOTT LLS – LED light source
Figure 25: Back panel controls for SCHOTT LLS – LED light source
The SCHOTT LED light source can be run in strobe mode. The strobe intensity can be up to 200% of the
normal intensity by “overdriving” the SCHOTT LLS. This can be achieved by connecting a 30V power
source to the multi-port instead of the regular 24V power supply. The light source can be made to
strobe with a 0-5V triggering input signal. This signal can easily be obtained from a function generator.
For detailed instructions regarding connections refer to the SCHOTT LLS User Manual.
Lighting from the four view ports was attempted using the SCHOTT LED light source. The set-up used can
be shown in Figures 26-28. Figure 29 shows a Manfrotto Series 244 variable friction magic arm that was
used for various set-ups. The arm was borrowed from the MFTSL. Imaging was attempted with three
different SCHOTT LLS lighting sources that where run simultaneously from VP 1, 3 and 4. The light
intensity was insufficient to produce any coherent images. In this test strobing was not attempted as the
set-up would have increased the complexity of the test.
21
Figure 26: SCHOTT LLS light source set-up on VP 3 using
small articulate arm
Figure 28: SCHOTT LLS light source set up on VP 1 using
tube mount
Figure 27: SCHOTT LSS light source set under VP 4 using
Manfrotto arm
Figure 29: Manfrotto variable friction magic arm
borrowed from Dr. Dolatabadi
2.6.3 Strobing SCHOTT LLS
The SCHOTT LLS – LED lighting unit was made to strobe using the following equipment:
-
A power supply that could generate two voltage sources of 15V.
A function generator
Photodiode
Oscilloscope
A power supply was used to “overdrive” the LED to twice the normal mode of intensity. This was
achieved by connecting both rails of a +/- 15V power supply, totaling 30V. The +15V rail was connected
to Pin 1, and the -15V rail was connected to Pin 2 (See page 27 of SCHOTT LLS User Manual) . The
function generator was connected to Pin 6. An oscilloscope was connected to the photodiode in order
to visualize and measure the time delay, and LED on time.
Note: Strobing can only be done by providing a triggering signal through the multi-port.
23
2.6.4 Imaging System
The high speed imaging system sold to TMG was a Vieworks VH 310-G with a nominal frame rate of
264fps. It was accompanied by a Navitar machine vision system comprising of the following
components:
• “C” Mount Coupler (1-6010)
• 5X Tube Adapter (1-6105)
• Zoom 6000X - High Mag Zoom Lens (1-60190)
• 1X Converter Lens – NOT INCLUDED IN ORGINAL SALE (1-60640)
• 0.25X Lens Attachment (1-6044)
The optical components listed above should always be stored away after use in appropriate bubble wrap
and stored in shelving unit. Improper handling will result in dust accumulation within optics and cause
imaging “spots” corresponding to dust. The lenses should only be cleaned using a small air hand pump
sold at pharmacies used to drain fluid from babe’s noses or ear ways. Other cleaning methods,
compressed air, etc, should be done only having verified with either Bock Optronic or lens manufacturer
-Navitar.
Camera System Assembly:
1. Remove camera and lenses from storage casings.
2. Assemble lenses using the following sequence:
a. 1-6010
b. 1-6105
c. 1-60190
d. 1-60640
e. 1-6044
3. Connect camera and lenses together.
4. Assembly is now complete; connect both Ethernet and power cable to Vieworks camera.
Camera System Disassembly:
1. Make sure the camera power is disconnected before any of the lenses are removed. While
the camera is connected the CCD will have an electrostatic charge that will cause dust
particles to attach themselves to it. See Figure 30.
2. Once camera power has been disconnected remove lenses in whatever order is best
suitable to the experimental set-up used. Note: Once the camera has been removed from
the lens assembly make sure to use rubber camera cap immediately to ensure that no dirt
contacts the camera lens. See Figure 31.
3. Make sure to use lens covers that come with the Zoom 6000 and place zoom in bubble
wrap.
4. The tube adapter did not come with any covers, make sure to store in bubble wrap as soon
as disassembled.
5. Place 6044 and 60640 in designated Navitar lens plastic boxes.
6. 6010 and other adapters may be stored in small plastic bag. See Figure 32.
7. Store camera, and lenses in plastic storage drawers. See Figure 33.
24
Rubber
camera cap
Figure 30: Vieworks camera must be unplugged prior to
removing lens and capping.
Figure 31: Once Lens removed cap camera to protect CCD
chip.
Figure 32: Camera and lenses correctly disassembled
ready for storage
Figure 33: Plastic storage drawer were camera and lenses
should be arranged and kept for storage.
26
3. Technical Issues
3.1. Measuring Droplet Size Distribution
It is inaccurate to assume that droplets of a single size will be generated with the current droplet
generator. A distribution of droplets will be formed. It may be possible that there be an insignificant
amount of various sizes. That is, if the Gaussian distributions standard deviation is small enough the
droplets generated of various sizes may be neglected. This assumption remains to be proven. The
current method adopted by TMG to measure droplet sizes was “shawdowgraphy” where the jet is
imaged using backlighting in a setup similar to that shown in Figures 17 and 18. The limitations in
accuracy, and resolution regarding droplet size measurements needs to be determined in order to
quantify the errors invoked by the measuring technique.
Note: Preliminary droplet size measurements were obtained by manually counting pixels horizontally
and vertically across droplets. Pixels were correlated to a length by taking images of a ruler, then
counting the pixels between 1mm markings. The limitation of this method is that a statistically
insignificant amount of measurements was performed. The data obtained could only be used as a
preliminary indicator of a size, but remains indefinite.
3.2 Measuring Jet Breakup Length
The method currently being employed by TMG to measure the droplet breakup length is through
direct observation. This was the method used to collect preliminary breakup length data by Summer
2012 staff. It was observed that the breakup length would vary between images, and an estimate was
taken as the recorded value. The cause of this pulsation may be attributed to the pressure source driving
the flow, the pump. For sensitive liquid flow work, pumps are not recommended as they produce
oscillations in pressure while they operate. It may be desirable to use a similar set-up as that in the
MFTSL at Concordia University. There they use pressurized water cylinders connected to a pressure
regulator that maintains a constant pressure within the cylinder that drives the water out. Other causes
of breakup length variations are unknown though a literature review of the topic is recommended.
3.3 Turbulence within the ER
The ER was designed to operate at a pressure of 30mbar for two reasons:
1 - To reduce the amount of mater, air, spinning within the rig.
2- To reduce the amount of drag imparted by the momentum transfer between the rotor and
air.
The presence of air would lead to turbulence within the chamber. The turbulence is caused by
the imparted velocity to the air by the rotor. If sufficient turbulence is present the water jet will be
deflected. The tests that where run with the current set-up showed that a significant amount of
turbulence was present within the chamber. Figure 34 shows a relatively high water flow rate 0.8 ml/s
being deflected by the turbulence within the chamber. The effect of such turbulence on a jet has been
27
studied by the MFTSL of Concordia University in publications similar to [1]. The effects of cross flow,
what is referred to here as turbulence, will typically be to decrease breakup length and can change the
droplet size distribution pattern of the jet.
Figure 34: Injected water being deflected by turbulence
It is important to understand that jets break up into droplets of various sizes, typically following
a Gaussian distribution. The distribution pattern of droplets will be affected by several properties of
both the liquid and the medium into which it is injected. From these properties a dimensionless
parameter of interest can be determined. In the case of the current experiment the dimensionless
parameter of most interest may be the Webber number. If a certain droplet size is assumed, say the
value that is measured through shawdowgraphy, and knowing the condition into which these droplets
will be injected into (i.e. those within the rotor chamber), a corresponding Webber number may be
determined. If this Webber number is less than some critical Webber number, obtained from a
literature review (the number maybe 6), then it is safe to assume that the droplets will not continue to
breakup into smaller droplets. If this is not the case and the Webber number is larger than the critical
value then droplet breakup will continue and further investigation will be required in order to obtain
either theoretical models or an experimental set-up to determine droplet size.
The first step to quantifying the effects of this turbulence on the injected water is to determine
the velocity of the air within the chamber. A pitot tube was borrowed from Concordia Technician Brad
Luckhart H1045-02 and has been returned. The pitot tube came with a feed through that was screwed
into the same hole were the current water injection system feed through is located. The velocity was
measured when the rig was operated at atmospheric conditions to be 28m/s. No further measurements
were taken since the Dwyer Series MS Magnesese Differential Pressure Transmitter borrowed from Dr.
Dolatabadi was designed for readings above 1psi. A differential pressure transduced needs to be
obtained that can operate at the low pressures occurring within the rig in order to measure the internal
wind velocity. Once the wind velocity has been obtained a review of the effects of weber number on
liquid jets under cross flow conditions needs to be completed. The critical weber number must be
calculated that will indicate whether under the current velocity the droplets will continue to breakup or
will remain on measured size.
28
Calibration of Pitot Tube:
The pitot tube was calibrated using in the MFTSL. A rotameter was used to determine the
massflow rate from an orifice of known size. A tube of more than 1m was connected to the rotameter in
order to reduce turbulence, generating a laminar flow. The air velocity was calculated from the mass
flow rate, and the theoretical value was compared to the measured value of the pitot tube. A correction
factor K was adjusted to make this experimental value equal to the theoretical value.
29
4. Summary and Conclusion
The following is a list of actions that the Summer 2012 staff has deemed important for the continuation
of the ER project:
1. BSI needs to update SPIN III to allow for the Chamber Isolation Valve to be maintained close
while the vacuum pump is operated. Refer to Sections 2.1.1 and 2.4.1.
2. The ER has difficulty reaching required testing velocities; this may be due to either insufficient
CFM being provided by the compressed air source, inappropriate set-up of regulating valve,
presence of excess air that is causing drag on rotor. Refer to Section 2.3.1.
3. The ER has insufficient line pressure going to the solenoids that occasionally air must be
diverged from the turbine to the solenoids in order to operate them correctly. Air divergence
was achieved by costing the turbine. Refer to Section 2.3.1.
4. The vacuum pump water absorption limit is 100gph (grams per hour) of water. Water injection
system flow rates need to respect the limitation of the pump. More measurements should be
made to quantify the amount of water being vaporized and injected by the pump. If more
capacity is required it is recommended to change the pump. Refer to Section 2.5.1.
5. A stand for to adjust the nozzle head needs to be designed and manufactured, or a pre-existing
model purchased. Refer to Section 2.5.1.
30
5. References
[1]
E. Farvardin et al. “Comparative Study of Biodiesel and Diesel Jets in Gaseous Crossflow,” AIAA
Journal 2012