1
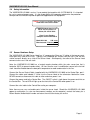
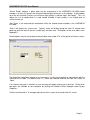
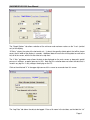
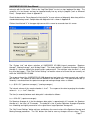
VIASENSOR HS-1000
REAL TIME FUEL CELL HUMIDITY SENSOR
USER MANUAL
VIASENSOR HS-1000 User Manual
©Copyright 2007 by LANDTEC
All rights reserved. No part of this book may be used or reproduced in any form or by any means, or
stored in a database or retrieval system, without consent of the publisher. Making copies of any part of
this book for any purpose other than your own personal use is a violation of United States copyright laws.
LANDTEC and VIASENSOR HS-1000 are registered with the U.S. Patent and Trademark Office.
For further information contact:
LANDTEC North America
850 S. Via Lata, Suite 112
Colton, CA 92324
USA
Tel: 800-821-0496 or +1-909-783-3636
Web: www.VIASENSOR.com
LANDTEC Europe
Formerly Geotechnical Instruments
Sovereign House Queensway
Leamington Spa, Warwickshire CV31 3JR,
England
Tel: +44(0)1926 338111
Web: www.geotech.co.uk
LANDTEC South America
LANDTEC Produtos e Servicos Ambientais Ltda.
Rua Pedroso de Carmargo, 237 - Chácara
Santo Antonio - SP/SP CEP 0417-010
Brazil
Phone: +55(11) 5181-6591
Web: www.landtecbrazil.com.br
LANDTEC Release Date: June 5, 2009
Version: 1.6
Page ii
VIASENSOR HS-1000 User Manual
Table of Contents
1
INTRODUCTION ............................................................................................................. 1
2
GENERAL OPERATIONAL FEATURES ........................................................................ 2
2.1
2.2
2.3
2.4
2.5
3
HOW DOES THE VIASENSOR HS-1000 WORK? ..................................................................... 2
WHAT THE VIASENSOR HS-1000 MEASURES ....................................................................... 2
STORAGE .............................................................................................................................. 2
SAFETY INFORMATION............................................................................................................ 3
SENSOR HARDWARE SETUP ................................................................................................... 3
THE VIASENSOR HS-1000 SOFTWARE ....................................................................... 4
3.1
3.2
3.3
3.4
SOFTWARE SETUP ................................................................................................................. 4
SOFTWARE DESCRIPTION....................................................................................................... 4
SERIAL COMMUNICATIONS ..................................................................................................... 8
ANALOG OUTPUT ................................................................................................................... 8
4
FREQUENTLY ASKED QUESTIONS (FAQ) .................................................................. 8
5
TECHNICAL SPECIFICATIONS ................................................................................... 10
6
APPENDIX A: SAMPLE LOG FILE .............................................................................. 11
7
APPENDIX B: SAMPLE LOG FILE WITH DIAGNOSTIC INFO ................................... 11
8
APPENDIX C: SAMPLE DIAGNOSTIC DATA DOWNLOAD FILE .............................. 12
9
APPENDIX D: SAMPLE SERIAL OUTPUT DATA ....................................................... 13
10
APPENDIX E: ERROR CODES................................................................................. 13
11
APPENDIX F: SAMPLE MAIN SCREEN DISPLAY (PARTIAL PRESSURE)........... 14
Page iii
VIASENSOR HS-1000 User Manual
1 Introduction
Critical to the proper design and performance characterization of polymer electrolyte membrane fuel cells
(PEMFCs) is the accurate measurement of its operating conditions, including temperature, pressure and
moisture content of the hydrogen and air inlet gases. Proper reactant gas humidification ensures good
fuel cell membrane hydration which is instrumental in maintaining high ionic conductivity. Low ionic
conductivity leads to decreased fuel cell performance and potentially physical damage as well.
The LANDTEC VIASENSOR HS-1000 (Real-Time Humidity Sensor) uses patented miniature laser
technology to enable real-time, accurate, and reliable measurement of the humidity of the inlet gases in
PEMFC testing and operation. The VIASENSOR provides researchers and fuel cell developers with a
solution for in-situ real-time humidity measurements.
The VIASENSOR solves the key challenges of accurately measuring the fuel cell humidity levels in high
temperature and high humidity environments. Specifically, the VIASENSOR solution has the following
features:
•
•
•
•
•
•
•
•
•
Continuous, fast response real-time operation -- data taken as quickly as every 0.8 seconds
Able to detect transients in humidification
Non-invasive humidity measurement of the inlet gas stream
Designed for high humidity and high temperature environments
Does not condense the water vapor, no long cycle times between measurements
Sensor does not get flooded and have to dry out
Low cost of operation
Modest package size and weight
Output interfaces to any PC
Carefully unpack the VIASENSOR HS-1000, inspect and inventory the items included. The following
items should be contained in your package:
Sensor Head
Control Box
Sensor Control Cable
Power Cord
Serial Cable
User Manual
CD-ROM with monitoring software for a PC
Immediately notify shipping company if the VIASENSOR HS-1000 unit or accessories are
damaged due to shipping. Contact LANDTEC immediately if any items are missing.
For questions regarding operation and performance, please contact LANDTEC at:
Customer Service, Technical Support or Factory
(800) 821-0496 In the US
Service
+1 (909) 783-3636 International
Page 1
VIASENSOR HS-1000 User Manual
2 General Operational Features
2.1
How does the VIASENSOR HS-1000 work?
The VIASENSOR uses patented tunable diode laser absorption spectroscopy technology to provide
direct, real-time, fast-response measurements of the water vapor content in fuel cell gas streams. The
laser beam, tuned to a specific absorption wavelength of water vapor, is aimed across the inlet gas
stream, and the sensor essentially counts the number of water vapor molecules passing the laser.
The tunable diode laser absorption technology is a proven technique as it has been widely used for over
40 years in many other applications. The current approach was originally developed at the NASA/Caltech
Jet Propulsion Laboratory. As the humidified gas passes in front of the laser, located in a small heated
chamber to prevent condensation, some of the laser light is absorbed by the water vapor in the gas
stream. A detector then measures how much laser light was absorbed by the water vapor, which
corresponds directly to how many water vapor molecules are in the laser's path. For a given
temperature, the area under the spectral line of H2O provides a direct and quantitative measure of the
amount of water vapor in the gas stream. This water vapor number density (molecules per cm3) value
can be converted to any other desired unit such as dew point, absolute humidity, and relative humidity,
with knowledge of pressure and temperature at the measurement point.
Since the laser wavelength is tuned rapidly and continuously, this measurement approach is both simple
to implement and robust. There is virtually zero drift over time and no calibration needed.
The VIASENSOR HS-1000 is an excellent and unmatched, long term humidity measurement
solution for fuel cell testing.
2.2
What the VIASENSOR HS-1000 Measures
The VIASENSOR HS-1000 will measure and display humidity as Dew Point in degrees Celsius or as
Partial Pressure in millibar for all typical gasses used with PEM fuel cells. These include:
•
•
•
Hydrogen
Air
Oxygen/Nitrogen mixes
The range of Dew Point that is measurable is between 30ºC and 100ºC.
Pressure range for the VIASENSOR HS-1000 is from zero gauge pressure up to 2 atmospheres of back
pressure.
The sensor reading is not flow rate dependent. The flow can be in either direction. At low flow rates
(less than 0.4 L/min) there will be some increase in the response time of the sensor because of the time
required to move the gas mixture through the sample chamber. At high flow rates (above 15 L/min) the
pressure drop across the sensor may become significant. For very high flow rates it is best to divert only
a portion of the gas stream through the sensor.
2.3
Storage
The instrument should be kept in a clean, dry and warm environment such as an office.
Page 2
VIASENSOR HS-1000 User Manual
2.4
Safety Information
The VIASENSOR HS-1000 is a class 1 laser product that complies with 21CFR1040.10. It is intended
for use in a general purpose area. It is the responsibility of the operator to determine the protection
concept and classification required for particular application or the equipment.
DANGER - Invisible Laser Radiation When Open
AVOID DIRECT EXPOSURE TO BEAM
LANDTEC North America Inc.
850 S. Via Lata, Suite 112
Colton, CA 92324 USA
Class I Laser Product
Complies with 21CFR1040.10
Model HS-1000
S/N: xxxx
Manufactured: February 2007
2.5
Sensor Hardware Setup
The VIASENSOR HS-1000 Sensor Head has ¼” compression fittings on ¼” tubing at the two gas ports.
Either port may used for the inlet. Typically, the humidified gas stream from the user’s fuel cell test
station connects directly to an inlet of the Sensor Head. Subsequently, the outlet of the Sensor Head
connects to the user’s fuel cell stack.
Note: the VIASENSOR HS-1000 has a heated sample chamber within the main sensor box that is
heated to 105ºC (to prevent condensation). All lines from the user’s humidification source to the fuel cell
stack should be heated above the dew point temperature to avoid condensation in the line.
Connect the Sensor Control Cable (supplied with the VIASENSOR HS-1000) to the Control Box, port 1.
Connect the cable ends labeled 2, 3 and 4 to the Sensor Head at the connectors labeled the same.
NEVER connect or disconnect this cable at either end when power is on.
Connect the power cord to the Control Box. The ON/OFF switch is right above the power cord inlet on
the Control Box. The red LED will light up on the front of the Control Box when power is on.
Connect the serial cable to the Control Box and to your computer.
Note: there are no user serviceable parts inside the sensor head. Should the VIASENSOR HS-1000
appear to malfunction (i.e. give no measurement readings on the computer), contact the factory for a
Return Material Authorization number and return the unit to the factory for service.
Page 3
VIASENSOR HS-1000 User Manual
3 The VIASENSOR HS-1000 Software
3.1
Software Setup
To install the VIASENSOR HS-1000 monitoring software onto a computer, insert the CDROM in the
computer’s CDROM drive. The installation utility should run automatically. Follow the prompts until
completion.
3.2
Software Description
The VIASENSOR HS-1000 control box has a serial port for communication with a computer. Connect
the serial cable between this serial port and a serial port on your computer. In case your computer has
no available serial port, a serial to USB adapter will work. Please note that the Com Port that your
computer assigns to the USB adapter may change each time you unplug and reconnect the USB adapter
to the computer.
If the VIASENSOR HS-1000 has the optional Analog Output in addition to the serial port, then the serial
port may not need to be used except for diagnostic functions. The monitoring software would only be
needed for changing internal parameters for data smoothing and for selection of Analog Output units of
dew point or of partial pressure of water vapor.
To run the VIASENSOR HS-1000 monitoring software, double click on the program icon on your
computer’s desktop. The following screen shot is the main screen of the program.
The horizontal axis is time in seconds and the vertical axis is user-selectable for dew point in degrees
Celsius, partial pressure (of water vapor) in millibars (mB), or partial pressure in kilopascals (kPa). The
data progresses across the screen much like a strip chart. The latest dew point or partial pressure data
point is displayed at the bottom of the screen in blue numerals.
Page 4
VIASENSOR HS-1000 User Manual
“Sensor Ready” indicator is green when the gas temperature in the VIASENSOR HS-1000 sample
chamber is at least 5ºC greater than the measured dew point of the gas in the chamber. At initial power
up of the unit and while it warms up, the Sensor light typically is red and states “Not Ready”. This is to
reduce the risk of condensation in a cold sample chamber if high humidity is run through prior to
sufficient warm-up.
“Gas Temp” is the measured gas temperature within the heated sample chamber in the VIASENSOR
HS-1000.
“Status” will display any system error. Typically, errors will display during the initial 15 seconds after
power up while the internal self-test is under way, and then clear. Descriptions of the error codes are in
Appendix E.
Several options may be set by going to the pull down menu under “File” at the top left of the main screen.
The “Com Port” tab allows selection of the com port in use by your computer to communicate with the
VIASENSOR HS-1000. (The default value is 1.) Make your selection and click the Com Port “switch” to
“Open”.
If an incorrect com port is selected, an error message will appear alerting you to that fact. Check which
com ports are available on your computer by viewing the Hardware Device Manager under System
Properties.
Click on the white/red “X” in the upper right corner of this screen to save and close this screen.
Page 5
VIASENSOR HS-1000 User Manual
The “Graph Options” tab allows selection of the minimum and maximum values on the Y-axis (vertical
axis) of the display.
“X Points” selects the scale of the horizontal axis. It selects the quantity of data points that will be shown
across the full width of the display in seconds. Additional data will cause the existing data to scroll to the
left, off of the screen, with the visual effect of a strip chart.
The “Y-Axis” pull-down menu allows the data to be displayed on the main screen as dew point, partial
pressure in millibars, or partial pressure in kPa. Note that this selection does not affect the data that is
saved in any log file – it only changes the display on the PC.
Click on the white/red “X” in the upper right corner of this screen to save and close this screen.
The “Log Data” tab allows the data to be logged. Enter a file name in the text box, and include the “.txt”
Page 6
VIASENSOR HS-1000 User Manual
extension with the file name. Click on the “Log Data Switch” to start, or stop, logging of the data. The
saved file is in text format, and may be imported readily into any analysis program (such as Microsoft
Excel). Sample data is shown in Appendix A.
Check the box next to “Save diagnostic info to log file” to save columns of diagnostic data along with the
standard data being saved. Sample data with diagnostic info is shown in Appendix B.
Click on the white/red “X” in the upper right corner of this screen to save and close this screen.
The “System Info” tab allows selection of VIASENSOR HS-1000 internal parameters “Spectrum
Average”, “Moving Average”, and “Analog Output”. The factory default is Spectrum Average 4, Moving
Average 2 – these are typically the largest values used per each. The minimum value for each is 1, and
they must be integers. Click “Get Current Settings” to read the values of all three that are currently set
within the VIASENSOR HS-1000.
The response time of the VIASENSOR HS-1000 depends on two factors, the measurement rate, and the
gas flow rate. The slowest of those rates will determine the response time. The measurement rate (in
seconds) is calculated from the spectrum average and moving average values as follows:
tresp = (0.26+.53 * (spectrum averages)) * (moving averages)
The internal volume of the sample chamber is 4 cm3. The response time due to purging the chamber
volume is: tresp = 4 cm3 / flow rate.
The time (in seconds) between each data point is calculated as follows:
tdata = 0.26+.53 * (spectrum averages)
For Spectrum Average of 8, the time between data points is approximately 4.5 seconds; for Spectrum
Average of 1, the time is 0.79 seconds. The trade off is that a smaller Spectrum Average will provide
less smoothing and slightly more noise in the signal than a larger Spectrum Average will.
The “Get Current Settings” button retrieves and displays the current values of the Spectrum Average and
Moving Average parameters. The “Set” buttons are used to save any changes of these values. These
Page 7
VIASENSOR HS-1000 User Manual
parameters are saved in the VIASENSOR HS-1000 unit and do not need to be reset each time the PC
software is run.
Diagnostic Data may be saved. Enter a file name in the text box, and include the “.txt” extension with the
file name. Click on the “Diag Data” button to save. Note that it may take up to 10 seconds to download
and save this data. See Appendix C for a sample file and descriptions. The saved file is in text format,
and may be imported readily into any analysis program (such as Microsoft Excel).
Analog Output switch: for a VIASENSOR HS-1000 that is equipped with an Analog Output, this switch
will toggle between an output of partial pressure of water vapor in millibars or an output of dew point in
degrees C.
3.3
Serial Communications
See Appendix D for communication parameters and sample data.
3.4
Analog Output
An optional feature that may be included with the VIASENSOR HS-1000 in addition to the serial output is
an analog output. Two standard banana jacks, spaced for a dual connector, would be located on the
front panel of the Control Box. The red jack has the positive leg of the signal. The analog signal is
floating and should not be tied to ground.
The analog output signal is 0 to 5VDC. It is linear between 0.5 and 4.5VDC.
0.5VDC = 0 millibars, partial pressure of water vapor (or 0ºC dew point)
4.5VDC = 1000 millibars, partial pressure of water vapor (or 100ºC dew point)
4.6VDC or greater indicates an error condition in the VIASENSOR HS-1000
Note that the output selection of partial pressure or dew point can be made in the “System Info” tab of the
VIASENSOR HS-1000 monitoring software. Once it is changed, the VIASENSOR HS-1000 will store the
selection until the user changes it again.
4 Frequently Asked Questions (FAQ)
What is the expected lifetime of the laser diode?
The laser used in the sensor is a telecommunications type laser diode that has an expected lifetime of
greater than 20 years.
Does the sensor drift over time?
The sensor is designed to be insensitive to variations in most of its components. The laser wavelength is
scanned continuously across the water absorption line. Drift in the laser, detectors, or sample chamber
are balanced out during each scan. In addition, since none of the sensitive components are in contact
with the gas stream, they will not become damaged by contaminants in the gas. Therefore, the sensor
calibration should be stable for at least several years.
How often does the sensor need to be calibrated?
Even though the sensor calibration should be stable for several years, we recommend for critical
applications that the calibration be verified each year.
What is the accuracy of the sensor?
The uncertainty of the sensor reading is +/- (2% of the reading + 1 mB of partial pressure).
Page 8
VIASENSOR HS-1000 User Manual
What range of gas flow rate can be measured with the sensor?
The sensor reading is not flow rate dependent. The flow can be in either direction. At low flow rates
(less than 0.4 L/min) there will be some increase in the response time of the sensor because of the time
required to move the gas mixture through the sample chamber. At high flow rates (above 15 L/min) the
pressure drop across the sensor may become significant.
How do you measure very high flow rate gas streams?
For very high flow rates it is best to divert only a portion of the gas stream through the sensor. Very little
pressure drop is required to flow gas through the sensor. Therefore, a Pitot tube or slight restriction in
the main gas flow tube is all that is required. Contact your sales representative for advice in specific
applications.
How is data output from the sensor?
The sensor outputs a line of RS-232 serial, tab delimited text after each measurement. The
measurement interval can be chosen by the customer from 0.79 seconds per point with no averaging, to
4.5 seconds per point when averaging 8 scans for each measurement. Any software that can read this
serial data can interface with the sensor.
Can I get an analog (4-20mA current loop) output from the analyzer?
An analog output (0-5VDC) is now available.
What is the maximum dew point range for the sensor?
The standard measurement range is dew point between 30ºC and 100ºC. Dew point ranges up to 120ºC
and beyond are also available. Contact your sales representative for specific applications.
Can this sensor be used for applications other than fuel cells?
Yes, almost any application that requires a humidity measurement with dew point in the range of 30ºC to
100ºC can use this sensor.
What is the response time of the sensor?
The response time depends on two factors, the measurement rate, and the gas flow rate. The slowest of
those rates will determine the response time. The measurement rate is calculated from the spectrum
average and moving average values as follows:
Tresp = (0.26+.53 * (spectrum averages)) * (moving averages)
The internal volume of the sample chamber is 4 cm3. The response time due to purging the chamber
volume is: Tresp = 4 cm3 / flow rate.
How is operating status indicated with analog output?
The analog output can be configured to go to full scale or zero in the event of a status not OK condition.
Or, as another option, a status relay contact can be provided.
Can the instrument measure below 30C dew point?
A special range instrument would have to be configured. Please consult your sales rep with a complete
set of requirements.
How is the gas temperature measured?
An epoxy coated thermistor bead measures the temperature.
Is there a specific orientation for the sensor?
No. The sensor can be placed in any orientation without affecting the accuracy of the reading.
Page 9
VIASENSOR HS-1000 User Manual
Why is the sample chamber heated?
The sample chamber must be hotter than the dew point of the incoming gas or the moisture will
condense into water in the sample chamber. An indicator on the software display will show when the
chamber is less than five degrees above the dew point temperature.
In what units does the sensor read?
The serial output data from the sensor is in partial pressure of water in millibars. However, the display
software will also convert the partial pressure reading into kPa or into dew point in ºC.
Is the sensor reading dependent on gas pressure?
No. The partial pressure reading for water vapor is not dependent on gas pressure. However, if the
partial pressure of water is higher than the gas pressure, then condensation will take place.
Will the sensor respond to entrained water droplets?
No, the sensor can only measure the absorption of individual water molecules, not liquid droplets.
In what background gases can the sensor measure water vapor?
The sensor reading will be accurate in backgrounds of mono or di-atomic molecules (H2, N2, O2, He, Ar,
…) It will also work in typical products of combustion backgrounds (CO, CO2, NOx, SOx, …) Please
consult your sales representative for specific backgrounds.
What are the advantages of the TDLAS sensor over a chilled mirror?
• Fast response
• No need for regular cleaning or maintenance
• Any sensor problem is detected by the software and indicated in the output.
Can the sensor measure lower levels of moisture?
Not at this time. However, the technology can be applied to measure very low levels of moisture. Please
consult your sales representative with your requirements
5 Technical Specifications
•
•
•
•
•
•
•
•
•
•
•
•
•
Measurement Range: 40 mB to 1000 mB water vapor partial pressure (30ºC to 100ºC dew point)
Response time: As quickly as 0.8 seconds for gas flows greater than 0.4 L/min
Accuracy: ±2% of the reading in millibars + 1 millibar, or ±0.5ºC dew point
Max pressure: 30 psig (200 kPa)
Flow rate range: flow rate independent (Note: response time increases below 0.4 L/min)
o (High flow rates (above 15 L/min) may be accommodated using a slipstream/bypass flow
line.)
Ambient temperature range: 10ºC to 30ºC
Max sample cell temperature: 105ºC
Wetted materials: Nickel plated aluminum, sapphire, epoxy
AC power: 90 to 240 VAC, 1.4 A, 50 to 60 Hz
Dimensions and weight:
o Sample cell: 6” x 6” x 2” (15 cm x 15 cm x 5 cm), 1.7 lb (0.8 kg)
o Electronics: 8.75”x10”x3.5” (22.2cm x 25.4cm x 8.9cm), 3.75 lb (1.7 kg)
Cable length: 40” (1 m)
Analog output (0-5VDC), 20 mA maximum
Data logging software requirements (for computer):
o Minimum display resolution: 1024 x 768
o Serial input or Serial/USB adapter
Page 10
VIASENSOR HS-1000 User Manual
6 APPENDIX A: Sample Log File
A sample log file from the VIASENSOR HS-1000 Monitoring Software on the PC:
DewPoint(C)
67.4
67.2
66.9
66.8
67.5
Vapor Pressure(mbar) Temperature(C)
279.1
107.9
277.1
107.8
273.4
108.0
272.6
108.2
281.1
105.1
ErrorCode
0
0
0
0
0
DewPoint(C) is the dew point in ºC of the gas passing through the sample chamber in the VIASENSOR.
It has been calculated from the Vapor Pressure.
Vapor Pressure(mbar) is the vapor pressure (partial pressure) in millibar of the water vapor in the gas
stream passing through the sample chamber in the VIASENSOR.
Temperature(C) is the temperature in ºC of the gas as it passes through the sample chamber in the
VIASENSOR.
ErrorCode is defined in Appendix E. A value of “0” is the normal output when there is no error condition.
Note: This data is saved as a text file and is readily imported into most programs that you may use for
data analysis, such as Microsoft Excel.
7 APPENDIX B: Sample Log File with Diagnostic Info
A sample log file from the VIASENSOR Monitoring Software on the PC:
DewPoint(C) Vapor Pressure(mbar) Temperature(C) ErrorCode Index Transmission
66.4
267.7
102.1
0
262
0.911
66.4
267.7
103.9
0
265
0.912
66.2
264.9
105.1
0
262
0.913
66.1
264.0
105.9
0
263
0.912
66.1
264.1
106.6
0
261
0.913
65.9
261.9
106.7
0
262
0.914
65.9
262.2
106.7
0
261
0.913
Area
17.90
17.79
17.53
17.67
17.54
17.37
17.58
HalfWidth
61.44
61.82
60.95
61.04
61.26
61.41
61.79
L Interp
-0.48
-0.01
0.21
-0.02
0.37
0.45
0.45
R Interp
0.37
-0.35
-0.31
0.11
0.16
0.37
0.13
The information in the columns “Index”, “Transmission”, “Area”, “HalfWidth”, “L Interp”, and “R Interp” are
characteristics of the laser absorption peak. This information may assist in troubleshooting the
VIASENSOR with LANDTEC technical support personnel.
Note: This data is saved as a text file and is readily imported into most programs that you may use for
data analysis, such as Microsoft Excel.
Page 11
VIASENSOR HS-1000 User Manual
8 APPENDIX C: Sample Diagnostic Data download file
A sample diagnostic data download file from the VIASENSOR Monitoring Software:
Hygrometer Diagnostics - 080523
Idx
DC1
DC2
T
0
36821 32495 0.000000
1
21014 17931 0.000000
2
11445 9770 0.000000
3
6237 5345 0.000000
4
3404 2944 0.000000
…
…
…
…
270
26632 29195 0.916244
271
26685 29244 0.916529
272
26743 29293 0.916984
273
26803 29342 0.917507
…
…
…
…
509
38407 38758 0.000000
510
38437 38779 0.000000
511
38476 38805 0.000000
Computational Statistics
dc counts
Line center found at:
263
Minimum Transmission: 0.915
Maximum of -ln(T):
0.089
Sample cell zero level:
53
Reference leg zero level: 137
Calculated values
H20 vapor pressure: 260.59 mbar
Temperature:
107.4 C
Temperature:
107.4 C
EEPROM Settings
Phase:
315
Midpoint: 60
Ramp amplitude: 30
Imod:
0
Analog Output (0=mb,1=DegC): 1
# Spectrum Average: 8
Rcalb: 1500
Xleftvmr: 180
Xrightvmr: 385
SpanFct(x 1000): 1000
PA 1: 0.000E+00
PA 2: 1.000E+00
PA 3: 0.000E+00
PA 4: 0.000E+00
TA 1: 1.000E+00
TA 2: 0.000E+00
TA 3: 0.000E+00
TA 4: 0.000E+00
pr1: 0.000
pr2: 1.000
Thermistor A: 9.4630E-04
Thermistor B: 2.6650E-04
Thermistor C: -5.0700E-08
Page 12
VIASENSOR HS-1000 User Manual
Span (x 100): 2000
Zero Offset:
0 ppmv
Moving Average: 2
The laser scan is divided among 512 channels. Plotting DC1 and DC2 as functions of Idx (Index) will
display the sample spectrum and reference spectrum. lnT is the negative natural logarithm of the laser
transmission at each channel.
Only “# Spectrum Average” and “Moving Average” may be user set within the software program running
on the PC. The balance of these parameters is settable only at the factory or by an authorized service
representative. This information may assist in troubleshooting the VIASENSOR with LANDTEC technical
support personnel.
Note: This data is saved as a text file and is readily imported into most programs that you may use for
data analysis, such as Microsoft Excel.
9 APPENDIX D: Sample Serial Output Data
Sample serial output data direct from the RS-232 Serial Port on the VIASENSOR Control Box:
Vapor
Pressure
(millibar)
688.24
677.25
676.76
598.92
271.19
56.57
Chamber
Gas Temp
(ºC)
89.1
89.0
88.8
88.5
88.3
88.3
Error
Code
0
0
0
0
0
0
Peak Trans- Peak
Index mission Area
252
0.721 89.07
251
0.721 88.77
252
0.721 88.42
251
0.735 74.04
252
0.914 10.99
252
0.954
4.74
Peak
Half
Width
86.64
86.26
86.03
76.64
38.76
31.77
L
Interp
-0.03
-0.26
0.11
-0.39
0.49
-0.10
R
Interp
0.32
-0.23
-0.05
-0.32
0.03
-0.37
Dew
Point
(ºC)
89.4
89.0
89.0
85.8
66.7
35.0
Your communications software should be set for 9600 baud, 8-N-1.
Note: The column headings are added for clarification in this appendix and do not appear in the serial
output of the VIASENSOR.
The Error Codes are defined in Appendix E. A value of “0” is the normal output when there is no error
condition.
The information in the columns “Index”, “Transmission”, “Area”, “HalfWidth”, “L Interp”, and “R Interp” are
characteristics of the laser absorption peak. This information may assist in troubleshooting the
VIASENSOR with LANDTEC technical support personnel.
10 APPENDIX E: Error Codes
Error Code
00
01
02
04
08
Description
Status Okay
Sample power fail
Reference power fail
Spectrum fail
Null fail
Page 13
VIASENSOR HS-1000 User Manual
These errors may appear on the computer display during the first 15 seconds after the VIASENSOR is
powered up. Once the VIASENSOR completes its internal self-test, the errors should clear.
Should any of these errors appear during normal use of the VIASENSOR, power the unit off, wait 5
seconds, and power the unit back on. If this does not clear the error condition, please contact the factory
or your authorized service representative.
11 APPENDIX F: Sample Main Screen Display (Partial Pressure)
Page 14