1
Stats toGo
Stats to Go
A guide to statistics for
hospitality, leisure and tourism
John Buglear
~~ ~~o~1~;n~~~up
LONDON AND NEW YORK
First published by Butterworth-Heinemann
This edition published 2011 by Routledge
2 Park Square , Milton Park , Abingdon , Oxon OX14 4RN
711 Third Avenue, New York, NY 10017, USA
Routledge is an imprint of the Taylor & Francis Group, an informa business
First published 2000
©John Buglear 2000
All rights reserved. No part of this publication may be reproduced in
any material form (including photocopying or storing in any medium by
electronic means and whether or not transiently or incidentally to some
other use of this publication) without the written permission of the
copyright holder except in accordance with the provisions of the Copyright,
Designs and Patents Act 1988 or under the terms of a licence issued by the
Copyright licensing Agency Ltd, 90 Tottenham Court Road, London,
England WlP OLP. Applications for the copyright holder's written
permission to reproduce any part of this publication should
be addressed to the publishers
British Library Cataloguing in Publication Data
Buglear, John
Stats to go
1 Tourist trade - Statistical methods
2 Hospitality
industry - Statistical methods
I Title
338.4'7910015195
ISBN 0 7506 4556 3
Transferred to digital printing 2005
Composition by Genesis Typesetting, Rochester, Kent
ntents
Preface
vii
Acknowledgements
viii
1 Starting out
1.1 Numbers in the hospitality and tourism industries
1.2 How this book is organized
1.3 Taki.n_g the first steps
1.4 Technological support
Review questions
2 Presenting data
2.1 Types of data
2.2 Displaying qualitative data
2.3 Displaying quantitative data
Review questions
3 Summarizing univariate data
3.1 Measures of location
3.2 Measures of spread
Review questions
4 Summarizing bivariate data
4.1 Correlation and regression
4.2 Summarizing data collected over time
Review questions
5 Assessing risk
5.1 Measuring probability
5.2 Different types of probabilities
5.3 The rules of probability
5.4 Tree diagrams
Review questions
1
2
4
5
16
19
22
23
25
34
50
53
54
68
81
84
85
101
111
120
122
125
128
136
138
*'
Contents
·--···--·-
6
Putting probability to work
6.1 Simple probability distributions
6.2 Binomial distributions
6.3 Poisson distributions
6.4 Expectation
6.5 Decision trees
Review questions
7 Simulating populations
7.1 Normal distributions
7.2 The Standard Normal Distribution
7.3 Sampling distributions
7.4 t distributions
Review questions
8 Statistical decision making
8.1 Estimation
8.2 Hy-pothesis testing
Review questions
9
Statistical decision making using bivariate data
9.1 Contingency tests
9.2 Testing and estimating using quantitative
bivariate data
Review questions
10 Managing statistical research
10.1 Secondary data
10.2 Primary data
10.3 Presenting your analysis
141
142
147
153
156
158
161
165
166
174
187
190
193
197
198
211
224
226
227
236
250
254
256
258
268
273
Appendix Solutions to selected review questions
Index
277
Preface
This book is intended to equip students and others interested in
the hospitality and tourism industries with an understanding
'of Statistics. As the sub-title implies, this is a guide to using
Statistics rather than a specialist Statistics textbook. The book
provides an accessible insight into the use of a variety of
statistical techniques. These techniques are discussed and demonstrated using worked examples set in hospitality and tourism
contexts.
The book aims to encourage readers to use computer software
to carry out statistical work. It provides guidance on the use of
MINITAB* and the statistical aspects of Excel. As a consequence
the use of statistical tables has been kept to a minimum.
Solutions to review questions are included. These are intended
to help students monitor their own progress and make the book
an effective basis for independent learning.
•MINITAB is a registered trademark of Minitab Inc., 3081 Enterprise Drive, State
College, PA 16801, USA. http:/www.minitab.com
ckn
ledgements
The author would like to thank Allison for her creative ideas and
critical evaluation, Max and Tom for their forbearance, and his
colleague Jan Lincoln for her assistance.
C H A P T E R
1
t rting out
• To understand why the ability to deal with numbers
is important.
• To see how this book can help you develop that
ability.
• To prepare effectively to study Statistics.
In this chapter you will find:
• A discussion of the importance of numbers to
hospitality and tourism businesses.
• A description of the approach and style used in
this book.
• An introduction to key words.
• Guidance on basic numerical skills you will need to
use.
• Advice on technological support.
Stats to Go
1.1 Numbers In the hospitality and tourism industries
This book is about analysing numbers. But why should analysing
numbers matter to someone studying hospitality or tourism?
How relevant can it be for someone planning to build a career in
hospitality or tourism?
To understand this, and to appreciate why the study of
numbers is built into your course, consider how the hospitality
and tourism sector has changed in the course of a generation. The
set of organizations that operate in the sector and the products
they offer have changed dramatically.
H you look at films or read novels that reflect the lives people
led twenty or thirty years ago, you will notice the changes.
Almost all licensed premises were male-oriented places that
provided a fairly narrow range of beverages and no hot food.
At work people ate food chosen from a limited range of
traditional fare in a workplace canteen. Fish and chips was the
staple fast food and dining out was an infrequent pleasure for
most people. For those who did dine out, the limits of exotic
eating amounted to Chinese or Indian restaurants. Holidays
were taken once a year, largely within the UK. Often families
would return to the same resort, sometimes the very same place
to stay, year after year. The fun-lovers could go to holiday
camps, the very adventurous impressed their neighbours by
going to Spain. Apart from the journeys of travelling salesmen,
business travel hardly existed. People who made it to retirement age lived on modest pensions and travelled little, except
to see relatives. For children there were beaches, parks and
funfairs.
How strange all that seems, how very different things are
today. We have a wide variety of licensed premises where
managers and owners try to create an ambience and offer food
and beverages to appeal to target market segments. The
workplace canteen with its own kitchens has all but disappeared, instead contractors deliver a wide range of sand- ·
wiches and cook-chill food to work-based outlets. The phrase
'fast food', unknown a generation ago has become very big
business, compared to which the traditional fish and chip shop
seems like a cottage industry. The centre of even a modest-sized
town provides a cosmopolitan selection of restaurants. The
cuisine of Thailand, Mexico, Italy, the USA and Japan is usually
only a short distance away. The popularity of food from exotic
places of course reflects the transformation in the holiday
market. A long-haul holiday is likely to be one of several
holidays taken during a year. A shopping weekend in New
York is no longer purely a bizarre indulgence of the super-rich.
Business travel has become a major market with specialist
operators. Retired people are often the most avid travellers,
transforming the off-season business for many resorts. As far as
Starting out
children are concerned, the emergence of the theme park and
the all-weather activity centre means that holiday decisions for
many families are more overtly child-driven.
These are fundament;ll and far-reaching changes. Experts may
disagree about the factors that have caused them, but as a result
of them the business environment faced by hospitality and
tourism organizations has altered profoundly, and will almost
certainly continue to do so.
A further source of uncertainty for the hospitality and tourism
sector is the fact that its products are typically considered luxury
goods and services that are purchased from discretionary income.
Demand for them is therefore highly sensitive to consumer
confidence and taste. A family facing the loss of an income may
well halve its consumption of clothing but is likely to abandon
the idea of going on holiday completely.
How do organizations cope with this degree of change? The
answer, in some cases, is that they don't. Many of the companies
that dominated the sector a generation ago no longer exist. They
became history because they failed to respond to the changing
market. Others survived and some small operations thrived,
becoming market-leaders within the lifetimes of their founders.
Although luck and the good fortune of happening to be in the
right market place with the right product may have played a part,
to succeed in a changing environment an organization needs to
recognize the changes and anticipate the consequences for its
operations. How can it do that? By constantly studying its "
markets and monitoring its operations. This means counting and
measuring key factors, in other words gathering numerical facts,
or statistics.
In every organization there is a flow of numbers which are
either deliberately collected or arise from the regular interactions
with customers, suppliers and other significant organizations.
These figures in themselves cannot tell the organization what is
going on in the market or how it is performing. One of the
responsibilities of management is to ensure that such figures are
used, which means they have to be processed and analysed. The
patterns that emerge from this analysis provide information that
enables managers to understand the situation they face and base
their decisions on that understanding.
The ability to analyse figures and interpret the results is
therefore considered a key management skill. Look at recruitment advertisements for management posts and you will see that oeJ
employers attach great importance to 'numerical skills' and
'problem-solving'.
If you want to build a successful management career these are
skills that you have to acquire sooner or later. Your course will
provide you with the opportunity of developing them. Make the
most of that opportunity and you will have a cutting-edge skill
that will pay dividends for you in the future.
Stats to Go
1.2 How this book is organized
This book will help you deal with the numerical parts of your
course. How you use it depends on how you approach the study
of numbers you are about to start. It can be a crutch to help you
limp through what may seem like an unwelcome revisit to the
sums of schooldays, or it can be a springboard that will help
you accumulate a key investment for your future - the skill of
numeracy.
This book may influence your attitude to studying numbers,
but it cannot decide it. The attitude you take is something for you
to develop, but whether this book is to be a crutch or a
springboard for you, it is intended to be a guide which will
provide support for the numerical work you will undertake
throughout your course.
The first five chapters of the book (including this one) deal
with topics that you are likely to meet during the first stage of
your course. They deal largely with descriptive techniques, that is
methods that will enable you to arrange or analyse data in a way
that helps describe the situation being studied.
Chapters 6-9 cover topics that you may meet at a later stage of
your course. They deal with inferential techniques, that is
methods that enable you to make inferences or draw conclusions
about an issue in general based on the study of a comparatively
modest amount of data.
The final chapter is designed to help you tackle numerical
aspects of the final-year project or dissertation you will probably
be asked to write.
The book will introduce you to a variety of analytical
techniques that together constitute a 'tool-kit' of methods that can
be used to investigate situations and help solve problems. Like
any other tool-kit, the key to using it properly is to know not only
what each tool does, but to know how and when to use it. The
book will help you develop this ability by illustrating the
application of the methods described using contexts taken from
the hospitality and tourism sectors.
Each technique will be explained and demonstrated. Any
calculations will be explained in words before symbols are used
to represent the process.
Being able to apply a technique, to produce the correct result
from a calculation, is important, especially if you find 'learning
by doing' useful, but it is by no means the end of the story. It is
even more important to be able to interpret the results that the
technique has enabled you to produce and to communicate the
meaning of those results. In your future career you may be asked
to apply techniques of analysis but you are much more likely to
need to be able to explain results, perhaps to judge whether
appropriate techniques have been used to produce them. The
book therefore provides you with not only a description of each
Starting out
technique and an illustration of its use, but also a discussion of
the types of results you could get, and what each of them would
mean.
At the end of Chapters 1-9 there are a set of review questions
that you can use to confirm your understanding of the methods
and ideas featured in each chapter. You can find answers to these
questions at the back of the book.
1.3 Taking the first steps
There are two key preliminary tasks that are worth investing a
, little time and effort on getting to grips with from the very
beginning. The first is to understand a few key words which may
be completely new to you, or whose meanings in the context of
this subject are unfamiliar to you. The second is to review a set of
basic arithmetical operations, which are involved in the use of
some of the methods demonstrated further on in the book. Being
clear about these basics from the start will mean you avoid
unnecessary confusion later on.
You will find that the terms explained below are used many
times in this book. They are the first words in a technical
vocabulary that will become familiar to you as you proceed. As
you will find with other subjects you study or interests that you
have outside college, there are specialist words and phrases to
comprehend, but once you have grasped their meaning you will
get used to using them as a matter of course.
1.3. 1 The key words you need to know
• Data A plural noun (the singular form is datum) which means
a set of known or given things, facts. Note that data can be
numerical (e.g. age of people) or non-numerical (e.g. gender of
people).
• statistics Without a capital letter, i.e. in its lower case form, this
means a set of numerical data or figures that have been
collected systematically.
• Statistics With a capital letter this is a proper noun that means
the study of statistics, the set of methods and theories that can
be used to arrange, analyse and interpret numerical data.
• A variable A quantity that varies, the opposite of a constant.
<>i:i
For example the number of rooms sold in a hotel is a variable, e
whereas the number of hours in a day is a constant. In the ~
expressions that we will use to summarize methods a capital
letter, usually X or Y, will be used to represent a variable.
• Value A specific amount that it is possible for a variable to be.
For example the number of rooms sold in a 100-bedroom hotel
Stats to Go
could be 53 or 68 or 93. These are all possible values of the
variable 'number of rooms sold'.
e Observation or observed value A value of a variable that has
actually occurred, i.e. been counted or measured. For example
if hotel staff sell 75 rooms for a particular night that is an
observation or observed value of the variable 'number of
rooms sold'.
An observation is represented by the lower case of the letter
used to represent the variable; for instance 'x' represents a
single observed value of the variable 'X'. A small numerical
suffix is added to distinguish particular observations in a set; x1
would represent the first observed value, x2 the second and so
on.
e Random Tills adjective refers to something that occurs in an
unplanned way. A random variable is a variable whose
observed values arise by chance. The sales of bottled beer in a
pub are a variable which is random, whereas the number of
days in a month is a variable which is not random, i.e. its
observed values are pre-determined.
e Distribution The pattern exhibited by the observed values of a
variable when they are arranged in order of magnitude. A
theoretical distribution is one that has been deduced, rather
than compiled from observed values.
e Population Generally this means the total number of persons
residing in a defined area at a given time. In Statistics a
population is the complete set of things we want to investigate.
'These may be human such as all the people who have visited
a theme park, or inanimate such as the flights made by an
aircraft.
• Sample A subset of the population, that is a smaller number of
items picked from the population. A random sample is a sample
whose components have been chosen in a random way, that is
on the basis that any single item in the population has no more
or less chance than any otl1er to be included in the sample.
1.3.2 The basic numerical skills you need
Addition and subtraction "' *
w
Addition, represented by the plus sign '+', is the process of
putting two or more numbers together to make a sum or total. As
long as the numbers being added together are positive, i.e. more
than zero, the resulting total grows as more numbers are
added.
Starting out
A member of staff at a 'drive-through' conducts four operations in the course of serving
a customer. If these tasks take 101 12, 7 and 8 seconds, what is the total time that will
elapse between the time a customer arrives at the order point and the time they can
depart from the service point?
You can get the answer by adding together the times taken for the four operations.
Total time == 10 + 12 + 7 + 8 = 37 seconds
Because Statistics often involves combining observations, the
arithmetical process of addition is a process you will come across
in the context of several techniques dealt with later in the
book
Although you are probably already familiar with addition, you
may not have encountered the symbol called 'sigma', which is
used in Statistics to represent it. Sigma is the capital letter S from
the Greek alphabet, written as 'I'. It is the letter s because s is the
first letter of the word 'sum'. It is a Greek letter because at the
time that much of the theory that makes up the subject of
Statistics as we know it today was developed, the so-called
'classical' languages of the ancient world were taught in the
schools and universities. The Greek language, with its particular
alphabet, therefore provided the pioneers of Statistics, and
other fledgling disciplines, with a ready source of di'Jtinctive
symbols.
The symbol I (sigma) stands for 'the sum of' when it is used in
Stati'ltical expressions, for example:
I
means 'the sum of a set of observed values of the
x variable X'
Sometimes it is necessary to specify precisely which observed
values of X are to be added together. To show this, the letter 'i' is
used to count the observations, for example:
;,
i=1
means 'the sum of the first to the fourth
observations of the variable X'
The expression 'i =1' below the sigma tells us to start the addition
with the first observed value of x and the '4' above the sigma sign
tells us to finish the addition with the fourth observed value.
Stats to Go
In the situation described in Example 1. 1, we could show that the total time taken to serve
a customer in the drive-through facility (which we could represent by 'T') is the sum of
the time taken to perform four tasks by using the expression:
T ==
4
It
i=1
= t1 + t 2 + t 3 + t4
= 10 + 12 + 7 + 8 = 37
If it is necessary to indicate that all of a set of observations should
be added together and the exact number of observations is not
known, we use the letter 'n' to represent the last observation in
the set, so:
i~
i=l
means 'the sum of the first to the last
observations of the variable X'
As you proceed with your study of the subject, you will find that
the letter 'n' is used throughout Statistics to represent the number
of observations in a set.
At first these types of symbol may appear strange to you, but
it is worth learning to recognize and use them, they can become
very useful shorthand forms which will save you space and time
in future work.
Subtraction, represented by the minus sign '-', i..:; the process of
subtracting or 'taking away' one or more numbers from another.
As long as the numbers being subtracted are positive, i.e. more
than zero, the result reduces as more numbers are subtracted.
TI1e gross weekly pay of a tour guide is £200. If her stoppages are £28 tax, £9 National
Insurance, and £52 accommodation charge, what is her weekly take-home pay?
You can get the answer by subtracting the stoppages from the gross wage.
Take-home pay
= £200 -
£28 - £9 - £52 == £111
Starting out
An alternative approach to this operation is to add the stoppages
first and then subtract the total stoppages from the gross pay.
This would be represented in the following way:
Take home pay
= £200 - (£28 + £9 + £52)
= £111
The round brackets dictate that the operation shown within them
must be carried out first. They are used to indicate priority.
You may well find addition and subtraction fairly easy, but
there are cases where they are not so straightforward; first, when
negative numbers are involved, and second when the operation
involves numbers measured in awkward units, e.g. minutes and
hours.
Addition and subtraction may give you some difficulty if
negative numbers are involved. If a negative number is added to
a total, it reduces the total.
A customer's hotel bill consists of the following items: a room charge of £60, £25 for an
evening meal, £8 for Minibar items, and a £10 discount for using a promotional voucher.
What is the total amount that should be on the bill?
The answer can be shown as:
Total amount == £60 + £25 + £8 + (--£10) = £83
You can see that round brackets have been used, both to
highlight the fact that there is a negative number in the
sequence and to indicate that it must be dealt with first. This
means deciding how to tackle the apparently contradictory '+ ·-'
sequence of symbols. In fact the minus sign overrides the plus
sign, so adding a number is therefore the same as subtracting a
number. The arithmetical expression used to find the total
amount in Example 1.4 has exactly the same result as the
following expression, which combines addition and
subtraction:
Total amount = £60 + £25 + £8 - £10 = £83
But what do you do if you have to subtract a negative number?
In fact subtracting a negative number produces the same result as
adding a positive number.
Stats to Go
-------------··-···---··-------------
The sharp-eyed Front Office Manager in the hotel mentioned in Example 1.4 spots
that the voucher is out of date. What effect will this have on the total amount of the
bill?
111ey would have to take away the reduction from the previous total, so now:
Total amount
= £83 -
(-£10) = £93
You get exactly the same result if you simply add the amount
concerned, £10.
You may find it helpful to imagine the two minus signs
'cancelling each other out' to leave you with an addition.
Alternatively it may help to think that taking away a negative is
always positive.
Addition and subtraction involving time is something many
people find difficult because time is measured in hours made up
of 60 minutes, and minutes made up of 60 seconds, rather than
nice, neat numerical parcels of ten. The use of the 24-hour dock
on top of all this seems to phase most people completely.
A business traveller drives for 12 minutes to reach her local railway station where she
boards a train that takes 33 minutes to reach its London terminus. It takes her 24 minutes
by tube to reach another London terminus, where she boards another train. After a
journey that takes 1 hour 5 minutes to reaches her station, from where she takes a
10-minute taxi ride to her destination. What is the total journey time?
1b get the answer we can express all the times mentioned, including the figure for the
second train journey, in minutes.
Total journey time = 12 + 33 + 24 + 65 + 10
==
144
The answer may not be satisfactory in this form. To convert it into
hours and minutes we need to find how many units of 60
minutes there are in 144 minutes. The answer is 2, so the total
journey time is 2 hours (120 of the total number of minutes) and
24 minutes (the number of minutes left over when 120 is
subtracted from 144).
Starting out
If the traveller described in Example 1.6 begins her journey at 11 am in the morning, what
time will she arrive at her destination, and how would this time be expressed using the
24-hour dock?
To get the answer, work in hours fust, then minutes.
Arrival time
= 11 + 2 hours = 1pm
+ 24 minutes = 1.24pm
To express this using the 24-hour clock, add 12 to the number of hours, because the arrival
time is after midday.
Arrival time
= 1.24 + 12
== 13.24
But what if the traveller started her journey later than expected,
at 11.45 what time would she arrive? This is a little more
complicated because the departure time and total journey time
are measured in both hours and minutes. To find the answer we
can start by adding the hours:
1
11 + 2 = 13
then add the minutes together:
45 + 24 ::::: 69
Sjnce this amount of minutes is longer than an hour, we have to
express it in hour and minutes, and add the result to the sum of
the hours:
69 minutes == 1 hour and 9 minutes
13 + 1 = 14 hours
+ 9 minutes
Multiplication and division *
w
= 14.09, or 2.09 pm
*
Multiplication, or 'times-ing', represented either by the 'times'
sign 'x' or the asterisk *', is the process of multiplying two or
more numbers together to make a product. If the number is
multiplied by a number greater than one, the resulting product
will be greater than the original number.
1
Stats to Go
A holidaymaker wishes to convert £240 into US dollars. If the rate advertised at the
bureau de change is $1.60 to the pound, how many dollars will his pounds buy?
You can get the answer by multiplying the total number of pounds by the exchange rate.
Dollars he can buy
= £240 x 1.60
= $384
In this case the number of dollars is greater than the number of
pounds, the product represents a numerical increase. But if you
multiply a number by another number that is less than one, you
will get a product that is lower than your first number.
Abusiness traveller returning from Oslo has 3200 Norwegian krone that she wishes to
change into pounds. If the rate available at a bureau de change is £0.08 per krone, how
many pounds will she get for her krone?
To get the answer, multiply the total number of krone by the exchange rate.
Pounds she can buy = Kr3200 x 0.08
= £256
If you have to multiply a positive number by a negative number,
the product will be negative. However if you multiply two
negative number together, the product will be positive:
3
X
(-2) :::: -6
but
(-3)
X
(-2) = 6
Division, or finding how many times one amount 'goes into'
another, is the process of dividing one number by another. It is
represented either by the forward slash 'I' or the sign '+'. If you
divide a number by another number that is greater than one, the
result will be smaller than the original number.
The 48 guests attending a function are to be offered a glass of wine on arrival. If the
contents of one bottle of wine will fill three and a half glasses, how many bottles will be
required?
We can obtain the answer by dividing the number of guests by the number of glassfuls
per bottle.
Number of bottles = 48/3.5 == 13.714
(to 3 decimal places)
Starting out
Something to note in Exarnple 1.10 is that although we can get a
very precise result, in this case specified to three places of
numbers after the decimal point, in the situation described the
figure would be rounded up to the nearest whole number, 14.
If you divide a munber by another number that is less than
one, the result will be larger than the original number.
A visitor to Britain sees a sign saying 'Airport 7 miles'. She asks you how far that is in
kilometres.
A kilometre"is equivalent to 0.62 of a mile (to 2 decimal places), so to reply to her question
you need to find how many times 0.62 will 'go' into 7, that is you must divide 7 by
0.62.
Kilometres to the airport = 7/0.62 = 11.29
Squaring and square rooting
(to 2 decimal places)
*
Squaring, or taking the square of a number is the process of
multiplying a number by itself. The process is represented by the
number with a superscript showing the number two, for example
the square of three, or three squared would be written 32 which
tells us to multiply three by three.
If the number you want to square is more than one, the result
will be larger than the number itself, for instance the square of
three is nine. However if the number you want to square is less
than one, the result will be smaller than the number itself, for
example the square of a half is a quarter.
The floor covering of the dance space in a live music venue has to be replaced. If the
dance floor is 4.2 metres long by 4.2 metres wide, how much new floor covering will be
needed?
To find an area multiply the length by the width. In this case because the area is a square,
that is the length and width are the same, we need only take the square of 4.2.
Floor area = 4.22 = 17.64 square metres
Stats to Go
Squaring a positive number will always give you a positive
result. But because multiplying one negative number by another
always gives you a positive product, squaring a negative number
will always give you a positive result as well.
The fact that we always get a positive result when we square a
negative number is worth remembering because it plays a vital
role in several statistical techniques that you will meet.
Square rooting, or taking the square root of a number is the
process of working out what number squared would produce a
particular number. It is represented by the :radical or 'tick' sign,
so the square root of 9 would be shown as V9. The result of
V9 is 3 because the number 3 multiplied by itself gives you 9.
y,
A new ornamental garden featuring a square lawn area is to be laid out at a conference
centre. If there are 160 square metres of turf available, what will the dimensions of the
lawn be?
You can find the answer by taking the square root of 160:
Lawn area = V160 = 12.65
(to 2 decimal places)
The lawn would be 12.65 metres long by 12.65 metres wide.
Fractions, proportions and percentages * * *
Fractions, proportions and percentages sound very different, but
they are only different ways of doing the same thing; expressing a
part of something in relation to the whole. If, for example, water
constitutes 100 g of 500 g of ham, this could be explained as either:
water constitutes one-fifth of the weight of this product
Or water constitutes 0.2 of the weight of this product
Or water constitutes 20 per cent of the weight of this product
One-fifth is the fraction, 0.2 is the proportion, and 20 per cent is
the percentage. They are different ways of saying the same thing
because there are five-fifths in one, five lots of 0.2 in one, and five
lots of 20 per cent in 100 per cent. You should bear in mind that
each of them is a number less than one, including the percentage,
which doesn't look as if it is less than one.
Starting out
·--------------------------------------·-~----
It is easier to use percentages if you understand that the litera]
meaning of 'per cent' is per hundred. (The word 'cent' originally
meant one hundred; a Roman centurion was an officer in the
Roman army in charge of one hundred men.) This will especially
help when you have to perform arithmetical operations using
percentages.
The proprietor of a souvenir shop located in the old part of a famous European city makes
a deal with a tour guide. In return for the tour guide escorting parties of tourists to the
shop the proprietor wiU give the tour guide 40 per cent of the profit the shop makes from
the money the tourists spend. If the profit margin on the souvenirs is 60 per cent and the
first group of tourists spends £735, how much money will the tour guide get?
The shop receives a profit of 60 per cent of £735, and the tour guide should receive 40 per
cent of the 60 per cent of £735, so:
Guide's share == 40/100 x 60/100 x £735 ::::: £176.40
Notice that in Example 1.14 the percentages appear in the
expression as amounts per hundred.
Rounding and approximation "' "' *
You may find it easy to manipulate figures in your head, or you
may find such a skill impossible and marvel at those who possess
it. The truth is that anyone can learn how to carry out mental
arithmetic, the tricks are to round the numbers involved so that
they are easier to deal with, and to use approximation to get a
ballpark result which can be refined with a little more effort.
People who find it easy to work out numerical problems in
their head often use rounding and approximation intuitively, that
is without thinking about it. In fact you may already round
certain numbers as a matter of course. If someone asks how old
you are, you would say '18' or '21' as appropriate, you wouldn't
say '18 years, 3 months and 10 days' or '21.63 years'. Automatically you round down to the nearest completed year of your age.
If you want to check how much money you have you probably
look at the notes and pound coins in your purse or pocket and
make an approximation. Only if you are particularly concerned
about how much there is, or have time on your hands, are you
likely to cotmt every penny.
Rounding and approximation are therefore not entirely new
concepts to you. If you can apply them systematically in your
numerical work you will develop a skill which will give you a
better 'feel' for numbers, enable you to spot mistakes and think
numerically 'on your feet'.
Stats to Go
You walk into a fast food restaurant which is so empty that there is a member of staff
waiting to take your order. You know what you want but you don't know how much it
will cost. As you give your order your eyes take in the prices of the items you want: one
burger £1.49, another burger £1.69, one portion of fries 89p, one cold drink 79p, one hot
d!·ink 59p. You want to work out roughly how much it will be so you can decide whether
to count up your change or get out a note.
If you want a really quick answer, round up each item to the nearest po'Qnd.
Approximate total cost
= £2 + £2 + £1
+ £1 + £1 = £7
Because we have rounded every figure up, this result will be an overestimate, so we can
be certain that the total cost will be no more than this, but it is a rather crude estimate. You
could get a more accurate approximation if you rounded each figure to the nearest ten
pence.
Approximate total cost = £1.50 + £1.70 + £0.90 + £0.80 + £0.60 = £5.50
Each of the five figures used here is rounded up by one penny, so
you can get the exact total by taking five pence away from £5.50,
which comes to £5.45.
1.4 Technological support
Although the subject of Statistics is about numbers, the amount
of time you will spend actually performing calculations during
your study of the subject can be minimJzed by using readily
available technology, specifically a suitable calculator and appropriate computer software.
If you do not already have a calculator you really need to get
one. It is an essential tool for the numerical aspects of your
course, and probably some of the not so numerical parts of it as
well. To be of use to you in statistical work the calculator you
have must have a square root function, and it really is worth
spending a little more money to get one with statistical functions.
Sometimes such calculators are described as having a 'statistical
mode' or an 'SD' (standard deviation) mode. Whatever it is called
by the manufacturer, if you have a calculator that can perform
statistical operations it will assist you immensely.
When you have your calculator the first thing that you should
do is to make sure you don't lose the instructions. Your calculator
is a sophisticated scientific instrument that can do much more for
you than you might imagine, but you can only find out how if
you have the instructions. As a safeguard it is a good idea to keep
a photocopy of them in a safe place.
Starting out
You will most likely have access to a computer, perhaps at
home but almost certainly at your place of study. Because today
computers are used so widely to send messages and to access
internet facilities, it is easy to forget that computers were
originally developed as machines to process data.
The computers we have today still possess that capability. With
the right software the machine you use should become an
invaluable aid to you in carrying out statistical work. It will do
most of the laborious calculations for you, leaving you free to
concentrate on learning how to understand and interpret the
results.
This reflects how you are likely to be involved in using
Statistics later in your career; it is your perception and interpretation of results that will be important, rather than whether
you can compete with a computer to do the calculations. Of
course it is important to be able to understand how the computer
has arrived at the results, but let the machine do the hard work
for you.
So, what is the right software? There are two types of software
that can help you with statistical tasks: statistical packages and
spreadsheet packages.
Statistical packages such as MINITAB (which has been used to
produce the diagrams and results for this book), Splus, and SPSS
offer a full range of statistical functions and can carry out just
about all of the techniques you are likely to meet during your
studies. The authors of packages of this type are usually qualified
in Statistics.
Spreadsheet packages such as Excel are intended primarily for
accounting work and offer a more limited range of statistical
functions, but nonetheless can perform the majority of methods
you will probably need to use.
Although these two types of package offer different ranges of
functions and different styles of output, they have become
increasingly similar in some respects. The data storage layouts in
statistical packages have become more like spreadsheets; numbers are usually stored in the rows and columns of a 'spreadsheet' in Excel, and in the rows and columns of a 'worksheet' in
MINITAB. The statistical output generated by spreadsheet
packages looks more like that produced using a statistical
package.
Stats to Go
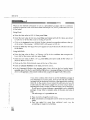
What are the relevant commands to use in a spreadsheet package and/ or a statistical
package to store the costs of the items listed in Example 1.15, and to produce the total cost
of the order?
Using Excel:
• Enter the first value in Cell A1 then press Enter.
• Enter the next value in Cell A2, press Enter, and repeat until all the values are stored
in Cells A1 to A5 and the cursor is resting in Cell A6.
• Click on the Autosum button (labelled l) that is located amongst the toolbars at the top
of the screen. The message '=SUM(A1:A5)' will appear in Cell A6.
• Press the Enter key. The figure that now appears in Cell A6 should be 5.45, the total cost
of the items.
Using MINITAB:
• Enter the first value in Row 1 of Column 1 (C1) of the worksheet that occupies the
lower half of the screen, and then press Enter.
• Enter the next value in Row 2 of C1, press Enter, and repeat until all the values are
stored in Rows 1 to 5 of C1.
• Click on the Calc (Calculations) menu at the top of the screen.
• Click on Column Statistics in the Calc pull-down menu.
• In the Command Window that appears select Sum, click on the box beside Input
variable, type C1 in the box and click the OK button. A message telling you that the
of C1 is 5.45 appears in the session window that occupies the upper half of the
If you have a choice, learn how to use the statistical package at
your disposal. If you have time, learn to use both the statistical
package and the statistical functions of the spreadsheet package.
After all, in the course of your career the software you use will
evolve and you will need to adapt to it, so why not get used to
learning how to use a variety of software while you are studying?
If you have to choose between a spreadsheet and a statistical
package, it may help to consider some of the pros and cons of
each.
The advantages of a spreadsheet are:
• They are fairly straightforward to use.
• Basic calculations and diagrams can be produced quickly and
easily.
• They are useful for more than statistical work, e.g. for
accounting or manpower planning.
Starting out
The disadvantages of a spreadsheet are:
e They can perform only a limited range of statistical tasks.
• The control you have over the composition of some output,
particularly diagrams, is limited and tricky to manage.
The advantages of a dedicated statistical package are:
• They can carry out a comprehensive range of statistical
operations.
• The methods they use and the output they produce are
statistically meticulous.
The disadvantages of a dedicated statistical package are:
• They can be more difficult to learn to use.
• Transferring output into other software may be elaborate.
Because computer software is continually being upgraded and
improved the disadvantages are being reduced and the advantages extended so check the latest available versions before
making your decision.
Whatever package you use for your statistical work, don't
expect to know how to use all its functions straight away. It is
worth investing some time in learning how to get the best out of
the software you use.
Any package should have a help facility, use it to search for
advice. It is really an on-line user manual available at your
fingertips! You will find that what you regard as awesome when
you begin will very soon become familiar.
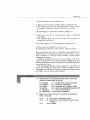
Select which of the definitions listed below on the right
match the words listed on the left:
(a)
(b)
(c)
(d)
(e)
(f)
1.2
statistics
Statistics
random
sample
population
observation
(i) something that occurs by chance
(ii) a subset of a population
{iii) a complete set of things to study
(iv) a value of a variable that has occurred
(v) a set of numerical data
(vi) the study of statistics
Match each of the symbols on the left to the definitions
listed on the right
(a) X
(b) I
(c)
x
(i) the number of observed values
(ii) the third in a set of observed values of the
variable X
(iii} a variable
Stats to Go
(d) n
(e) x3
(iv) a single observed value of the variable X
(v) the sum of
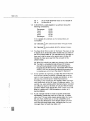
1.3 A till-roll from a cash register in a cafe-bar shows the
following transactions:
Beverages
Food
Food
Food
Beverages
£4.85
£2.65
£8.54
£7.20
£2.36
If the variable X is defined as the money taken per
transaction:
(a) Calculate
(b) Calculate
n
Ix, the total
1=1
amount taken through the till.
4
Ix, and explain what the answer means.
1=2
1.4 You have to fly from London to Tashkent. The plane is due
to depart at 21.30 and the airline insists that you check in
two hours before take off. You estimate that it will take an
hour and a half to drive to the airport and a further 20
minutes to make your way from the car park to the
check-in desk.
(a) What time should you start your journey to the airport?
(b) The flight is scheduled to take 6 hours 45 minutes.
Going through passport control and collecting your
baggage should take an hour. If local time is five hours
ahead of UK time, by what time should the person who
is meeting you aim to be at the airport in Tashkent?
1.5 A tour operator is organizing a coach trip around Bavaria.
She has two vehicles available in Munich that could be
used. In most respects the vehicles are identical, so she
will use the one that has the better fuel economy.
According to the records the first vehicle, which has been
used extensively in the UK, does 15 miles per gallon. The
second one, used entirely within Germany has a recorded
fuel efficiency figure of 20 litres of fuel per 100 kilometres
travelled. Which coach should she use? (There are 4.546
litres in a gallon and 1.609 kilometres in a mile, to 3
decimal places.)
1.6 A pub manager wants to create a square paved area
immediately outside the main bar of the pub. A builder
offers him 175 one metre square paving slabs that were
left over from another job, at a very competitive price.
What are the dimensions of the largest paved area that
could be laid using these slabs, assuming that the pub
manager does not want any slabs cut?