1
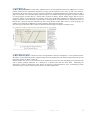
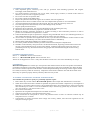
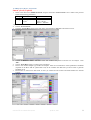
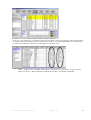
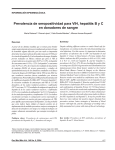
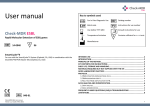
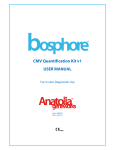
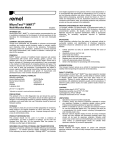
HCV Real-TM Quant
Handbook
Real Time Kit for the Quantitative detection of
Hepatitis C Virus in human plasma
for use with RotorGene™ 3000/6000/Q (Corbett Research, Qiagen),
SmartCycler® (Cepheid), , iQ iCycler™ and iQ5™ (Biorad), MX3000P® and
MX3005P® (Stratagene), Applied Biosystems® 7300/7500/StepOne Real Time
PCR Systems (Applera), LightCycler 2.0® (Roche), LineGene K® (Bioer),
Eco Real Time PCR System® (Illumina)
REF V1-100/2FRT
VER 16.04.2011
100
Sacace™ HCV Real-TM Quant
April 16, 2011
2
TABLE OF CONTENTS
1.
Name …………………………………………………………………………....................................... 4
2.
Introduction………………………………………………………………............................................ 4
3.
Intended Use…………………………………………………………………………………………... 5
4.
Principle of Assay…………………………………………………………………………………….. 5
5.
Materials Provided………………………………………………………………………………….... 6
6.
Materials Required but Not Provided………………………………………………………………. 6
7.
Warnings and Precautions…………………………………………………………………………… 7
8.
Storage Instructions…………………………………………………………………………………... 7
9.
Stability………………………………………………………………………………………………... 7
10. Specimen collection, Storage and Transport……………………………………………………….. 7
11. RNA isolation………………………………………………………………………………………..... 8
12. Internal Control……………………………………………………………………………………..... 8
13. Reagent Preparation………………………………………………………………………………….. 8
14. Protocol and Data Analysis
•
SmartCycler® (Cepheid)………………………………………………………………………… 9
•
RotorGene™ 3000/6000 (Corbett Research)……………………………………………………. 12
•
iQ iCycler™ and iQ5™ (Biorad)………………………………………………………………… 15
•
MX3000P® and MX3005P® (Stratagene)……………………………………………………… 17
•
Applied Biosystems® 7300/7500 Real Time PCR Systems (Applera)……………………….... 19
•
LightCycler 2.0® (Roche)………………………........................................................................... 21
•
LineGene K® (Bioer)…………………………………………………..……………………….... 23
•
Eco Real Time PCR System (Illumina®)…………………………………………………..…… 25
15. Results interpretation…………………………………………………………………………………. 27
16. Performance Characteristics…………………………………………………………………………. 28
17. Troubleshooting……………………………………………………………………………………….. 31
18. References……………………………………………………………………………………………... 31
19. Explanation of Symbols………………………………………………………………………………. 32
Sacace™ HCV Real-TM Quant
April 16, 2011
3
1. NAME
HCV Real-TM Quant
2. INTRODUCTION
Hepatitis C virus (HCV) is a single-stranded RNA virus that belongs to the family Flaviviridae. In 1974 HCV was
initially recognized as non-A, non-B hepatitis virus (NANBH) until 1989 when the etiologic agent was cloned. It is
estimated by the World Health Organization that worldwide there are 170 million HCV-infected persons.
The primary mode of HCV transmission is the exposure to infected human blood via intravenous, drug use or
unscreened transfusions. Nosocomial HCV transmission during dialysis, colonoscopy, and surgery has also been
reported. Perinatal and sexual transmission of the virus is inefficient, but occurs more frequently if the HCVinfected mother or sexual partner is also infected with human immunodeficiency virus type 1.
Most people with acute HCV infection are asymptomatic or have mild symptoms (fatigue, nausea, jaundice) but
they are unable to clear the virus and in approximately 80% of cases this leads to chronic infection. In 15 to 20% of
patients chronic HCV infection progresses at a variable rate to cirrhosis, with a 1 to 4% annual risk of developing
hepatocellular carcinoma.
The discovery of HCV genome in 1989 by Choo et al, paved the way for the development of serological and
molecular assays for viral hepatitis C. In the first generation of an enzyme-linked immunosorbent assay (ELISA),
wells of microtitre plates were coated with purified recombinant antigen c100-3 which was derived from the nonstructural 4 (NS4) region of the HCV genome. However, ELISA-1 was associated with a high percentage (50% to
70%) of false positive results among low-risk blood donors and in the presence of hyperglobulinemia. Thus, secondgeneration anti-HCV ELISAs were developed. ELISA-2 by Ortho Diagnostics contained recombinant antigens from
the core (c22-3), NS3 region (c33c), and NS4 region (c100-3) as well as a part of c100-3, named 5-1-1. Third
generation anti-HCV ELISA was introduced in Europe in 1993 and in the USA in 1996. In addition to the antigens
of ELISA-2, third-generation anti-HCV ELISA uses a NS5 region antigen of the viral genome. However, synthetic
peptide antigens (c22 and c-100) replaced recombinant antigens of ELISA-2. Other manufactures, for example
Abbott Diagnostics, used recombinant antigens derived from the same regions of HCV genome. Despite the
increased sensitivity and specificity with each generation of ELISA, false-positive antibody results continue to be
observed, particularly among low-risk blood donors. Thus, supplemental or confirmatory assays were developed in
parallel with ELISA. The recombinant immunoblot assay (RIBA) was used extensively to confirm the presence or
the absence of antibody to HCV epitopes. In RIBA, recombinant or peptide HCV antigens are blotted as separate
bands onto a nitrocellulose strip flanked by a weak-positive (Level I) and a moderately positive (Level II) strip
control.
Fig. 1 Genome organization of HCV and antigens licensed for diagnostic use
Since ELISA and RIBA are antibody tests, the positivity of either one or both does not necessarily indicate current
HCV infection, as patients who have recovered from infection may remain anti-HCV positive for many years.
Conversely, during seroconversion, antibody tests may be negative.
The direct molecular biology detection of HCV RNA by reverse-transcriptase polymerase chain reaction (RT-PCR)
is considered the gold standard for the diagnosis of HCV infection.
Sacace™ HCV Real-TM Quant
April 16, 2011
4
3. INTENDED USE
Kit HCV Real-TM Quant is a Real-Time Amplification test for the Quantitative detection of Hepatitis C Virus in
human plasma and the simultaneous detection of a HCV-specific Internal Control (IC), by dual color detection.
Quantitative HCV RNA testing provides prognostic information regarding likelihood of treatment response and it
plays an important role in monitoring the antiviral response to treatment. Sustained virological response is defined
as testing negative for HCV RNA, 6 months after cessation of therapy. Recent studies suggest that the rate of
response to therapy is also important. For example, conversion to an HCV RNA negative test result after 4 weeks of
therapy constitutes a rapid virological response and is a strong predictor of treatment success. Patients who have not
had an early virological response, defined as at least a 2-log decline in HCV RNA, after 12 weeks of therapy are
unlikely to respond with an additional 36 weeks of therapy and should stop therapy.
The same type of quantitative HCV RNA test should be used throughout a patient’s treatment course.
Fig. 2. Monitoring treatment response of patients with chronic hepatitis C Virus Infection
4. PRINCIPLE OF ASSAY
Kit HCV Real-TM Quant is a Real-Time test for the Quantitative detection of Hepatitis C Virus in human plasma.
HCV RNA is extracted from plasma, amplified using real time amplification and detected using fluorescent reporter
dye probes specific for HCV or HCV IC.
Internal Control (IC) serves as an extraction and an amplification control for each individually processed specimen
and to identify possible inhibition. IC is detected in a channel other than the HCV RNA. Monitoring the
fluorescence intensities during Real Time allows the detection and quantification of the accumulating product
without having to re-open the reaction tube after the real time amplification.
Sacace™ HCV Real-TM Quant
April 16, 2011
5
5. MATERIALS PROVIDED
Part N° 1 – “Controls”: RNA isolation controls;
Part N° 2 – “HCV Real-TM Quant”: Real Time kit;
Contents
Part N°1 – “Controls”1
HCV Rec Pos1 C+ **
HCV Rec Pos2 C+ **
NCS (Neg. Control Sample) **
HCV Rec IC *
4 x 0,01 ml
4 x 0,01 ml
4 x 0,5 ml
4 x 0,16 ml
Part N°2–“HCV Real-TM Quant”
DTT
RT-PCR-mix-1-TM
RT-PCR-mix-2-TM
Hot Start Taq Polymerase
M-MLV Revertase
TE-buffer
Standard HCV1
•
QS1 HCV
•
QS2 HCV
•
QS3 HCV
Standard IC1
•
QS1 IC
•
QS2 IC
•
QS3 IC
1
4 tubes
4 x 0,3 ml
4 x 0,2 ml
4 x 0,02 ml
4 x 0,01 ml
4 x 0,07 ml
4 x 0,025 ml
4 x 0,025 ml
4 x 0,025 ml
4 x 0,025 ml
4 x 0,025 ml
4 x 0,025 ml
Standards’ and controls’ concentrations are specific for every lot.
*must be used during the sample preparation procedure (see RNA isolation)
** must be used during the sample preparation procedure: add 100 µl of C– (Negative Control) to labeled Cneg; add 90 µl of C– (Negative
Control) and 10 µl of HCV Rec Pos controls to the tubes labeled Cpos1 and Cpos2
6. MATERIALS REQUIRED BUT NOT PROVIDED
• RNA isolation kit (see 11. RNA isolation)
• Desktop microcentrifuge for “eppendorf” type tubes
• Vortex mixer
• Disposable gloves, powderless
• Biohazard waste container
• Refrigerator, Freezer
• Real Time Thermal cycler
• Workstation
• Pipettes (adjustable)
• Sterile pipette tips with filters
• Tube racks
Sacace™ HCV Real-TM Quant
April 16, 2011
6
7. WARNINGS AND PRECAUTIONS
1. Wear disposable gloves, laboratory coats and eye protection when handling specimens and reagents.
Thoroughly wash hands afterward.
2. Use routine laboratory precautions. Do not eat, drink, smoke, apply cosmetics, or handle contact lenses in
laboratory work areas. Do not pipette by mouth.
3. Do not use a kit after its expiration date.
4. Do not mix reagents from different kits.
5. Dispose all specimens and unused reagents in accordance with local regulations.
6. Heparin has been shown to inhibit reaction. The use of heparinized specimens is not recommended.
7. Avoid repeated thawing and freezing of the reagents, this may reduce the sensitivity of the test.
8. Once the reagents have been thawed, vortex and centrifuge briefly the tubes.
9. Prepare quickly the Reaction mix.
10. Specimens may be infectious. Use Universal Precautions when performing the assay.
11. Specimens and controls should be prepared in a laminar flow hood.
12. Handle all materials containing specimens or controls according to Good Laboratory Practices in order to
prevent cross-contamination of specimens or controls.
13. Clean and disinfect all spills of specimens or reagents using a disinfectant such as 0,5% sodium hypochlorite, or
other suitable disinfectant. Follow by wiping down the surface with 70% ethanol.
14. Avoid contact of specimens and reagents with the skin, eyes and mucous membranes. If these solutions come
into contact, rinse immediately with water and seek medical advice immediately.
15. Material Safety Data Sheets (MSDS) are available on request.
16. Use of this product should be limited to personnel trained in the techniques of amplification.
17. Workflow in the laboratory must proceed in a uni-directional manner, beginning in the Extraction Area and
moving to the Amplification Area. Do not return samples, equipment and reagents in the area where you
performed previous step. Personnel should be using proper anti-contamination safeguards when moving
between areas.
8. STORAGE INSTRUCTIONS
Part N° 1 – “Controls” must be stored at 2-8°C.
Part N° 2 – “HCV Real-TM Quant” must be stored at -20°C.
The kit can be shipped at 2-8°C for 3-4 days but should be stored at 2-8°C and -20°C immediately on receipt.
9. STABILITY
HCV Real-TM Quant Test is stable up to the expiration date indicated on the kit label. The product will maintain
performance through the control date printed on the label. Exposure to light, heat or humidity may affect the shelf
life of some of the kit components and should be avoided. Repeated thawing and freezing of these reagents should
be avoided, as this may reduce the sensitivity. Components stored under conditions other than those stated on the
labels may not perform properly and may adversely affect the assay results.
10. SAMPLE COLLECTION, STORAGE AND TRANSPORT
Note: Handle all specimens as if they are potentially infectious agents.
1.
2.
3.
4.
5.
6.
7.
EDTA tubes may be used with the HCV Real-TM Quant. Follow sample tube manufacturer’s instructions.
Whole blood collected in EDTA should be separated into plasma and cellular components by centrifugation at
800-1600 x g for 20 min within six hours. The isolated plasma has to be transferred into a sterile polypropylene
tube. Plasma may be stored at 2-8°C for an additional 3 days. Alternatively, plasma may be stored at -18°C for
up to one month or 1 year when stored at -70°C.
Do not freeze whole blood.
Specimens anti-coagulated with heparin are unsuitable for this test.
Thaw frozen specimens at room temperature before using.
Whole blood must be transported at 2-25°C and processed within 6 hours of collection. Plasma may be
transported at 2-8°C or frozen.
Transportation of clinical specimens must comply with country, federal, state and local regulations for the
transport of etiologic agents.
Sacace™ HCV Real-TM Quant
April 16, 2011
7
11. RNA ISOLATION
The following isolation kits are recommended:
⇒ Ribo Virus 100– spin column extraction kit (Sacace, REF K-2-C/100)
⇒ Ribo-Sorb-100 (Sacace, REF K-2-1/100
Please carry out the RNA extraction according to the manufacturer’s instructions. Add 5 µl of Internal Control
during the RNA isolation procedure directly to the sample/lysis mixture (see 12. Internal Control)
12. INTERNAL CONTROL (HCV Rec IC)
HCV Rec IC is a quantitative Internal Control (concentration reported in Data Card) and represents recombinant
RNA-containing-structure which carried through all steps of analysis from nucleic acid extraction to PCR
amplification-detection. The presence of quantitative HCV Rec IC allows not only to monitor the extraction
procedure and to check possible PCR inhibition but also to verify possible losses of the RNA during extraction
procedure thus enabling to calculate precisely the HCV viral load.
13. REAGENT PREPARATION
Note: Reaction Mix volume = 25 µl
1.
2.
3.
Thaw one set of reagents, vortex and centrifuge briefly the tubes.
Prepare reaction tubes or PCR plate.
Prepare Reaction Mix: add into the tube with DTT, 300 µl of RT-PCR-mix-1, 200 µl of RT-PCR-mix-2, 20
µl of Hot Start Taq Polymerase and 10 µl of M-MLV Revertase. Vortex thoroughly and centrifuge briefly.
(If it is necessary to test less than 25 samples add into the tube with DTT, 300 µl of RT-PCR-mix-1, 200 µl of RTPCR-mix-2 and vortex for at least 5-10 seconds. This mix is stable for 1 month at -20°C. Add for each sample (N)
in the new sterile tube 12,5*N µl of mix, 0,5 *N µl of TaqF Polymerase and 0,25*N µl of M-MLV. For the second
run it’s recommended to import the standard curve generated in the first run, (provided that at least one HCV and
IC standards is used )
4. Add 12,5 µl of Reaction Mix into each tube.
5. Add 12,5 µl of extracted RNA sample to the appropriate tube with Reaction Mix and mix by pipetting.
If the Ribo-Sorb isolation kit is used as a RNA extraction kit, re-centrifuge all the tubes with extracted RNA for 2 min at
maximum speed (12000-16000 g) and take carefully supernatant. N.B. don’t disturb the pellet, sorbent inhibit reaction!
Prepare for each run 6 standards and 1 negative control *:
• add 12,5 µl of Quantitation Standards HCV (QS1 HCV, QS2 HCV, QS3 HCV) into 3 labelled tubes;
• add 12,5 µl of Quantitation Standards IC (QS1 IC, QS2 IC, QS3 IC) into 3 labelled tubes;
• add 12,5 µl of TE-buffer to the tube labelled Negative Control;
Close the tubes and transfer them into the Real Time PCR instrument.
6.
Sacace™ HCV Real-TM Quant
April 16, 2011
8
14. PROTOCOL DATA ANALYSIS:
SmartCycler® (Cepheid)
1.
Select in the main menu “Define Protocols” and press the button “New Protocol”. Give a name to the protocol
and set the following parameters:
1. Stage1 Hold
500C – 1800 sec
2. Stage2 Hold
950С – 900 sec
3. Stage3 2-Temperature
950С - 20 sec
Cycle
600С - 40 sec*
Repeat – 42 times
*optics ON
2. Choose “Save Protocol”
3. Click the “Create Run” button in the main menu, then the button “Dye Set” and select FCTC25.
4.
5.
6.
7.
Choose “Add/Remove Sites” and select in the new windows the protocol and the sites for analysis. Click
“OK”.
Choose “Start Run” and give a name to the experiment.
Insert in the column Sample Type UNKN for samples. Enter the concentrations of the Quantitative Standards
(reported on the HCV TM SC Quant Data Card) in the columns Fam Std and Cy3 Std in order to generate
Standard curves.
Fluorescence is observed in Real Time on the Cy3 channel for HCV RNA and FAM channel for Internal
Control.
Sacace™ HCV Real-TM Quant
April 16, 2011
9
Results Analysis
Choose in the menu “Analysis settings” the value 20 for the channels Fam and Cy3. In the table of results (Results
Table) appear the values of Ct (Threshold cycle) for Fam and Cy3 channels.
The calculation of HCV RNA concentration in the clinical specimens sample and standards can be performed in the
same experiment, but with the SmartCycler software it is possible to calculate the samples concentration by
importing the experiment with Standard Curve in the experiment with clinical samples. You can import curves from
another experiment clicking on Import Std Curve.
Select in the new windows the experiment with the standard curves and click OK
With this technique you can load a standard curve from another experiment.
Sacace™ HCV Real-TM Quant
April 16, 2011
10
In any case, if the calibrators were inserted with the clinical samples in the same experiment or after the importation
of standard curves from another experiment, in the table of results, in the column FAM Std/Res for IC HCV and in
the column Cy3 Std/Res for cDNA HCV should appear the calculated values
Abbreviations:
UNKN – Samples, STD – Standards, PKO1, PKO2 – HCV Positive Controls, OKO – Negative Control
Sample, K1, K2, K3 – HCV Quantitative Standards, B1, B2, B3 – IC Quantitative Standards
Sacace™ HCV Real-TM Quant
April 16, 2011
11
RotorGene™ 3000/6000/Q (Corbett Reasearch, Qiagen)
1.
Select New Run and Dual Labeled Probe. Click New.
2.
Program Rotor-Gene 3000/6000/Q as follows:
Select Rotor Type 36-Well Rotor and No Domed 0,2 ml Tubes
Reaction Volume (µl): 25
Temperature Profile:
Hold:
50°C – 30 min
Denature: 95°C – 15 min
Cycling – 95°C – 20 sec
60°C – 40 sec
Cycle Repeats – 42 times
Fluorescence is measured at 60°C on FAM (Green) and JOE (Yellow) channels.
Sacace™ HCV Real-TM Quant
April 16, 2011
12
3.
4.
Press the button OK.
In the window New Run Wizard click Calibrate (Gain Optimisation…for Rotor-Gene 6000). In the new window
Channel Setting select channels Joe (Yellow) and Fam (Green). Indicate Min Reading 5, Max Reading 10 and
select function Perform calibration (Optimization) before 1st Acquisition. Click the Close button.
5. Select Next and click Start run
Program the position of the tubes in the carousel of the Rotor-Gene 3000/6000/Q and enter the concentrations of the
Quantitative Standards (reported on the HCV TM RG Quant Data Card) in order to generate Standard curves.
Sacace™ HCV Real-TM Quant
April 16, 2011
13
Data Analysis
IC amplification analysis (Cycling A.Fam(Green)
1. Press Analysis and then select Quantitation →Cycling A.Fam (Cycling A.Green )→ Show
2. Turn off the automatic option Threshold.
3. Press the buttons Dynamic Tube, Slope Correct
4. In the table of results (Quantitation Analysis) select More settings and set NTC Threshold to 10%
5. Select Threshold: 0,03
6. In the table of results (Quantitation Results) appear the values of Ct (Threshold cycle) which should be ≤ 30.
7. In the menu window Quantitation Results, column Calculation concentration, appear values of IC cDNA
copy/specimen.
HCV amplification analysis (Cycling A.Joe (Yellow)
1. Press Analysis and then select Quantitation →Cycling A.Joe (Cycling A.Yellow) → Show
2. Turn off the automatic option Threshold.
3. Press the buttons Dynamic Tube, Slope Correct
4. In the table of results (Quantitation Analysis) select More settings and set NTC Threshold to 6%.
5. Select Threshold: 0,03
6. In the table of results (Quantitation Analysis) appear the values of Ct (Threshold cycle).
7. In the new window Quantitation Results appear values of HCV cDNA copy/specimen.
Sacace™ HCV Real-TM Quant
April 16, 2011
14
iQ iCycler™ and iQ5™ (Biorad)
Make sure that the iQ5 instrument is calibrated for working with 50 µl reaction mix. Perform the calibration with the
same tubes in which the amplification will be carried out.
Make sure that the following settings for dynamicwf are selected:
1 cycle
95 °С – 30 s
1 cycle
95 °С – 30 s*
*fluorescence measurement on the second step
1. Select in the main menu “Define Protocols” and click “Create a new protocol”. Set the following parameters:
Cycle
Repeats
Step
Dwell Time
Set Point
1
1
1
30:00
50.0
2
1
1
15:00
95.0
3
42
1
00:20
95.0
2
01:00
60.0
2. Select “Edit Plate” for iQ5 or “View/Save Data” for iQiCycler to create the “plate” for samples and controls.
Enter the concentrations of the Quantitative Standards (reported on the HCV TM iQ Quant Data Card) in the
“Standard Quantity” box (QS1 HCV, QS2 HCV, QS3 HCV as Standard in the HEX channel and Unknown
in the Fam; QS1 IC, QS2 IC, QS3 IC as Standard in the Fam channel and Unknown in the HEX channel).
Use icon “Unknown” for all samples.
3. Choose the FAM and HEX channels for all samples.
4. For the iQ5 instrument enter the reaction volume “Sample volume” 25 µl. Select caps type “Seal Type” and
tubes type “Vessel Type”. Save plate setup.
5. Begin the amplification:
For the iQ iCycler instrument activate the key “Run with selected plate” and choose in the window of the
opened menu, the reaction volume 25 µl, select “PCR Quantification Melt Curve” and “Experimental
Plate”. Click the button “Begin Run” and save the experiment settings.
For the iQ5 instrument activate the button “Run” and choose in the window of the opened menu “Collect Well
Factors from Experimental Plate”. Click the button “Begin Run” and save the experiment settings.
Sacace™ HCV Real-TM Quant
April 16, 2011
15
Data Analysis
The results are interpreted with the software of “iQ iCycler” or “iQ5” through the presence of crossing of
fluorescence curve with the threshold line. Internal Control (IC) is detected on the FAM channel and HCV RNA on
the HEX channel
Activate the button “PCR Quant” for the results analysis
Results analysis for Fam channel (IC)
Activate the button “Log View”. Put the threshold line (with the left button of the mouse) at such level where curves of
fluorescence are linear (see figure)
Results analysis for HEX channel (HCV RNA)
Activate the button “Log View”. Put the threshold line (with the left button of the mouse) at such level where the curves of
fluorescence are linear (see figure)
Sacace™ HCV Real-TM Quant
April 16, 2011
16
MX3000P® and MX3005P® (Stratagene)
1.
Open the program, select “Quantitative PCR (Multiple Standarts)” and click “OK”
2.
3.
4.
5.
At the top left of the window choose “Plate Setup”
In the window “Well type” set “Unknown” for the samples and “Standard” to identify calibrators.
In the window “Collect fluorescence data” select for all samples the channels Fam and Joe.
Enter the concentrations of the Quantitative Standards (reported on the HCV TM MX Quant Data Card) in the
“Standard Quantity” box.
6.
7.
At the top left of the window select button “Thermal Profile Setup”
Set the following parameters of amplification:
1. 50°C – 30 min
2. 95°C – 15 min
3. 95°C – 20 sec
60°C – 60 sec
45 Cycles
Fluorescence is measured at 60°C. To do this, set on the Thermal Profile graph the “Endpoints” marker.
Click “Run” button, enter a name for the experiment and save it.
8.
9.
Sacace™ HCV Real-TM Quant
April 16, 2011
17
Data Analysis
1. Soon after the amplification is over, choose the button “Analysis” at the top left of the window .
2. Choose the button “Results”
3. At the right angle of the window “Area to analyze” select “Amplification plots”.
4. Set “Threshold fluorescence” 500 for the Joe channel and 1000 for the Fam channel.
5. In the window “Text report” appear for each sample the values of Ct and experimental values of copies cDNA
HCV and cDNA IC.
6. Take care that the value of RSq (correlation coefficient) in the window “Standard curve” is not lower than 0,9
for both channels.
Sacace™ HCV Real-TM Quant
April 16, 2011
18
Applied Biosystems® 7300/7500/StepOne Real Time PCR Systems (Applera)
1.
Select in the main menu the option “New Experiment” (Advanced Setup), insert experiment details. Select your
Instrument Type (7500 / 7500 fast/StepOne/StepOne Plus), Quantitation – Standard curve, Taqman Reagents,
Standard ramp speed (DO NOT select Fast RampSpeed).
Note: when using StepOne software, be sure to click New Experiment – Advanced Setup
2.
3.
Click
, add two targets: one for HCV (Reporter Joe) and the other one for Internal Control
(Reporter Fam); select Quencher – None for both targets.
Click Add new samples multiple times and enter name for all samples, controls and standards
4.
Click Assign target and Samples tab, associate samples (
) and standards (
select None as passive reference dye as shown in the following pictures:
)with the two targets and
5.
Double-click on each standard well (a new small window will appear) and enter both for HCV and Internal
control the corresponding concentration in the Quantity field as indicated in the Data Card:
6.
Click on
, insert Reaction volume (25 µl):
HCV Real TM Quant
Stage
Profile
Reps
1
50°C – 30:00
1
2
95°C – 15:00
1
3
95°C – 0:15
42
60°C – 1:00 *
7.
Click
to begin PCR reaction.
8.
After the run is complete, select all samples and standards and click
Sacace™ HCV Real-TM Quant
April 16, 2011
19
9.
Deselect Use default settings, Automatic threshold and automatic baseline; suggested values are*:
* for StepOne instrument recommended Threshold values are: Joe (HCV) = 1,000, Fam (IC) = 2,000.
NOTE: please slightly adapt suggested values according to your result curves
10. Click
11. Select all samples and standards, click View well table and then Click File -> Export, select Results only.
12. Click Customize Export and sort samples by reporter, as indicated in the above image. Then click
to
export results in a file.
13. Using the exported file, calculate results pasting data from the Sample and the Quantity columns in the provided
HCV Quant Result Calculation sheet.
FAM – Internal Control
Sacace™ HCV Real-TM Quant
Joe – HCV
April 16, 2011
20
LightCycler 2.0® (Roche)
1.
Select “New”, “LightCycler Experiment”, Click
and insert as follows:
• Max. Seek Pos. indicates the number of samples used in the
experiment
• Choose Instrument Type according to your instrument
• Choose capillary Size according to your capillaries (we
suggest to select 20 µl and use 30 µl polycarbonate capillaries)
2.
Program the thermalcycling as follows:
HCV Real TM Quant
Stage
Profile
Reps
1
2
3
50°C – 30:00
95°C – 15:00
95°C – 0:15
60°C – 0:40 *
1
1
42
*Acquisition mode - Single
3.
Click
and insert sample names; then select Absolute Quantification from Analysis Type and select 530,
560 in Selected Channels section:
4.
Insert target Name, Sample Type (Standard for standards, Unknown for all other samples), and insert sample
concentration values as reported in the Data Card:
5.
Click
6.
After Run is completed click
button and select Absolute quantification. Select Method (Auto) ,
Standard Curve (In Run). Ct values and calculated results will appear, for the selected channel, under the CP
and Concentration column in the Absolute Quantification table.
to start PCR reaction.
Sacace™ HCV Real-TM Quant
April 16, 2011
21
7.
Calculate results manually using the usual formula as indicated in the User Manual of the kit.
Fig. 1 FAM / 530 channel (Internal Control)
Fig. 2 Joe / 560 channel (HCV)
Fig. 3 Standard Curve
At first usage the operator must perform a color compensation experiment asking Sacace for the detailed
instructions.
Sacace™ HCV Real-TM Quant
April 16, 2011
22
LineGene K® (Bioer)
Open LineGeneK Software. Click File -> New. In the Setup Programs tab, insert User Name and Test Name. Click
Dyes button and select FAM, JOE. Insert the correct liquid quantity (25 µl).
Click the button
3 times and program the 3 thermalcycling steps. At the end it must look like this:
On the second phase (60.0 °C) of step 3 select “Single” on the Sample Mode column to collect fluorescence data, as
shown in this picture:
Click the menu System Parameters (P) -> Gain Setup (G). Select Auto Gain box and click OK (see picture below for
Gain Setup details).
Click the menu Sample Information (S) -> Sample Group Setup…(R). Select at least 2 groups.
Click the menu Sample Information (S) -> Sample Data…(S). Insert Sample name, Property (U for unknown
samples and negative PCR control, S for Standards) and insert standard concentration reported in Data Card.
Click
or click File -> Run Programs (R) to Run the PCR program.
Sacace™ HCV Real-TM Quant
April 16, 2011
23
Results Analysis - FAM
In the Quantitative Analysis tab, select from the menu Dyes(D) -> FAM(F). Select standard Concentration boxes
(left mouse click+CTRL) for Internal Control (see picture below).
Then do in this order:
1) Under Analysis Method select Fit Points.
2) Under Analysis Step Click Zero Adjust, select Auto and then click OK. Then click Baseline
3) Select 2 points and set the base line (drag and drop the red baseline) as low as possible but above the noise
of each sample (usually 6-8)
4) Under Analysis Step click Analysis. Calculated copies/reaction of Internal Control and Ct Results should
appear in the Ct and the “Calculated Concentration” column respectively.
Results Analysis - Joe
In the Quantitative Analysis tab, select from the menu Dyes(D) -> Joe(F). Select standard Concentration boxes (left
mouse click+CTRL) for HCV.
Then do in this order:
1) Under Analysis Method select Fit Points.
2) Under Analysis Step Click Zero Adjust, select Auto and then click OK. Then click Baseline
3) Select 2 points and set the base line (drag and drop the red baseline) as low as possible but above the noise
of each sample (usually 15-20)
4) Under Analysis Step clic Analysis. Calculated copies/reaction of HCV and Ct Results should appear in the
Ct and the “Calculated Concentration” column respectively.
Sacace™ HCV Real-TM Quant
April 16, 2011
24
Eco Real Time PCR System (Illumina®)
1.
Open Eco software, click
and under Experiment Type select
as starting material for HCV Real-TM Quant.
2.
Under Quantification Method select
3.
Click
,
, select RNA
, and insert experiment name. Click
, set up two assays: one for HCV (Reporter HEX) and the other one for Internal Control (Reporter
Fam); select Quencher – Non fluorescent for both targets. Click
4.
5.
and enter name for all samples, controls and standards. Click
Click
Associate samples and standards with the two previously designed assays following this procedure: select the
well, select Unknown for samples and Standard for standards and to assign the corresponding assay click the
white circle of the HCV and Internal control assays (the circle will become colored): for each well both Assays
must be assigned.
6.
Click
and in the Set Up Standards box insert each value reported in the DataCard (click Enter after
inserting each value) both for HCV assay and Internal control assay; then associate concentration values to the
corresponding well. In the end it should look like above:
7.
Click on
, and program the instrument as follows (reaction volume is 20 µl**):
HCV Real TM Quant
Stage
Profile
Reps
1
50°C – 30:00
1
2
95°C – 15:00
1
3
95°C – 0:15
42
60°C – 1:00 *
** Add 10 µl of Reaction Mix into
each tube.
Add 10 µl of extracted RNA sample
or quantitative standards to the
appropriate tube with Reaction Mix
8.
Click Start Run
to begin PCR reaction.
9.
After the run is complete click
Sacace™ HCV Real-TM Quant
then click
tab to interpret the results.
April 16, 2011
25
10. Click
to Export the samples, in the Export Options select Results Table
11. Using the exported file, calculate results pasting data from the Sample Name and the Quantity columns in the
provided HCV Quant Result Calculation sheet.
FAM – Internal Control
Joe – HCV, HBV
Standard Curve
Sacace™ HCV Real-TM Quant
Standard Curve
April 16, 2011
26
15. RESULTS INTERPRETATION
The Internal Control (IC) is detected on the FAM channel and HCV RNA on the Joe/HEX/Cy3 channel.
For each control and patient specimen, calculate the concentration of HCV RNA using the following formula:
HCV DNA copies/specimen (Joe/HEX/Cy3 channel)
IC DNA copies/specimen (FAM channel)
x coefficient* = IU HCV/mL
*coefficient is specific for each lot and reported in the HCV TM RG Quant Data Card provided in the kit.
Results may by calculated also using “HCV Quant Result Calculation sheet” provided with the kit
To obtain the results in copies/mL multiply the IU HCV/ml value by 4:
IU RNA HCV/mL x 4 = copies RNA HCV/mL
Sacace™ HCV Real-TM Quant
April 16, 2011
27
16. PERFORMANCE CHARACTERISTICS
The sensitivity, the specificity, the performance and the linearity of the kit HCV Real-TM Quant were determined
with the following samples:
1. The HCV RNA standard with the concentration of 2х105 IU/ml and its dilution.
2. The samples of blood plasma obtained from 215 patients with IgG antibodies to HCV. The results were
compared to those ones obtained by the reference manufacturer’s kit.
3. 80 samples of blood plasma obtained from donors..
Analytical specificity
The analytical specificity of the primers and the probes was validated with 80 negative samples. They did not generate
any signal with the specific HCV primers and probes. The specificity of the kit HCV Real-TM Quant was 100%
The potential cross-reactivity of the kit HCV Real-TM Quant was tested also against the group control listed in the
following table. It was not observed any cross-reactivity with these pathogens.
Table 1: Testing the specificity of the kit with other pathogens:
Control group
Adenovirus type 2
Adenovirus type 3
Adenovirus type 7
Cytomegalovirus
Epstein Barr virus
Hepatitis B virus
Human immunodeficiency virus 1
Herpes simplex virus 1
Herpes simplex virus 2
Human herpes virus 6
Human herpes virus 8
HPV groups β, γ, µ (1,3,4,5,8,37,38,65,20,24,49,50,15)
HPV group α (6,11,26,53,7,27,10)
Results
-
Analytical sensitivity
The kit HCV Real-TM Quant allows to detect HCV RNA in 100% of the tests with a sensitivity not less than 20
IU/ml (value obtained using the “Magno-Virus” extraction kit Sacace REF K-2-16 and RotorGene 6000). The
detection was carried out on the control standard and its dilutions by negative plasma.
Linearity
The linearity of the HCV Real-TM Quant assay was tested with the HCV RNA Standard and it’s dilution using
HCV-negative human plasma. Each dilution was analysed three times and the mean HCV RNA titer of each sample
was determined.
HCV Real-TM Quant is linear from 2,5 x 10² to 5 x 10⁷ IU/mL. Test results greater than 50.000.000 IU/mL are
above the upper limit of quantitation of the test and should be reported as “greater than 50.000.000 IU/mL”. If
quantitation results are desired for such samples, the specimen should be diluted 1:10 with negative serum and
retested. Test results less than 250 IU/mL are below the lower limit of quantitation of the test and should be reported
as “less than 250 IU/mL”.
Sacace™ HCV Real-TM Quant
April 16, 2011
28
Table 1. Comparison among the results of HCV RNA viral load detection using “HCV Real-TM Quant” (Sacace) kit
and reference manufacturer’s kit.
Reference
HCV Real-TM Quant
Sample
∆ Log10 Reference
IU/ml
Log10
IU/ml
Log10
Log10 Sacace
N026
640.000
5.81
955.000
5.98
-0.17
B092
354.000
5.55
874.000
5.94
-0.39
C009
19.200
4.28
26.000
4.41
-0.13
P110
621.000
5.79
1460.000
6.16
-0.37
N075
16.400
4.21
23.800
4.38
-0.17
H069
97.100
4.99
164.000
5.21
-0.22
A152
147.000
5.17
343.000
5.54
-0.37
D018
250.000
5.40
235.000
5.37
0.03
D108
643.000
5.81
644.000
5.81
0.00
D159
266.000
5.42
540.000
5.73
-0.31
H037
105.000
5.02
262.000
5.42
-0.40
S033
72.100
4.86
209.000
5.32
-0.46
B038
34900
4.54
82800
4.92
-0.38
E100
1960
3.29
4.810
3.68
-0.39
D036
>850.000
>5.93
19.700.000
7.29
-
Standard
250.000
5.39
270.000
5.43
-0.04
Standard1
120.000
5.07
135.000
5.08
-0.01
Standard 2
11.000
4.04
12.000
4.04
0.00
Standard 3
1.000
3.00
1.120
3.04
-0.04
Standard 4
<500
<2.7
<500
<2.7
-
In the above table the data show that almost all the results obtained from the clinical and control samples with HCV
Real-TM Quant test differ by less than 0.5 Log10 from the values obtained with Reference manufacturer’s kit. The
figure 2 illustrates the graphic correlation between the HCV RNA viral load measured by two tests. The correlation
factor is 0,975 (pv < 0,01).
Sacace™ HCV Real-TM Quant
April 16, 2011
29
Figure 2. Graphic comparison among the results obtained with “HCV Real-TM Quant” (Sacace) kit and reference
manufacturer’s kit.
6.0
5.0
4.0
Iog10 Ref
3.0
3.5
4.5
5.5
6.5
Iog10 Sacace
Sacace™ HCV Real-TM Quant
April 16, 2011
30
17. TROUBLESHOOTING
1. Weak (Ct > 34) signal of the IC (Fam channel): retesting of the sample is required.
• The PCR was inhibited.
⇒ Make sure that you use a recommended RNA extraction method and follow the
manufacturer’s instructions.
⇒ Re-centrifuge all the tubes before pipetting the extracted RNA for 2 min at maximum
speed (12000-16000 g) and take carefully supernatant. Don’t disturb the pellet, sorbent
inhibit reaction.
• The reagents storage conditions didn’t comply with the instructions.
⇒ Check the storage conditions
• The PCR conditions didn’t comply with the instructions.
⇒ Check the PCR conditions and for the IC detection select the fluorescence channel reported
in the protocol.
• The IC was not added to the sample during the pipetting of reagents.
⇒ Make attention during the RNA extraction procedure.
2. Weak (Ct > 40) signal on the Cy3 channel: retesting of the sample is required.
3. The correlation coefficient R2 is less than 0.9: retesting of all samples is required.
4. The calculated concentrations of HCV Rec Pos1 and/or HCV Rec Pos2 are different from given control
concentrations, reported in the Data Sheet: retesting of all samples is required.
5. Any signal on the Joe/HEX/Cy3 channel with Negative Control of extraction.
• Contamination during RNA extraction procedure. All samples results are invalid.
⇒ Decontaminate all surfaces and instruments with sodium hypochlorite and ethanol.
⇒ Use only filter tips during the extraction procedure. Change tips among tubes.
⇒ Repeat the RNA extraction with the new set of reagents.
6. Any signal with Negative PCR Control.
• Contamination during PCR preparation procedure. All samples results are invalid.
⇒ Decontaminate all surfaces and instruments with sodium hypochlorite and ethanol or
special DNA decontamination reagents.
⇒ Pipette the Positive controls at the end.
⇒ Repeat the PCR preparation with the new set of reagents.
18. REFERENCES
1.
2.
3.
4.
5.
6.
7.
8.
9.
10.
11.
12.
13.
14.
15.
16.
World Health Organization. Hepatitis C—Global prevalence (update). Wkly Epidemiol Rec, 1999, 74, 425–427.
Alter, H. 1999.Discovery of non-A, non-B hepatitis and identification of its etiology. Am. J. Med.107 (Suppl.6B):16S–20S.
Bendinelli, M., M. Pistello, F. Maggi, and M. Vatteroni. 2000. Blood-borne hepatitis viruses: hepatitis B, C, D, and G viruses and TT virus, p.306–337. In
S.Specter, R.L. Hodinka, and S.A. Young (ed.), Clinical virology manual, 3rd ed. ASM Press, Washington, D.C.
Choo, Q.-L., G. Kuo, A.J. Weiner, L.R. Overby, D.W. Bradley, and M. Houghton. 1989. Isolation of a cDNA clone derived from a blood-borne non-A, non-B
viral hepatitis genome. Science 244: 359–362.
Lauer, G.M., and B.D. Walker. 2001. Hepatitis C virus infection .N. Engl. J. Med. 345: 41–52
De Medina M, Schiff ER. Hepatitis C: diagnostic assays. Sem Liver Dis, 1995, 1, 33–40
Kao, J.-H., M.-Y. Lai, Y.-T. Hwang, P.-M. Yang, P.-J. Chen, J.-C. Sheu, T.-H. Wang, H.-C. Hsu, and D.-S. Chen. 1996. Chronic hepatitisC without antihepatitis C antibodies by second generation assay: a clinicopathologic study and demonstration of the usefulness of a third generation assay. Dig. Dis. Sci. 41:
161–165.
Schiff ER, de Medina M, Kahn RS. New perspectives in the diagnosis of hepatitis C. Sem Liver Dis, 1999, 19, 3–15.
Lok ASF, Gunaratnam NT. Diagnosis of hepatitis C. Hepatology, 1997, 26(Suppl 1), 48–56S.
Pawlotsky J M , Bouvier-Alias M, Hezode C, Darthuy F, Remire J, Dhumeaux D. Standardization of hepatitis C virus RNA quantification. Hepatology. 2000;
32: 654-659.
Manns MP, McHutchison JG, Gordon SC, et al. Peginterferon alfa-2b plus ribavirin compared with interferon alfa-2b plus ribavirin for initial treatment of
chronic hepatitis C: a randomized trial. Lancet. 2001; 358: 958-965
Weiland O, Braconier JH, Fryden A, Norkrans G, Reichard O, Uhnoo I. Influence of pretreatment factors on outcome of interferon-alpha treatment of patients
with chronic hepatitis C. Scand J Infect Dis. 1999; 31: 115-118.
Fried MW, Shiffman ML, Reddy KR,et al. Peginterferon alfa-2a plus ribavirin for chronic hepatitis C virus infection.N Engl J Med. 2002; 347:975-982.
Jensen DM, Morgan TR, Marcellin P, et al. Early identification of HCV genotype 1 patients responding to 24weeks peginterferon alpha-2a (40kd)/ribavirin
therapy. Hepatology. 2006; 43:954-960
Davis GL, Wong JB, McHutchison JG, Manns MP, Harvey J, Albrecht J. Early virologic response to treatment with peginterferonalfa-2b plus ribavirin in
patients with chronic hepatitis C. Hepatology. 2003; 38:645-652
Terrault NA, Pawlotsky JM, McHutchison J,et al. Clinical utility of viral load measurements in individuals with chronic hepatitis C infection on antiviral
therapy. J Viral Hepat. 2005; 12:465-472
Sacace™ HCV Real-TM Quant
April 16, 2011
31
19. EXPLANATION OF SYMBOLS
REF Catalogue Number
RUO For Research Use Only
LOT Lot Number
Expiration Date
Contains reagents
Caution!
VER
Version
Manufacturer
Temperature limitation
* Cycler™ and iQ5™ are trademarks of Bio-Rad Laboratories
* Rotor-Gene™ Technology is a registered trademark of Corbett Research
*MX3000P® and MX3005P® are trademarks of Stratagene
*Applied Biosystems® is trademarks of Applera Corporation
* SmartCycler® is a registered trademark of Cepheid
* LightCycler® is a registered trademark of Roche
* LineGene K® is a registered trademark of Bioer
* Eco PCR Real Time System® is a registered trademark of Illumina
Sacace Biotechnologies Srl
via Scalabrini, 44 – 22100 – Como – Italy Tel +390314892927 Fax +390314892926
mail: [email protected] web: www.sacace.com
*PCR: The Polymerase Chain Reaction (PCR) process is covered by patents owned by Hoffmann-La Roche and applicable in certain countries. Sacace does not encourage or support the
unauthorized or unlicensed use of the PCR process. Use of this kit is recommended for persons that either have a license to perform PCR or are not required to obtain a license
Sacace™ HCV Real-TM Quant
April 16, 2011
32