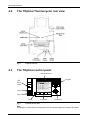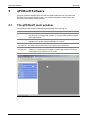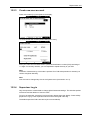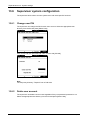
1
TOptical Gradient 96 TOptical 96 Real-Time PCR Thermal Cycler Operating manual Manufacturer Biometra GmbH Rudolf-Wissel-Str. 30 037079 Göttingen Telefon: + 49 (0) 551 / 50686-0 Fax: + 49 (0) 551 / 50686-66 e-mail: [email protected] Service: Biometra GmbH Rudolf-Wissel-Str. 30 037079 Göttingen Germany Phone: + 49 (0) 551 / 50686-10 + 49 (0) 551 / 50686-12 Fax: + 49 (0) 551 / 50686-11 e-mail: [email protected] General information about Biometra GmbH on the internet: http://www.biometra.com Copyrights and Trademarks Microsoft, Windows XP/VISTA/7, MS Excel are registered trademarks of Microsoft Corp The identification with ® or TM is omitted in this manual. Documentation number: 10-3100-002-23 Edition – March 2011 Implementation of the Technical Documentation: Analytik Jena AG This publication describes the state of this product at the time of publishing. It need not necessarily agree with future versions of the product. Modifications reserved! © Copyright 2011 Analytik Jena AG Contents Contents 1 Introduction ................................................ 5 6 Menu bar ................................................... 27 1.1 Field of Applications ...................................... 5 6.1 File .............................................................. 27 1.2 Special features ............................................. 5 6.1.1 New ............................................................. 27 1.2.1 Interchangeable block modules ..................... 5 6.1.2 Open template ............................................ 27 1.2.2 Patented optical system ................................ 6 6.1.3 Open project ............................................... 27 1.2.3 LED technology ............................................. 6 6.1.4 Save template / Save template as.. ............ 27 1.2.4 Flexible configuration with optical filter modules ......................................................... 7 6.1.5 Save project / Save project as... ................. 28 1.2.5 Software ........................................................ 7 6.1.6 Close/Close all ............................................ 28 1.3 Technical specifications TOptical Thermocycler ................................................. 8 6.1.7 Print............................................................. 28 6.1.8 Exit .............................................................. 28 1.4 Legal Notes ................................................. 10 6.2 Edit .............................................................. 28 1.4.1 Real-Time PCR License – Legal Disclaimer 10 6.2.1 Undo ........................................................... 29 1.4.2 PCR License – Legal Disclaimer ................. 10 6.2.2 Redo ........................................................... 29 1.4.3 Copyright ..................................................... 10 6.2.3 Cut .............................................................. 29 1.4.4 Liability ........................................................ 10 6.2.4 Copy............................................................ 29 1.4.5 Meaning of the instructions .......................... 10 6.2.5 Paste ........................................................... 29 6.2.6 Delete.......................................................... 29 2 Safety and Warning Notices ................... 11 6.2.7 Mark all ....................................................... 29 2.1 Definition of Symbols ................................... 11 6.2.8 User management....................................... 30 2.2 General Safety Instructions ......................... 11 6.2.9 Signatures ................................................... 31 6.3 View ............................................................ 32 3 Installation ................................................ 14 3.1 Content of delivery....................................... 14 6.3.1 Project explorer ........................................... 32 3.2 Unpack and check ....................................... 14 6.3.2 Toolbar ........................................................ 32 3.2.1 Installation conditions .................................. 14 6.4 Extras .......................................................... 33 3.3 Operation Voltage........................................ 15 6.4.1 Initialization ................................................. 33 3.4 Initial self test ............................................... 16 6.4.2 Edit color modules....................................... 33 6.4.3 Update device ............................................. 34 6.4.4 Options........................................................ 34 6.5 Window ....................................................... 34 6.5.1 Tile horizontal .............................................. 35 6.5.2 Tile vertical .................................................. 35 6.5.3 Cascade ...................................................... 35 6.6 Help............................................................. 35 4 Operating elements ................................. 17 4.1 The TOptical Thermocycler front view ......... 17 4.2 The TOptical Thermocycler rear view .......... 18 4.3 The TOptical control panel .......................... 18 4.4 The TOptical lid ........................................... 19 5 qPCRsoft Software .................................. 20 5.1 The qPCRsoft main window ........................ 20 6.6.1 Contents...................................................... 35 5.1.1 Individual items in the menu bar .................. 21 6.6.2 Info .............................................................. 35 5.1.2 Toolbar commands ...................................... 23 5.1.3 Project explorer components ....................... 26 5.1.4 Project interface........................................... 26 1 7 Project explorer ........................................ 36 7.1 Layout ......................................................... 36 7.1.1 General ....................................................... 36 Ausgabe 03/2011 TOptical Contents 7.1.2 Thermal cycler............................................. 36 10 7.1.3 Scan ............................................................ 37 10.1 Absolute quantification................................. 70 7.1.4 Layout ......................................................... 37 10.1.1 Selection area .............................................. 71 7.1.5 Absolute quantification ................................ 39 10.1.2 Fluorescence curve display ........................ 72 7.1.6 Relative quantification ................................. 39 10.1.3 Standard curve and values display .............. 72 7.1.7 DeltaDeltaCt ................................................ 40 10.1.4 Import a standard curve ............................... 74 7.1.8 Melting curve ............................................... 40 10.1.5 Delete absolute quantification ...................... 75 10.2 Relative quantification .................................. 75 10.2.1 Selection area .............................................. 76 10.2.2 Fluorescence curve display ........................ 77 10.2.3 Standard curves and values display ............ 78 10.2.4 Import a standard curve ............................... 79 10.2.5 Delete relative quantification ........................ 79 10.3 ΔΔCt method ............................................... 80 10.3.1 Selection area .............................................. 81 10.3.2 Fluorescence curve display ........................ 82 10.3.3 Validation curves and values display ........... 83 10.3.4 Delete ΔΔCt method .................................... 84 10.4 Melting curve ............................................... 85 10.4.1 Selection area .............................................. 86 10.4.2 Fluorescence curve/melting curve display ... 87 10.4.3 Sample table display.................................... 88 10.4.4 Delete melting curve analysis ...................... 89 8 Creating a project .................................... 42 Analysis ....................................................68 8.1 Open a project window................................ 42 8.2 General information on the project .............. 43 8.3 Create a PCR protocol ................................ 44 8.3.1 Program header .......................................... 45 8.3.2 Select block type ......................................... 45 8.3.3 Heated lid preheat ....................................... 46 8.3.4 Configure the lid temperature ...................... 46 8.3.5 Enter temperature and hold time for a step . 47 8.3.6 Define a loop ............................................... 47 8.3.7 Temperature increments ............................. 48 8.3.8 Time increments.......................................... 48 8.3.9 Set the heating and cooling rate.................. 49 8.3.10 Program a temperature gradient (TOptical Gradient only).............................................. 49 8.3.11 Program linear gradients (TOptical Gradient only) .............................. 50 8.3.12 Program the melting curve .......................... 51 8.4 Define the scan settings .............................. 52 8.4.1 Spectral compensation ................................ 53 12 8.4.2 Define the scan ........................................... 55 12.1 The TOptical user interface ......................... 96 8.5 Graphical progression of the PCR protocol . 55 12.1.1 TOptical menu buttons ................................. 96 8.6 Graphic programming ................................. 56 12.1.2 TOptical softkeys ......................................... 97 8.7 Edit program ............................................... 56 12.1.3 Log in menu ................................................. 97 8.8 Edit sample table......................................... 57 12.1.4 Block menu .................................................. 97 8.8.1 Define sample properties ............................ 58 12.1.5 System menu ............................................... 98 8.8.2 Define groups .............................................. 61 12.1.6 Program menu ............................................. 98 8.8.3 Layout preview ............................................ 62 12.2 TOptical software ......................................... 99 8.8.4 Copy layout ................................................. 62 12.2.1 Log in ........................................................... 99 8.9 Save template ............................................. 63 12.2.2 Log in existing user ...................................... 99 12.2.3 Create new user account ........................... 101 12.2.4 Supervisor Log in ....................................... 101 12.2.5 Delete User ................................................ 102 12.3 View program............................................. 102 12.3.1 Display during operation ............................ 103 Ausgabe 03/2011 TOptical 9 Monitoring................................................. 64 9.1 Start run ...................................................... 65 9.2 PCR protocol ............................................... 66 9.2.1 Product accumulation curves ...................... 66 9.3 Melting curves ............................................. 67 2 11 Short manual ............................................90 11.1 Safety Warnings .......................................... 90 TOptical base unit ....................................96 Contents 12.3.2 13 Stop program ............................................. 103 TOptical base unit - System settings ... 104 13.6.2 Delete user account .................................. 114 13.6.3 Change supervisor PIN ............................. 115 13.6.4 Set boot language ..................................... 116 13.6.5 Delete all user accounts ............................ 116 13.1 User configuration ..................................... 104 13.1.1 Set language ............................................. 104 13.1.2 Change individual PIN ............................... 105 14 13.1.3 Delete account .......................................... 105 14.1 Slow heating and cooling .......................... 117 13.2 System configuration ................................. 106 14.2 Autorestart ................................................ 117 13.2.1 Configure beep .......................................... 106 14.3 Restart due to unrecognised power failure 117 13.2.2 Configure display contrast ......................... 107 14.4 Adaptation of protocols from other cyclers 117 13.2.3 Set time and date ...................................... 107 13.2.4 Defragment memory .................................. 107 13.2.5 Screen saver ............................................. 108 13.3 System info ................................................ 108 13.3.1 System info ................................................ 109 13.3.2 View run log files of the last five runs ........ 109 13.4 Service ...................................................... 110 16 13.4.1 View log files of Power on self test ............ 110 16.1 Instructions for return shipment ................. 119 13.4.2 Execute block extended self test ............... 110 16.2 Packing of the Thermocycler ..................... 120 13.4.3 View log files from extended self test ........ 111 17 13.4.4 View Error log files..................................... 112 Equipment Decontamination Certificate................................................ 121 13.4.5 Create service info file for the Biometra Service Department ................................... 113 18 13.5 How to contact Biometra ........................... 113 Note for the disposal of electric / electronic waste. .................................... 123 13.6 Supervisor system configuration ............... 114 19 Warranty.................................................. 124 13.6.1 Change user PIN ....................................... 114 20 Subject Index .......................................... 125 Ausgabe 03/2011 TOptical 3 15 Trouble shooting .................................... 117 Maintenance and repair ......................... 118 15.1 Cleaning and Maintenance ....................... 118 15.2 Servicing and repair .................................. 118 15.3 Firmware update ....................................... 118 15.4 Replacement of Spare Parts ..................... 118 Service .................................................... 119 Contents 4 Ausgabe 03/2011 TOptical Introduction 1 Introduction 1.1 Field of Applications The Biometra TOptical Thermocycler is licensed for Real-Time PCR applications (research use only) and intended to perform Real-Time and end-point thermal cycling using the polymerase chain reaction (PCR). The instrument is based on the Biometra TProfessional Thermocycler and consists of the base unit and the TOptical module (Fig. 1). It is an open platform and accommodates either probe-based or SYBR® Green I dye assay chemistry and is not restricted to any special Real-Time PCR kits or plates from specific vendors. It is highly suited to be used for different applications like gene expression analysis, genotyping, pathogen detection and many other areas of research. 1.2 Special features 1.2.1 Interchangeable block modules The TOptical Thermocycler consists of the base unit of the TProfessional Thermocycler and the TOptical module (Fig. 1). Fig. 1 TOptical module This modular system allows the upgrade of existing TProfessional Thermocyclers by the TOptical module to a complete Real-Time PCR Thermocycler. By the quick block exchange system different block modules can be exchanged within a few seconds and are automatically recognized and initialised by the base unit. For maximum flexibility two RealTime PCR block modules and five block modules for conventional PCR in various block formats are available. TOptical Issue 03/2011 5 Introduction 1.2.2 Patented optical system Fig. 2 TOptical lightpath The optical system of the TOptical Thermocycler is patented (Patent Nr. DE 2006 036 171 B4). Light for the excitation of dyes is emitted by the long lasting LEDs (Fig. 2). The light is transmitted by high performance optical fibers to collimator lenses. The fluorescent light is bundled and transmitted to an excitation filter of a color filter module located on a rotating filter wheel. The light is deflected by a beam splitter and transferred by optical fibers to a lens array in a shuttle that scans the sample block column by column. The light excites the fluorescent dyes in the reaction mix. The fluorescent dyes then emit light of a longer wavelength that is collected by the lenses in the shuttle system and transferred by optical fibers back to the filter color module. In the color module the light passes the beam splitter and two emission filters and is then further transferred to the channel photo multiplier for detection. 1.2.3 LED technology Fig. 3 6 The excitation spectra of the blue, white and red TOptical LED (dotted lines) cover very well the absorption spectra of the commonly used fluorescent dyes FAM, JOE/HEX/VIC, 6-ROX, TET, TAMRA, CY5 and CY5.5 (solid lines). In combination with the beam transfer by high performance optical fibers superb sensitivity is achieved. Issue 03/2011 TOptical Introduction The fluorescent dyes are excited by three LEDs in the colors blue, white and red. The combination of these three LEDs allows optimal excitation of fluorescent dyes over a wide spectral range. Unlike with so-called "wide blue" LEDs especially the short-wavelength blue spectral range and the long-wavelength red range are optimally covered (Fig. 3). In combination with the high-performance optical fibers and the highly-sensitive Channel Photo Multiplier intensity losses in the quantum efficiency are avoided to ensure maximum sensitivity. Due to the excitation of each single well the use of passive reference dyes is not necessary, allowing multiplexing of up to six dyes. The longevity of the LEDs makes a regular exchange of the light source superfluous and thus helps avoid recurring costs. 1.2.4 Flexible configuration with optical filter modules The patented optical system of the TOptical Thermocycler provides a filter wheel for 6 color filter modules. The filter wheel can be freely equipped with color filter modules of choice. Furthermore, the system can also subsequently be upgraded with color filter modules and so the range of applications extended. In total 10 different color filter modules are available, covering the whole range of commonly used Real-Time PCR dyes, from the blue to the red absorption spectrum, including filter modules specially optimized for FRET applications. 1.2.5 Software The TOptical Thermocycler is controlled by PC software qPCRsoft. The software is especially developed to provide ease of use and clear arrangement of functional elements. It includes the same easy spreadsheet or graphical programming function as the TProfessional Thermocycler. Information on sample is entered in a well arranged plate scheme that provides a comprehensive overview at a glance. Typical evaluation methods of the RealTime PCR such as ΔΔCt method, absolute quantification, relative quantification, allelic discrimination and efficiency calculation are already integrated. In addition, export tools for further external analysis programs like Excel, REST, qBASE and others are available and the software provides a MIQE-compliant documentation of experiments. TOptical Issue 03/2011 7 Introduction 1.3 Technical specifications TOptical Thermocycler Hardware TOptical Gradient 96 TOptical 96 Order number 070-500 070-501 Block format 96 well Sample volume 5 - 80µl Lid temperature 30 - 99°C Temperature gradient 40°C Max. Heating rate* 6.0°C/sec Avg. Heating rate* 5.0°C/sec Max. Cooling rate* 4.5°C/sec Avg. Cooling rate* 3.5°C/sec Ramp adjustment min. 0.1°C/sec Block temperature uniformity (15 sec after clock starts) ± 0.15°C at 55°C ± 0.25°C at 72°C ± 0.50°C at 95°C Control accuracy 3°C to 99.9°C Control accuracy ± 0.10°C Temperature range 3 - 99°C Temperature increments min. 0.1°C/cycle 8 Time increments min. 1 sec/cycle Heated Lid manual opening mechanism, automatic pressure application Contact pressure heated lid 10 kg, automated Control mode Remote controlled by PC No. of programs unlimited on PC Dimensions 28 cm x 38 cm x 43 cm 28 cm x 64 cm x 43 cm when opened Power supply 100V, 110V, 230V Power consumption Base unit max. 480 W, TOptical head max. 25 W Operating conditions 15°C to 35°C, max. 70% humidity, max. 2000 m height Supported plastic ware 96 well microplates with adhesive optical foil strips of 8 0.2 ml with optical lids 0.2 ml single tubes with optical lids Sensitivity 1nmol/l FAM at 30µl sample volume in a 96 well PCR plate Measuring time 96 well plate (single measurement, 6 colors) appr. 6 sec Measuring range +/- 130 000 (+/-17 bit) Light source Three long living high power LEDs (blue, white, red) Filter Filterwheel with stepping motor, 6 positions for color modules Issue 03/2011 TOptical Introduction Lightpath An array of 8 high performance optical fibers in a shuttle system directs LED light bundled by lenses to samples. The fluorescent dyes in the reaction mix are excited through from above through the lid of the tubes. The reflected light is focused by lenses and directed through optical fibers to a photomultiplier. Detector Highly sensitive channel photo multiplier (CPM) Optimal signal/noise ration by effective noise reduction (decreased SNR (signal/noise ratio)-technology) Color modules 6 color modules for all commonly used Real-Time PCR dyes 4 FRET filter combinations: TOptical filter module 1 (470nm/520nm) TOptical filter module 2 (470nm/545nm) TOptical filter module 3 (535nm/580nm) TOptical filter module 4 (565nm/605nm) TOptical filter module 5 (630nm/670nm) TOptical filter module 6 (660nm/705nm) TOptical FRET module 1 (470nm/580nm) TOptical FRET module 2 (470nm/670nm) TOptical FRET module 3 (470nm/705nm) TOptical FRET module 4 (515nm/670nm) Software qPCRsoft Control and analysis software Analysis methods Absolute quantification, relative quantification, Ct method, allelic discrimination, efficiency calculation Export functions Excel, REST, qBASE Security Administrator function MIQE-compliant sample documentation * According to Biometra standard procedure. ** Capacity increases to 35 x 0.5 ml tubes by use of small cap tubes TOptical Issue 03/2011 9 Introduction 1.4 Legal Notes 1.4.1 Real-Time PCR License – Legal Disclaimer Practice of the patented polymerase chain reaction (PCR) process requires a license. The Biometra [or appropriate trademark] TOptical Thermocycler is an Authorized Thermocycler and may be used with PCR licenses available from Applied Biosystems. Its use with Authorized Reagents also provides a limited lincense in accordance with the label rights accompanying such reagents. This is a Licensed Real-Time Thermocycler under Applera’s United States Patent No. 6,814,934 and corresponding claims in non-U.S. counterparts thereof, for use in research and for all other applied fields except human in vitro diagnostics. No right is conveyed expressly, by implication or by estoppel under any other patent claim. 1.4.2 PCR License – Legal Disclaimer Purchase of a Biometra Thermocycler conveys a limited non-transferable immunity from suit for the purchaser’s own internal research and development and applied fields other than human in vitro diagnostics under one or more of US Patents Nos. 5,038,852, 5,656,493, 5,333,675, 5,475,610, and 6,703,236, or corresponding claims in their non-US counterparts, owned by Applera Corporation. Further information on purchasing licenses may be obtained by contacting the Director of Licensing, Applied Biosystems, 850 Lincoln Centre Drive, Foster City, California 94404, USA. Biometra biomedizinische Analytik GmbH Rudolf Wissell Str. 30 37079 Goettingen, Germany 1.4.3 Copyright All rights reserved. It is not allowed to copy and publish the manual or parts of it in any form as copies, micro film or other methods without a written authorisation from Biometra. Biometra is pointing out that applied company and brand names are usually protected trade marks. 1.4.4 Liability Biometra is not liable for damages and injuries caused by use not considering these operating instructions in parts or completely. 1.4.5 Meaning of the instructions Biometra recommends that you first read these instructions carefully. This operation instruction is part of the product and should be kept over the full life-time of the instrument. It should also be forwarded to subsequent owners and users. Make sure that additions and updates are inserted into the operation instructions. 10 Issue 03/2011 TOptical Safety and Warning Notices 2 Safety and Warning Notices 2.1 Definition of Symbols Symbol Definition Caution! Refer to instruction manual! Danger! High voltage! Danger! Risk of violent pressure Fragile! Danger! Hot surface! 2.2 General Safety Instructions Please read this manual carefully before starting operation of the TOptical Thermocycler. The TOptical Thermocycler is intended for sample incubation at varying temperatures. General safety precautions for laboratory work must be observed when working with the TOptical Thermocycler. The TOptical does not produce a sound power level that could be hazardous for the user. DANGER! HOT SURFACE! The thermoblock and the heated lid will reach high temperatures during operation. Both thermoblock and heated lid can burn you. Rapid heating of the thermoblock can cause liquids to boil explosively. Always wear safety goggles during operation. Close the lid before starting a program. Do not heat samples without having the lid locked securely. Be aware that samples are reaching high temperatures. Do not touch or open hot tubes or microplates because hot liquid may quickly spill out. Do not touch the heated lid. Use only suited plastic ware in the TOptical Thermocycler. Tubes and plates must show good fit when placed in the thermoblock. Only use tubes that are suited for high temperatures (tight lids). TOptical Issue 03/2011 11 Safety and Warning Notices CAUTION! INJURY OF THE HAND! Be aware that after program start the heated lid automatically moves down and applies a high pressure. Do not place fingers between lid and housing when opening or closing the lid. DANGER! HIGH VOLTAGE! The TOptical Thermocycler contains no user serviceable parts. Do not open the instruments housing. Service and repair may only be carried out by the Biometra Service department or otherwise qualified technical personal. Do not use the instrument when damages of the housing, block, cable or other parts are visible. Prior to connecting the unit to the power source please ensure that the voltage selector at the bottom of the instrument is set to the required voltage. Make sure that the main supply voltage is in accordance with the label above the power connection (see section 4.2). Unplug the power cable before you open the TOptical Thermocycler. Danger of electric shock! Connect the TOptical Thermocycler to a grounded socket. SWITCHING OFF THE DEVICE IN THE EVENT OF DANGER! Make sure that the appliance connector and the plug of the supply cord are accessible, so you can separate the instrument from the mains. OPERATING SUBSTANCES, DANGEROUS SUBSTANCES Appropriate safety regulations must be observed when working with infectious, pathogenic or radioactive material. Ask the responsible local safety inspector for details. The TOptical Thermocycler must not be used with explosive, flammable or volatile liquids. When only few samples are put in the block place additional tubes in the four corner positions. This is to evenly distribute the lid pressure and prevents single tubes from excessive pressure. Use of few tubes may result in damage of the tubes by excessive pressure. PRECAUTIONS IN THE OPERATION Do not move the instrument during operation. It is not necessary to apply oil into the opening of the block in order to improve the heat transfer between the block and the sample tubes. If you still decide to use oil, do not use silicon oil. Mineral oil may be used. Ensure that both the rear and bottom ventilation slits not clogged by dust or other material. Danger of overheating! Let equilibrate the TOptical Thermocycler to room temperature before starting operation. There must be sufficient distance between the ventilation slots on the rear of the Thermocycler and a wall or another instrument (min 10 cm). Danger of overheating! Place the TOptical Thermocycler on a stable, non flammable surface in a dry, safe environment. For details see working conditions in table "Technical specifications” (see chapter 1.3). CAUTION! PROFESSIONAL CLEANING! Do not use alcohol (e.g. methanol, ethanol), organic solvents or abrasives to clean the instrument. 12 Issue 03/2011 TOptical Safety and Warning Notices CAUTION! DAMAGES AT THE TRANSPORT! For transports always use the original Biometra box. This instrument is designed and certified to meet EN 61010-1 safety standards. It should not be modified or altered in any way. Alteration of this instrument will void the warranty, void the EN61010-1 certification, and create a potential safety hazard. TOptical Issue 03/2011 13 Installation 3 Installation 3.1 Content of delivery 1. TOptical Thermocycler 2. Mains connector 3. 24V mains adapter for TOptical module 4. USB cable 5. Manual Please keep the original transport box for return shipment in case of servicing. The TOptical shipping box provides a specially developed system for contact-free transport of this electronic device. Not included in delivery is a PC to control the TOptical Thermocycler by the software qPCRsoft. The software has the following minimal hardware requirements: 3.2 CPU Pentium IV, 1GHz RAM 256 MB RAM Hard drive 40 GB HDD Ports USB 2.0 Unpack and check Unpack and carefully examine the instrument. Report any damage to Biometra. Do not attempt to operate this device if physical damage is present. Please keep the original packing material for return shipment in case of service issues. WICHTIG! GARANTIEKARTE AUSFÜLLEN! Please fill out and send back the warranty registration card. This is important for you to claim full warranty. 3.2.1 14 Installation conditions Place the TOptical Thermocycler on a stable surface in a dry, safe environment. For details see working conditions in table "Technical specifications” (see chapter 1.3). Let equilibrate the TOptical Thermocycler to room temperature before starting operation (1 to 6h). Make sure that the appliance connector and the plug of the supply cord are accessible, so you can separate the instrument from the mains. Make sure that the ventilation slots on the bottom and the rear are not obstructed (see section 4.2). Make sure that there is no object underneath the thermocycler that may block the ventilation slots at the bottom (e.g. a piece of paper etc.) There must be sufficient distance between the ventilation slots at the rear of the Thermocycler and a wall or another instrument (min 10 cm). Issue 03/2011 TOptical Installation CAUTION! OVERHEATING OF THE INSTRUMENT! Ensure that both the side and bottom ventilation slits of the rear and bottom of the instrument are unobstructed. Insufficient ventilation can cause overheating of the instrument. Make sure that the main supply voltage is in accordance with the label above the power connection (see section 0) Connect the TOptical Thermocycler to a grounded socket. DANGER OF ELECTRIC SHOCK! Prior to connecting the unit to the power source please ensure that the voltage selector at the back side of the instrument is set to the required voltage. Unplug the power cable before you open the TOptical Thermocycler. 3.3 The display contrast can be adjusted to local light conditions (0). Operation Voltage DANGER OF ELECTRIC SHOCK! Prior to connecting the TOptical to the mains, make sure that the setting of the Voltage selector is in accordance with your mains Voltage. The TOptical Thermocycler can operate at 100, 115 or 230 Volt. The operation Voltage is shown on the Voltage selector which is located at the instrument bottom. 1. To change operation Voltage of the TOptical, switch off the instrument and disconnect the mains plug. 2. Use a coin or another round shape item to turn the adjustment slot of the Voltage selector to the new Voltage. Instrument bottom Instrument backside Voltage indicator Mains plug 230 11 5 Fuses 110 Fuses Adjustment slot Fig. 4 TOptical 1 Power switch 2 Voltage selector and fuse holder Issue 03/2011 15 Installation 3.4 Initial self test After switching on the TOptical the serial number of the instrument and the software version are displayed. A log file of the power on self test is stored in the Thermocycler memory (see section 13.4.1). 16 Issue 03/2011 TOptical Operating elements 4 Operating elements 4.1 The TOptical Thermocycler front view Fig. 5 TOptical TOptical front view Issue 03/2011 17 Operating elements 4.2 The TOptical Thermocycler rear view Fig. 6 4.3 TOptical rear view The TOptical control panel Menue Buttons Keypad LED Block status Start Stop Soft Keys Back Fig. 7 Navigation TOptical control panel Note All settings for a Real-Time PCR experiment can only be done within the software qPCRsoft. 18 Issue 03/2011 TOptical Operating elements 4.4 The TOptical lid To achieve optimum pressure on the tubes the TOptical is equipped with an automatic height adjustable heated lid. Close the lid After the samples have been placed in the block close the lid. After a program is started the lid automatically applies pressure on the plastic ware. IMPORTANT The pressure of the lid has been optimized for a fully loaded block. If only very few tubes are loaded to the block you should place dummy tubes in the four corner positions to avoid damage of tubes by excessive pressure. Open the heated lid Wait until the program is finished. Press the cover lock button at the front side of the TOptical module (Fig. 5) and tilt the lid to the backside. TOptical Issue 03/2011 19 qPCRsoft Software 5 qPCRsoft qPCRsoft Software Using the qPCRsoft Software PCR and real-time PCR experiments can be created and executed with the TOptical thermocycler. This chapter describes the basic design and structure of the software control elements. 5.1 The qPCRsoft main window The qPCRsoft main window is divided into the following areas (see Fig. 8): Area Function MENU BAR (1) The menu bar includes various menu items, for example to open, edit and save projects, to manage user profiles, to configure basic software options and a help function. TOOLBAR (2) In the toolbar commands for editing projects are arranged. The commands available in the toolbar change dependent on context. PROJECT Expandable menu items in the project explorer provide a quick overview of the most relevant information on the project open at the time. PROJECT Projects are edited in the project interface. As soon as a new project is created or an existing project loaded, a window opens where all relevant configurations for the project can be made. EXPLORER (3) INTERFACE (4) Fig. 8 20 Main window of the qPCRsoft software. Issue 03/2011 TOptical qPCRsoft 5.1.1 qPCRsoft Software Individual items in the menu bar The menu bar in the main window of the qPCRsoft software includes static and variable menu items. Whereas the static menu items are always displayed, the variable menu items can be selected dependent on the context. The static part includes the following items: Fig. 9 Static menu items of the menu bar in the qPCRsoft main window The arrow indicates the area where the variable menu items are shown. The variable menu items are always shown between "VIEW" and "EXTRAS", thereby expanding the menu bar (see Fig. 9). If an item is selected an extended menu with individual commands opens. Selection is possible either by left mouse click or using keyboard commands. For their use a combination of the keys [Alt+letter] must be pressed. The respective letters for activating a menu item are underlined in the table below. Static part Menu item FILE Command Function NEW Opens a new project. OPEN TEMPLATE Opens a template (RTSettings file (*.rts)). OPEN PROJECT Opens a project (RTProject file (*.rtp)). SAVE TEMPLATE Saves a template file (RTSettings file (*.rts)) in the qPCRsoft standard folder. SAVE TEMPLATE AS... Saves a template file (RTSettings file (*.rts)) in any userselected folder. EDIT VIEW TOptical SAVE PROJECT Saves a project file (RTProject file (*.rtp)) in the qPCRsoft standard folder. SAVE PROJECT AS... Saves a project file (RTProject file (*.rtp)) in any userselected folder. CLOSE Closes a template or a project. CLOSE ALL... Closes all open projects or templates. PRINT Prints a project. EXIT Closes the software. UNDO Reverses the last modification (up to 10 steps). REDO Restores the last deleted item (up to 10 steps). CUT Cuts a marked area. COPY Copies an active and/or marked area. PASTE Pastes an area copied to the clipboard. DELETE Deletes an active and/or marked area. MARK ALL Marks a complete area. USER MANAGEMENT Opens the user management window. SIGNATURES Opens the window for managing digital signatures of projects. PROJECT EXPLORER Switches the project explorer view in the main window on or off. Issue 03/2011 21 qPCRsoft Software EXTRAS WINDOW HELP qPCRsoft TOOLBAR Switches the toolbar view in the main window on or off. INITIALIZATION Resets the connected device to the initial state. EDIT COLOR MODULES Opens the window for configuring the system with color filter modules. DEVICE UPDATE Activates the connected device OPTIONS... Opens the window for general basic software settings. TILE HORZ Arranges project windows horizontally. TILE VERT Arranges project windows vertically. CASCADE Arranges project windows in a cascaded fashion. CONTENT Opens the table of contents of the help function. INFO Displays software information. Variable part Menu item CYCLER Command Function ADD EMPTY STEP Adds a new step DELETE STEP Deletes a step ACTIVATE MELTING Adds a step for the melting curve definition CURVE COLOR LAYOUT MONITORING ABSQUANT CUT STEP Cuts a step and copies it to the clipboard COPY STEP Copies the parameters in a step to the clipboard PASTE STEP Insert a copied step SET COLOR COMPENSATION Opens the window for creating files for spectral color compensation. EDIT LAYOUT Edit sample table COPY LAYOUT Copy an area of the sample table PASTE LAYOUT Insert the copied area of the sample table PREVIEW LAYOUT Detailed view of the plate assignment START QPCR RUN Start the PCR run STOP QPCR RUN Stop the PCR run PAUSE QPCR RUN Pause the PCR run DISPLAY OPTIONS Display options for the product accumulation curves ADD ABS. Create new analysis QUANTIFICATION DELETE ABS. [!] Delete analysis QUANTIFICATION 22 Issue 03/2011 TOptical qPCRsoft qPCRsoft Software OPTIONS ABS. QUANTIFICATION Opens a window for the basic configurations for the analysis AUTOM. THRESHOLD Automatic determination of the fluorescence threshold for detecting Ct values IMPORT STANDARD Import a saved standard curve CURVE RELQUANT Create new analysis ADD REL. QUANTIFICATION DELETE REL. [!] Delete analysis QUANTIFICATION OPTIONS ABS. QUANTIFICATION Opens a window for the basic configurations for the analysis AUTOM. THRESHOLD Automatic determination of the fluorescence threshold for detecting Ct values IMPORT STANDARD Import a saved standard curve CURVE DELTADELTACT Create new analysis ADD DDCT QUANTIFICATION DELETE DDCT Delete analysis OPTIONS DDCT. Opens a window for the basic configurations for the analysis QUANTIFICATION [!] QUANTIFICATION MELTCURVE AUTOM. THRESHOLD Automatic determination of the fluorescence threshold for detecting Ct values ADD MELTING CURVE Create new analysis DELETE MELTING CURVE Delete analysis CURVE Opens a window for the basic configurations for the analysis AUTOM. THRESHOLD Determine threshold automatically OPTIONS MELTING 5.1.2 Toolbar commands The toolbar is divided into a general and a variable part (Fig. 10). The individual areas are separated visually by vertical line. Whereas the commands of the general part are static in display, the commands in the variable part of the toolbar change dependent on the context. At the same time with the change of the toolbar an additional menu item is shown in the menu bar (see section 5.1.1) which also allows for the corresponding commands to be selected. Dependent on the context, it is not always possible to use all commands. Inactive commands are grayed out at the time. Fig. 10 Organization of the toolbar The toolbar can be moved freely within the main window of the software. To do so position the mouse pointer onto the handle and move the toolbar whilst holding the left mouse button TOptical Issue 03/2011 23 qPCRsoft Software qPCRsoft pressed. The subsequent position is displayed in the shape of a gray outline. If the margins of the main window are reached when moving the bar, an additional directional arrow is shown. The bar is then placed appropriately at the margin of the window and held in place. To place the toolbar at the desired position release the mouse button. The toolbar includes a collection of commands for editing projects. To select a command the mouse pointer must be positioned above the respective button. The respective selected button is shown highlighted in blue. With prolonged mouse-over on a button a brief functional description of the command is shown. The table below provides a list of the available commands. Icon Command Keyboard command Function GENERAL NEW [Ctrl +N] Opens a new project. OPEN TEMPLATE [Ctrl+O] Opens a template SAVE TEMPLATE [Ctrl+S] Saves a template OPEN PROJECT Opens a project SAVE PROJECT Saves a project PRINT PROJECT [Ctrl+P] Prints a project UNDO Reverses the last change made REDO Restores the last deleted change CUT [Ctrl+X] Cuts a selected area COPY [Ctrl+C] Copies an active or selected area PASTE [Ctrl+V] Inserts an area copied to the clipboard DELETE [Ctrl+Del] Deletes an active or selected area PCR protocol ADD EMPTY STEP Adds a new step DELETE STEP Delete a step CUT STEP Cuts a step and copies it to the clipboard COPY STEP Copies the parameters in a step to the clipboard PASTE STEP Insert a copied step COLOR Opens the window for creating files for spectral color compensation EDIT COLOR COMPENSATION Samples 24 EDIT LAYOUT Edit sample table COPY LAYOUT Copy the area of the sample table Issue 03/2011 TOptical qPCRsoft qPCRsoft Software PASTE LAYOUT Insert the copied area of the sample table PREVIEW LAYOUT Detailed view of the plate assignment MONITORING Start the PCR run START PCR PROTOCOL STOP PCR PROTOCOL Stop the PCR run PAUSE PCR Pause the PCR run PROTOCOL Display options for the product accumulation curves OPTIONS ANALYSIS/ABSOLUTE QUANTIFICATION NEW Create new analysis DELETE Delete analysis OPTIONS Opens a window for the basic configurations for the analysis AUTOMATIC THRESHOLD Automatic determination of the fluorescence threshold for detecting Ct values IMPORT STANDARD Import a saved standard curve CURVE Analysis/Relative quantification NEW Create new analysis DELETE Delete analysis OPTIONS Opens a window for the basic configurations for the analysis AUTOMATIC THRESHOLD Automatic determination of the fluorescence threshold for detecting Ct values IMPORT STANDARD Import a saved standard curve CURVE ANALYSIS/ΔΔCT ANALYSIS NEW Create new analysis DELETE Delete analysis OPTIONS Opens a window for the basic configurations for the analysis AUTOMATIC Automatic determination of the fluorescence threshold for detecting Ct values THRESHOLD ANALYSIS/MELTING CURVE TOptical NEW Create new analysis DELETE Delete analysis Issue 03/2011 25 qPCRsoft Software qPCRsoft OPTIONS Opens a window for the basic configurations for the analysis AUTOMATIC Determine threshold automatically THRESHOLD 5.1.3 Project explorer components In the project explorer various expandable menu items are available for selection ensuring a quick overview on the currently edited project. Individual projects can be selected via a selection list. The information displayed for the individual menu items can be shown or hidden by clicking on [+] or [–] . Fig. 11 1 Selection list 2 Menu item 3 Show/hide information Organization of the project explorer Menu item Information GENERAL Project title, user, date and time THERMAL Graphical display of the progress of the PCR program in the active project CYCLER 5.1.4 SCAN Overview which colors and which area are being scanned LAYOUT Displays brief info on the plate layout. In the editing mode for the plate layout detailed information on the selected well is displayed ABS. QUANT. Graphical display of Ct compared to concentration logarithm REL. QUANT. Graphical display of Ct compared to concentration logarithm DELTADELACT Graphical display of ΔΔCt(V) compared to concentration logarithm MELTING CURVE Graphical display of melt curve compared to temperature Project interface After starting the program the project interface is initially empty. A project window is only opened once a new project is created or a saved project or template loaded (see section 8.1). 26 Issue 03/2011 TOptical qPCRsoft Menu bar 6 Menu bar 6.1 File 6.1.1 New With the function "NEW" or [Ctrl+N] a new project window (see section 8.1) is opened and shown in the project interface (Fig. 8). Any number of project windows can be created. 6.1.2 Open template For repeated experiments the basic configurations can be saved in the form of templates (see section 8.9). A saved template can be opened using the function "OPEN TEMPLATE". To do so the desired "*.rts" file must be selected in the window "OPEN" and the selection confirmed with the button "OPEN". Note Templates are saved by default in the folder "MY DOCUMENTS", but any other suitable folder may also be used. The qPCRsoft software always accesses the folder last used. 6.1.3 Open project Experiments including software configurations and results are saved in project files. A saved project can be opened using the function "OPEN PROJECT". To do so the desired "*.rtp" file must be selected in the window "OPEN" and the selection confirmed with the button "OPEN". Note Projects are saved by default in the folder "MY DOCUMENTS", but any other suitable folder may also be used. The qPCRsoft software always accesses the folder last used. 6.1.4 Save template / Save template as.. The menu items "SAVE TEMPLATE" and "SAVE TEMPLATE AS..." are initially inactive after starting the qPCRsoft software and shown grayed out. The menu items are only available once a new project has been created or an existing project or existing template loaded and changes made. The command "SAVE TEMPLATE" saves changes in an existing template. However, if a new template is created or an existing template to be saved under a new name, the command "SAVE TEMPLATE AS..." must be used and the storage location and name of the file defined in the window "SAVE AS...". Templates are generally saved as "*.rts" files. TOptical Issue 03/2011 27 Menu bar 6.1.5 qPCRsoft Save project / Save project as... The menu items "SAVE PROJECT" and "SAVE PROJECT AS..." are initially inactive after starting the qPCRsoft software and shown grayed out. The menu items are only available once a new project has been created or an existing project or existing template loaded and changes made. The command "SAVE PROJECT" saves changes in an existing project. However, if a new project is created or an existing project to be saved under a new name, the command "SAVE PROJECT AS..." must be used and the storage location and name of the file defined in the window "SAVE AS...". Projects are generally saved as "*.rtp" files. 6.1.6 Close/Close all With the function "CLOSE" the currently active project window in the project interface (see Fig. 8) can be closed. With the function "CLOSE ALL" all project windows are closed simultaneously. If unsaved changes were made in one of the project windows, a window with the confirmation prompt "PROJECT ... IS CHANGED. SAVE?" appears. In the confirmation prompt the name of the corresponding project is stated and three buttons with different functions are available: Button Function YES Opens the window "SAVE PROJECT AS" (see section 6.1.5) NO Closes the project window without saving the changes CANCELExits the function "CLOSE" or "CLOSE ALL". No project window is closed. 6.1.7 Print Using the function "PRINT" projects can be printed. 6.1.8 Exit With the function "EXIT" the qPCRsoft software is closed. If there are still unsaved projects in the project interface, a confirmation prompt is shown as in the function "EXIT" (see section 6.1.6). 6.2 Edit The commands "CUT, COPY, PASTE, DELETE and MARK ALL" of the menu item "EDIT" are only active if in the project window under "SETTINGS" the tab "GENERAL" has been selected. Otherwise the commands are inactive and grayed out. The commands "UNDO" and "REDO" are only active if changes have been made in the project. 28 Issue 03/2011 TOptical qPCRsoft 6.2.1 Menu bar Undo The qPCRsoft software logs changes to projects. These can be reversed, restoring the original state. With the function "UNDO" the last change or, if the command is used repeatedly, the most recent changes can be reversed. 6.2.2 Redo The qPCRsoft software can restore changes to projects. If a change has been reversed using the function "UNDO", it can be restored using the function "REDO". If the command is used repeatedly, the most recent changes are restored. 6.2.3 Cut To cut a section of text it must first be selected by holding down the left mouse button. The corresponding text section is then cut using the function "CUT" or the key combination [CTRL+X] and sent to the clipboard. 6.2.4 Copy To copy a section of text it must first be selected by holding down the left mouse button. The corresponding text section is then copied using the function "COPY" or the key combination [CTRL+C] and sent to the clipboard. 6.2.5 Paste If cut or copied text sections are in the clipboard, they can be inserted at any location. To do so first the cursor must be positioned at the location where the text is to be inserted, using the left mouse button. With the function "PASTE" or the key combination [CTRL+V] the content of the clipboard is inserted at the cursor position. 6.2.6 Delete To delete a section of text it must first be selected by holding down the left mouse button. The corresponding text section is then deleted using the function "DELETE" or the key combination [CTRL+DEL]. The deleted data are not saved to the clipboard, but the change can be reversed using the function "UNDO" (see section 6.2.1). 6.2.7 Mark all With the function "MARK ALL" a whole section of text can be selected. The selected text can then be further edited. TOptical Issue 03/2011 29 Menu bar 6.2.8 qPCRsoft User management With the user management various users can be defined and have rights assigned to them. The corresponding window provides an overview of the users created in the qPCRsoft software, their assignment to user groups, and displays the date of the latest change of the configurations (see Fig. 12): Fig. 12 User management window At the bottom the window has various buttons to manage user profiles: Button Administrator ADD Add user EDIT Edit user profile DELETE Delete user OK Close the window and accept the entries/configurations CANCEL Close the window without accepting the entries/configurations Three user groups are differentiated in principle and have different rights assigned to them: Group Administrator User with general rights User with simple rights Create/delete user x - - Configure/save project x x - Load project x x x Start project x x x Only the administrator can create new users or delete existing ones or configure user rights. To create a new user the button [ADD] in the window for the user management must be pressed. The window that opens is divided into the tabs "General" and "PASSWORD" (see Fig. 13): 30 Issue 03/2011 TOptical qPCRsoft Menu bar Tab "GENERAL" Fig. 13 Tab "PASSWORD" Window for editing user profiles In the tab "GENERAL" the user name used in the software, the name of the user and a description can be entered. Via the selection list "USER GROUP" the user can be assigned to a group with corresponding rights. In the tab "PASSWORD" a password can be defined for the user and additional configurations can be defined via checkboxes. Checkbox Function USER MUST CHANGE PASSWORD AT NEW The user password must be changed each time he want to log in LOGIN USER MAY CHANGE PASSWORD The user may change his password PASSWORD HAS NO TIMEOUT The password does not expire after a defined period of time USER IS DEACTIVATED The user is deactivated USER IS LOCKED The user is locked out With [OK] the entries and configurations made are confirmed, and with [CANCEL] they are discarded. Subsequent changes are possible using the function "EDIT". To do so the corresponding user must be selected in the window for user management and the selection confirmed using the button "EDIT" (see Fig. 12). The desired changes can be made in the window that opens (see Fig. 13). A user profile can be deleted using the function "DELETE". 6.2.9 Signatures The menu "SIGNATURES" is initially inactive after starting the qPCRsoft software and grayed out. The menu item is only available once a new project has been created or an existing project or existing template loaded. The corresponding window is divided into a display area for the logged in user and a selection list for the project status or additional comments (see Fig. 14, left). TOptical Issue 03/2011 31 Menu bar qPCRsoft "SIGNATURE" window Fig. 14 Login dialog Window for editing signatures (left) incl. corresponding login dialog (right). After opening the window for editing signatures the respective editor must first log in. Using the button "LOGIN" the login dialog is opened (see Fig. 14, right). The entries for the user name and password must be confirmed in the login dialog with [OK]. After successful login the login dialog is closed and the user name and the group to which the user belongs are displayed in the window "SIGNATURES" (see Fig. 14, left). The logged in user can select various states via a selection list and enter additional comments for them. The following states are available: Status Document viewed Document approved Document in progress Document rejected The entries must finally be confirmed with [OK]. 6.3 View 6.3.1 Project explorer The project explorer is shown at the left margin of the main window of the qPCRsoft software (see Fig. 8). The project explorer provides a brief summary of the key configurations and analyses (see section 7). The project explorer can be shown or hidden via the menu function. Dependent on its state the correspondent menu item is shown with or without blue highlighting. 6.3.2 Toolbar The toolbar is displayed below the menu bar in the main window of the qPCRsoft software (see Fig. 8). The toolbar includes functions for editing projects. The toolbar can be shown or hidden via the menu function. Dependent on its state the correspondent menu item is shown with or without blue highlighting. The toolbar can be moved freely within the main window. To do so position the 32 Issue 03/2011 TOptical qPCRsoft Menu bar mouse pointer on the handle (see Fig. 10) and move the toolbar whilst holding the left mouse button pressed. The subsequent position is displayed in the shape of a gray outline. If the margins of the main window are reached when moving the bar, an additional directional arrow is shown. The bar is then placed appropriately at the margin of the window and held in place. To place the toolbar at the desired position release the mouse button. 6.4 Extras 6.4.1 Initialization During every start-up a routine query determines the state of the connected device. During this initialization all system components are checked and moved into their starting positions. If an error occurs during running operation, preventing the device from continued operation, the original state of the device can be restored via the menu item "INITIALIZATION". 6.4.2 Edit color modules In the window "EDIT COLOR MODULES" the color filter modules available at the device are managed. In the window new color modules can be registered in the system or inserted color modules deregistered again (see Fig. 15). Fig. 15 Window to configure the device with color filter modules To register a new color module the corresponding position of the filter wheel must first be selected and then the module code entered. The module code is supplied together with the color module. After confirming the entries with [ADD] the color filter module has been registered in the software and is listed in the left-hand display area of the window. With the functions [EDIT] or [DELETE] it is possible to modify or delete installed color filter modules. Dyes can be stored for every installed color filter module. For this purpose the checkbox "PROPERTIES" must be enabled. The dye is entered in the corresponding field and assigned using the [+] button. The dyes assigned to the color filter module are listed in the window at the bottom right. TOptical Issue 03/2011 33 Menu bar qPCRsoft Button Function Add dye Accept changes Remove dye For dyes entered the name can be modified in the input field and assigned using the button [ACCEPT] . With the [-] button dyes can be deleted. With the function "BACK TO STANDARD MODULES" the original state can be restored. 6.4.3 Update device With the device update the connected device type can be determined. Dependent on the connected device type different software options, such as the option to program temperature gradients, are offered. 6.4.4 Options Via the item [OPTIONS] a window opens where general basic configurations of the software are carried out. The window is divided into six different tabs: Tab Function GENERAL Used to define general configurations. DATA FORMAT The number format can be changed between the European and the American version. In the European version a dot is used as separator for 1000s and a comma as decimal point (e.g. 1.980,00), in the American version a comma is used as separator for 1000s and a dot as decimal point (e.g. 1,980.00). LANGUAGE Via a selection list the language used in the software can be configured. Currently English or German are available. MEASUREMENT For the measuring sensitivity it is possible to select from "LOW", "MEDIUM" and "HIGH". 6.5 ANALYSIS For the automatic calculation of the threshold value in the quantification or during the melting curve analysis, a factor between 1 and 10 can be configured as multiple of x of the height of the base line. Device The qPCRsoft software can log and save the data traffic between the PC and the software. For this purpose a tick must be placed in the checkbox "SAVE DATA TRAFFIC" and a target folder selected. Either a path can be entered in the corresponding input field or a folder selected as storage . .location after pressing the button Window The menu item "WINDOW" unites commands that allow manipulating the layout of project windows in the project interface. Changes can only be made in the respective active window. 34 Issue 03/2011 TOptical qPCRsoft 6.5.1 Menu bar Tile horizontal In the horizontal layout the project windows are shown below each other. Dependent on their number they are additionally arranged in two columns next to each other for more than 4 project windows. 6.5.2 Tile vertical In the vertical layout the project windows are shown next to each other. For more than 4 project windows they are additionally divided into two columns. 6.5.3 Cascade In the cascading layout the project windows are placed on top of each other with an offset. 6.6 Help 6.6.1 Contents Opens a window with a help function for the software. The help can be searched using a key word or the table of contents. 6.6.2 Info The Info window displays various information on the qPCRsoft software, such as the version number. TOptical Issue 03/2011 35 Project explorer qPCRsoft 7 Project explorer 7.1 Layout The project explorer provides an overview summary of the currently opened project. The explorer bar is arranged at the left margin of the qPCRsoft main window (see Fig. 8) and divided into three parts: Fig. 16 1 Header 2 Selection list 3 Collapsible/expandable menu items Layout of the project explorer The project explorer can be shown or hidden. A corresponding command is available in the menu bar (see section 6.3.1). To immediately hide the Explorer, the button in the header can be used. The project explorer is always permanently anchored at the left margin of the main window and cannot be moved. Via a selection list different projects can be selected. After clicking on the button with the down arrow all open projects are displayed. The selection is by left mouse click. In the project explorer various expandable menu items are available for selection ensuring a quick overview on the currently selected project. The information displayed for the individual menu items can be shown or hidden by clicking on [+] or [–] . 7.1.1 General In the area "GENERAL" information is displayed that is created under the tab "GENERAL" in the project window (see section 8.2). This is specific information on the project title, the user, the date and the time: Fig. 17 7.1.2 Menu item "GENERAL” of the project explorer Thermal cycler Under "THERMOCYCLER" the temperature progression of the PCR protocol and the temperature of the heated lid are plotted against time. The temperature of the heated lid is displayed as a red line, the block temperature as a blue line. 36 Issue 03/2011 TOptical qPCRsoft Project explorer Fig. 18 Menu item "THERMOCYCLER” of the project explorer The progression of the lines is derived from the entries in the tab "THERMOCYCLER" of the project window (see section 8.3). 7.1.3 Scan The menu item "SCAN" combines all scan settings that have been made in the tab "SCAN" of the project window (see section 8.4.1). For this purpose all color filter modules installed are displayed in accordance with their position (P0 to P5) on the filter wheel and the wavelengths of the excitation and emission filters (see section 6.4.2). The dyes assigned to the filters are specified in the form of a three letter code. Fig. 19 Menu item "SCAN” of the project explorer Dyes for which the fluorescences are measured during operation are highlighted using a green diamond. For dyes that are not measured the information is listed in the color filter module, but the green diamond is not placed. In addition the measuring range, i.e. the corresponding columns in which the measurements are carried out, is specified. The default configuration is a measuring range from column 1 to column 12, but the scanning range can be manually modified in the tab Scan (see section 8.4.1). 7.1.4 Layout The display in the area "LAYOUT" changes context-dependent with the tab opened in the project window. a) In the monitoring mode and for all analyses a plate layout with 96 wells is displayed. By selecting or deselecting positions the fluorescence accumulation curves of the corresponding samples are shown or hidden in a graphic form in the project window. TOptical Issue 03/2011 37 Project explorer Fig. 20 qPCRsoft Menu item "SAMPLES” of the project explorer Individual positions can be selected or deselected by left mouse click. For selected positions the circle is displayed with red infill, for deselected positions with white infill. By dragging with the left mouse button depressed an area can be selected and thereby all positions within the selection selected or deselected. Within the selected area the positions are filled in yellow. In the example below the positions A12 and B12 or only A12 have been selected. Corresponding the product accumulation curve is only shown for the two samples A12 and B12 or only for sample A12: Active positions "Samples" view Display of the product accumulation curves A12 and B12 A12 This type of selection applies to all graphical representations of the product increase in the areas Monitoring and Analyses in the project window. b) When opening the layout view of the tab "SAMPLES" of the project window (see section 8.8) the view changes in the menu item "Samples" in the project explorer. The detailed information for the sample is displayed that is at the corresponding position in the layout view and above which the mouse pointer is positioned. The display provides a summary of information that is also summarized in the layout preview (see section 8.8.3) but restricted to a single sample. As detailed information the sample position, the group it belongs to, its name, the sample type, the name of the genes in the sample and the corresponding dyes are displayed. The example below shows the view in the menu item "SAMPLES" if the mouse pointer is positioned over position A12 of the layout view in the project window: 38 Issue 03/2011 TOptical qPCRsoft Project explorer Active positio n "LAYOUT" view Layout view A1 7.1.5 Absolute quantification For the absolute quantification the standard curve for the target gene selected in the tab "ABS. QUANT." (see section 10.1.3) in the project window is displayed. The Ct values of the standard samples are plotted against the logarithm of their concentration: Fig. 21 7.1.6 Menu item "ABSOLUTE QUANTIFICATION” of the project explorer Relative quantification For the relative quantification the standard curves for the target genes selected in the tab "REL. QUANT." (see section 10.2.3) in the project window are displayed. The Ct values of the standard samples are plotted against the logarithm of their concentration: TOptical Issue 03/2011 39 Project explorer Fig. 22 7.1.7 qPCRsoft Menu item "RELATIVE QUANTIFICATION” of the project explorer DeltaDeltaCt For the ∆∆Ct calculation validation curves can be created. For this purpose the average Ct value of the target gene is subtracted from the average Ct value of the reference gene for the respective dilution level and the resulting dCT(V) value plotted graphically against the concentration logarithm. As result the validation curves for the target genes selected in the tab "DELTADELTACT" (see section 10.3.3) in the project window are displayed: Fig. 23 Menu item "DeltaDeltaCt” of the project explorer The gradient of the line should not exceed a value of ± 0.1. The basic assumption then applies that the efficiencies of the amplification of the target gene and reference gene are identical and the calculation of the ΔΔCt values produces valid data. 7.1.8 Melting curve For the determination of the melting curve the first derivation of the calculated fluorescence values (ddRn/dT) is plotted graphically against the temperature (°C). The calculated peak of a curve indicates the melting temperature Tm of the respective PCR product. 40 Issue 03/2011 TOptical qPCRsoft Project explorer Fig. 24 TOptical Menu item "MELTING CURVE” of the project explorer Issue 03/2011 41 Creating a project 8 qPCRsoft Creating a project The qPCRsoft software saves all experiments in project files. A project contains various information required for the execution of a real-time PCR experiment. In detail these are a description of the experiment, PCR protocol, scanning configuration of the optical system, the plate assignment with detailed information on each sample and, after the experiment has been executed, the measuring results and corresponding analyses. All relevant information required to start a real-time PCR experiment is combined in the tab "GENERAL" (see section 8.1). This chapter describes the creation of a new project without template. 8.1 Open a project window To create a project a project window must be open. A project window is opened if a new project is created or an existing project is loaded. Various options are available to open or load a project: Command Location and function [CTRL +N] Key combination "NEW" Icon "NEW" in the toolbar (see section 5.1.2) or in the menu item File (see section 5.1.1) Icon "OPEN PROJECT" in the toolbar (see section 5.1.2) or in the menu item File (see section 5.1.1) After a new project has been created or loaded, a project window is displayed in the project interface. Several project windows can be opened simultaneously in the project interface: The layout of the project windows can be defined using the menu function "WINDOW" (see section 5.1.1 and section 6.5). The project windows can be displayed in the interface next to each other, above each other or offset behind each other. Command Function Arrange horizontally Arrange vertically Cascading The project window is divided into two levels with tabs and a variable display area (see Fig. 25). The tabs in the first level are fixed and are always displayed. The function of the tabs in the second level is variable and depends on which tab of the first level has been activated. In the first level of the tabs the following functions are available: Tab Function SETTINGS Contains all functions required for the definition of real-time PCR runs MONITORING Contains various tools for monitoring real-time PCR runs ANALYSIS 42 Includes the analysis algorithms implemented in the software for the analysis of data obtained Issue 03/2011 TOptical qPCRsoft Creating a project Fig. 25 1 Tabs of the 1st level 2 Tabs of the 2nd level 3 Variable display area Project window All functions required for creating a new project are combined in the tab "SETTINGS". The tab "SETTINGS" has additional tabs of the second level assigned to it: Tab Function GENERAL Permits the entry of general information and comments. THERMAL Used to program PCR protocols. CYCLER 8.2 SCAN Definition of the colors to be measured and configuration of the measuring parameters. LAYOUT Opens the sample table where detailed information on each sample can be stored and groups of experiments can be defined. General information on the project For every project general information can be saved. For every project a title and a user can be entered. Additionally, another field is available to enter comments (see Fig. 25). For easier editing of the fields the following commands are available in the toolbar: TOptical CUT [Ctrl+X] Cuts a selected area COPY [Ctrl+C] Copies an active or selected area PASTE [Ctrl+V] Inserts an area copied to the clipboard DELETE [Ctrl+Del] Deletes an active or selected area Issue 03/2011 43 Creating a project qPCRsoft Additionally, other commands can be used, such as "CANCEL" and "REPEAT" (see section 5.1.2). 8.3 Create a PCR protocol For the real-time PCR experiment a PCR protocol must be programmed. All functions required for this purpose are combined in the tab "THERMAL CYCLER". In the tab Thermocycler there are different tab pages to switch between (see Fig. 26). Tab page Function TABLE Contains a table for programming PCR programs GRAPH Provides the option for the graphical programming of PCR programs GRADIENT Provides a graphical overview of the gradient curve. Fine adjustment of the gradient is possible at the same time. MELTING Used to enter parameters for measuring a melting curve CURVE In the tab page "TABLE" all parameters for creating a complete PCR program can be entered. The tab page is divided into different areas (see Fig. 26): Fig. 26 1 Graphic program preview 2 Program header 3 Programming table 4 Tab pages Programming table for creating PCR protocols In the program header the framework conditions for the PCR protocol and the programmed lid temperature, the lid heating mode and the block type of the thermocycler have been defined. The programming table provides a clear display of the individual steps of the program and in the graphic preview the temperature progression of the program is plotted graphically against the time. 44 Issue 03/2011 TOptical qPCRsoft Creating a project Note The block type inserted is automatically detected by the system. Navigating the programming table is possible using the mouse or the four direction keys of the keyboard. The direction key RIGHT moves the cursor to the next field on the right. This key can also be used to confirm a data entry. During programming the entered value is accepted when the RIGHT key is pressed and the cursor jumps to the next field. The direction key LEFT moves the cursor to the previous field. The function of the LEFT key corresponds to the "Back" command. The direction key UP moves the cursor to the field above. The direction key DOWN moves the cursor to the field below and creates a new step 8.3.1 Program header The program header contains some general program configurations, such as the block type of the thermocycler used, the heated lid temperature and whether the heated lid is to be preheated prior to program start or not. 8.3.2 Select block type The installed block module is automatically detected by the TOptical thermocycler during the device initialization (with/or without gradient function). When creating a new program this module is accepted as default. However, it is possible to create a program for a different block format than that currently installed (for example a program with a temperature gradient although no block capable of a gradient has currently been inserted). For this purpose a list function is available from which the desired block type can be selected: Fig. 27 Selection list to select the block type The available block types are displayed after clicking on the field with the down arrow and can be selected by a left mouse click. TOptical Issue 03/2011 45 Creating a project 8.3.3 qPCRsoft Heated lid preheat The heated lid of the TOptical thermocyclers can preheat to a set temperature before the actual PCR program starts. This is the recommended default configuration to ensure the formation of a homogeneous tempered air cushion between the sample cups. This results in a better temperature uniformity between the samples. However, the function for preheating the lid can be disabled. In this case the PCR program already starts whilst the lid is still heating up. The corresponding module is selected in the checkbox "PREHEAT LID": Fig. 28 Checkbox to configure the heated lid mode The preheat mode is enabled as default. By a mouse click on the checkbox the tick is removed and the preheat mode disabled. In the mode "PREHEAT on" the block is kept constantly at 25°C whilst the lid heats up. Note After the heated lid has reached the target temperature, it is followed by a 40 second equilibration before the program starts. The recommended setting is for the preheat mode to be enabled. 8.3.4 Configure the lid temperature The temperature of the heated lid should normally be slightly above the block temperature to prevent the evaporation of liquid from the reaction preparation and its condensation at the walls or the lid of the reaction cups. Thanks to High Performance Smart Lid technology much lower lid temperatures can be used than were common in the past. The rim of the heated lid being drawn well down provides optimum conditions for the formation of a homogeneous tempered air cushion between the sample cups. This presents the advantage that a local overheating of the samples in the center of the block is prevented by head radiation from above and also increases the temperature uniformity. The lid temperature is defined via the corresponding input field: Fig. 29 Field to enter the temperature of the heated lid The desired temperature can be entered either by entering the corresponding numerical value directly or by pressing the buttons up and down adjacent to the temperature input. Note The recommended lid temperature is 99°C. The lower limit for the lid temperature is 30°C, the upper limit 110°C. 46 Issue 03/2011 TOptical qPCRsoft 8.3.5 Creating a project Enter temperature and hold time for a step In accordance with the proven Biometra programming philosophy all steps of a program are entered in a clear table: Fig. 30 TOptical Programming table Each entry is confirmed with [ENTER] or the RIGHT direction key. The cursor then jumps to the corresponding field of the adjacent column. The desired target temperature is entered in the column °C, the hold time in the column M:S. The numerical values entered correspond to a temperature in °C or a holding time of minutes and seconds. To enter parameters for the next step, this must first be created in the table. This can either be done by pressing the button "INSERT STEP" in the toolbar of the qPCRsoft software or by using the DOWN directional key in the keyboard: Insert a new step Keys Software toolbar The temperature and time for the next step can then be entered. The number of the step at which the cursor is currently positioned in the programming table and the total number of steps in the protocol is displayed in the status bar: Fig. 31 8.3.6 Status bar to display the total number of steps and the currently edited step Define a loop PCR programs consist of a sequence of largely repeated program steps. Regularly repeating step sequences can be combined into loops. A loop is generally defined by two parameters: A target step for the Einen Zielschritt für den return ("GOTO") and the number of repetitions ("LOOPS"). The corresponding parameters must be entered in the last step of the loop. For this purpose the cursor must first be moved to the last step of the future loop. In the column GOTO the number of the target step and in the column LOOPS the number of the desired repetitions are then specified. TOptical Issue 03/2011 47 Creating a project Fig. 32 qPCRsoft PCR- program with programmed loop After entering the target step and repetitions the programmed loop is shown in the shape of a bracket on the side of the left-hand table (see Fig. 26). Note The total number of loops displayed is the result of the number of programmed repetitions plus 1, because the corresponding step sequence has already been completed once before the loop has been entered. 8.3.7 Temperature increments The TOptical Thermoycler provides the option to modify the temperature between cycles by a specific amount within a programmed loop. This technology is e.g. used for the "Touch Down" PCR. To do so the desired temperature change for the selected step must be programmed in the column ΔT(°C). The current temperature at this step then results from the temperature at this step in the previous cycle plus the amount programmed in the column ΔT(°C). For negative temperature changes a minus sign must precede the amount. Fig. 33 Programmed temperature increment Note The step for the temperature change must be within a loop, otherwise the entry in the column ΔT(°C) remains ineffective. 8.3.8 Time increments To compensate for a loss in enzyme activity during longer protocols the hold time of a step can be increased between cycles within a loop. The desired increase is programmed in the column Δt(s). During each repetition of the step the hold time is increased by the value entered. Fig. 34 Programmed time increment The step for increasing a protocol step must be within a loop, otherwise an entry in the column Δt(s] remains ineffective. 48 Issue 03/2011 TOptical qPCRsoft Creating a project Note The increase of the hold time of a step affects the total run-time of the protocol. A program with many cycles and significant increases of the hold time takes considerably longer than a comparable program without programmed increase. 8.3.9 Set the heating and cooling rate For special applications or the transfer of protocols from other devices it might be necessary to adjust the heating and cooling rates The average heating and cooling rate can be configured for each individual step in the column (°C/S). Fig. 35 Modified heating and cooling rate The value in the column (°C/S) defines the speed with which the current step is reached. I.e, if heating (or cooling) is to take place with a speed of 3°C per second between step 2 and step 3, a value of 3.0 must be entered in step 3. Note If the speed is to be reduced throughout the whole program, the heating and cooling rate must be adjusted in all steps. The configuration then also only applies to this program. 8.3.10 Program a temperature gradient (TOptical Gradient only) Gradients are defined in the program table by entering two temperature values separated by a dash. The first value entered corresponds to the temperature in column 01 (left block side), the second value to the temperature in column 12 (right block side). Fig. 36 Temperature gradient Note Gradients can be programmed over the whole temperature range of the thermal block between 3.0°C and 99°C. The gradient range can be max. 40°C. The progression of the temperature gradient can be reviewed in the tab page "GRADIENT" (see Fig. 37). The temperature in the individual columns of the block are combined in a table below the bar graph. TOptical Issue 03/2011 49 Creating a project Fig. 37 qPCRsoft Gradient tab page The gradient progression can be adjusted by entering temperature values for the first (temp. column 01) and the last column of the block (temp. column 12). The values displayed in the table are then updated. Another option for adjusting the gradient is to click on the top end of the column for column 1 or column 12 and change the height of the column with the left mouse button depressed. Moving the columns changes the respective temperature value accordingly. 8.3.11 Program linear gradients (TOptical Gradient only) In addition to the option to define a gradient by entering temperature values for columns 1 and 12, the gradient can also be programmed starting with a center temperature. To do so the view option LINEAR must have been selected in the table page "GRADIENT". Fig. 38 Configuring the gradient display The gradient can then be defined starting from an annealing temperature in the center of the block using fixed temperature gaps. For this purpose the temperature for column 6 (annealing temp.) and an increment (Increment) must be defined. The values displayed in the table are updated after the values have been entered Another option for adjusting the gradient is to click on the top end of the column for column 6 and change the height of the column with the left mouse button depressed. Moving the column the changes the annealing temperature accordingly. Fig. 39 50 Programming linear gradients Issue 03/2011 TOptical qPCRsoft 8.3.12 Creating a project Program the melting curve For experiments with SYBR Green it is recommended to check the specificity of the products by measuring a melting curve. For this purpose TOptical has a function to program a corresponding step in the PCR protocol. By enabling the option "ACTIVE" in the tab page "MELTING CURVE" an additional step for the melting curve determination is added to the PCR protocol. The corresponding step is highlighted accordingly in the programming table: Fig. 40 PCR protocol with step for melting curve determination The individual parameters of the melting curve step cannot be modified in the programming table. The specific configurations can be made in the tab page "MELTING CURVE [!]": Fig. 41 Tab page "MELTING CURVE” The following parameters can be modified: Parameter Function START TEMP. [°C] Start temperature of the melting curve END TEMP. [°C] End temperature of the melting curve EQUILIBRATION (S) Time for the equilibration of the block at a temperature step before carrying out a measurement TOptical INCREMENT ΔT Gaps in °C between the individual temperature steps HEATING RATE (°C/S) Heating rate of the block ACTIVE Attach a melting curve step to the PCR protocol. Issue 03/2011 51 Creating a project 8.4 qPCRsoft Define the scan settings The product accumulation is measured in the real-time PCR by the increases in fluorescence. For this purpose the following must be defined which colors should be measured at which step of the PCR protocol this should take place, and which range should be scanned. The colors to be measured are defined in the tab "SCAN": Fig. 42 Tab "Scan” The tab "SCAN" includes a table with different parameters to define the scan properties: Parameter Function DYE For every filter the dye to be measured can be defined in the table using a selection list. In the column "DYE" a list opens after left mouse click in which the corresponding dye can be selected. GAIN In the column "GAIN" the LED intensity is controlled. The intensity is divided into stages between 0 and 10. The higher the value the greater the emission. A setting of 3 has been defined as default value. MEASUREMENT A green diamond indicates for which dyes the measurement has been activated (see section 8.4.1). PASS. REF. Due to the LED technology used in the TOptical it is not necessary to use a passive reference. However, if a reference dye is still to be measured, a tick must be placed in the corresponding column. Note The selection list of available dyes cannot be modified in this table. These general configurations can only be modified in the menu item "EDIT COLOR MODULES" (see section 6.4.2). The number of dyes measured does not affect the scanning time. In addition to the table the tab "SCAN" includes additional input fields for defining the scanning process: 52 Issue 03/2011 TOptical qPCRsoft Creating a project Parameter Function MEAS. Defines the number of repetitions of the fluorescence measurement. A value from 1 to 16 can be selected. REPETITIONS COLOR COMPENSATION By way of spectral compensation it is possible to filter out the radiation of other dyes into the measuring channel for multiplex measurements. Spectral compensation has been described in more detail in section 0. Note An increase in the number of measurement repetitions results in significantly longer scanning times and thus longer protocol runtimes. The scanning range can be defined in accordance with the plate layout in the sample table or manually. For the manual definition of the measuring range a graphic representation of the sample block opens: Fig.43 Manual configuration of the scanning range The scanning range is always defined by columns in the TOptical thermocycler and must always consist of continuous columns. To do so the measuring range can be defined either via the two input fields "FROM COLUMN" and "TO COLUMN" or by using the mouse. Clicking on a column enables it, which is indicated by a blue highlighting of the corresponding column. By selecting an area with the left mouse button depressed several columns can be enabled simultaneously. 8.4.1 Spectral compensation When using several dyes for each reaction preparation there may be an overreaction of the fluorescence, i.e. in addition to the desired dye a second dye is simultaneously excited and measured. To deduct the fluorescence share of the second dye the color compensation function is available in the tab "SCAN". The default setting for the color compensation is "OFF", because for the most frequent applications (only one active measuring channel or dyes with a large spectral distance, such as e.g. FAM and ROX) color compensation is not required. When clicking on "SELECT" a window opens where any already entered spectral compensations can be opened and used. TOptical Issue 03/2011 53 Creating a project Fig. 44 qPCRsoft Selection window for templates for spectral compensation By selection with the left mouse button and pressing [OK] a color compensation can be enabled for the current project. With the icon a new color compensation can be created by way of measurement. This process is called spectral calibration. A new window opens where all necessary configurations can be made. The window is divided into a selection list for dyes, a plate diagram and a display of the results matrix. Fig. 45 Window "Color Compensation" for spectral calibration To record the calibration data the dyes for which a color compensation is required must be present individually in the solution. For example, the sensors used in the subsequent PCR experiment can be used for the calibration measurement. For the calibration measurement the dye concentration should be approx. 0.1 µMol/l. In the plate diagram shown the wells containing the calibration samples are now selected individually for each dye, and the dye present in the sample is assigned to the selected wells by clicking on the blue arrow. The dyes available for selection are those which were selected in the tab "SCAN". For a precise calibration measurement it is advisable to create each dye at least as a triplicate and to create at least three blanks (sample cups filled with water). The calibration measurement is started by clicking on the blue triangle bottom left. 54 Issue 03/2011 shown at the TOptical qPCRsoft Creating a project Note The selection of available dyes cannot be modified in this table. Changes of these general configurations can only be made under the menu command "EXTRAS / EDIT COLOR MODULES". In the name field the new spectral compensation must be given a name and after pressing [OK] this is accepted in the selection list and displayed in the corresponding window. Templates that are no longer in use can be deleted using [DELETE]. 8.4.2 Define the scan To measure the fluorescence it is necessary to define in the programming table at which step of the PCR protocol it should be measured. The measurement at the corresponding step is defined in the column "SCAN". Using the left mouse button the scanning process can be activated at each step of the protocol. The activated measurement is indicated by a green diamond in the programming table: Fig. 46 PCR protocol step for fluorescence measurement Note If a step for the melting curve determination is inserted, the scanning process is automatically activated at this step. For all other steps of the PCR protocol it must be assigned manually. 8.5 Graphical progression of the PCR protocol In the tab page "TABLE" of the tab "THERMAL CYCLER" the progression of a programmed PCR protocol is displayed graphically. The temperature progression of the block (blue line) and the heated lid (red line) are plotted against the time: The following symbols might be displayed in the graphical representation of the protocol progression: Symbol Meaning Step at which the scanning process is started and the fluorescence measured Step with programmed gradient TOptical Issue 03/2011 55 Creating a project 8.6 qPCRsoft Graphic programming Programs are usually created in the table view which permits the fast programming of new steps and provides a summary overview of the protocol structure. Some programming options are only available in the table view. However, the graphic programming mode provides additionally a schematic representation of the temperature profile and allows for protocols to be adjusted rapidly. It is possible to change between the table view and the graphic mode via the tab pages "TABLE" and "GRAPH" (see Fig. 47 ). In principle the graphic programming takes place in the same way as in the programming table. The currently edited step is highlighted in bright red. At the bottom of the display the respective number of the corresponding protocol step is displayed. In addition, the number of repetitions in loops (right) and scanning processes (center) can be programmed in this field. The number of repetitions is specified as a number (e.g. 40x) and can be edited after a left mouse click. Scheduled scanning processes are indicated by a green diamond in the center of the field and can also be selected or deselected with the left mouse button. Note The number of repetitions in melting curve steps cannot be modified. Temperatures and hold times are entered as numerical values above or below the blue line indicating the temperature level at the individual steps. Gradient steps are given the additional label "GRAD", melting curve steps the addition "MELT". In addition the icon of an up arrow () is shown for melting curve steps. Fig. 47 Graphic programming mode The temperature value at each step can be modified using the mouse. To do so the blue line of the temperature progression can be moved up or down with the depressed left mouse button. In gradient steps both the upper and lower temperature are modified evenly. The selected temperature range remains intact. 8.7 Edit program Programs can be edited both in the tabular or graphic view. Changing between the two alternative views takes place via the tab pages "TABLE" and "GRAPH". To edit a step (the currently active step is highlighted in bright red) the corresponding function can from the menu item "CYCLER" in the menu bar or the corresponding icon from the toolbar can be used: 56 Issue 03/2011 TOptical qPCRsoft Creating a project Icon Function Inserts a new step after the active step Deletes a step Cut a step Copy a step Inserts a copied step at the active step Note Changes do not affect running PCR protocols and only become active after saving with the next start. 8.8 Edit sample table In the sample table the position of the sample in the block is defined. For this purpose every sample can be described using its properties, such as name, type, concentration and dye. In addition, samples from different experimental preparations can be combined into groups. In the tab "LAYOUT" all necessary entries can be made after selecting "EDIT LAYOUT". The corresponding window is divided into different areas: Fig. 48 TOptical Window for editing the sample table Issue 03/2011 57 Creating a project qPCRsoft Area Function INPUT RANGE (1) Enables the entry of different parameters to describe a sample. DYES (2) The tab pages enable the quick access to the sample table for the respective dye. SAMPLE TABLE (3) Provides a clear summary of information for each sample. A separate sample table is shown for each dye. LAYOUT VIEW (4) Offers a preview of the assignment of the individual wells by sample type. Note The sample table can still be edited after starting the real-time PCR run. 8.8.1 Define sample properties In the corresponding input range the properties of each sample can be defined (see Fig. 49). For this purpose at least one position must first have been selected in the layout view. The selection is by left mouse click. The selected well is highlighted in blue. With the left mouse button depressed several continuous positions can also be selected (see Fig. 50): Fig. 49 Layout view for the sample type with wells A1 to A5 and B1 to B5 selected A name and sample type can be assigned to the sample in the input field for sample properties: Fig. 50 Input field for sample name and selection list for sample type The sample name can be chosen freely. The sample type can be defined via a selection list. The following sample types are selectable: 58 Sample type Symbol Definition EMPTY - Describes an empty position on the PCR plate UNKNOWN Sample of unknown concentration or dilution STANDARD Sample of known concentration or dilution CALIBRATOR Sample whose target gene expression level is set as 1 NO TEMPLATE CONTROL (NTC) Complete reaction preparation but without matrix strand POSITIVE CONTROL Positive control preparation for which a reaction product is expected Issue 03/2011 TOptical qPCRsoft Creating a project NEGATIVE CONTROL Negative control preparation for which no reaction product is expected For the further description of the sample it must be defined which genes are measured in the sample using which color. In addition concentrations can be entered for samples of the type "STANDARD". Fig. 51 Input field to define which gene is measured using which color. For samples of the type Standard details on concentration can also be entered. The gene to be measured can either be entered freely after selecting the corresponding field in the input mask or from the selection list shown. The selection list lists the most recently measured genes. Every row of the table is linked to a corresponding color. In the example in Fig. 51 the gene GAPDH is linked to the color FAM, i.e. the gene GAPDH is detected in the FAM channel. Note The color to be measured cannot be modified at this point. The colors to be measured are defined in the column "DYE" of the tab "SCAN" (see section 8.4). At the same time the selection or deselection of a color in the column "MEASUREMENT" of the tab changes the number of the lines for colors displayed in the sample table. Samples of the type "STANDARD" can have a concentration assigned. The quantity is entered in the corresponding field (see Fig. 51). The unit of quantity is defined via the corresponding selection list (see Fig. 52): Fig. 52 Selection list to define units of quantity The following units of quantity are available for selection: ng, ng/µl, ng/ml, pg/µl, copies, copies/µl, copies/ml, mg/ml, IU/µl, IU/ml or %. The entries made are assigned to the selected well or the selected area via the button "EDIT LAYOUT" in the toolbar: Icon Function Assign entries to selected wells. Note The entries for the selected area are only accepted by assigning a program. Unassigned entries or changes are lost. The corresponding configurations are accepted by the program and displayed both in the layout view and in the sample table: TOptical Issue 03/2011 59 Creating a project qPCRsoft Layout view Fig. 53 Sample table After assigning the sample type "Standard” to positions A1-A5 and B1-B5, the symbol for standard samples is displayed at the corresponding wells in the layout view. In the sample table the sample name and sample type are displayed in the corresponding rows. You can also make your own entries in the sample table. After selecting the desired position in the layout view or after direct selection of a field in the sample table the corresponding row is highlighted in yellow. Descriptions or values can be defined directly in the respective cells. The sample table is always edited by rows, a multiple selection and the assignment of parameters to multiple cells or rows simultaneously is not possible. The genes to be measured, and for standard samples also their concentration, are combined in the second part of the sample table (see Fig. 54). Using the tab pages listed below it is possible to switch between the different colors to be measured and determine which gene is measured using which dye in the sample. The respective activated tab is highlighted in white. Dye tab pages Fig. 54 Genes and concentrations are recorded in the second part of the sample table separated by colors. Note The number of tab pages displayed depends on for which dyes the measurement has been enabled in the tab SCAN (see section 8.4). Dependent on the window size selected and the number of colors to be measured two buttons are shown with arrows to the left and the right to allow scrolling between the different tabs. The number of columns displayed in the sample table can be defined by the user. After right click on a column heading a selection field is shown. By way of selection or deselection individual columns can be shown or hidden and the view thus be adapted as desired. When hiding columns no information is lost; entries made remain stored in the background and are displayed again when the corresponding columns is shown. 60 Issue 03/2011 TOptical qPCRsoft 8.8.2 Creating a project Define groups If in a PCR run several experiments are carried out in parallel, the respective associated samples must be combined into groups. A group defines a cohort of reaction preparations that are subsequently analyzed together. To define groups corresponding entries can be made in the tab "LAYOUT" after selecting "CREATE GROUPS" (see Fig. 48). For this purpose at least one position must first have been selected in the layout view. The selection is by left mouse click. The selected well is highlighted in blue. With the left mouse button depressed several continuous positions can also be selected (see Fig. 55): Fig. 55 Layout view for grouping with wells A1 to A5 and B1 to B5 selected The group is selected and named in the following fields: Fig. 56 Input field for group name and selection list for group number The group name can be chosen freely. The group number can be defined via a selection list. The entries made are assigned to the selected well or the selected area via the button [EDIT in the toolbar: LAYOUT] Icon Function Assign entries to selected wells. Note The entries for the selected area are only accepted by assigning a program. Unassigned entries or changes are lost. The corresponding configurations are accepted by the program and displayed both in the layout view and in the sample table: Layout view Fig. 57 TOptical Sample table After assigning a group for positions A1-A5 and B1-B5 the associated grouping and the number of the group are shown in the layout view. In the sample table the name is displayed for the corresponding positions in the column "GROUP NAME". Issue 03/2011 61 Creating a project 8.8.3 qPCRsoft Layout preview The layout preview ensures a total overview of the assignment of the PCR plate with samples and the information stored for them. The layout preview is opened via the corresponding button in the toolbar: Icon Function Opens the layout preview The layout preview provides an overview of which sample is at which position and which genes are measured there. A color marking at the left margin of each cell additionally indicates the sample type. If you move the mouse pointer to a specific position, all configurations known for this position, such as sample name, sample type, group and all genes and dyes to be measured in the sample, and for standards also the their concentration, are shown in detail (see Fig. 58): Fig. 58 Section of the layout preview table Via the button "PRINT" at the bottom right margin of the layout preview the table can be printed and be, for example, used as a template when pipetting the samples or to document the experiment. 8.8.4 Copy layout The function "COPY LAYOUT" enables the copying of a complete layout or parts of it. To do so the view "EDIT LAYOUT" must be activated in the tab "LAYOUT" (see Fig. 48). First all groups or one group of positions must be selected in the layout view by dragging with the left mouse button (see Fig. 59). Fig. 59 62 Layout view with selected area at positions A5 to H12. Issue 03/2011 TOptical qPCRsoft Creating a project The information of the selected area is copied to the clipboard by the function of the toolbar "COPY LAYOUT". Icon Function Copy layout areas. Insert copied area. With the function "INSERT LAYOUT" the content of the clipboard can be inserted at any position of the same or a second open layout view. To do so, first a position for insertion must be selected by selection with the left mouse button. The selected position or the top left position of a selected area determines the point where the copied area is inserted (see Fig. 60): Fig. 60 Layout view with inserted layout. Positions A5 to H12 were copied from the layout view in Fig. 59 and inserted at position A1 in a new layout view. Using the function "COPY LAYOUT" information on samples can be moved within a layout or transferred to a second layout. 8.9 Save template All basic information required to execute an experiment stored in the tab "SETTINGS" as well as the description of the experiment, the PCR protocol, scan settings of the optical system and the plate assignment can be saved as a template. The corresponding command is available in the main menu in the menu item "FILE" or via the toolbar. Templates are saved as "*.rts" files and can be used as the basis for creating new experiments. Main menu FILE SAVE TEMPLATE Saves a template Toolbar SAVE TEMPLATE Saves a template TOptical Issue 03/2011 63 Monitoring 9 qPCRsoft Monitoring All functions required to start and monitor a real-time PCR run are combined in the tab "MONITORING" of the qPCRsoft project window (see section 8.1). The tab "MONITORING" is divided into different areas: Fig. 61 "MONITORING” window to monitor PCR runs Area Function MEASURING RESULTS (1) Displays the measured fluorescence data. The fluorescence intensity is plotted against the cycle Tab pages COLOR (2) Switches between the fluorescence accumulation curves that were measured for the individual dyes. PCR PROTOCOL (3) Displays the PCR protocol. The active step is indicated by a green arrow. Tab pages PROTOCOL VIEW (4) Switches between different views of the PCR protocol (tabular, graphic, temperature profile). For all views in the area MONITORING it is generally possible to choose between linear and logarithmic plotting of the data. For this purpose a selection for the viewing options can be opened via the button with the right arrow in the Monitoring window: Fig. 62 64 Selection of viewing options in the Monitoring window Issue 03/2011 TOptical qPCRsoft Monitoring Via the menu item "SAMPLES" in the project explorer the measuring results for individual wells can be shown or hidden (see _d2h_bmk__Ref276651550_17Fig. 63). If a well is selected with the left mouse button and the circle has a red infill, the corresponding fluorescence data are displayed in the Monitoring window. For deselected wells the circle has a white infill and the fluorescence data are hidden. Fig. 63 Menu item "Layout" of the project explorer Note After a right mouse click in the area measuring results (see Fig. 61) a menu with buttons is shown enabling the export of the data as diagrams or raw data: Button Function Copies the graphic representation of the fluorescence data Saves the fluorescence data as *.csv files 9.1 Start run After a project (see section 8) has been selected, the run can be started. For this purpose the function "START QPCR RUN " is available in the toolbar (see section 5.1.2). Monitoring START QPCR RUN Start the PCR run STOP QPCR RUN Stop the PCR run PAUSE QPCR RUN Pause the PCR run Using the functions "STOP QPCR RUN " and "PAUSE QPCR RUN " the PCR run can be canceled or paused. During a pause the PCR protocol is paused at the corresponding step and the block temperature maintained. After completing the pause the run of the corresponding step is continued by pressing the button "START QPCR RUN" once more. TOptical Issue 03/2011 65 Monitoring 9.2 qPCRsoft PCR protocol The running PCR protocol is now shown in the lower part of the Monitoring window (see Fig. 61). Three different views can generally be selected via tab pages: Table Graph T profile The tab page of the currently active view is highlighted in white. The currently active step of a running program is highlighted in the tabular and graphic displays by an arrow, in the temperature profile view a progress bar indicates the currently executed step. Additional information about the protocol is also displayed in a status bar: Plateau time Remaining run-time In programmed loops the step number and the number of repetitions Note Running protocols cannot be edited, editing is only possible in the corresponding project window. 9.2.1 Product accumulation curves The fluorescence accumulation curves for each dye are shown in the top part of the Monitoring window. For this purpose the fluorescence intensity [I] is plotted in each case in relative units against the number of cycles (see Fig. 64). The color of the curve displayed in each case corresponds to the color assigned to each well in the sample table (see Fig. 53). The measuring results for the individual dyes are selected via the corresponding tab pages (see Fig. 61). The measuring results of all dyes can either be displayed jointly ("all colors") or only the results for an individual dye. The respective active tab page is highlighted in white. Linear view Fig. 64 66 Logarithmic view Display of the measuring data Linear view: The fluorescence intensity of each dye is plotted against the number of cycles. Logarithmic view: The logarithm of the fluorescence intensity is plotted against the number of cycles. Via the tab pages shown below it is possible to change between the measuring results for the different colors. Issue 03/2011 TOptical qPCRsoft Monitoring In addition to the linear or logarithmic view the cycle range on which the base line correction is based itself can also be adjusted in the selection of the viewing options (see Fig. 62). The bottom value is defined as 3 and the top value as 14 by default. Via the arrow keys the values can be increased or reduced accordingly and thus adjusted to the measuring results. Note The base line correction is an important function for the subsequent analysis of measuring data. The selected range should be such that the fluorescence values do not yet stand out against the background fluorescence 9.3 Melting curves If a melting curve determination has been programmed in a PCR protocol, it is possible in the Monitoring window under the item "VIEW" to change between the display of the product accumulation curves and the melting point determination (see Fig. 65): Fig. 65 Selection list to change the view between product accumulation curves (amplification) and melting curves. After changing the view to "MELTING CURVE" the fluorescence data of the melting curve analysis are displayed in the top part of the Monitoring window. For this purpose the fluorescence intensity [I] is plotted in relative units against the temperature [°C]. As with the product accumulation curves it is possible to select between a linear and logarithmic view (see Fig. 62). Linear view Fig. 66 Logarithmic view Linear and logarithmic view of the melting curves The measuring results for the individual dyes are selected via the corresponding tab pages. TOptical Issue 03/2011 67 Analysis 10 qPCRsoft Analysis The tab "ANALYSIS" combines various methods, such as absolute quantification, relative quantification, ΔΔCt method, allelic discrimination and melting curve determination, for the analysis of experiments. The individual functions are available via tabs of the second level. The corresponding windows are initially empty. First a new analysis must be created using the button "NEW" in the toolbar and then a name issued in the input field (see Fig. 67): Button Function Analysis Fig. 67 NEW Absolute quantification NEW Relative quantification NEW ΔΔCt detection NEW Melting curve Input field for naming analyses In the analyses area a window for defining basic configurations can be opened via the button "OPTIONS" in the toolbar. Button Function OPTIONS Opens a window for the basic configurations for the analysis In the corresponding window the following basic configurations can be made (see Fig. 68): Fig. 68 68 Window to define basic configurations for analyses Issue 03/2011 TOptical qPCRsoft Analysis Option Function SMOOTHING Smoothing the fluorescence curves on the basis of the calculated moving average value over a range of 2 to 12 measuring points or display without smoothing. SCALING Display of the fluorescence curves in linear or logarithmic view BASE LINE Adjustment of the cycle range used to calculate the base line correction. AUTOM. Calculation of the threshold as x-times the deviation of the standard deviation of the base lines (factor adjustable under "Extras → Options → Analysis" in the main menu) or based on the defined standard with the objective to obtain the maximum value for the measure of certainty R2. THRESHOLD FILTER Digital filter for smoothing the fluorescence curves adjustable in the stages weak, medium and strong For all views in the analysis area there exists additionally the option of rapid access to the configuration range of the base line and the viewing options between linear and logarithmic plotting of the data. For this purpose a selection for the viewing options can be opened via the button with the right arrow in the respective window: Fig. 69 Rapid access in the area analyses permits the selection of the viewing options for fluorescence curves and the definition of the adjustment range for the base line. Via the menu item "LAYOUT" in the project explorer the measuring results for individual wells can be shown or hidden (see Fig. 70). If a well is selected with the left mouse button and the circle has a red infill, the corresponding fluorescence data are displayed in the Monitoring window. For deselected wells the circle has a white infill and the fluorescence data are hidden. Fig. 70 Menu item "Samples" of the project explorer Note After a right mouse click in the area measuring results (see Fig. 70) a menu with buttons is shown enabling the export of the data as diagrams or raw data: Button Function Copies the graphic representation of the fluorescence data Saves the fluorescence data as *.csv files TOptical Issue 03/2011 69 Analysis 10.1 qPCRsoft Absolute quantification The absolute quantification is used to determine absolute copy numbers in samples based on the comparison with standards of known concentration. After an absolute quantification has been created via the function "NEW" the following areas are displayed in the corresponding window: Fig. 71 Window for absolute quantification Area Function SELECTION AREA (1) Used to define basic configurations and to select the dye with which the target gene was measured FLUORESCENCE CURVE Displays the fluorescence curves determined for the target gene VALUE DISPLAY (3) Factors calculated for the standard curve STANDARD CURVE Displays the standard curve calculated from the concentrations and measuring values or the sample table amended by the measuring results DISPLAY (2) DISPLAY (4) 70 Issue 03/2011 TOptical qPCRsoft 10.1.1 Analysis Selection area The selection area is divided into two areals: In the top status bar highlighted in red the selected method is displayed and via a selection list it is possible to select between different analyses created for the experiment. The name of the respective analysis is shown in the white field. Via the (+/-) sign at the right-hand margin of the status bar the lower part of the selection area can be shown or hidden (see Fig. 72). Various fields are arranged in the lower part to make important basic configurations for the analysis. For the target gene to be quantified it must be defined via the selection list "GENE OF INTEREST (GOI)" with which dye it has been measured. If a dye has been set as passive reference, its fluorescence can be included in the calculation for standardization. For this purpose a tick must be placed in the corresponding checkbox. 1 Method 5 Threshold adjustment 2 Name of analysis 6 Group selection 3 Show/hide adjustment options 7 Take passive reference into account 4 Base line/scaling 8 Dye / target gene Fig. 72 The selection area in the window for the absolute quantification is divided into an upper status bar highlighted in red and a lower part where various basic configurations can be made. Note Those dyes are made available for selection which where defined during the project creation in the tab Scan (see section 8.4). The checkbox "INCL. PASS. REFERENCE" is only active if in the tab "SCAN" a dye has been defined as passive reference. Via the selection field "GROUP" is defined for which experiment the analysis is to be carried out. Note If this has been done, the corresponding division into groups will have been carried out during the project creation in the tab "LAYOUT" -> "CREATE GROUPS" (see section 8.8.2). The standard group number for all samples is 1. To manually adjust the threshold value a numerical value can be entered in the field "THRESHOLD". Because the display of the fluorescence curves (dRn) in the display area (see Fig. 71 Window for absolute quantification) is standardized to percentage values between 1 and 100, the threshold must be set to between 1 and 100. Note In addition to the manual configuration of the threshold via numerical values the qPCRsoft software also provides the option to have the threshold calculated automatically or adjust it in the display area of the fluorescence curves (see section 10.1.2). To adjust the base line or to select between linear and logarithmic view of the fluorescence curves a selection for viewing options can be made via the button with the right arrow (see Fig. 65). TOptical Issue 03/2011 71 Analysis 10.1.2 qPCRsoft Fluorescence curve display In the display area the measured data, standardized to the value 100 for the highest fluorescence intensity, are plotted against the cycle for the target gene selected. The dye assigned to the target gene is displayed as entry in the tab page in the bottom left corner of the area. By switching to another target gene/dye combination in the selection area (see section 10.1.1) the entry in the tab page changes accordingly. Dependent on the viewing option selected the fluorescence data are displayed either linear or logarithmic (see Fig. 73). For both view types a brief information is shown as soon as the mouse pointer is positioned on one of the curves. To determine Ct values for the analysis a threshold value must be determined for each experiment. This can be automated (see below) but is also possible manually in the display area. With the left mouse button depressed the black threshold line can be dragged up or down and the corresponding value thus changed. At the same time as the threshold line is moved the Ct values update in the sample table (see section 10.1.3). Linear view Fig. 73 Logarithmic view Linear and logarithmic view of the fluorescence data for the absolute quantification. The horizontal threshold line can be moved manually. Note For placing the threshold manually in the display area the logarithmic view is more suitable than the linear view because of the wider spread of the early exponential area of the product accumulation curves. The automatic calculation of the threshold value is started via the button "Autom. threshold" in the toolbar: Button Function AUTOM. THRESHOLD Automatic determination of the fluorescence threshold for detecting Ct values Both during manual determination and automatic calculation the resulting threshold value is simultaneously updated and displayed in the corresponding field in the selection area (see section 10.1.1). 10.1.3 Standard curve and values display In the area "Standard curve" it is possible to change between the standard curve and the sample table for the absolute quantification using the tab pages "CURVE" and "TABLE". For the display of the standard curve the Ct values of the standard samples are graphically plotted against the logarithm of their concentration. In the value area to the right of it the calculated data for the certainty measure R2, the gradient of the standard curve, the axis intercept (offset) and the PCR efficiency are displayed. The standard curve and the values 72 Issue 03/2011 TOptical qPCRsoft Analysis are automatically calculated by the qPCRsoft software and updated if the configurations change. Standard curve Fig. 74 Sample table abs. quantification Display of the standard curve and the sample table for the absolute quantification The sample table for the absolute quantification combines all data and corresponding measurements for the samples. The selection of columns displayed can be defined by the user. After right click on a column heading a selection field is shown (see Fig. 75): Fig. 75 Selection field to define the columns displayed in the table. Individual columns can be shown or hidden by selection or deselection. The layout of the columns can also be freely modified. By dragging a column heading with the left mouse button depressed columns can be swapped. The display of the results in the table can thus be adjusted as desired. The standard curve calculated by the software is also displayed in an abbreviated form in the project explorer in the item "ABS. QUANT." (see section 5.1.3). The graphic plotting of the Ct values against the logarithm of the sample concentrations is displayed: Fig. 76 TOptical Display of the standard curve in the project explorer. Issue 03/2011 73 Analysis 10.1.4 qPCRsoft Import a standard curve In addition to the option to measure a standard curve in the experiment, the qPCRsoft software also allows for the sample concentrations to be determined on the basis of a saved standard curve. An import function is available for this purpose in the toolbar. This can be opened via the button "Import standard curve": Button Function IMPORT STANDARD CURVE Import a saved standard curve. In the corresponding window different options for the import of a standard curve are provided (see Fig. 77): Fig. 77 Import of a standard curve Option Function IMPORT FROM THIS RUN Imports a standard curve from the currently open project IMPORT FROM SAVED RUN Imports a standard curve from a saved project MANUAL INPUT Creates a standard curve from manually entered values The mathematic equation on which the standard curve is based and the corresponding dye are displayed prior to the import. If several standard curves are saved in a project then all curves are displayed and a selection is possible. When entering the values manually the gradient of the line and the axis intercept in the equation Ct = gradient * log(conc) + axis intercept must be defined. 74 Issue 03/2011 TOptical qPCRsoft 10.1.5 Analysis Delete absolute quantification Deleting an absolute quantification is possible via the function "DELETE" in the toolbar: Button Function DELETE Delete analysis After confirming the confirmation prompt "REALLY DELETE THIS ANALYSIS?" with [YES] the analysis is deleted. The window for the absolute quantification (see Fig. 71) is then reset to the original state. 10.2 Relative quantification Using the relative quantification the relative expression ration of a target gene in a sample and a calibrator can be compared, standardized to the expression level of a reference gene. The expression level of the target gene in the calibrator is set to 1 for this purpose and the ratio of the expression level of the target gene in the sample is calculated in relation to it. After a relative quantification has been created via the function "NEW" the following areas are displayed in the corresponding window (see Fig. 78): Fig. 78 TOptical 'Window for relative quantification Issue 03/2011 75 Analysis qPCRsoft Range Function SELECTION AREA (1) Used to define basic configurations and to select the combination of target gene/dye and reference gene/dye. CURVE DISPLAY (2) FLUORESCENCE Displays the fluorescence curves determined for the target gene or reference gene. VALUE DISPLAY (3) Calculated factors for both standard curves. STANDARD CURVE Displays the standard curves calculated from the concentrations and measuring values for the target gene and reference gene or the sample table amended by the measuring results DISPLAY (4) 10.2.1 Selection area The selection area is divided into two areals: In the top status bar highlighted in red the selected method is displayed and via a selection list it is possible to select between different analyses created for the experiment. The name of the respective analysis is shown in the white field. Via the [+/-] sign at the right-hand margin of the status bar the lower part of the selection area can be shown or hidden (see Fig. 79). Various fields are arranged in the lower part to make important basic configurations for the analysis. The target gene to be quantified is defined via the selection list "GENE OF INTEREST (GOI)". Only one target gene can be quantified at a time. The reference gene is determined via the selection list "REFERENCE GENES". Unlike the target gene, several reference genes can be selected simultaneously. The number of tab pages in the display area expands accordingly with each reference gene (see Fig. 80). Via the button a reference gene can be deselected again. The number of tab pages in the display area reduces accordingly if a reference gene is deselected. If a dye has been set as passive reference, its fluorescence can be included in the calculation for standardization. For this purpose a tick must be placed in the corresponding checkbox. 1 Method 6 Remove references 2 Name of analysis 7 Group selection 3 Adjustment options 8 Include passive reference in calculation 4 Base line/scaling 9 Reference gene dye 5 Threshold adjustment 10 Target gene dye Fig. 79 The selection area in the window for the relative quantification is divided into an upper status bar highlighted in red and a lower part where various basic configurations can be made. Note Those dyes are made available for selection which where defined during the project creation in the tab Scan (see section 8.4). Die Checkbox "INCLUDE PASS. REFERENCE" is only active if in the tab "SCAN" a dye has been defined as passive reference. Via the selection field "GROUP" is defined for which experiment the analysis is to be carried out. 76 Issue 03/2011 TOptical qPCRsoft Analysis Note If this has been done, the corresponding division into groups will have been carried out during the project creation in the tab "LAYOUT" -> "CREATE GROUPS" (see section 8.8.2). The standard group number for all samples is 1. To manually adjust the threshold value a numerical value can be entered in the field "THRESHOLD". Because the display of the fluorescence curves (dRn) in the display area (see Fig. 80) is standardized to percentage values between 1 and 100, the threshold must be set to between 1 and 100. Note In addition to the manual configuration of the threshold via numerical values the qPCRsoft software also provides the option to have the threshold calculated automatically or adjust it in the display area of the fluorescence curves (see section 10.2.2). To adjust the base line or to select between linear and logarithmic view of the fluorescence curves a selection for viewing options can be made via the button with the right arrow (see Fig. 69). 10.2.2 Fluorescence curve display In the display area the measured data, standardized to the value 100 for the highest fluorescence intensity, are plotted against the cycle. The respective combination of target gene/dye or reference gene/dye displayed is displayed as an entry in the tab pages at the bottom left corner of the area. For the respective active combination the entry in the tab page is highlighted in white. The number of tab pages available depends on the number of reference genes selected. A separate tab page is displayed for each combination of reference gene/dye and can be selected to display the fluorescence data. For the combination of target gene/dye only one tab page is displayed at a time. By switching to another target gene/dye combination in the selection area (see section 10.2.1) the entry in the tab page changes accordingly. Dependent on the viewing option selected the fluorescence data are displayed either linear or logarithmic (see Fig. 80). For both view types a brief information is shown as soon as the mouse pointer is positioned on one of the curves. To determine Ct values for the analysis a threshold value for the fluorescence curves of the target gene and reference gene must be determined. This can be automated (see below) but is also possible manually in the display area. With the left mouse button depressed the black threshold line can be dragged up or down to adjust the corresponding value. At the same time as the threshold line is moved the Ct values update in the sample table (see section 10.2.3). Linear view Fig. 80 TOptical Logarithmic view Linear and logarithmic view of the fluorescence data for the relative quantification. The horizontal threshold line can be moved manually. Issue 03/2011 77 Analysis qPCRsoft Note For placing the threshold manually in the display area the logarithmic view is more suitable than the linear view because of the wider spread of the early exponential area of the product accumulation curves. The automatic calculation of the threshold value is started via the button "Autom. threshold" in the toolbar: Button Function AUTOM. THRESHOLD Automatic determination of the fluorescence threshold for detecting Ct values Both during manual determination and automatic calculation the resulting threshold value is simultaneously updated and displayed in the corresponding field in the selection area (see section 10.2.1). 10.2.3 Standard curves and values display In the area "STANDARD CURVES" the calculated standard curves are displayed for the target gene and all selected reference genes. For the display of the standard curves the Ct values of the samples are graphically plotted against the logarithm of their concentration. In the value area to the right of it the calculated data for the certainty measure R2, the gradient of the standard curves, the axis intercept (offset) and the PCR efficiency are displayed in tabulated form. Dependent on the view of the window for relative quantification a scroll bar is inserted below the table to navigate through the columns of the table. Using the tab pages "Curve" and "Table" it is possible to switch between the display of the calculated standard curves and the sample table for the relative quantification (see Fig. 81). The standard curves and the values are automatically calculated by the qPCRsoft software and updated if the configurations change. Standard curves Fig. 81 Sample table relative quantification Display of the standard curves and the sample table for the relative quantification The sample table for the relative quantification combines all data and corresponding measurements for the samples. The selection of columns displayed can be defined by the user. After right click on a column heading a selection field is shown (see Fig. 82): Fig. 82 78 Selection field to define the columns displayed in the table. Issue 03/2011 TOptical qPCRsoft Analysis Individual columns can be shown or hidden by selection or deselection. The layout of the columns can also be freely modified. By dragging a column heading with the left mouse button depressed columns can be swapped. The display of the results in the table can thus be adjusted as desired. The standard curves calculated by the software are also displayed in abbreviated form in the project explorer in item "RELATIVE QUANTIFICATION" (see section 5.1.3). The graphic plotting of the Ct values against the logarithm of the sample concentrations is displayed: Fig. 83 10.2.4 Display of the standard curves in the project explorer. Import a standard curve In addition to the option to measure standard curves in the experiment, the qPCRsoft software also allows for the sample concentrations to be calculated on the basis of a saved standard curve. An import function is available for this purpose in the toolbar. This can be opened via the button "IMPORT STANDARD CURVE": Button Function IMPORT STANDARD CURVE Import a saved standard curve The subsequent procedure is as described in section 10.1.4. 10.2.5 Delete relative quantification Deleting a relative quantification is possible via the function "DELETE" in the toolbar: Button Function DELETE Delete analysis After confirming the confirmation prompt "REALLY DELETE THIS ANALYSIS?" with [YES] the analysis is deleted: The window for the relative quantification (see Fig. 78) is then reset to the original state. TOptical Issue 03/2011 79 Analysis 10.3 qPCRsoft ΔΔCt method Using the ΔΔCt method the relative expression ration of a target gene can be compared between a sample and a calibrator. The expression level of the target gene in the calibrator is set to 1 for this purpose and the ratio of the expression level of the target gene in the sample is calculated in relation to it. The advantage of the ΔΔCt method is that the precise number of copies of the standard series does not have to be known and the calculation is only carried out using relative ratios. After a ΔΔCt method has been created using the function "NEW" the following areas are displayed in the corresponding window (see Fig. 84): Fig. 84 Window for the ΔΔCt method Area Function SELECTION AREA (1) Used to define basic configurations and to select the combination of target gene/dye and reference gene/dye FLUORESCENCE Displays the fluorescence curves determined for the target gene or reference gene DISPLAY (3) VALIDATION CURVE Displays the validation curves calculated for the expression ratio between the target gene and reference gene or the sample table amended by the measuring results VALUE DISPLAY (4) Factors calculated for the validation curves CURVE DISPLAY (2) 80 Issue 03/2011 TOptical qPCRsoft 10.3.1 Analysis Selection area The selection area is divided into two areals: In the top status bar highlighted in red the selected method is displayed and via a selection list it is possible to select between different analyses created for the experiment. The name of the respective analysis is shown in the white field. Via the plus/minus sign at the right-hand margin of the status bar the lower part of the selection area can be shown or hidden (see Fig. 85). Various fields are arranged in the lower part to make important basic configurations for the analysis. The target gene to be quantified is defined via the selection list "GENE OF INTEREST (GOI)". Only one target gene can be quantified at a time. The reference gene is determined via the selection list "REFERENCE GENES". Unlike the target gene, several reference genes can be selected simultaneously. The number of tab pages in the display area expands accordingly with each reference gene (see Fig. 86). Via the button a reference gene can be deselected again. The number of tab pages in the display area reduces accordingly if a reference gene is deselected. 1 Method 6 Remove references 2 Name of analysis 7 Group configuration 3 Show/hide adjustment options 8 Dye / reference gene 4 Base line / scaling 9 Dye / target gene 5 Threshold adjustment Fig. 85 The selection area in the window for the ∆∆Ct method is divided into an upper status bar highlighted in red and a lower part where various basic configurations can be made. Note Those dyes are made available for selection which where defined during the project creation in the tab Scan (see section Define the scan settings8.4). Via the selection field "GROUP" is defined for which experiment the analysis is to be carried out. Note If this has been done, the corresponding division into groups will have been carried out during the project creation in the tab "LAYOUT" -> "CREATE GROUP" (see section 8.8.2). The standard group number for all samples is 1. To manually adjust the threshold value a numerical value can be entered in the field "THRESHOLD". Because the display of the fluorescence curves (dRn) in the display area (see Fig. 86) is standardized to percentage values between 1 and 100, the threshold must be set to between 1 and 100. Note In addition to the manual configuration of the threshold via numerical values the qPCRsoft software also provides the option to have the threshold calculated automatically or adjust it in the display area of the fluorescence curves (see section 10.3.2). TOptical Issue 03/2011 81 Analysis qPCRsoft To adjust the base line or to select between linear and logarithmic view of the fluorescence curves a selection for viewing options can be made via the button with the right arrow (see Fig. 69). 10.3.2 Fluorescence curve display In the display area the measured data, standardized to the value 100 for the highest fluorescence intensity, are plotted against the cycle. The respective combination of target gene/dye or reference gene/dye displayed is displayed as an entry in the tab pages at the bottom left corner of the area. For the respective active combination the entry in the tab page is highlighted in white. The number of tab pages available depends on the number of reference genes selected. A separate tab page is displayed for each combination of reference gene/dye and can be selected to display the fluorescence data. For the combination of target gene/dye only one tab page is displayed at a time. By switching to another target gene/dye combination in the selection area (see section 10.3.1) the entry in the tab page changes accordingly. Dependent on the viewing option selected the fluorescence data are displayed either linear or logarithmic (see Fig. 86). For both view types a brief information is shown as soon as the mouse pointer is positioned on one of the curves. To determine Ct values for the analysis a threshold value for the fluorescence curves of the target gene and reference gene must be determined. This can be automated (see below) but is also possible manually in the display area. With the left mouse button depressed the black threshold line can be dragged up or down to adjust the corresponding value. At the same time as the threshold line is moved the Ct values update in the sample table (see section 10.3.3). Linear view Fig. 86 Logarithmic view Linear and logarithmic view of the fluorescence data for the ∆∆Ct method. The horizontal threshold line can be moved manually. Note For placing the threshold manually in the display area the logarithmic view is more suitable than the linear view because of the wider spread of the early exponential area of the product accumulation curves. The automatic calculation of the threshold value is started via the button "AUTOM. THRESHOLD" in the toolbar: Button AUTOM. THRESHOLD Function Automatic determination of the fluorescence threshold for detecting Ct values Both during manual determination and automatic calculation the resulting threshold value is simultaneously updated and displayed in the corresponding field in the selection area (see section 10.3.1). 82 Issue 03/2011 TOptical qPCRsoft 10.3.3 Analysis Validation curves and values display A precondition for creating a validation curve is the measurement of a standard series of different dilution levels of the target gene and reference gene. For the calculation of the ΔΔCt values the determination of a validation curve is not required, but it can be used to check the quality of the data. If standard series have been measured for the target gene and reference gene, the expression ratio between the target gene and reference gene is shown in graphical form in the area "Validation curves". For this purpose the average Ct value of the target gene is subtracted from the average Ct value of the reference gene for the respective dilution level and the resulting dCT(V) value plotted graphically against the concentration logarithm. In the 2 value area to the right of it the calculated data for the certainty measure R , the gradient of the validation curves and the axis intercept (offset) are displayed in tabulated form. The gradient of the line should not exceed a value of ± 0.1. The basic assumption then applies that the efficiencies of the amplification of the target gene and reference gene are identical and the calculation of the ΔΔCt values produces valid data. Dependent on the view of the window for the ΔΔCt method a scroll bar is inserted below the table to navigate through the columns of the table. Using the tab pages "CURVE" and "TABLE" it is possible to switch between the display of the calculated validation curves and the sample table for the ΔΔCt calculation (see Fig. 87). The validation curves and the values are automatically calculated by the qPCRsoft software and updated if the configurations change. Validation curves Fig. 87 Sample table ∆∆Ct method Display of the validation curves and the sample table for the ∆∆Ct method The sample table for the ΔΔCt method combines all data and corresponding measurements for the samples. The selection of columns displayed can be defined by the user. After right click on a column heading a selection field is shown (see Fig. 88 ): Fig. 88 Selection field to define the columns displayed in the table. Individual columns can be shown or hidden by selection or deselection. The layout of the columns can also be freely modified. By dragging a column heading with the left mouse button depressed columns can be swapped. The display of the results in the table can thus be adjusted as desired. TOptical Issue 03/2011 83 Analysis qPCRsoft The validation curves calculated by the software are also displayed in abbreviated form in the project explorer in item "DETADELTACT" (see section 5.1.3). The graphic plotting of the dCt(V) values against the logarithm of the sample concentrations is displayed: Fig. 89 10.3.4 Display of the validation curves in the project explorer. Delete ΔΔCt method Deleting a ΔΔCt method is possible via the function "DELETE" in the toolbar: Button Function DELETE Delete analysis After confirming the confirmation prompt "REALLY DELETE THIS ANALYSIS?" with [YES] the analysis is deleted. The window for the ∆∆Ct method (see Fig. 84) is then reset to the original state. 84 Issue 03/2011 TOptical qPCRsoft 10.4 Analysis Melting curve In the melting curve analysis the temperature in the reaction preparation is increased successively until a denaturation of the PCR product results. The dissociation of the fragment into individual strands results in the release of the intercalating dye SYBR Green. The concurrent reduction of the fluorescence intensity is measured by the device and logged. By generating the first derivation of the fluorescence curve you obtain a peak that describes the melting point and approximately also the concentration of the PCR fragment. Using the melting curve analysis it is possible to differentiate whether the reaction has resulted in the generation of a specific PCR product or whether unspecific side products, such as primerdimers, have been formed. After a melting curve analysis has been created via the function "NEW" the following areas are displayed in the corresponding window (see Fig. 90): Fig. 90 TOptical Window for melting curve analysis Area Function Selection area (1) Used to define basic configurations Fluorescence curve/melting curve display (2) Displays the fluorescence curves or the melting curves generated from the first derivation Sample table display (3) Displays the sample table amended by the measuring results Issue 03/2011 85 Analysis 10.4.1 qPCRsoft Selection area The selection area is divided into two areals: In the top status bar highlighted in red the selected method is displayed and via a selection list it is possible to select between different analyses created for the experiment. The name of the respective analysis is shown in the white field. Via the plus/minus sign at the right-hand margin of the status bar the lower part of the selection area can be shown or hidden (see Fig. 91). Various fields are arranged in the lower part to make important basic configurations for the analysis. As dye for the target gene "GENE OF INTEREST (GOI)" for the melting curve analysis SYBR Green (or an equivalent intercalating dye) must usally have been selected. If a dye has been set as passive reference, its fluorescence can be included in the calculation for standardization. For this purpose a tick must be placed in the corresponding checkbox. 1 Method 5 Threshold adjustment 2 Name of analysis 6 Group selection 3 Show/hide adjustment options 7 Include passive reference in calculation 4 Base line / scaling 8 Dye / target gene Fig. 91 The selection area in the window for the relative quantification is divided into an upper status bar highlighted in red and a lower part where various basic configurations can be made. Via the selection field "GROUP" is defined for which experiment the analysis is to be carried out. Note If this has been done, the corresponding division into groups will have been carried out during the project creation in the tab "LAYOUT" -> "CREATE GROUP" (see section 8.8.2). The standard group number for all samples is 1. To manually adjust the threshold value a numerical value can be entered in the field "THRESHOLD". Note In addition to the manual configuration of the threshold via numerical values the qPCRsoft software also provides the option to have the threshold calculated automatically or adjust it in the display area of the fluorescence curves (see section 10.4.2). To adjust the base line or to select between linear and logarithmic view of the fluorescence curves a selection for viewing options can be made via the button with the right arrow (see Fig. 69). 86 Issue 03/2011 TOptical qPCRsoft 10.4.2 Analysis Fluorescence curve/melting curve display In the display area the measured fluorescence curves, standardized to the value 100 for the highest fluorescence intensity, are plotted against the temperature. Dependent on the viewing option selected the fluorescence data are displayed either linear or logarithmic. For the samples a brief information is shown as soon as the mouse pointer is positioned on one of the curves (see Fig. 92). The melting temperature Tm is calculated by generating the first derivation of the melting curves from the resulting peaks and plotted against the temperature. Switching between the melting curve view and the derivations takes place via the tab pages in the bottom left corner of the display area. For the respective active view the entry in the tab page is highlighted in white. For the correct analysis a threshold value must be determined for the melting curves. This can be automated (see below) but is also possible manually in the display area. With the left mouse button depressed the black threshold line can be dragged up or down to adjust the corresponding value. Fluorescence curves Fig. 92 Melting curves Display of the fluorescence curves (linear view, left) and melting curves (right. The horizontal threshold line can be moved manually. Note For placing the threshold manually in the display area the logarithmic view is more suitable than the linear view because of the wider spread of the early exponential area of the melting curves. The automatic calculation of the threshold value is started via the button "AUTOM. THRESHOLD" in the toolbar: Button Function AUTOM. THRESHOLD Automatic calculation of the fluorescence threshold value Both during manual determination and automatic calculation the resulting threshold value is simultaneously updated and displayed in the corresponding field in the selection area (see section 10.4.1). TOptical Issue 03/2011 87 Analysis 10.4.3 qPCRsoft Sample table display The sample table for the melting curves combines all data and corresponding measurements for the samples. Sample table for the melting curve Fig. 93 Sample table for the melting curve analysis The selection of columns displayed can be defined by the user. After right click on a column heading a selection field is shown (see 88): Fig. 94 Selection field to define the columns displayed in the table. Individual columns can be shown or hidden by selection or deselection. The layout of the columns can also be freely modified. By dragging a column heading with the left mouse button depressed columns can be swapped. The display of the results in the table can thus be adjusted as desired. The melting curves calculated by the software are also displayed in abbreviated form in the project explorer in item "MELTING CURVE" (see section 5.1.3). The graphic plotting of the first derivation of the fluorescence values against the temperature is shown: Fig. 95 88 Display of the derivation of the melting curves in the project explorer. Issue 03/2011 TOptical qPCRsoft 10.4.4 Analysis Delete melting curve analysis An analysis can be deleted via the function "DELETE" in the toolbar: Button Function DELETE Delete analysis After confirming the confirmation prompt "REALLY DELETE THIS ANALYSIS?" with [YES] the analysis is deleted: The window for the melting curve analysis (see Fig. 90) is then reset to the original state. TOptical Issue 03/2011 89 Short manual 11 Short manual 11.1 Safety Warnings Do not open the instrument unless you are authorised to do so. Check the label at the backside if the instrument has correct voltage configuration (110V, 115 V or 230 V, see chapter 0). The thermoblock and the heated lid will reach high temperatures during operation. Both thermoblock and heated lid can burn you. Rapid heating of the thermoblock can cause liquids to boil explosively. Always wear safety goggles during operation. Close the lid before starting a program. It is not necessary to apply oil into the opening of the block in order to improve the heat transfer between the block and the sample tubes. If you still decide to use oil, do not use silicon oil. Mineral oil may be used. Ensure that both the rear and bottom ventilation slits at the rear and bottom of the instrument are unobstructed. Insufficient ventilation can cause overheating of the instrument. The qPCRsoft main window 90 The main window is arranged in different areas: Menu bar, Toolbar, Project explorer, Project interface Issue 03/2011 TOptical Short manual Project window - Settings To create a new project select "New" from the menu point "File" or press the corresponding button in the toolbar. Use the commands "Open project" or "Open template" to load saved files. Enter general information for the project under tab "GENERAL" Enter PCR program under tab "THERMAL CYCLER": − Set lid temperature and activate or deactivate preheat mode. − Set temperature and time for each step. If desired define gradient (only for TOptical Gradient) − For loops set the step number in column "GOTO" the program jumps back to and in the column "LOOPS" define the number of measurement repeats. − If necessary define temperature or time increments or adjust the ramping rates − If necessary activate the melting step and edit parameters − In the column "scan" define at which step the fluorescence is measured TOptical Define scan settings under the tab "SCAN": Issue 03/2011 91 Short manual − Set hash key in the column "MEASUREMENT" for each channel to measure − Select dye to measure in column "DYE" and set LED intensity in column "GAIN" − For passive reference check mark in column "PASS. REF." − Set number of measurement repeats and define region to scan − If necessary activate colour compensation Define plate layout under the tab "LAYOUT" (can be done during the run): − Set sample name and sample type − Enter name for the gene to be measured in column "GENE" − For standards enter concentration in column "CONC." and set unit − Select position or region in the plate layout − Assign settings to the selected wells using Toolbar-Button − If the plate contains samples from different experiments that have to be analyzed separately create groups: − Select group and set group name − Select position or region in the plate layout − Assign settings to the selected wells using Toolbar-Button 92 Issue 03/2011 TOptical Short manual The layout preview functions provides a comprehensive overview fort he plate layout. To activate the layout preview use button Project window - Monitoring Press button to start the run In the monitoring window the results of the run are displayed in real-time − For the results either the PCR accumulation curves or the melting curves can be displayed. Use selective list "VIEW” to display the different results. − Use dye tabs to select between the different dyes − The PCR protocol can be displayed tabular, graphical or as temperature profile Project window - Analysis TOptical For analysis different analysis methods for absolute quantification, relative quantification, ΔΔCt-method and melting curve analysis are available To start an analysis select corresponding tab and press button "ADD ANALYSIS" in the toolbar. The button "add analysis” is labelled with a + -symbol. In the window that opens enter a name for the analysis: The analysis window is separated in a header for general settings, a graphical chart to display amplification curves and an area to display standard- or validation curves or the sample table: Issue 03/2011 93 Short manual In the header various settings can be made that differ by the analysis methods − Select gene of interest (GOI) − If applicable set passive reference (e.g. ROX) for normalisation − Select between different experiments (groups) − Select at least one reference gene to calculate a standard or validation curve − Set baseline correction − Set threshold (manually or automatically) − Switch between linear and logarithmic display of the fluorescence intensities In the amplification curves area the fluorescence intensity curves are shown. − In the linear mode the base line correction can be checked − In the logarithmic mode the threshold line can be set manually. Move the threshold line up or down by using the mouse. − Switch by the tabs between the different dyes − If the cursor is moved on a curve a short information for the sample is displayed In the lower part of the analysis window the standard or validation curves are displayed − For the curves calculated values are displayed in a table − Use tabs to switch between the display of curves and of the sample table 94 Issue 03/2011 TOptical Short manual Standard-/Validation curves Sample table − Define columns to be displayed in the sample table after right mouse click on a column header − Export data from the sample table as *.csv files after right mouse click in the table TOptical Issue 03/2011 95 TOptical base unit 12 TOptical base unit The TOptical base unit educes from the Biometra TProfessional Thermocycler. The base unit has its own software to ensure the operation of the unit as a standard PCR Thermocycler when the block is exchanged. The TOptical Thermocycler is controlled in remote control by the PC software qPCRsoft but some software functions of the base unit are also accessible during the operation as real-time PCR Thermocycler. These are described below. 12.1 The TOptical user interface The TOptical user interface provides four menu buttons above the screen and four softkeys below the screen 12.1.1 TOptical menu buttons The four menu buttons allow quick access to the TOptical main menus. These are: Login /out menu System menu Block menu Program menu The active menu is indicated by a graphical link to the respective menu button. The example shows Program menu is active. The four menu buttons are permanent and always have the same function. This is in contrast to the softkeys. The softkey functions change depending on the current software menu. 96 Issue 03/2011 TOptical TOptical base unit 12.1.2 TOptical softkeys Below the display there are four softkeys. In contrast to the menu buttons, the softkeys have changing functionalities, which are shown in the above display line. 12.1.3 Log in menu To enter the Log In menu, press the menu button [Log in/out] above the display. When the instrument is switched on, the log in screen is displayed. To use the instrument a user has to be selected. Alternatively, a new user can be created. Note In the real-time PCR mode with the TOptical module inserted the log-in is performed by the PC software qPCRsoft automatically. 12.1.4 Block menu To enter the Block menu, press the menu button [Block] above the display. TOptical Issue 03/2011 97 TOptical base unit The Block menu shows the current status of the block. The block can be active with a program running or free. 12.1.5 System menu To enter the System menu, press the menu button [System] above the display. The System menu allows global settings and provides information about the instrument. The power on self test log files can be retrieved and service files generated, a detailed description of this menu is shown in section 13. 12.1.6 Program menu To enter the Program menu, press menu button Program above the display. For the TOptical Thermocycler programs can be created or edited in the qPCRsoft Software. It is only possible to view a program prior to start. 98 Issue 03/2011 TOptical TOptical base unit 12.2 TOptical software Navigation within software menus Four navigation keys provide easy navigation within the software screens. The [left] and the [right] key have additional functionalities as described below: The right cursor key moves the cursor to the next field. This cursor can also be used to confirm data entry. By pressing the right cursor settings will be saved and the cursor moves to the next field. In the file directory, this key moves to cursor forward to the next (lower) level. The left cursor key moves the cursor back to the previous field. In most screens this cursor is equivalent to the ”back” key. In the file directory, this key moves the cursor back to the higher level. 12.2.1 Log in The TOptical manages up to 30 individual users. For each user a directory is created where programs are stored. Each user is identified by a user name (max. 15 digits) plus initials (2-3 letters). Each user account can be protected by a PIN consisting of 1-7 digits. If no PIN protection is wanted, leave the field "Enter PIN” empty and confirm with [Enter]. Note: If no PIN protection is used, programs in the user directory may be changed or deleted by unauthorized persons. 12.2.2 Log in existing user Press menu button [Log in/out] above the display. A list of users is shown: Select user with cursor keys or enter first initial. The cursor jumps to the first account starting with this letter. TOptical Issue 03/2011 99 TOptical base unit Note When the TOptical module is inserted the temporary directory "TOptical” is created during the initialisation of the system. The directory is used by the PC software qPCRsoft to process Real-Time PCR protocols. Press softkey [Log in] and enter your PIN. Confirm PIN with softkey [PIN-code OK]. Then the currently logged-in user is shown: Note The directory "TOptical" is a temporary directory used by the qPCRsoft software. By standard for this directory no PIN-code can be set. 100 Issue 03/2011 TOptical TOptical base unit 12.2.3 Create new user account Press menu button [Log in/out] above the display. To create a new user account press softkey [New User]. Enter your name and 2-3 initials. Enter a personal identification number (PIN) consisting of 1-7 digits. For security reasons, you are requested to repeat the entry of your PIN. Note Protection of directories by a PIN-code is optional. If no PIN-code protection is wanted, just confirm with [User data OK]. Note Your PIN can be changed any time in the System menu (see section 13.6.1). 12.2.4 Supervisor Log in Only the supervisor is authorized to change global instrument settings. This includes update of firmware and the deletion of user accounts. To log in as supervisor, press the [Log in/out] menu button above the display. Press softkey [Supervisor Log in], enter supervisor PIN and confirm with [PIN-code OK]. The default supervisor PIN is 000 000 0 (do not enter blanks). TOptical Issue 03/2011 101 TOptical base unit 12.2.5 Delete User Once logged in, you can delete your own account in the System menu (see section 13.1.3). In addition, any user can be deleted by the supervisor. To delete a user, log in as supervisor (see section 0) and select menu option "delete user”. Choose the user account you would like to delete and confirm with [OK]. Note By deleting a user account all programs in the referring user directory will be deleted. It is therefore recommended to safe the programs in a different directory prior to deleting a user account. Note The temporary directory "TOptical” can not be deleted. 12.3 View program For the TOptical Thermoycler programs can only be created by the PC-Software qPCRsoft (see chapter 0). It is only possible to view programs prior to start. Press [Open directory]. Select a program from the list using the cursor key and press [View program]. 102 Issue 03/2011 TOptical TOptical base unit Spreadsheet mode [View Table] Graphical mode [View Graph] To toggle between the spreadsheet and graphical mode use [View Graph] or [View Table]. 12.3.1 Display during operation When the TOptical Thermocycler runs a program the following screen is shown: The status of the block can be free, active or paused. The user that started the program and the estimated run time are shown. Additionally "Remote control” is displayed. 12.3.2 Stop program To stop the active program press red [Stop] button on the control panel (see chapter 4.3). To abort the active program confirm with [OK]. TOptical Issue 03/2011 103 TOptical base unit - System settings 13 TOptical base unit - System settings To change global settings press the [System] menu button above the display (see chapter 12.1). The system menu main screen opens. Choose a single menu item using the cursor keys, then press [Select]. 13.1 User configuration These functions allow changes to individual user accounts. Choose a single menu item using the cursor keys, then press [Select] or press [Overview] to go back to the system main menu. 13.1.1 Set language The language can be set and stored individually for each user account. Available languages are English and German. 104 Issue 03/2011 TOptical TOptical base unit - System settings Select a language using the cursor keys and press [Select Language]. The [Default Language] is English. Note The language for the boot process (before a user is logged in) can be set by the supervisor (see chapter 13.6.4). 13.1.2 Change individual PIN The option allows changing the PIN of the current user. 13.1.3 Delete account Any user can delete his or her personal account. Press [OK] to confirm the account to be deleted. IMPORTANT To delete a user account will erase the user directory and all programs stored within. Therefore prior to deleting an account, ensure that the user directory is empty or save a copy of the programs to a different user directory for further usage. Note The temporary directory "TOptical” can not be deleted. TOptical Issue 03/2011 105 TOptical base unit - System settings 13.2 System configuration The options in this menu allow to the general system settings. Choose a single menu item using the cursor keys, then press [Select] or press [Overview] to go back to the system main menu. 13.2.1 Configure beep To configure the system beep, use the cursor keys to set the beep on or off and confirm selection with softkey [Save]. The signal beep sounds when a program is going into a pause or is stopped. The signal beep can be stopped by pressing any key (except the [Stop] button on the control panel). The setting for [Default Beep] is beep off. 106 Issue 03/2011 TOptical TOptical base unit - System settings 13.2.2 Configure display contrast The display contrast can be set individually for each user. Change settings with the cursor keys and confirm with softkey [Save Contrast]. The setting for [Default Contrast] is the median position. 13.2.3 Set time and date Enter settings for date and time and confirm with softkey [Set Time and Date]. 13.2.4 Defragment memory By erasing and creating PCR-protocols after a while new files may be stored in a fragmented fashion in the memory of the TOptical Thermocycler. This leads to increased memory access times and the software reacts slower to user inputs. By defragmentation the information becomes sorted and is stored in order thus leading to decreased memory access times. Subsequently the software reacts faster to user inputs. TOptical Issue 03/2011 107 TOptical base unit - System settings Confirm your selection with [OK] and wait until the defragmentation process is finished. 13.2.5 Screen saver Set the screen saver on or off and if necessary change the time after the screen saver is started Press [Save] to save the settings. The setting for [Default] is screen saver on and starts after 30 min. 13.3 System info This menu provides information on the instrument and on the log files of the last nine runs. Choose a single menu item using the cursor keys, then press [Select] or press [Overview] to go back to the system main menu. 108 Issue 03/2011 TOptical TOptical base unit - System settings 13.3.1 System info Use this option to display the instruments serial number, block type and software version. 13.3.2 View run log files of the last five runs During each run a log file is stored in the Thermocycler memory. The log files of the last five runs can be viewed in this window. Choose a program using from the list the cursor keys, then press [View Run-Logfile]. In the run log file several information for the performed run are stored. For an overview of the used program press [View Program], for a comprehensive of all messages for this run press [View Messages]. TOptical Issue 03/2011 109 TOptical base unit - System settings 13.4 Service This menu provides several service functions for the instrument. 13.4.1 View log files of Power on self test During the boot process the TOptical hardware is checked (power on self test). The results of the last log file are stored and can be displayed. 13.4.2 Execute block extended self test In addition to the regular power on self test, a more comprehensive extended block self test can be triggered by the user. In the extended block self test the unit can check the status and condition of different components and functions. Therefore, this test is an important tool and gives useful information to the customer whether the Thermocycler is still working within its specifications. To initiate the extended block self test press [Execute Selftest]. The test takes approximately 20 minutes. During the test no programs can be run on the thermocycler. 110 Issue 03/2011 TOptical TOptical base unit - System settings At certain intervals the unit will automatically recommend to check the components of the unit, i.e. to execute an extended block self test (message 729). Press [Quit] to confirm that the recommendation has been noticed. In case the unit is switched off but the extended block self test has not been initiated, the message will be shown again after the unit is switched on. IMPORTANT It is recommended to execute the extended block self test regularly. 13.4.3 View log files from extended self test The results of the extended self test log files are stored by the instrument. To view a summary of the self test select the suitable log file from the menu using the cursor keys and press [Select]. TOptical Issue 03/2011 111 TOptical base unit - System settings The next screen summarizes the results of the extended block self test at a glance and gives an overview for the actual status of all important system components. Press [More results] to display additional results from the extended block self test. Press [List Logfiles] to go back to the list of extended block self test log files. 13.4.4 View Error log files A history of all software and hardware errors is shown in this menu. Note Several errors are displayed as message screens by the software including buttons for user interaction. 112 Issue 03/2011 TOptical TOptical base unit - System settings 13.4.5 Create service info file for the Biometra Service Department This option creates a service info file containing technical details for remote failure diagnosis by the Biometra Service Department. Connect the Thermocycler by a serial cable (mode full handshaking) to a computer and start the hyperterminal or use TProfessional Manager Software. Press [OK] to start the data transfer. Send the SINF (Service Info File) by email to the Biometra Service Department (see chapter 13.5). 13.5 How to contact Biometra This screen shows information how to contact Biometra. TOptical Issue 03/2011 113 TOptical base unit - System settings 13.6 Supervisor system configuration The supervisor has access to an own system menu with some specific functions. 13.6.1 Change user PIN The supervisor can change the PIN for each user account. Select the appropriate user directory from the list and press [Select User]. Enter a new PIN and repeat the PIN-code. Confirm with [PIN OK]. Note The temporary directory "TOptical” has no PIN-code. 13.6.2 Delete user account The supervisor can delete user accounts regardless if they are password protected or not. Select the appropriate user directory from the list and press [Select User]. 114 Issue 03/2011 TOptical TOptical base unit - System settings Select the user account to be deleted and confirm with [OK]. The directory and all programs therein are deleted. Note The temporary directory "TOptical” can not be deleted. 13.6.3 Change supervisor PIN The supervisor account is protected by a PIN-code. The default Supervisor PIN is 000 000 0 (do not enter blanks). Enter your new PIN and repeat your input. Confirm with [PIN OK]. TOptical Issue 03/2011 115 TOptical base unit - System settings IMPORTANT Please make a note of the supervisor pin und keep it on a safe spot. A forgotten supervisor pin can only be reset by the Biometra Service Department and requires to send back the instrument. 13.6.4 Set boot language The language displayed during the boot process can be set by the supervisor. Use the cursor keys to select a language and confirm with [Select Language]. The [Default Language] is English. 13.6.5 Delete all user accounts The supervisor can delete all user accounts and including all programs. In the next screen confirm with [OK] to delete all accounts. IMPORTANT Deleted user accounts and programs can not be restored! 116 Issue 03/2011 TOptical Trouble shooting 14 Trouble shooting 14.1 Slow heating and cooling The TOptical is equipped with a strong ventilator for the cooling of the heat sink. The inlet of this fan is located at the bottom side of the instrument. Be sure that the inlet is not clogged by dust or other material (e.g. a sheet of paper placed under the cycler can be attached to the inlet as the fan is in operation). Dust can be removed easily from the inlet with a conventional vacuum cleaner. 14.2 Autorestart Running programs will be continued from the same step where the power failure has happened as soon as the power is supplied again. A message is displayed showing (a) that a power failure occurred during the run and (b) when and at which step the program was started again: Confirm with [OK] to close the message screen. 14.3 Restart due to unrecognised power failure High voltage fluctuation can lead to an automatic restart of the Thermocycler. In this case the cycler restarts at the step where there power failure has occurred. To avoid voltage fluctuation, do not connect the cycler to a socket shared by a strong power consumer like a refrigerator or a centrifuge. 14.4 Adaptation of protocols from other cyclers Since the TOptical is a fast instrument it may be necessary to reduce the heating and cooling ramps to run protocols from other cyclers. The heating and cooling ramps can be set in the programming table in the qPCRsoft software . Alternatively, the time settings may be extended. TOptical Issue 03/2011 117 Maintenance and repair 15 Maintenance and repair 15.1 Cleaning and Maintenance The TOptical was built to operate for a long time without the need for periodical maintenance. Nevertheless, occasionally cleaning of the air inlet may be necessary to maintain the efficiency of the Thermocycler. Insufficient airflow may lead to reduced heating and cooling rates. The inlet for the airflow is located at the bottom side of the instrument. Be sure that the inlet is not clogged by dust or other material (e.g. a sheet of paper placed under the cycler can be attached to the inlet as the fan is in operation). Dust can be removed easily from the inlet with a conventional vacuum cleaner. Additionally, the Thermocycler housing may be cleaned from time to time with a smooth cotton cloth. Do not use strong detergents or organic solvents for cleaning. Never treat silver block with abrasive agents. GEFAHR! PATHOGENES PROBENMATERIAL! Appropriate safety regulations must be observed when working with infectious or pathogenic material. 15.2 Servicing and repair The TOptical Thermocycler contains no user serviceable parts. Do not open the housing instrument. Service and repair may only be carried out by the Biometra Service department or otherwise qualified technical personal. The Service department offers Thermocycler maintenances and temperature verifications. Biometra recommends an annual maintenance and a biannual temperature check for all Thermocyclers. Please call the following phone number for detailed information: +49 55150881-10/12. 15.3 Firmware update For instruction for firmware upgrade, please contact the Biometra Service Department or your local distributor/sales representative. 15.4 Replacement of Spare Parts Only original spare parts mentioned in these operating instructions are allowed. 118 Issue 03/2011 TOptical Service 16 Service Should you have any problems with this unit, please contact our service department or your local Biometra distributor: Biometra GmbH Service Department Rudolf-Wissell-Straße 14 - 16 D-37079 Göttingen Phone:++49 (0)5 51 50 68 6 - 10 or 12 Fax: ++49 (0)5 51 50 68 6 -11 e-mail: 16.1 [email protected] Instructions for return shipment VORSICHT! FACHGERECHTE DEKONTAMINATION DURCHFÜHREN! If you would like to send the unit back to us, please read the following return instructions in chapter 16.1. In case of an instrument failure that cannot be fixed by the procedures described in section 12 please proceed as follows: Return only defective devices. For technical problems which are not definitively recognisable as device faults please contact the Technical Service Department at Biometra (Tel.: +49 551-50881-10/12, Fax: +49 551-50881-11, e-mail: [email protected]). Please contact our service department for providing a return authorization number (RAN). This number has to be applied clearly visible to the outer box. Returns without the RAN will be not be accepted! Please prepare written confirmation that the device is free from biologically dangerous and radioactive contaminants. The declaration of decontamination (see section 17) must be attached to the outside of the packaging. Use the original packing material. If not available, contact Biometra or your local distributor. Label the outside of the box with "CAUTION! SENSITIVE ELECTRONIC INSTRUMENT!” IMPORTANT Carefully clean all parts of the instrument of biologically dangerous, chemical or radioactive contaminants. If an instrument is contaminated, Biometra will be forced to refuse to accept the device. The sender of the repair order will be held liable for possible losses resulting from insufficient decontamination of the device. Please enclose a note which contains the following: TOptical 1. Sender’s name and address 2. Name of a contact person for further inquiries with telephone number, Issue 03/2011 119 Service 3. 16.2 Description of the fault, which also reveals during which procedures the fault occurred, if possible Packing of the Thermocycler Biometra uses an extra designed packaging system where the instrument is mounted in between two tearproof foils. The Thermocycler is put onto the lower inlet and is fixed in between the foils by pressing the upper inlet down. IMPORTANT The Thermocycler is only protected from transport damage if the packing instructions are followed and the instrument is mounted in between the foils. Biometra will not be responsible for transport damage by improper packing. Gerät zwischen den Folien schwebend einspannen! Mount instrument floating in between the foils! 120 Issue 03/2011 TOptical Equipment Decontamination Certificate 17 Equipment Decontamination Certificate To enable us to comply with german law (i.e. §71 StrlSchV, §17 GefStoffV and §19 ChemG) and to avoid exposure to hazardous materials during handling or repair, please complete this form, prior to the equipment leaving your laboratory. COMPANY / INSTITUTE _________________________________________________________________________ ADDRESS _________________________________________________________________________ PHONE NO _________________________ FAX NO____________________________ E-MAIL ___________________________________________________________________ EQUIPMENT Model Serial No _____________________ _____________________ _____________________ _____________________ _____________________ _____________________ _____________________ ______________________ If on loan / evaluation Start Date: __________________ Finish Date __________________ Hazardous materials used with this equipment: _________________________________________________________________________ _________________________________________________________________________ _________________________________________________________________________ Method of cleaning / decontamination: _________________________________________________________________________ _________________________________________________________________________ _________________________________________________________________________ The equipment has been cleaned and decontaminated: NAME ____________________________ POSITION _______________________ (HEAD OF DIV./ DEP./ INSTITUTE / COMPANY) SIGNED _____________________________ TOptical Issue 03/2011 DATE ____________________________ 121 Equipment Decontamination Certificate PLEASE RETURN THIS FORM TO BIOMETRA GMBH OR YOUR LOCAL BIOMETRA DISTRIBUTOR TOGETHER WITH THE EQUIPMENT. PLEASE ATTACH THIS CERTIFICATE OUTSIDE THE PACKAGING. INSTRUMENTS WITHOUT THIS CERTIFICATE ATTACHED WILL BE RETURNED TO SENDER. General Information for Decontamination: Please contact your responsible health & safety officer for details. Use of radioactive substances: Please contact your responsible person for details. Use of genetically change organism or parts of those: Please contact your responsible person for details. 122 Issue 03/2011 TOptical Note for the disposal of electric / electronic waste. 18 Note for the disposal of electric / electronic waste. Note for disposal of electric / electronic waste Hinweis für die Entsorgung von Elektroaltgeräten Renseignement du traitement des déchets des appareils électrique / électronique This symbol (the crossed-out wheelie bin) means, that this product should be brought to the return and / or separate systems available to end-users according to yours country regulations, when this product has reached the end of its lifetime. For details, please contact your local distributor! This symbol applies only to the countries within the EEA*. EEA = European Economics Area, comprising all EU-members plus Norway, Iceland and Liechtenstein. --------------------------------------------------------------------------------------------------------------------------Dieses Symbol (die durchgestrichene Abfalltonne) bedeutet, dass dieses Produkt von der Firma Biometra für eine kostenlose Entsorgung zurückgenommen wird. Dies gilt nur für Geräte, die innerhalb Deutschlands gekauft worden sind. Kontaktieren Sie für die Entsorgung bitte die Biometra Service-Abteilung! Außerhalb Deutschlands wenden Sie sich bitte an den lokalen Händler. Dieses Symbol gilt nur in Staaten des EWR*. *EWR = Europäischer Wirtschaftsraum, umfasst die EU-Mitgliedsstaaten sowie Norwegen, Island und Liechtenstein. --------------------------------------------------------------------------------------------------------------------------Cet symbol (conteneur à déchets barré d´une croix) signifie que le produit, en fin de vie, doit être retourné à un des systèmes de collecte mis à la disposition des utilisateurs finaux en conséquence des régulations par la loi de votre pays. Pour des information additionel nous Vous demandons de contacter votre distributeur! Cet symbole s´ápplique uniquement aux pays de l´EEE*. EEE = Espace économique européen, qui regroupe les États membres de l´UE et la Norvège, Islande et le Liechtenstein. TOptical Issue 03/2011 123 Warranty 19 Warranty This Biometra instrument has been carefully build, inspected and quality controlled before dispatch. Hereby Biometra warrants that this instrument conforms to the specifications given in this manual. This warranty covers defects in materials or workmanship as described under the following conditions: This warranty is valid for 24 months from date of shipment to the customer from Biometra. This warranty will not be extended to a third party without a written agreement of Biometra. This warranty covers only the instrument and all original accessories delivered with the instrument. This warranty is valid only if the instrument is operated as described in the manual. Biometra will repair or replace each part which is returned and found to be defective. This warranty does not apply to wear from normal use, failure to follow operating instructions, negligence or to parts altered or abused. 124 Issue 03/2011 TOptical Subject Index 20 Subject Index Absolute quantification .......................... 70 Analysis ................................................. 68 Absolute quantification ...................... 70 Melting curve ..................................... 85 Relative quantification ....................... 75 ΔΔCt method ..................................... 80 Autorestart........................................... 117 Beep .................................................... 106 Block menu ........................................... 97 Block type.............................................. 45 Contact ................................................ 113 Decontamination Certificate ................ 121 Define groups ........................................ 61 Defragmentation ................................. 107 Display Contrast ........................................... 107 Disposal .............................................. 123 Edit program.......................................... 56 Edit sample table .................................. 57 Firmware update ................................. 118 Gradient .......................................... 49, 50 Heated lid .............................................. 46 Language .................................... 104, 116 Layout preview ...................................... 62 Log file................................. 110, 111, 112 Log in .................................................... 99 Log in menu .......................................... 97 Maintenance........................................ 118 Melting curve ............................. 51, 67, 85 Menu bar ......................................... 20, 21 Menu item AbsQuant........................................... 22 DeltaDeltaCt ...................................... 23 Layout ................................................ 22 MeltCurve .......................................... 23 Monitoring .......................................... 22 RelQuant ........................................... 23 Menu item Color .................................... 22 Menu item Cycler .................................. 22 Monitoring ............................................. 64 Melting curve ..................................... 67 PCR protocol ..................................... 66 Operation Voltage ................................. 15 Packing ............................................... 120 Passive reference ................................. 52 PCR protocol ................................... 44, 66 PIN-Code .................... 100, 105, 114, 115 Program Gradient ............................................. 49 Heating and cooling rate ................... 49 Hold time ........................................... 47 Linear gradient .................................. 50 TOptical Issue 03/2011 Loop................................................... 47 Melting curve ..................................... 51 stop .................................................. 103 Temperature ...................................... 47 View ................................................. 102 Program menu ...................................... 98 Programming Graphic .............................................. 56 Project ................................................... 42 Project explorer ............................... 20, 26 Project interface .............................. 20, 26 Project window Open .................................................. 42 Relative quantification ........................... 75 Repair.................................................. 118 Safety precautions ................................ 11 Sample types ........................................ 58 Scan settings......................................... 52 Screen saver ....................................... 108 Self test extended .......................................... 110 Power on self test ............................ 110 Service ................................................ 110 Service info file .................................... 113 Servicing ............................................. 118 Short manual ......................................... 90 Start PCR protocol ................................ 65 Supervisor ................................... 101, 114 System configuration .......................... 106 System info ......................................... 108 System menu ........................................ 98 System settings ................................... 104 Tab Analysis ............................................. 42 Configurations ................................... 42 Monitoring .......................................... 42 Technical specifications .......................... 8 Temperature increment ......................... 48 Template Save .................................................. 63 Time and Date..................................... 107 Time increment ..................................... 48 Toolbar ............................................ 20, 23 User account create............................................... 101 delete ............................... 102, 114, 116 User Account Delete .............................................. 105 User interface ........................................ 96 Warranty.............................................. 124 ΔΔCt method ......................................... 80 125