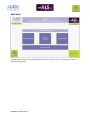
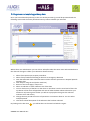
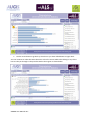
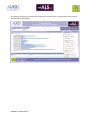
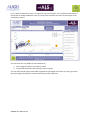
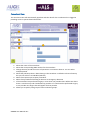
1
SWORD (Surgical Workload, Audit and Research Database)
SWORD has been developed to provide AUGIS/ALS members with the ability to explore quality and
outcomes data on a number of intervention areas with the ability to view data at a pathway level
‘drilling-down’ to pseudonomysed consultant code as well as a consultant view which autopopulates with the surgeon who is logged in data. The tool is currently in pilot phase with further
development pathways in the pipeline for release in the near future.
Accessing the tool
You can access the tool on both the ALS and AUGIS websites.
You need to have a log-in name and password to access the tool. Please contact Ian Beckingham
(contact to be confirmed) for access.
Using the tool
The tool is very simple to navigate. You will first need to log into the tool on the link above. Just
enter the user name and password supplied to you.
SWORD User Manual v0.1
Main Menu
The main menu presents you with 3 pathways on screen. You can click on any of these to start to
explore indicator data.
SWORD User Manual v0.1
Drilling down and exploring pathway data
Once you have selected a pathway (in this case Cholecystectomy) you will be presented with the
following screen with the latest period and activity volume indicator pre-selected.
1
2
3
4
5
7
6
8
8
9
Where there are radio buttons you can click to select/de-select that item. Once selected the data in
the chart will change to reflect your selections almost instantly.
1. Select from Laproscopic or Open procedures
2. Select from procedures following an elective or emergency admission
3. View the OPCS and other code information used to find the operations in Hospital Episode
Statistics data.
4. View help on using the tool (to be made live)
5. Return to the home page / main menu
6. Select an indicator to view a different cut of the data
7. You can click on any of the bars on the chart to ‘drill down’ into the next level of data. The
top banner of the chart will populate with text of what the data relates to based on your
selections. By hovering over the bar you will see a pop up box that gives the selected
indicator value and activity
8. Change the time period the counts of operations or outcomes relate to. You can select
multiple periods
9. This shows a brief description of the indicator that has been selected.
By clicking on the bar chart
7
8
SWORD User Manual v0.1
you will be taken to the next level which is region.
1
1. Use the arrow button to go back up a level once you have drilled down to region level.
You can continue to make the same selections as the first screen whilst also clicking on any of the
bars to take you through to the providers within that region as shown below.
SWORD User Manual v0.1
By selecting a provider are presented with data by consultant which is pseudonomysed to prevent
identification of individuals.
SWORD User Manual v0.1
For a number of indicators, there is an option to view a funnel plot. The screenshot below shows a
funnel plot for 30 day readmission rate (%). The options and filters the same as with the bar chart
view (shown earlier).
2
1
You can hover over any bubble to see the details or;
1. Start typing the name of a provider to select
2. The provider selected in the search box will turn green
You can select the Bar Chart/ Data Table to go back to the original view and at any time, go back to
the home page to drill down or explore data about another operation.
SWORD User Manual v0.1
Consultant View
The consultant view will automatically populate with the data for the consultant who is logged in
providing access to personalised information.
2
1
1
3
4
8
5
7
8
6
1. Shows the name of the consultant
2. Shows the corresponding GMC number for the consultant
3. Change the time period the counts of operations or outcomes relate to. You can select
multiple periods
4. Shows the pathways there is data relating to the consultant. It defaults to show all activity
but you can select to an individual pathway
5. Select from Laproscopic or Open procedures
6. Select from procedures following an elective or emergency admission
7. If the consultant has performed surgery in more than one provider there will be two charts
shown. A total activity and a breakdown by provider. If a consultant has performed surgery
in one provider one larger chart will appear for that provider
8. Allows you to quickly view groups of other indicators groups.
SWORD User Manual v0.1