1
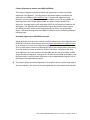
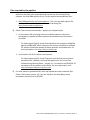
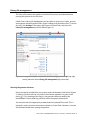
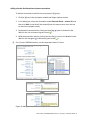
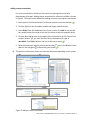
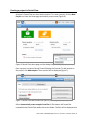
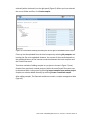
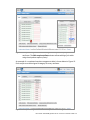
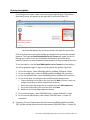
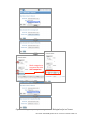
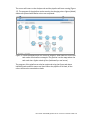
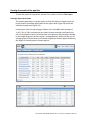
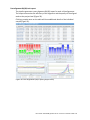
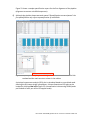
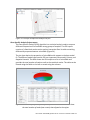
User Guide: Small RNA pipeline for Ion Torrent™ in Partek® Flow® This is a guide to the analysis of microRNA Next Generation Sequencing data using the Small RNA pipeline for Ion Torrent™ in the Partek® Flow® software. It covers the following: Overview of the pipeline Files required for the pipeline Library file management Creating a project in Partek Flow Assigning attributes to samples Importing the pipeline into Partek Flow Running the pipeline Viewing the results of the pipeline List of additional documents • • • • • • • • • Overview of the pipeline Primary alignment to m ature microRNA sequences Figure 1: The Small RNA pipeline for Ion Torrent Secondary alignment to transcriptome The Small RNA pipeline for Ion Torrent (Figure 1) is a Bowtie2 based pipeline for the quantitation of mature microRNAs. The pipeline was developed and tested on research data and annotation for Homo sapiens (hg19). However, it can be used for any species, provided the reference genome and the the required annotation files are available. User Guide: Small RNA pipeline for Ion Torrent™ in Partek® Flow® 1 Primary alignment to mature microRNAs (miRBase) The reads are aligned to known locations and sequences of mature microRNA sequences using Bowtie 2. The reference for the Homo sapiens microRNAs was obtained from miRBase (www.miRBase.org). For improved alignment using Bowtie2, the chromosomal coordinates from miRBase version 20 was padded 10 bases upstream and 10 bases downstream to create a new annotation file. Alignment, coverage report, post-‐alignment QAQC for this pipeline is based on this annotation. The aligned reads are quantified to give total counts of each mature microRNA (hsa-‐mir), which can be downloaded as text files in the quantitation report. Differentially expressed microRNAs are determined by comparing between sample groups. Secondary alignment to GENCODE transcripts Reads which do not map to the mature microRNA reference are then aligned to the GENCODE v19 whole transcriptome reference (www.gencodegenes.org/stats.html) in an attempt to ‘rescue’ more alignments to better characterize a small RNA library. This can have value in terms of evaluating QC/QA of your sample/library. Moreover, since the library has been enriched for smaller transcripts, the quantitation step after alignment can reveal presence of other RNA species such as snoRNAs, snRNA, and processed pseudogenes, among others. As with the microRNA quantitation step, the gene-‐level or transcript level read counts may be downloaded using the links at the bottom of the quantitation report. ! The purpose of the secondary alignment is to see where the rest of the reads align to the transcriptome. The results of the two alignments are not intended to be merged. User Guide: Small RNA pipeline for Ion Torrent™ in Partek® Flow® 2 Files required for the pipeline Aside from the data to be analyzed and the system files for the Partek Flow software, the Small RNA pipeline for Ion Torrent requires three additional files: 1. Small RNA pipeline for Ion Torrent.pipeline – This is the pre-‐built pipeline file, downloadable from the Partek website at the following URL: http://www.partek.com/pipelines ! Partek Flow now uses the extension *.pipeline for the pipeline files. 2. An annnotation file containing mature microRNA sequences, where the coordinates are padded 10 bases upstream and downstream of the mature microRNA. For Homo sapiens (hg19), Partek Flow distributes the annotation miRNASeq pipeline (miRBase20), which is based on the mature microRNAs of miRBase 20, with the coordinates padded 10 bases upstream and downstream. For more information, visit: http://www.mirbase.org/ 3. An annotation file for the whole transcriptome. For Homo sapiens (hg19), Partek Flow hosts several whole transcriptome annotation files. However, the Small RNA pipeline for Ion Torrent was validated using Gencode Genes – release 19. It is based on the GENCODE 19 annotation with the addition of the tRNAs. For more information, visit: http://www.gencodegenes.org/stats.html ! For other species or genome builds, users may upload their own annotation files. Partek Flow accepts .pannot, .gff, .gtf, and .bed files. See the Adding custom annotations section of this user guide. User Guide: Small RNA pipeline for Ion Torrent™ in Partek® Flow® 3 Library file management The library files need to be copied to the Partek Flow server and indexed before running the pipeline for the first time. Partek Flow’s Library file management tool provides an easy way to create, process, and organize reference genome files, aligner indexes, and annotation files. To access this tool, click Settings in the upper right corner of Partek Flow, and then click Library file management on the left panel (Figure 2). Figure 2: Library file management tool. To access this page, click Settings (top right arrow), and then select Library file management (left red arrow). Selecting the genome reference Select the species and build for your project under the Genome build section (Figure 2, red box). Confirm that the icon next to the Genome sequence is a green check mark ( ). If it is showing a blue flag ( ), the genome reference needs to be downloaded. Click the blue flag, and then select the option to download. You may also take this opportunity to download the Cytoband file as well. This is required in order to use the chromosome viewer in Partek Flow. However, it may be also be downloaded after running the pipeline. User Guide: Small RNA pipeline for Ion Torrent™ in Partek® Flow® 4 Adding a Partek-‐distributed microRNA annotation To add the annotation model for mature microRNAs (Figure 3): 1. Click the (+) tab in the Annotation models and aligner indexes section. 2. In the dialog box, select the Annotation model miRNASeq pipeline (miRBase20), and then click Add. A new tab will be created (hover the mouse cursor over the tab to reveal the complete name). 3. Download the annotation by clicking the blue flag ( ) next to Annotation file. Wait for the icon to become a green check ( ). 4. Build the annotation index by clicking the blue flag ( ) next to the Bowtie2 index. Wait for the hourglass ( ) to become a green check ( ). ! For a 6 core 8 GB RAM machine, the last step takes about 30 minutes. Figure 3: Adding the annotation and building the Bowtie2 index for mature microRNAs User Guide: Small RNA pipeline for Ion Torrent™ in Partek® Flow® 5 Adding a Partek-‐distributed transcriptome annotation To add the annotation model for the transcriptome (Figure 4): 1. Click the (+) tab in the Annotation models and aligner indexes section. 2. In the dialog box, select the Annotation model Gencode Genes – release 19, and then click Add. A new tab will be created (hover the mouse cursor over the tab to reveal the complete name). 3. Download the annotation by clicking the blue flag ( ) next to Annotation file. Wait for the icon to become a green check ( ). 4. Build the annotation index by clicking the blue flag ( ) next to the Bowtie2 index. Wait for the hourglass ( ) to become a green check ( ). ! For a 6 core 8 GB RAM machine, the last step takes about 2.5 hours. Figure 4: Adding the annotation model for the transcriptome User Guide: Small RNA pipeline for Ion Torrent™ in Partek® Flow® 6 Adding custom annotations For custom annotations, the library files need to be managed by a user with Administrator privileges. Adding custom annotation for mature microRNAs is shown in Figure 5. The steps can be adapted for adding a custom transcriptome annotation. 1. Select species and Genome build. The Genome sequence must be checked ( ). 2. Click the (+) tab in the Annotation models and aligner indexes section. 3. Select Other from the dropdown menu. Enter a name, click Add. A new tab will be created (hover the mouse cursor over the tab to reveal the complete name). 4. Click the blue flag ( ) next to Annotation file and browse to the file. Partek Flow accepts .pannot, .gff, .gtf, and .bed files. Set the Annotation file type as microRNA. Click Finish. Wait for the icon to become a check ( ). 5. Build the annotation index by clicking the blue flag ( ) next to the Bowtie2 index. Wait for the hourglass ( ) to become a green check ( ). ! This process is done by an Admin user and may take hours depending on the system. Figure 5: Adding a custom annotation User Guide: Small RNA pipeline for Ion Torrent™ in Partek® Flow® 7 Creating a project in Partek Flow Analyses in Partek Flow are done within projects. To create a project, click the New Project icon from the Home page and enter a project name (Figure 6). Figure 6: Partek Flow Home page and the dialog box for naming a project (inset) Once a project is created, Partek Flow will display the Data tab. To add samples to the project, click Add samples. Three options will be displayed (Figure 7). Figure 7: Partek Flow Data tab and the options for adding samples (inset) Select Automatically create samples from files. A file browser will locate files compatible with Partek Flow within the current folder. The files will be displayed and User Guide: Small RNA pipeline for Ion Torrent™ in Partek® Flow® 8 selected (with a checkmark) on the right panel (Figure 8). When you have selected the correct folder and files, click Create samples. Figure 8: File browser showing selected files on the right to be added into a Project Files may also be uploaded from the local computer by selecting My computer and locating the files to be uploaded. However, the success of the transfer depends on the speed and latency of the internet connection between the local computer and the Partek Flow server. Two other methods of adding samples to a project are shown in Figure 7 (inset). Samples from previously created projects (within the same Partek Flow server) can be associated with a new project by selecting Import samples from another project. Samples can also be added manually by selecting Create a new blank sample. After adding samples, The Data tab would now contain a sample management table (Figure 9). User Guide: Small RNA pipeline for Ion Torrent™ in Partek® Flow® 9 Figure 9: The sample management table in the Data tab Sample names are automatically generated based on the filenames and can be edited by selecting the gear ( ) icon next to it. The expand ( ) or collapse ( ) triangles will display or hide the file names associated with each sample, respectively. Once a project is created, it can be shared with other Partek Flow users using the Collaborators tab. Assigning attributes to samples In the Data tab, information about the samples can be added to the sample management table, and can be either numeric (i.e. continuous) attributes or categorical attributes. To use the Small RNA pipeline for Ion Torrent, there must be at least one categorical attribute and a category assigned to each sample. This is a requirement to perform statistical comparisons between groups and to detect differentially expressed microRNAs. ! Categorical attributes must be assigned before running the Small RNA pipeline for Ion Torrent. To create a categorical attribute, click Manage attributes from the Data tab (Figure 9). The Manage attributes page will display (Figure 10). Click Add new attribute and enter a name for the attribute and leave the Attribute type as Categorical. In the next dialog box, enter the categories of the attribute in the New category field. User Guide: Small RNA pipeline for Ion Torrent™ in Partek® Flow® 10 Figure 10: Manage attributes page and the dialog boxes for adding an attribute (middle inset) and defining categories (bottom right inset) In the example shown in Figure 10, the categorical attribute tissue has two categories: breast and placenta . Repeat the process for additional attributes of the samples in your study. When done, click Back to sample management table. The sample management table will now show a column of the new attribute (Figure 11). The column will initially appear blank, as the samples have not yet been categorized. To edit the table, click Edit sample attributes. Each sample can be assigned a category using the drop down menu (Figure 11 inset). When done, click Apply changes and the sample management table will be updated. ! After editing the sample table, make sure there are no fields with blank or N/A values before proceeding. User Guide: Small RNA pipeline for Ion Torrent™ in Partek® Flow® 11 Figure 11: Sample management table showing a column for a newly defined attributes. The Edit sample attributes button allows editing of the table using the dropdown options (inset) An example of a completed sample management table is shown below in Figure 12. Each sample must be assigned a category for every attribute. Figure 12: Sample management table with sample attributes assigned User Guide: Small RNA pipeline for Ion Torrent™ in Partek® Flow® 12 Importing the pipeline into Partek Flow The pipeline can be downloaded from Partek website at the following URL: http://www.partek.com/pipelines 1. Download the Small RNA pipeline for Ion Torrent.pipeline. Save the file to a folder that is easily accessible on your local computer, typically the Downloads folder (Figure 13). 2. Open a project and select the Analyses tab. 3. Click Import a pipeline on the lower left side of the screen (Figure 14). In the dialog box, click Choose File button. 4. Navigate to the local directory where the pipeline was downloaded. Select the Small RNA pipeline for Ion Torrent.pipeline file and click Import. Figure 13: Downloads folder showing the Small RNA pipeline for Ion Torrent.pipeline file (actual appearance will depend on your operating system). Figure 14: Analyses tab showing a data node and the Import a pipeline link (red box) User Guide: Small RNA pipeline for Ion Torrent™ in Partek® Flow® 13 Running the pipeline In the Analyses tab, select a data node containing Unaligned reads. The toolbox, a data specific menu, will appear on the right side of the screen (Figure 15). Click a data node to reveal the toolbox. Figure 15: Analyses tab showing a selected data node, the toolbox (in red box), and the Small RNA pipeline for Ion Torrent listed in the Pipelines task section Click of the Pipelines section of the toolbox to expand the list and see the available pipelines. The imported Small RNA pipeline for Ion Torrent will appear on the list. Moving your mouse cursor over the pipeline will display a description of the pipeline. Pipelines can be previewed or downloaded by clicking the appropriate icon. To run the pipeline, click the Small RNA pipeline for Ion Torrent from the toolbox. You will be guided through six steps to set the options for pipeline (Figure 16). 1. For the first aligner, select miRNASeq pipeline (miRBase 20) Bowtie 2 index. 2. For the coverage report, select miRNASeq pipeline (miRBase 20) annotation. 3. For the first quantification, select miRNASeq pipeline (miRBase 20) annotation. 4. For the fourth step, set the options for the differential expression task • Choose Attributes to include in your test and click Next. (If there is only one categorical attribute it will be automatically selected.) • Select the groups (by categories) to compare then click Add comparison. • Set up the comparisons that you need, then click Next. ! Make sure to click the Add comparison button. 5. For the second aligner, select GENCODE Genes – release 19 Bowtie 2 index 6. For the second quantification, select Select GENCODE Genes – release 19 annotation. ! In general, first three options have the same answer (miRNASeq pipeline (mirBase 20)). And the last two options have the same answer (GENCODE Genes – release 19). User Guide: Small RNA pipeline for Ion Torrent™ in Partek® Flow® 14 Mark categories to compare then click Add comparison Figure 16: Setting the options for running the Small RNA pipeline for Ion Torrent User Guide: Small RNA pipeline for Ion Torrent™ in Partek® Flow® 15 The screen will return to the Analyses tab and the pipeline will start running (Figure 17). The progress of the pipeline can be seen by the changing colors: lighter (faded) shades are queued while darker colors are completed. Figure 17: Small RNA pipeline for Ion Torrent in progress. Data nodes are circles and task nodes are shown as rectangles. The pipeline is at the stage where the task node has a lighter shade of blue (indicated by a red arrow) The progress of the pipeline can also be monitored using the Queue tab where individual tasks and their status are listed. When the pipeline is finished, all the colors will have the same darker shade. User Guide: Small RNA pipeline for Ion Torrent™ in Partek® Flow® 16 Viewing the results of the pipeline To view the results of the pipeline, double click a node to show the Task report. Coverage report task report The pipeline generates a coverage report to show the depth of sequencing of the known mature microRNA regions both at the project level (Figure 18) and at the individual sample level (Figure 19). In the project-‐level, the percentages of bases in the microRNA with coverage of 1×,10×, 20× or 100× are presented as a table. Average coverage is defined as the sum of read depths of each nucleotide base in the genomic feature regions divided by the length of genomic feature regions. Average quality is defined as the sum of average quality of those bases that covered the genomic feature regions divided by the length of covered genomic feature regions. Figure 18: Coverage report table at the project level Figure 19: Coverage report table at the sample level User Guide: Small RNA pipeline for Ion Torrent™ in Partek® Flow® 17 Post-‐alignment QA/QC task report The pipeline generates a post-‐alignment QA/QC report for each of the alignments. The output summarizes the efficiency of the alignment and the quality of the aligned reads at the project level (Figure 20). Clicking a sample name on the table will show additional details of the individual sample (Figure 21). Figure 20: Post-‐alignment QAQC report (project level) User Guide: Small RNA pipeline for Ion Torrent™ in Partek® Flow® 18 Figure 21:Post-‐alignment QAQC report (sample level) Quantification report The Quantification report shows the estimation of abundance of reads that aligned to the annotation models. In this pipeline, there are two quantification reports for the two alignments: (1) to mature RNA sequences and (2) to transcriptome annotation. The report shows a mapping summary table as well as graphical summary (column or pie charts visible when mousing over View column). At bottom page of the task report are options for the user to Download gene-‐level read counts or Download transcript-‐level read counts as text files. ! For the microRNA output, the two text files would have the same values (as each “miRNA” is considered a gene and transcript). The transcript-‐level read counts give additional information about the location of the annotation features used in the quantification of the microRNAs. User Guide: Small RNA pipeline for Ion Torrent™ in Partek® Flow® 19 Figure 22 shows a sample quantification report for the first alignment of the pipeline (alignment to mature microRNA sequences). ! Although the pipeline shows two tasks named “Quantification to transcriptome” the first quantification only refers to quantification of microRNAs. Figure 22: Quantification report from the alignment to mature microRNAs. The links to download the read counts are shown in the red box A principal components analysis (PCA) plot is calculated based on normalized reads showing the first two principal components. A three-‐dimensional PCA plot can be invoked by clicking view in 3D (Figure 23). Normalization is done using RPKM (reads per kilobase of exon per million of mapped reads). User Guide: Small RNA pipeline for Ion Torrent™ in Partek® Flow® 20 Figure 23: Principal components analysis 3D plot Gene Specific Analysis Project report The Gene Specific Analysis (GSA) algorithm is a statistical analysis used to compare differential expression of microRNAs among groups of samples. The GSA report consists of a Statistical results section and an interactive Gene list table containing differentially expressed mature microRNAs (Figure 24). The pie chart depicts the proportion of microRNAs with respect to the best model fit. The different model types used in GSA are Lognormal linear model, Poisson, and Negative binomial. The table shows the GSA output as a list of microRNAs and provides the total number of reads as well as the statistical results. The table can be filtered using the fields on the left or sorted using the columns. Figure 24: The Gene-‐specific analysis Project report. The Total Reads column show the total number of reads (raw counts) that aligned to the region. User Guide: Small RNA pipeline for Ion Torrent™ in Partek® Flow® 21 The View column provides visualization for the microRNAs in the table. Details of the GSA for each microRNA can be viewed by clicking the report icon ( ). To generate a dot plot showing expression values of each microRNA, click the dot plot icon ( ). Each sample is represented by a colored dot and the y-‐axis shows the normalized read counts (Figure 25). The samples can be grouped (and colored) by the different categorical attributes. Box plots can be added to show the interquartile range, with the line in the middle representing the median while the whiskers symbolize the 10% to 90% range. Figure 25: Dot plot showing the expression levels of a microRNA Chromosome Viewer The chromosome viewer can be invoked by selecting the chromosome view ( ). In an example in Figure 26, top two reads tracks (“Aligned reads”) in blue and red shows a “pileup” of the total reads from all samples in each category (breast and placenta). The bottom track (“Isoform proportion”) shows the relative proportion of each category. In this case the selected miRNA is expressed much higher in breast than in placenta. ! If the experiment is unbalanced (i.e. different number of samples in each group) the proportion seen in the top two tracks may not look consistent with the bottom isoform proportion track. User Guide: Small RNA pipeline for Ion Torrent™ in Partek® Flow® 22 Figure 26: Chromosome view focusing on a selected microRNA ! The Isoform proportion track uses the annotation miRNASeq pipeline (mirbase20), which was padded 10 bases on each side. The regions will appear wider than the regions where the reads actually aligned (shown in the first two tracks). List of additional documents For more information, please see the Partek Flow User Manual. Copyright © 2014 by Partek Incorporated. All Rights Reserved. Reproduction of this material without express written consent from Partek Incorporated is strictly prohibited. User Guide: Small RNA pipeline for Ion Torrent™ in Partek® Flow® 23