1
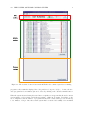
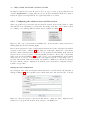
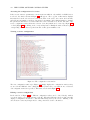
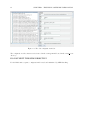
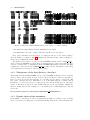
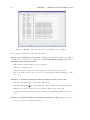
LUCIFER
Technical software and procedure manual
Doc. Name:
LBT-LUCIFER-MAN-032 1 2.pdf
Doc. Number:
LBT-LUCIFER-MAN-032
Issue Number:
1.2
Issue Date:
19.03.2010
Prepared by:
Volker Knierim & Marcus Jütte (AIRUB), W. Seifert (LSW), N.
Ageorges (MPE)
2
Distribution List
Recipient
O. Kuhn
M. Pedani
D. Thompson
Institute / Company
No. of Copies
LBTO
LBTO
LBTO
Document Change Record
Issue
Date
1.0
1.1
19.01.2010
19.02.2010
1.2
18.03.2010
Sect./Paragr. affected
initial document
Chap. 4: Additional GUI descriptions
Chap. 5: Update (Trouble Shooting)
New procedures description added
Document reorganization
Reasons / Remarks
Contents
1 Introduction
5
2 Technical software user manual
2.1 Starting the software - Summary . . . . . . . . . . . . .
2.2 The LUCIFER Software Control Center . . . . . . . . .
2.2.1 Starting and stopping the software . . . . . . . .
2.2.2 Configuring the software start and the services .
2.3 Engineer access to the main instrument components SW
2.3.1 The compensation mirror service . . . . . . . . .
2.3.2 The detector unit (focus) service . . . . . . . . .
2.3.3 The grating unit service . . . . . . . . . . . . . .
2.3.4 The camera wheel service . . . . . . . . . . . . .
2.3.5 Read out engineer GUI . . . . . . . . . . . . . .
2.3.6 The MOS engineer GUI . . . . . . . . . . . . . .
.
.
.
.
.
.
.
.
.
.
.
.
.
.
.
.
.
.
.
.
.
.
.
.
.
.
.
.
.
.
.
.
.
.
.
.
.
.
.
.
.
.
.
.
.
.
.
.
.
.
.
.
.
.
.
.
.
.
.
.
.
.
.
.
.
.
.
.
.
.
.
.
.
.
.
.
.
.
.
.
.
.
.
.
.
.
.
.
.
.
.
.
.
.
.
.
.
.
.
.
.
.
.
.
.
.
.
.
.
.
.
.
.
.
.
.
.
.
.
.
.
.
.
.
.
.
.
.
.
.
.
.
.
.
.
.
.
.
.
.
.
.
.
.
.
.
.
.
.
.
.
.
.
.
.
.
.
.
.
.
.
.
.
.
.
7
7
7
7
11
15
15
19
22
23
24
25
3 Technical procedure manual
3.1 Procedures . . . . . . . . . . . . . . . . . . . . . . .
3.1.1 LUCIFER safe mode . . . . . . . . . . . . . .
3.1.2 lms files & cabinet exchange . . . . . . . . . .
3.1.3 Maintenance of the data directory /data/luci
3.1.4 Regular checks of the instrument . . . . . . .
3.2 Trouble–Shooting Guide . . . . . . . . . . . . . . . .
3.2.1 Software related . . . . . . . . . . . . . . . .
3.2.2 Hardware related . . . . . . . . . . . . . . . .
.
.
.
.
.
.
.
.
.
.
.
.
.
.
.
.
.
.
.
.
.
.
.
.
.
.
.
.
.
.
.
.
.
.
.
.
.
.
.
.
.
.
.
.
.
.
.
.
.
.
.
.
.
.
.
.
.
.
.
.
.
.
.
.
.
.
.
.
.
.
.
.
.
.
.
.
.
.
.
.
.
.
.
.
.
.
.
.
.
.
.
.
.
.
.
.
.
.
.
.
.
.
.
.
.
.
.
.
.
.
.
.
.
.
.
.
.
.
.
.
27
27
27
28
29
29
32
32
34
3
.
.
.
.
.
.
.
.
.
.
.
.
.
.
.
.
4
CONTENTS
Chapter 1
Introduction
This document, organised in two main parts, is addressed to the LUCIFER instrument support
scientist and NOT to the observers. Because of the described engineer access to the instrument
only LUCIFER experts are allowed to use it.
Chapter 2 describes how to handle the LUCIFER Control Software Package (lcsp). It contains
information on how to start and stop the software or parts of it, change configurations and use the
dedicated engineering tools.
Misconfigured configuration entries can severely damage the instrument!
Chapter 3 contains the description of some instrument specialist procedures as well as a short
trouble shooting guide for most common failures.
5
6
CHAPTER 1. INTRODUCTION
Chapter 2
Technical software user manual
2.1
Starting the software - Summary
Under normal conditions the Lucifer control software (LCSP) is running continuously on the SUN
V880 workstation which is located in the computer room close to the observing room behind the
glass door. After a restart of the workstation a software restart is of course necessary.
1. Login to sun workstation lucifer as user engineer.
2. Execute the Start LUCIFER Control SW which will bring up the LUCIFER Software
Control Center.
3. If software is not already running press the start button and wait (approx. 2 minutes).
4. Open the Main Observer GUI and press the Initialize button.
5. You are ready to observe with the instrument.
A more detailed description follows in the next chapters.
2.2
The LUCIFER Software Control Center
This chapter describes how the software system controlling the LUCIFER instrument can be
started, stopped and how it can be configured.
2.2.1
Starting and stopping the software
In order to start the software one has to login to the LUCIFER SUN V880 Server via an NXClient
available on the lbto computers:
Host name: lucifer
User: engineer
There a desktop icon ‘Start LUCIFER Control SW’ is available. Clicking this icon executes
the start script LUCIFER SW START.sh which is located in /home/engineer. This will start the
LUCIFER Software Control Center.
7
8
CHAPTER 2. TECHNICAL SOFTWARE USER MANUAL
If there is no start script available the software can be started via the command line:
cd /home/engineer/lcsp/dist/export
java -jar lcsp.jar start hd.xml
lcsp.jar contains the whole LUCIFER software system and start hd.xml is the current XML
configuration file.
RULE: Never edit start hd.xml by hand unless you know what you are doing!!
Both are located in the directory referred to as <lcsp root>:
/home/engineer/lcsp/dist/export/
The software system runs only once on the sun server, although multiple instances of the LUCIFER Software Control Center can be started. When the software is already running on the
system, the Control Center detects this automatically.
In the case the LUCIFER software is not running, the LUCIFER Software Control Center appears as shown in Figure 2.1
The window is separated into three different sections. The top section (indicated in red in Figure 2.1) contains the buttons to start and stop the software system with the configuration that is
currently loaded. It is also possible to close this window by clicking on the exit button.
The middle section (green in Figure 2.1) displays a table with the current startup configuration.
The table is ordered by different priorities, where lower numbers correspond to a higher priority.
The priority is shown in the first row of the table. The second column determines when the corresponding program is started. Two values are possible: system and manual. If system is selected,
the program is started when the whole software system is launched. If manual is selected, the
program is not started with the system start, but can be started manually at a later time. This
allows deactivating programs that are not needed or wanted at system start time. The third column indicates different program types by showing them in different colors as well as with different
names. For the first of these types, the RMI Daemon (pink color), only one entry is allowed to exist
in the startup configuration. This entry must have the highest priority and thus be displayed in the
first row of the table. The second type, displayed in blue, describes startup configuration entries
that represent the distributed services of the software. These services are the main components for
operating the instrument and should be started together with the software system (i.e., the entry in
column two should be system). The third type shown in green indicates normal Java applications
that usually start different graphical user interfaces for software control. These need not be started
at system time and can be started as necessary. A fourth type (not shown in Figure 2.1) exists that
allows starting any executable code. It is not necessarily needed, but can be convenient to launch
image viewers for example. The use column is only meaningful for RMI Services that are shown in
blue text. The string SYS means that the service is a general system service and not associated to
any instrument. ONE indicates a service controlling LUCIFER1. TWO has the same meaning for
LUCIFER2. The second last column (state) indicates if a program is running showing a green dot
or a red dot if it is not running. Finally the last column indicates if a process input/output panel
for the program exists. By clicking the ‘refresh table’ button, the status of the system shown in
the state column is refreshed.
The bottom section of Figure 2.1, indicated in orange color, shows the Process I/O panel for the
selected program of the table in the middle section. All output that is normally printed by the
2.2. THE LUCIFER SOFTWARE CONTROL CENTER
9
Figure 2.1: The Software Control Center main GUI when the software system is not running.
programs on the terminal is displayed here. If a panel is no longer needed (i.e., because the associated program has been terminated) it can be deleted by clicking on the ‘discard terminals’ button.
When the system is started using the start button, a splash screen appears that shows the current
version number of the software and indicates starting of different programs. Depending on the
used configuration and the number of programs that should be started, this process can take up
to two minutes or longer. After the software system has been started successfully, a screen similar
10
CHAPTER 2. TECHNICAL SOFTWARE USER MANUAL
to the one shown in Figure 2.2 will be displayed. As can be seen in the figure, the start button is
now deactivated and the stop button is active. When the stop button is clicked a dialog window
asking for confirmation is displayed to avoid accidental stopping of the software system. When the
window is closed by clicking on the exit button or the close icon and the software system is found
to be running, a dialog window is shown asking to stop the software system also. In either case, if
the no option is selected, the RMI services are kept running and only the applications (i.e., GUIs)
are closed.
Currently (18.01.2010) all services (blue colored) should show a green light but the TemperaturMonitorLucifer2 and TurboPumpMonitor services which show a red lamp indication after
the start.
Figure 2.2: The Software Control Center after the service has been started.
KNOWN ISSUE AT START-UP / STARTING A SERVICE BY HAND:
It may happen that the MOS Sequence Server still has a red light meaning it has
not started properly. Therefore it has to be done by hand: Click in the table on the
MOS Sequence Server row (be careful because due to the nx connection the refresh
of the table is a bit slow). Use the right mouse button and choose start MOS Sequence Server. Wait a few seconds, press ‘refresh table’ and check if the service is
now running.
2.2. THE LUCIFER SOFTWARE CONTROL CENTER
11
By using the right mouse button all services can be stopped or started. By scrolling the table
down the Applications are getting visible in a green font. Here all available GUIs can be started.
Besides the typical observing GUIs also the engineering GUIs are accessible.
2.2.2
Configuring the software start and the services
When a program is selected from the table shown in the Software Control Center window, a right
click with the mouse will display a context menu. Depending on the state of the software system
(i.e., running or not running) different menu items are available (see Figure 2.3)
Figure 2.3: The control context menu for an RMI service, shown when the software system is not
running (left) and when it is running (right).
If the software system is not started only the first menu item edit start descriptor is available
as shown on the left side of Figure 2.3. The right side of this figure displays the context menu,
when the software system is started and the selected program is currently running. If the system is
started, but the selected program not currently running, the first two entries of the context menu
will be active (not shown in Figure 2.3). To start a service or program manually the start <name>
menu item can be selected. Consequently the stop <name> stops the corresponding service or
program. The restart <name> menu item is only available for RMI services and allows restarting
the service with the current configuration. To start the service again after a configuration change,
it must be stopped first.
Editing the start configuration
By selecting the edit start descriptor menu item from the context menu, the following window
will appear (Figure 2.4). The text that is entered in the name field of the window is the one shown
Figure 2.4: The start descriptor edit window that allows to change the start configuration and
parameters of a program. Shown is the start descriptor of an RMI service.
12
CHAPTER 2. TECHNICAL SOFTWARE USER MANUAL
in the table of the Software Control Center (see Figures 2.1 and 2.2). The service name entry
defines the URL of the distributed service. It must always be of the following format:
protocol://hostname:port/ServiceName
The protocol is always ‘rmi’, the host name is the name or IP address of the host where the
RMI registry service is running. The port number is the TCP port on that machine that the
registry uses. Finally the service name defines the name under which the service is bound to the
registry.
The priority defines the position of the entry in the table, with higher numbers representing
lower priorities. All programs with the same priority are started simultaneously. The starting of
lower priority programs is suspended for the number of milliseconds that is given in the execution
time field. The meaning of the working directory field is straight forward, and the command field
defines the executable that should be started. In principle any command line argument can be
defined in this field. For Java services and programs the class that should be started by the Java
interpreter must be defined in the main class field. The text areas for command arguments and
program arguments allow defining these arguments which are passed to the command at execution
time.
Figure 2.5: The service parameters access window.
2.2. THE LUCIFER SOFTWARE CONTROL CENTER
13
Accessing the configuration of a service
If the access service parameters context menu item which is only available for RMI Services
is selected, the window shown in Figure 2.5 will appear. The top part of this window displays
information about the selected service, such as the name of the service, the version, the host name
and address it is running on and how long it has been running. Below this information command
line parameters that have been defined when the service was started are shown. The List of the
service configuration entries allows the selection of an entry which can be viewed (see Figure 2.6)
or edited (Figure 2.7) by clicking on the corresponding button. Finally the window allows stopping
or suspending a service after a specified amount of time given in milliseconds.
Viewing a service configuration
Figure 2.6: The configuration view window.
The view configuration window (see Figure 2.6) simply displays the configuration entries as they
are stored in the XML file. Since editing these files by hand can be very cumbersome, a dedicated
edit configuration window is provided. This window is shown in Figure 2.7.
Editing a service configuration
In the window of Figure 2.7 the different configuration values can be edited directly, without
concern about the correct XML structure of the file. When the OK button is selected the currently
displayed configuration is written to disk and immediately used by the service. Clicking on the
cancel button reverts any changes made to that point and closes the edit window.
14
CHAPTER 2. TECHNICAL SOFTWARE USER MANUAL
Figure 2.7: The edit configuration window.
The configuration of the software services is stored in the config.xml file located in the <lcsp root>
directory.
DO NOT EDIT THIS FILE DIRECTLY!!
For the MOS unit a separate configuration file is used and maintained by MPE Garching.
2.3. ENGINEER ACCESS TO THE MAIN INSTRUMENT COMPONENTS SW
2.3
15
Engineer access to the main instrument components SW
Each component of the instrument is controlled by a dedicated software service that works independently from the others, but relies on functions provided by other services. In the following
these different services and the way to control them will be discussed. Note: Engineer access to the
different services is direct, i.e., changing a parameter with the control GUI has immediate affect.
In particular, the top level Instrument Manager service will be bypassed and is not notified of any
changes.
To avoid unexpected behavior of the software, the Instrument Manager has to be
initialized again after the changes have been made at the engineer level!
2.3.1
The compensation mirror service
Image movements on the detector due to flexure are compensated via a movable mirror that is
positioned by two independent motors. Depending on the position of the instrument, defined
by the rotator and elevation angles, the motors can be moved by a certain amount of steps to
reposition the mirror so that the position of the image on the detector remains fixed. The motor
step values are defined by lookup tables that are loaded by the service depending on the current
instrument configuration. In total, 24 lookup tables are needed: two tables (clock- and counter
clockwise rotation) for each combination of the three camera and four grating unit positions.
Figure 2.8 shows the engineer access GUI for the compensation mirror service. It has many similarities to the GUIs used for the other instrument components (e.g., FilterUnit, GratingUnit,..), so
some of the information described here is also valid for the other GUIs described in the following
sections. The Compensation Mirror Control GUI can be started using the Software Control Center (described in the last chapter) entry ’GUI Compensation Mirror Engineer Client’. After the
interface has been loaded it will look similar to the one shown in Figure 2.8.
The window shows three main areas, found in nearly all engineer windows: the top left area shows
one lookup table that is used by the service. Next to the table in the top right area of the window,
buttons and text areas for service control are located. Below these two components, a message
area is displayed, which shows all messages that are generated by the software. The ’Automatic
Update’ area at the bottom of the window can be used to alter the update interval of the displayed
information. The default is one seconds. The size of the message area can be changed using the
slider separating the upper from the lower part.
On the right corner of the window a second, vertical slider is located that allows to open the motor
control panel of the service. To be able to see this area correctly the window must be enlarged in
the horizontal direction as shown in Figure 2.9.
This panel allows direct control of the motors of the unit, bypassing the Compensation Mirror
service and should be used with care. Especially the ’stop all motion’ button in the upper right
corner should only be clicked in case of an emergency, since it stops all(!) movements (except the
MOS Unit, which is controlled by a separate motor electronic) inside the instrument immediately.
No further movement of any motor will be allowed after this until the ’allow motion’ button is
pressed. Note also that the information of the motor control area is not automatically updated
(since it bypasses the software service shown in the left area). To get the current values (i.e., switch
and motor positions) for this part of the user interface the ’update’ buttons have to be pressed.
For normal operation of the service the motor control GUI is not necessary and can (and should)
be hidden. Its primary use is to move the motor(s) of a unit in cases where the service is not
working properly.
16
CHAPTER 2. TECHNICAL SOFTWARE USER MANUAL
Figure 2.8: The compensation mirror engineer GUI
The lookup table area of the Compensation Mirror Control Window
The Compensation Mirror service always has six tables loaded simultaneously: two rotation directions for each of the three cameras and the currently selected grating unit position. When the
grating unit position is changed, the service automatically loads the new set of six tables for this
new grating unit position. In the upper left area of the GUI the currently used lookup tables can
be displayed. Only one table is visible at a time. To view or edit a different table the drop down
boxes above the table can be used. Since the service has only six tables loaded for the currently
selected grating, only these six can be selected with the drop down boxes. The grating for which
the tables are displayed is shown above the drop down boxes. To edit tables for a different grating
unit position, the corresponding grating has to be selected first (see below).
The GUI loads a copy of each of the six tables from the service at startup, which means that changes
made to the table in the GUI are not send to the service directly. When a table is modified, the
2.3. ENGINEER ACCESS TO THE MAIN INSTRUMENT COMPONENTS SW
17
Figure 2.9: The expanded Control GUI with the motor control panel.
status bar (showing the pathname of the file) is showing ’(modified)’ at the end. The color of the
text indicates if the table that is currently shown has been loaded from the service (in which case
the color is green and the text begins with ’REMOTE FILE:’) or from a local file (red text color
and ’LOCAL FILE:’ at the beginning). Loading a local file is possible using the ’File’ menu. In this
case too, the loaded table is not used by the service directly. To force the service to use the new or
edited table, the ’Commit to service’ button has to be pressed. This only commits the currently
displayed table, and has to be repeated for all changed tables. It is also possible to reload a table
from the service in case of unwanted/accidental changes using the ’Reload from table’ button.
The tables used by the service are saved separately in the
<lcsp root>/lookupTables directory, which is used by other services as well. The files
in this directory should not be accessed and edited directly using other tools like text
editors. Corrupted lookup table files will have a negative impact on the instrument
performance and operations!
New lookup table entries can be added in the empty line at the end of the table. To remove a
line from the table the corresponding line has to be selected and the ’Remove Entry’ button has
to be pressed. Each table entry consists of three values: The ’Instrument Position’ consists of
two angle values for the rotation (R) and elevation (E) angles. This is also a key for the table,
which means that only one value pair of angles is allowed to exist in the table at a given time.
The other two values are the relative(!) motor steps that are necessary to compensate the image
flexure for the instrument position. The origin is defined by the entry that has two ’0’s for the
motor steps and can be chosen arbitrarily. It has been proven practice during the commissioning
of the instrument to use the instrument position (R:90,E:90) as reference and to provide correction
values in intervals of 30 degree steps for the rotator (−90 ≤ R ≤ 450) and elevation (0 ≤ E ≤ 90)
angles. For instrument positions that are in between the defined position, the motor step values
to compensate the flexure are interpolated from the four surrounding positions. The interpolation
method that is used can be selected using the two drop down boxes below the table. Currently only
18
CHAPTER 2. TECHNICAL SOFTWARE USER MANUAL
a linear interpolation can be selected because it has been proven sufficient during commissioning.
The mirror control area
Next to the lookup table panel, the service control area is located (see Figure 2.8). It consists
of different sections allowing to set parameters for the service and to execute actions. The color
of the different GUI elements represents the type of information that is displayed. Values shown
with a purple background represent data that is currently used by the service. Values shown with
a white background have only been set in the GUI so far and have to be send to the service first.
One example for this are the text fields for the rotator and elevation angles: the two fields on
the left are white and allow to type in new values for the corresponding angles. However these
new values are not used by the service until either the Return key is pressed (which sets the value
of the field the cursor is currently positioned in only) or the ’Set Both’ button is clicked. The
drop down boxes for the mirror and the grating are shown in purple color to indicate that the
information shown in these elements is actually set in the service. Changing the these values in
the GUI has immediate effect. The rotation direction is only shown for information (as are the
current motor positions) and cannot be set directly. The rotation direction of the instrument is
inferred from the change of the rotator values that are send to the service, with increasing rotator
angles representing clockwise rotation.
Before the mirror can be used it has to be initialized. To be able to initialize the mirror, a
valid lookup table has to exist for the given grating and camera positions. In this regard ’valid’
means that the (relative) mirror position for the current instrument position must be able to
be calculated from the rotation and elevation angle values that exist in the table. The service
calculates the necessary mirror movements based on the current and next mirror positions in the
coordinate system that is defined by the table values.
Two different initialization mechanisms are available. The first is an absolute initialization of the
mirror using the limit switches of the two motor axes. When the mirror is initialized in this way,
both motors move until they reach the negative limit switch, and then back to a reference position
that is defined in the service configuration. This is useful when the mirror is in an unknown
position, i.e., after instrument maintenance or if the mirror has moved a substantial amount out
of the reference position. The reference position is measured for the parked instrument with a
rotator angle of 341 degrees and an elevation angle of 90 degrees. So the initialization with the
limit switches should be carried out at this position, e.g., during daytime or before taking flats in
the evening or in the morning. The second initialization does not move the mirror and just recomputes the relative mirror position based on the current instrument position. This initialization
is necessary whenever a new camera or grating has been selected in the GUI. When the instrument
is controlled from the Instrument Manager this is done automatically, of course. To switch between
the two initialization methods the check box ’Force limit adjust’ is used. When the box is set, the
absolute initialization is carried out.
To manually compensate the flexure, i.e., to test the flexure tables, the ’Adjust Mirror’ button is
used. If the ’Show adjust first’ check box is selected the calculated motor steps are shown first,
before the mirror is actually moved. The steps to move are calculated based on the angle values
used for the last compensation (or initialization of the mirror) and the new ones. Finally, the
’Reset Mirror’ button reverts any mirror movements made since the last initialization.
Below the mirror control area of the window the button ’Edit configuration...’ is located. It can be
used to access the configuration values of the service conveniently from the engineer interface and
thus provides another way to alter the setup of a service from the one presented in the previous
chapter. However, only the ’direct’ configuration values of the service can be accessed using this
button, no configuration values used for contacting other services that the compensation mirror
service depends on (like the motor control service) are accessible.
2.3. ENGINEER ACCESS TO THE MAIN INSTRUMENT COMPONENTS SW
2.3.2
19
The detector unit (focus) service
The service controlling the detector focus drive is similar to the one for the compensation mirror.
It is more simple because only one motor has to be controlled to position the detector correctly for
a given combination of filters in the beam. Figure 2.10 shows the engineer GUI for the detector
focus control, which can be started with the control center (previous chapter) using the ‘GUI
Detector Unit Engineer Client’ entry in the table. The structure of the window is the same as for
the compensation mirror, the top left shows the lookup table data, the top right the service control
buttons. In the bottom area a service panel is located.
Figure 2.10: The detector focus engineer GUI.
20
CHAPTER 2. TECHNICAL SOFTWARE USER MANUAL
The lookup table area
The detector focus service used three lookup tables containing the focus offsets for a filter from the
reference position. For each camera a separate lookup table can be used but it has been proven
sufficient to use only one table for the N1.8 and N3.75 cameras. To configure this, the filenames of
the lookup tables for the two cameras have been set to the same value in the service configuration.
The lookup table has two entries: the ’Filter Name’ is the key for the table and has to be specified
exactly as in the filter unit service described in the next section. Specifically, no spaces (’ ’) should
be present in the filter names for proper instrument operation from scripts. The second parameter
is the focus offset from the reference focus for the camera. This reference focus has been measured
for the combination of the clear and the K filter and is stored in the service configuration. Tables
can be loaded in the same way as for the compensation mirror service and have to be committed
to the service explicitly after they have been edited.
The focus control area
To be able to work properly the detector focus service needs to know three parameters: the
currently selected camera and both filter wheel positions. These can be set using the appropriate
drop down box in the focus control panel in the upper right area of the window. Unlike the
compensation mirror GUI, the current configuration used by the service is shown beneath the drop
down boxes again in a text field with purple background. The focus stage is not moved when new
values are selected from the combo boxes, only the new parameters are set. To move the focus
stage, the buttons on the right side must be used.
Two initialization methods are possible for the focus stage: Either the positive or the negative limit
switches can be used and can be selected with the drop down box below the ’Initialize Unit’ button.
Initialization of the drive is only necessary when the camera has been changed. The routine will
move the stage to one of the limit switches and then back to the reference focus position. To correct
the focus for the currently selected filter combination, the ’Adjust Focus:’ button is used. It will
calculate the sum of the two individual focus offsets from the lookup table and move the stage
accordingly. Below the automatic focus control panel, manual focus movements can be achieved by
typing in focus offset values in the text area and pressing the ’Move Focus’ button. This is useful
for testing purposes, for example. Finally the current focus position is shown below the buttons.
The filter unit service
The engineer GUI for the filter unit service can be used to move the filter wheels directly, initialize
the unit and specify the properties of the filter in both filter wheels.
The user interface can be started using the ’GUI Filter Unit Engineer Client’ entry of the control
center. The following window will appear (see Figure 2.11).
The structure of the GUI is the same as for the other services described above. The lookup tables
are shown in the left area. For each filter wheel a separate lookup table is used. Each entry of
the table consists of 6 fields: The ’Filter Position’ is the key for the table and defines the position
of the filter (1-15) in the wheel. The ’Filter Name’ is shown on all buttons for filter selection,
e.g., the buttons of the engineer window on the right as wall as the buttons in the main instrument
GUI for the observers. The filter names should not contain any spaces, or the filter will not be
selectable from observation scripts. Additionally, the name for the filter that is specified here
defines the name that must be used for the detector focus service (see previous section). The
’Cut-on wavelength’ and ’Cut-off wavelength’ are defined to specify the wavelength (in microns)
where the filter becomes transparent and opaque again, respectively. Values in these fields are
currently not used by the software, but can be used in a future release to prevent unsuitable filter
combinations. The last two entries are used to identify the ’clear’ and ’blind’ filter positions in the
2.3. ENGINEER ACCESS TO THE MAIN INSTRUMENT COMPONENTS SW
21
Figure 2.11: The filter unit engineer GUI
filter wheel. This information is necessary for the correct operation of observation scripts. It is not
necessary to define filters for each position in a filter wheel. Positions for which no information is
provided will be shown as ’Undefined’.
The ’Set Filter Position’ area
The left area of the user interface allows to move the filter wheels into a new position and to
initialize the filter unit service. The initialization simply tests, if the two filter wheels are in a
defined position. If this is not the case, the unit is moved until it reaches the next filter position.
The filter that is in the optical beam is shown with a green background. When a new position is
selected, the desired position is shown in a light yellow color and the panel becomes inactive. It
is thus only possible to move one filter wheel at a time. The progress of the movement can be
followed in the GUI by different buttons turning green, when the corresponding filter is moving
through the optical path. When the new position has been reached the buttons become active
again.
22
2.3.3
CHAPTER 2. TECHNICAL SOFTWARE USER MANUAL
The grating unit service
Figure 2.12: The grating unit engineer GUI
This service controls the positioning of the grating unit and is also responsible for the correct
tilt of the gratings for spectroscopy. The user interface shown in Figure 2.12 can be accessed by
starting the ’GUI Grating Unit Engineer Client’ in the Control Center.
The lookup table area
The lookup tables of the grating unit define the mapping between central wavelengths and tilt
voltage for each of the three gratings. The tables entries contain the following fields: the ’Central
2.3. ENGINEER ACCESS TO THE MAIN INSTRUMENT COMPONENTS SW
23
Wavelength’ is a key for the table and specifies the wavelength that will be focused on the center
of the detector. The ’Tilt Voltage’ is the corresponding voltage that must be applied to achieve
the desired central wavelength and must be within +4.9V and -4.9V. The ’Grating Order’ field
is the second key value in the table and defines the grating order that is used for the entry. For
the service the grating order is used as a filter for the entries to use when tilt voltages must be
interpolated. The only grating that is used in different orders is the high dispersion 210 zJHK
grating. The two other gratings are used in only one order. The ’Tilt Angle’ field is currently not
used by the software and for reference only.
The control panel for the grating unit
Rhe control elements for the grating unit are located in the top right area. The area is split
into two sections: the upper section allows to select the four different unit positions (mirror +
three gratings). The ’Initialize’ button is located there as well. The initialization procedure is in
principle analog to the filter unit service. If the unit is not in a defined position, the unit is moved
until the next defined position is reached. If the grating tilt loop is closed it will be opened during
the initialization. Note: moving the unit to a new position is only possible if the tilt loop is not
closed.
The ’Grating Tilt Control’ area is directly below the position buttons and allows to control the
tilt loop. Two different possibilities exist to tilt the gratings and can be selected by clicking on
the ’set tilt voltage’ or ’set tilt wavelength’ buttons: the former directly applies a set voltage to
the tilt control loop and is used for calibration measurements, for example. The maximum and
minimum allowed voltages are +4.9 and -4.9 volts, respectively. The second one uses a given
central wavelength and looks up the corresponding tilt voltage (depending on the chosen grating
and order) in the lookup tables. Wavelengths that are not present in the table will be interpolated
between the predecessor and successor elements. No extrapolation beyond the lowest and highest
wavelengths in the table is performed. Pressing the ’Tilt’ button closes the loop and applies the
desired voltage (either directly or calculated from the look table) to the tilt electronics. The
currently applied voltage values shown in the panel will begin to change and displayed in red color,
indicating that the tilt loop is closed, but the grating tilt not stable yet. After the tilt has been
stabilized, i.e., three subsequent measurements of the tilt voltage are within the tolerance limits
of the target voltage, the text color changes to green, indicating a stable loop. If the loop can not
be stabilized within a time specified in the service configuration, an error message will appear and
the loop will be opened automatically. When the loop is opened using the ’Untilt’ button, the text
color changes to black again. Note: before a new grating tilt value can be set, a closed loop as to
be opened first by clicking the ’Untilt’ button.
The ’Temperature Mode Control; panel shown in the GUI in the lower right area is
used to switch between ’COLD’ and ’WARM’ operation modes of the tilt electronics.
The ’WARM’ mode must only be used when the instrument is at room temperature
in the integration hall. Switching to the WARM mode when the instrument is not
at room temperature will severely damage the instrument! USE EXTREME CARE
WHEN CHANGING THIS MODE!
2.3.4
The camera wheel service
The camera unit service (see Fig. 2.13) is very simple and has no lookup tables. The engineer GUI
can be started using the ’GUI Camera Unit Engineer Client’ entry in the control center window.
It allows to initialize the camera wheel and to select one of the three different camera positions.
Additionally, the GUI can also be used to move the pupil viewer in and out.
24
CHAPTER 2. TECHNICAL SOFTWARE USER MANUAL
Figure 2.13: The camera unit engineer GUI.
2.3.5
Read out engineer GUI
This GUI (see Fig. 2.14) is similar to the normal user read out GUI described in the LUCIFER
User Manual, but accesses GEIRS directly. More read out modes can be selected that are not
available for the normal user and GEIRS macros can be executed.
Figure 2.14: The read out engineer GUI.
2.3. ENGINEER ACCESS TO THE MAIN INSTRUMENT COMPONENTS SW
2.3.6
25
The MOS engineer GUI
The MOS unit engineer GUI is currently not intended for use for other people than the MOS
specialists at the MPE. A separate manual will be provided from there (LBT-LUCIFER-MAN027).
26
CHAPTER 2. TECHNICAL SOFTWARE USER MANUAL
Chapter 3
Technical procedure manual
3.1
3.1.1
Procedures
LUCIFER safe mode
If the instrument is not in operation for several days, it should be put in safe mode. This means
that the on-instrument electronics MCE/ROE are switched off and the detector put to a lower
temperature of about 60K.
NOTE: During the time needed for the detector to change its temperature, the electronics have to be switched off !
The time for changing between 77K and 60K is approximately 35min. The detector temperature
must be monitored for about one hour to be sure that the expected end point is reached.
When putting the instrument again in operation mode (i.e. detector at 77K), it will take
additionally about 2-3 hours until a stable image can be read from the instrument.
To access the instrument from the engineering account, the laptop used for the MOS cabinet
exchange (user/password known to authorized LBTO personel) or one of the LBTO workstations
(user/password by LBTO) can be used. A NxClient connection to the LUCIFER workstation has
to be build up first, using the engineer user/password. Firefox (or a Web Browser) should be
opened and the ’LUCIFER1 Web-IO Control’ bookmark selected.
From operational to safe mode
First at laptop/workstation: switch ROE and MCE via Web-IO Interface off.
Switching MCE/ROE on/off is the button on the lower right side.
To set the detector to the safe temperature, the following procedure has to be used:
• The software tool can be started either a) by clicking the desktop icon DetectorTemperatureControl) or b) by calling the command ’detectorTemperatureControl.sh’ from a terminal.
• Select option ’2’ (Fig. 3.1) and confirm the setting
For a detailed description of the software tool, refer to LBT-LUCIFER-TN-016.
27
28
CHAPTER 3. TECHNICAL PROCEDURE MANUAL
Figure 3.1: Selection window for detector temperature control
From safe to operational mode
Make sure the ROE & MCE electronics are powered off.
To set the detector from safe to operational mode, the following procedure has to be used:
• The software tool can be started either a) by clicking the desktop icon ’DetectorTemperatureControl’) or b) by calling the command ’detectorTemperatureControl.sh’ from a terminal.
• Select option ’1’(Fig. 3.1) and confirm the setting
For a detailed description of the software tool, refer to LBT-LUCIFER-TN-016.
After reaching the temperature of 77K (NOT before!!!) at laptop/workstation: switch ROE and
MCE via Web Interface on. Switching MCE/ROE on/off is the button on the right lower side.
3.1.2
lms files & cabinet exchange
In preparation for an exchange of masks cabinet (procedure described in LUCIFER-LBT-MAN033), the gerber files need to be collected to be send to the mask manufacturer. At that time the
corresponding lms files have to be collected as well. They are needed for the MOS acquisition.
In preparation of a cabinet exchange an Excel sheet (Fig. 3.2) needs to be prepared for the
engineers. That page needs to contain following informations:
• the mask ID
• Two free columns where the engineers should write the cabinet slot in which the corresponding
mask has been put and the frame # used
• the information from which institute that mask comes from
3.1. PROCEDURES
29
Figure 3.2: Excel sheet with mask information needed prior to a cabinet exchange.
• the mask name (that will appear in the Instrument Control GUI
• the lms filename, where the complete path where this file is stored is writen.
Most of these information are then taken over during the last step of the cabinet exchange,
when the masks are configured. Fig. 3.3 illustrates the information that engineers will have to
update when configuring the masks.
The lms files collected have to be placed on the LUCIFER workstation in the ”Masks lms file”
directory under the engineer account. It has been found practical to define a new subdirectory for
each new observing block, e.g. Mar2010 for all the LUCIFER March 2010 observations. The MOS
acquisition procedure (described in LUCIFER UM 1.2) will work only of the lms file corresponding
to the mask in use is found (and readable) by the software.
3.1.3
Maintenance of the data directory /data/luci
All scientific data taken with LUCIFER end up, on the LUCIFER workstation, in the /data/luci
directory. These data are visible from the observer session but this user only has read privileges.
Before a new science block starts (typically once a month), it is necessary to clean up the disk
space in the /data/luci directory. This must be done as user luci, using the command “ssh -X
luci@lucifer”; no other user (observer or engineer) can delete data from that directory. The maintenance of this directory and check of the available disk space is the responsability of LBTO and
should be included into the list of things to be done during the two technical nights preceding any
science run.
Do not remove directory /data/luci/ComTeamData DoNotDelete !!!
3.1.4
Regular checks of the instrument
In the LBTO operational mode, where an instrument specialist is not always on the mountain
where observations are taking place, it is fundamental that quick checks of the instrument take
30
CHAPTER 3. TECHNICAL PROCEDURE MANUAL
Figure 3.3: Example of the panel, where the new masks have been configured.
place regularly to make sure it is usable for the night.
Actions to be performed at least once a week (by the instrument engineer specialists),
especially when observations are taking place: Go the instrument platform and have a
visual inspection of the instrument
• Check all the cables (nothing loose &/or damaged)
• Check the cooling flow level
• Open the electronic cabinet (below the bridge) and check temperatures/pressures
• Go on the bridge and check the ”on-board” electronics (all cables still well plugged, no damage, ...)
Actions to be performed during the technical nights preceding science runs:
• Check the instrument (as indicated in the daily checks)
• Perform instrument set ups: check grating tilts, calibration unit in/out, lamps functioning
• Make some reads and check the detector (darks and flat field aspects at least)
• Perform some tests observations to check communication with TCS (guiding and active optics)
Actions to be performed daily by the LBTO astronomers on duty, during science runs:
• Log onto the lucifer workstation as engineer
3.1. PROCEDURES
31
• Open a terminal and check the instrument pressures and temperatures. These information
are provided from the command line showSupervisorStatus.sh, which also show the gradients
and alarm status.
• Open firefox, select the ”LUCIFER1 Web-IO Control” bookmarks and check that the ROE
& MCE electronics are on (bottom right information - see section 3.1.1)
• ”Start LUCIFER SW Control”
• Check that all needed servers are started (e.g. telescope, ...). Currently all servers except
the TemperatureMonitorLUCIFER2 & TurboPumpMonitor should be started
• Open the Main Telescope GUI and make sure that UT and LST times are beeing updated.
If that is not the case then there is no data coming from the TCS subsystems , so check and
solve that problem. If the TCS will be down for a longer period, please stop the telescope
service using the software control center. Nevertheless each IIF or TCS restart/reboot needs
also a restart of the LUCIFER Telescope Service!
• Ideally also perform an instrument set-up (from the instrument control)
32
3.2
3.2.1
CHAPTER 3. TECHNICAL PROCEDURE MANUAL
Trouble–Shooting Guide
Software related
Starting the software package
After pressing the start button and waiting for all services, it may happen that the MOS Sequence
Server still has a red light meaning it has not started properly. Therefore it has to be done by
hand: Click in the table on the MOS Sequence Server row (be careful because due to the nx
connection the refresh of the table is a bit slow). Use the right mouse button and choose start
MOS Sequence Server. Wait a few seconds, press refresh table and check if the service is now
running.
Calibration Unit
The error ’Calibration Unit cannot move’ can be ignored as long as the the status in the Instrument
Control GUI changes to ’moving’.
If the communication with the Calibration Unit after several attempts (try at least three times)
did not work properly (’IN’ or ’OUT’ not reacting even though the message ’MOVING Calibration
Unit’ appears ) it would be possible to control this unit via a separate web interface. Open Firefox
bookmark LUCIFER1 Web CalUnit (or use 192.168.0.12) . First one has to log in by clicking on
Config in the left menu.
Choose ’Expert Mode’.
Press button on right top ’Power On’ and reload. Check if left side Power on status is ’ON’.
Press button ’Command drive in’ on right side. Then reload. Check if status ’calibration unit
motor in’ is ’ON’.
Logout via ’config’ ’Session control’ and close the firefox window otherwise communication problems can occur again. The GUI logs the user automatically out after a while. For the next use a
fully new restart of the web page is necessary in order to log in again.
BE AWARE:
The calibration unit will NOT move in/out via scripts.
The calibration unit can be moved in/out at any telescope/instrument position.
Telescope Service
In case of a hanging communication with the IIF/TCS it might be necessary to stop and start
the Telescope service from the Software Control Center (Start Manager). As far as there
is no LST and UT update in the Telescope GUI even something is wrong with the IIF or any
other TCS system. If after a restart on the TCS side the GUI is still not updated a restart of the
LUCIFER Telescope Service is necessary to get it running again.
In case of any not running TCS/IIF the LUCIFER Telescope Service has to be stopped
immediately!!
Error in Subunit
Any errors in a subunit of the instrument is reported by an error message, an error pop up window
and a red background color of the subunit panel. In order to be functional again, pushing the
Initialize button is necessary.
3.2. TROUBLE–SHOOTING GUIDE
33
Figure 3.4: On the web page of the WebIO 2 the calibration unit can be controlled. The ’Inputs’
column show the current status (here power = on and position = out) and the ’Outputs’ column
the available commands power on, power off, drive in, drive out, drive stop
.
Observer GUIs
In case one of the observer GUIs is not working properly (refreshing problems) a restart of this
GUI may help. This can be done by using the different start scripts in the /home/observer/bin
directory: start IMGUI.sh , start RMGUI.sh, start TMGUI.sh.
Read Out GUI
In order to have an error handled procedure which copies the LUCIFER data to the archive, a
kind of rsync daemon has been implemented into the software. When choosing a new, empty save
directory for the LUCIFER images via the Read Out GUI, be sure that as long as there is no first
image in the directory the rsync will produce an error message that it can’t copy *.fits. As soon
as there is a file written to this directory the message will no longer appear.
Engineering GUIs
It may be necessary to resize the engineering GUIs to draw them correctly.
34
3.2.2
CHAPTER 3. TECHNICAL PROCEDURE MANUAL
Hardware related
Pressure Error Message
From time to time an error message will show up in the message panel ’Unable to get instrument
pressures’. This message can be neglected!
Camera Problem
When moving the camera to a new position (mostly the N1.8 position) it can happen that it does
not reach its final position. An error message and a pop up window will appear reporting that
the camera is not initialized. In most cases pressing the Initialize button will help to bring the
camera into the right position.
Filter Wheel Problem
When moving the filter wheels it can happen that they do not reach its final position. An error
message and a pop up window will appear reporting that the camera is not initialized. In most
cases pressing the Initialize button will help to bring the filter wheel(s) into a defined position.
Grating Unit
If the wavelength input is out of the allowed range, an error setting the grating will appear (error
’no predecessor/successor element’). That means, the tilt is out of range. The grating panel will
turn to red. Press Initialize to recover.
At high elevation angles or when the rotator is moving it may not be possible to stabilize the
grating at the desired angle (error ’grating tilt did not stabilize after 60s’)
Try again or wait until elevation is lower.
BE AWARE:
NO wavelength input possible for the 150 Ks grating since this grating is currently clamped at a
fixed angle. If you have set a wavelength for this grating you have to wait the timeout time (60s)
to get the error message. Use this grating only without any wavelength input!
MOS Unit
As soon as the MOS status in the Instrument Control Panel turns to ’unknown’ the MPE MOS
experts have to be called. No other use of LUCIFER is allowed until the problem has been solved.
For more details see the MOS user guide delivered by MPE, Garching (LBT-LUCIFER-MAN-027).
Error: Committing new MOS setup results in no action after pressing the commit button.
Stop & start the Instrument Manager from the Start Tool in the engineer session.
After a restart of the MOS server software the Instrument Control GUI will show the MOS panel
in red, due to a lost connection to the server. The connection will be reloaded by clicking on the
Initialize button.