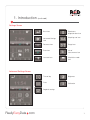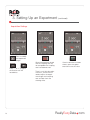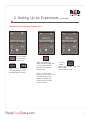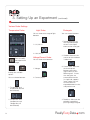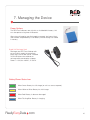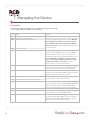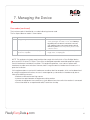
1
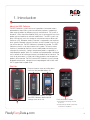
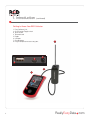
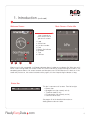
RED User Manual
ReallyEasyData com
Table of Contents
1 Introduction
•
•
•
•
•
3–7
About the RED Collector and start up
Getting to know your RED Collector
Welcome screen and status bar
Main screen and Help screens
Settings screens and Icons
2 Running an Experiment
5. Data Analysis
20–23
• Installing the software plug-in Microsoft® Excel
• Viewing data using the plug-in
• Viewing data using without the plug-in
6. Probe Specifications
8
24
• Ranges, accuracy, and resolutions
• Factory default settings
• Details of operation
7. Managing the Device
3 Setting Up an Experiment
9–19
• Settings Screen
Experiment length (Duration)
Experiment sample rate
Probe range (if applicable)
Unit of measurement
Acquisition/recording mode
• Advanced Settings Screen
Time of day
Date
Regional parameters
Screen brightness
Calibration
9–13
4. Using the USB Drive
25–27
• Power options
• Battery status
• Error codes
8. Additional Support
15–19
•
•
•
•
28
Customer service
Additional resources
Professional development
User network
20
Note:
Pictures, images and descriptions in this manual may not exactly correspond with the actual items supplied.
It is also important to note that the experiments in this manual are only suggestions. They are not meant to indicate
any limitation of the equipment, which can be used in wide range of experiments, depending on the educational
requirement of the teacher.
2
ReallyEasyData com
1. Introduction
About the RED Collector
The RED Collectors system consists of a portable, icon-based, battery
operated data acquisition system for education purposes, supporting a
wide range of probes for different physical measurements. The system is
based on a Data Acquisition Module (DAQ) that is connected to any of the
probes without hardware or software modifications. The RED system supports USB memory sticks for storage of measurement data or direct connection to a PC. Bluetooth wireless interface is supported at the hardware
level; specific Bluetooth software functions are not included in the first version of the software. The RED Collector is tethered to its probe. The RED
Collector maintains a set of parameters for its probe. The touch-screen
interface is intended to allow the user to handle probe functioning and
setup quickly and easily. A plug-in temperature probe is supported as a
second optional probe. When it is inserted, the tethered probe is disabled
and a second set of working parameters are loaded into the interface. The
main set of parameters is saved and will be restored as the temperature
probe is disconnected. The DAQ and the RED Collectors system (except
pluggable temperature, voltage-current and photogate hub can be used
with a support rod or tripod stand.
Start Up
Remove the back cover by sliding down
and insert the provided battery set
An installed button battery will keep
your RED Collector’s date and time
settings when not in use.
Push the ON/OFF button
• Push button until beep sounds
to turn on
• Keep button pushed at least two
seconds for shutdown.
ReallyEasyData com
3
1. Introduction
(continued)
Getting to Know Your RED Collector
1.
2.
3.
4.
5.
6.
7.
8.
Data Collector Unit
On/Off button/Toggle switch
Touchscreen
Tethered cord
Probe
USB port
Charging port
Plug-in temperature accessory port
5
8
7
6
4
1
3
2
4
ReallyEasyData com
1. Introduction
(continued)
Welcome Screen
Main Screen—Probe Idle
1
After 3 seconds or
push sensor icon to
get to main screen
1.
2.
3.
4.
5.
6.
7.
8.
2
3
Logo
Sensor icon
Unit item number
Date
Battery life indicator
Bluetooth
Time
USB icon
4
5
6
7
8
When the unit is left unattended, it will beep and power down in order to save battery life. When the unit is
active in free running mode, the screen will dim first and can be relit by simply touching the screen. If unit
completely powers down, wait several seconds and then press the On/Off button to turn it back on. If the
screen only flashes on, wait several seconds and try again, this time not pressing the button as long.
Status Bar
This bar is common to all screens. From left to right:
• Battery icon
• Bluetooth icon (not currently active)
• Time/Error code (if any)
• PC connection (not currently active)
• USB flash drive status
See pages 25–26 for detailed information on
battery/power and error codes.
ReallyEasyData com
5
1. Introduction
(continued)
Main Screen
Help icon
Progress bar
Information icon
Settings icon
Activate icon (Play)
Record icon
(to collect/acquire data)
Main screen—probe idle
Help Icon
Information Icon
Without the RED USB inserted, this icon will
bring the user to a list of error codes. Touch
the bottom of screen to access second page
of error codes. Press On/Off button to return to
main screen.
This icon gives the user information on serial
number and software version. It also displays
current settings for tethered probe (or plug-in
temperature probe if applicable).
With the RED USB inserted, this icon will bring
the user to operating instructions and list of
error codes. Touch bottom of screen to access
additional pages. Touch top of screen to go
back to previous pages. Press On/Off button
to return to main screen.
6
ReallyEasyData com
1. Introduction
(continued)
Settings Screen
Back icon
Experiment
length/duration icon
Advanced Settings
icon
Sampling rate icon
Decrease icon
Range icon
Enter icon
Unit of
measurement icon
Increase icon
Acquisition mode
icon
Time of day
Brightness
Date
Calibration
Advanced Settings Screen
Regional settings
ReallyEasyData com
7
2. Running an Experiment
Details of Operation
This details the process used to collect data.
4
2
5
3
1
1. Press the green play
icon to make the
probe free running
6
2. Sample rate
3. Experiment length
4. Actual measured value
• Blue Progress bar denotes
data recording in progress
5. Unit of measure
6. Press the “Record”
icon when you want to
begin collecting data
(make sure a USB
drive is connected)
Trend Graph
• Once the acquisition is
complete, progress bar
becomes green and the
blue USB icon will blink.
Push On button to
toggle between
screens
The Min/Max and Average will be
displayed under the trend graph
• Press Blue Stop/Save icon to
end experiment
• Press trash icon to discard data
8
ReallyEasyData com
3. Setting Up an Experiment
Settings Screen in Detail
3
1
2
4
5
6
5
7
8
9
10
11
Upper Row:
1. “Settings” icon brings the user to the settings screen.
2. “Back” icon brings the user to the main screen.
3. The plus denotes user has entered the settings screen. Press to go to advanced settings.
Center:
4. Actual value settings for the specified icon (the gray one on the section below. In this case the
experiment’s length).
5. Use the “–” or “+” icon to scroll through the different choices (the choice will depend on the tethered
probe and if the value to be changed is numeric or a fixed choice).
6. “Enter” icon. Press to confirm the actual value settings.
Bottom (clockwise):
7. Experiment length (Interdependent on the sampling rate value and the available memory).
If mode = event base, this option is not active.
8. Sampling rate (Interdependent on the experiment length value and the available memory).
If mode = event base, this option is not active.
9. Range (if any). It allows the user choices depending on the tethered probe.
10. Unit of measure. Varies dependent on the tethered probe.
11. Mode (time based or event based). Time based will use experiment length and sampling rate
settings. In event mode, the unit will record one data point when the user presses the record button.
ReallyEasyData com
9
3. Setting Up an Experiment
(continued)
Acquisition Settings
Press to modify
the experiment
length
Press “–” or “+” to adjust
the time the until will
record data.
10
When the experiment length
and the sampling rate are
not compatible the sampling
rate icon becomes red.
Once the duration has been
chosen, press the green
enter icon to set the value.
There is an 8,000 data point
maximum, so the user will
need to adjust the experiment length and sampling
rate until both icons are
showing white.
ReallyEasyData com
3. Setting Up an Experiment
(continued)
Modifying the Experiment Sample Rate
Press to modify
the experiment
sample rate
Press “–” or “+” to adjust
how many points should
be collected per second.
ReallyEasyData com
When the experiment
length and the sample rate
are not compatible the
experiment length icon
becomes red.
Once the
sample
rate has been chosen, press the
green enter
icon to set the value.
There is an 8,000 data
point maximum, so the user
will need to adjust the
experiment length and
sampling rate until both
icons are white.
11
3. Setting Up an Experiment
(continued)
Various Probe Settings
Temperature Probe
Light Probe
Photogate
You can choose the range of light
between:
1. 0–2,000 lux
You can choose between:
1. Period: Measures the
time elapsed between
the two “same slope”
events on the same gate.
2. 0–30,000 lux
Press to modify
the experimental
range
Voltage/Current Probe
You can choose the between:
1. Voltage
Press “–” or “+” to scroll
through the available
options.
You can choose between:
1. Temperature (only
temperature data will
be collected)
2. Temperature Raw
(temperature and
voltage data will
be collected)
12
2. Current (Amps)
2. Shadow: Measures the
amount of time the beam
is obscured.
3. Gate to Gate: Measures
the time elapsed
between two events
(light to dark) on two
different gates. If more
than two gates are
connected to the hub
(a single hub supports
up to 4 gates) the unit
will show the time
elapsed between the last
and previous one.
4. Pendulum: Measures the
period of a pendulum
passing through the gate.
ReallyEasyData com
3. Setting Up an Experiment
(continued)
Modifying Unit of Measurement
Press to modify
the unit of
measurement.
Once the unit of measure has
been chosen, press the green
enter icon to set the value.
Press “–” or “+” to
scroll through the available
options based on the
tethered probe.
ReallyEasyData com
13
3. Setting Up an Experiment
(continued)
Modifying Acquisition/Recording Mode
Press to modify the
acquisition/recording mode.
Time Based: Data is acquired
using the current sampling rate
and duration settings.
Press “–” or “+” to toggle between time-based
and event-based
recording.
14
Press the green enter icon to
confirm the mode of acquisition.
Even Based: A single data point
is acquired when the user presses the red record icon.
ReallyEasyData com
3. Setting Up an Experiment
(continued)
Advanced Settings Screen
3
1
2
4
4
5
8
6
7
9
10
1. Press the “Settings” icon twice to access the advanced settings screen.
2. “Back” icon brings the user to the experiment settings screen as well as back to the main screen.
3. A grayed out “+” denotes you are in the advanced settings screen.
4. Use the “–” or “+” icon to decrease/increase the actual value setting.
5. “Enter” icon. Press to confirm the actual value settings.
6. Time in hours and minutes.
7. Date (mm/dd/yyyy or the format chosen in the regional settings).
8. Regional settings (Choice of European or U.S. format for numbers and date.)
9. Brightness of screen.
10.Calibration of unit.
ReallyEasyData com
15
3. Setting Up an Experiment
(continued)
Setting Time
Press to set the
current time.
Press “–” or “+” to adjust
the hour.
Press the green enter
icon to set the value
and move to the
minutes.
16
Press “–” or “+” to adjust the
minutes.
Press the green enter
icon to set the value.
ReallyEasyData com
3. Setting Up an Experiment
(continued)
Setting the Date
Press to set the
current date.
Press “–” or “+” to adjust
the month.
Press the green enter
icon to set the value
and move to the day.
Press “–” or “+” to adjust
the year.
ReallyEasyData com
Press “–” or “+” to adjust
the day.
Press the green
enter icon to set the
value and move to
the year.
Press the
green enter
icon to confirm
the date.
17
3. Setting Up an Experiment
(continued)
Setting Regional Parameters
Press the green enter
icon to set the value.
Press to modify the
regional parameters.
Press “–” or “+” to toggle between formats for
numbers and date.
Setting Brightness
Press to modify
the display
screen’s
brightness
18
Press “–” or “+” to adjust
the brightness
Once the brightness has been
set, press the green enter
icon to set the value.
ReallyEasyData com
3. Setting Up an Experiment
(continued)
Calibration
The following RED probes have predefined calibration values. For most applications, these values
will be sufficient. User may alter these values in advanced settings. To reset the probe to the factory
default settings, press the reset button on the back of the data collector using a standard paper clip.
Factory Default Set of Calibration Values
Probe Type
pH
Gas Pressure
Force
Current/Voltage
Light
1st Calibration Point
2nd Calibration Point
4 pH
1.1 KPa
0N
0 V–0 A
0 (range 0–2,000 lux)
0 (range 0–30,000 lux)
9.18 pH
101.3 KPa
49 N
10 V–0.83 A
850 (range 0–2,000 lux)
10,000 (range 0–30,000 lux)
Calibration Settings
Press to modify
the calibration
screen
Press “–” or “+” to adjust
the first calibration point
Press the green
enter icon to set
the value.
Press “–” or “+” to adjust the
second calibration point
ReallyEasyData com
19
4. Using the USB Drive
Using the USB Drive
• Insert the USB drive in the provided USB slot on
the top of the unit
• User will confirm the settings and press green play
icon and then the red record icon. When the unit has
completed collecting data, press the blue stop/save
icon and wait for the USB symbol on screen to
stop flashing before removing USB drive.
• Data will be saved as a .csv file
• Remove USB drive and connect the USB to your PC
• Install the Microsoft® Excel plug-in software
found on the USB drive
• Begin analyzing the data collected
5. Data Analysis
Installing the Software Plug-in to Microsoft® Excel
• Follow “Wizard” instructions
• With the RED USB drive in your
computer, locate the plug-in file.
20
• After install is complete,
there will be a new menu in
Microsoft Excel named
“RED Chart.”
ReallyEasyData com
5. Data Display
Opening the .csv file for Viewing Using the Plug-in
• .csv file will load as three worksheets:
– RED Chart Main
– RED Chart Data
– RED Chart Graph
• Open .csv file by navigating to your USB drive from
the “Load RED Chart Data”
• Select your .csv file
• RED Chart Main shows a
summary of your probe
and experiment
ReallyEasyData com
• RED Chart Data shows
your recorded data
• RED Chart Graph shows a
plot of the data vs. time
21
5. Data Display
(continued)
Viewing data on a computer without installing the RED plug-in
• Acquire data “From Text”
• Browse to file location and select file
• Follow Wizard steps:
Select “Delimited Characters” and click Next
• Select “Semicolon” (Tab is default)
and click Next
22
• Select any adjustments desired keeping
“General” as your column format
and click Finish
ReallyEasyData com
5. Data Display
(continued)
Viewing data on a computer without installing the RED plug-in
(continued)
• Your file will be reported in two columns
• Top part is probe data
• Bottom is collected data
• “First data line index” denotes beginning of
collected data with time reported in the left
hand column
• From this data you can graph, calculate,
or manipulate as necessary
ReallyEasyData com
23
6. Probe Specifications
Ranges, accuracy, and resolutions
Probe Specifications
Item Number
9200009
9200002
9200001
9200004
9200005
9200006
9200007
9200003
9200008
Probe Type
Range
Accuracy
Resolution
Temperature
Motion
pH
Force
Photogate
Current/Voltage
Gas Pressure
Light
Microphone
(normalized
values)
-30 to 135°C
0.15 to 6 m
0 to 14 pH
±50 N
N/A
±12V, ±1A
0 to 200 kPa
0 to 30,000 lx
0 to 100
±0.5°C
N/A
±0.2 pH
±1%
N/A
N/A
N/A
N/A
N/A
0.1°C
1 mm
0.01 pH
0.02 N
0.1 ms
6 mV, 0.5 mA
50 Pa
0.5 lux
N/A
Factory default settings
User can restore to factory default setup by pressing the reset button on the back of the RED Data
Collector using a standard paper clip.
Temperature
Range
Units
Mode
Sample Rate:
Duration
No raw data
°C
Time
10 s/s
60 s
pH
Mode
Sample Rate:
Duration
Time
10 s/s
60 s
Microphone
Mode
Sample Rate:
Duration
24
Time
100 s/s
0.16 s
Current/Voltage
Range
Mode
Sample Rate:
Duration
Voltage
Time
100 s/s
0.16 s
Light
Range
Mode
Sample Rate:
Duration
Gas Pressure
Units
Mode
Sample Rate:
Duration
Bar
Time
1 s/s
80 s
Force
Units
Mode
Sample Rate:
Duration
N
Time
10 s/s
8s
0.0–30,000.0
Time
10 s/s
8s
Photogate
Shadow
Range
Motion
Units
Mode
Sample Rate:
Duration
m
Time
1 s/s
160 s
ReallyEasyData com
7. Managing the Device
Power Options
The RED Data Collectors now ship with an included brick battery. Unit
can also operate using three AA batteries.
When the main batteries are discharged or removed, the internal clock
and calendar are powered by a coin battery and the settings are stored
in memory.
Single Unit Recharge Cord
Recharge your RED Data Collector with
ease using this cord that conveniently
plugs into a wall or floor socket. Included
micro USB allows data collector to
recharge while connected to a laptop.
Power: 2.1 CA/100–240VAC, 47–63 Hz.
Battery/Power Status Icon
When Green: Battery has full charge (or unit has access to power)
When Yellow or White: Battery has half charge
When Red: Battery is absent or damaged
When Flashing Blue: Battery is charging
ReallyEasyData com
25
7. Managing the Device
Error codes
The time/error code is identified by a number indicating the error code.
The list of possible error codes is shown below:
26
Code
0001
0002
0004
Error
The probe doesn’t respond correctly
Power up of the probe failed
The probe generates wrong reply
0005
0007
Probe wrong type
The calibration values are wrong
0100
No USB device has been detected
0101
Initialization of the USB flash drive failed
0102
Unsupported USB flash drive type
0103
0104
USB flash drive absorbs too much current
No USB flash drive detected
0105
0200
Insufficient space on USB drive to save .csv file
Maximum number of acquisitions was reached (100)
0201
Cannot write .csv file
Action
Turn unit off and on again. If the error continues, reset the
unit by pushing the reset button on the back. Warning!
By pushing the reset button on the back of the unit,
your calibration values and settings will be replaced
with factory values. If the error persists, please contact
customer service.
The calibration settings are wrong and must be replaced
by new manual calibration values or by reloading the
factory calibration values. You can achieve this by
resetting the probe by pushing the reset button on the
back. Warning! By pushing the reset button on the
back of the unit, your calibration values and settings
will be replaced with factory values. If the error
persists, please contact customer service.
Please check if the USB flash drive is securely plugged
into the socket or try another kind of USB flash drive. If
the error persists, please contact customer service.
Please try to format the USB flash drive (FAT16 or
FAT32) or try another kind of USB flash drive. If the error
persists, please contact customer service.
Please try another kind of USB flash drive. If the error
persists, please contact customer service.
Please check if the USB flash drive is securely plugged
into the socket. Also, try to format the USB flash drive again,
(FAT16 or FAT32) or try another kind of USB flash drive.
If the error persists, please contact customer service.
Delete files in order to use the current USB flash drive
Delete files that have been acquired since turning on the
unit, in order to use the current USB flash drive.
If the USB flash drive was unplugged during the
acquisition please plug it again. If the error continues,
please try another kind of USB flash drive. If the error
persists, please contact customer service.
ReallyEasyData com
7. Managing the Device
Error codes (continued)
The time/error code is identified by a number indicating the error code.
The list of possible error codes is shown below:
Code
0300
Error
Settings saving: Flash erasure failed
0500
The experiment length and the sampling
rate are not compatible
Action
Turn unit off and on again. If the error persists, reset the
unit by pushing the reset button on the back. Warning!
By pushing the reset button on the back of the unit,
your calibration values and settings will be replaced
with factory values. If the error persists, please contact
customer service.
To clear the red error icon, please adjust the experiment
length, value, or sampling rate
NOTE: This equipment has been tested and found to comply with the limits for a Class B digital device,
pursuant to Part 15 of the FCC Rules. These limits are designed to provide reasonable protection against
harmful interference in residential installation. This equipment generates, uses and can radiate radio
interference to radio communications. However, there is no guarantee that interference will not occur in a
particular installation.
If this equipment does cause harmful interference to radio or television reception, which can be determined
by tuning the equipment off and on; the user is encouraged to try and correct the interference by one or
more of the following measures:
• Reorient or relocate the receiving antenna.
• Increase the space between the equipment and the receiver.
• Connect the equipment into an outlet on a circuit different from that to which the receiver is connected.
• Consult the dealer or an experienced radio/TV technician for help.
ReallyEasyData com
27
8. Additional Support
Customer Service
You can reach a customer service representative at any of our preferred distributors.
TM
Natural Science
800-962-2660
800-727-4368
800-828-7777
Additional Resources
Training videos and tutorials are available online at reallyeasydata.com.
Professional Development
Need more help developing advanced experiments for the classroom? Learn how to make the
most of your RED Data Collectors with hands-on training led by knowledgeable teachers and
technicians. You’ll gain an in-depth understanding of how the RED Data Collectors work, and
discover the multiple applications for each probe. After completing, you’ll be ready to confidently
implement this technology into your classroom in hands-on, inquiry-based activities. Choose from
a variety of professional development options in either live or interactive webinar-based workshops.
To learn more about our professional development options, please contact our Professional
Development Coordinator at [email protected]
RED User Network
Hear from other teachers who use RED successfully in their classroom on
facebook.com/reallyeasydata.
This device complies with Part 15 of the FCC Rules.
Operation is subject to the following two conditions: (1) this
device may not cause harmful interference, and (2) this
device must accept any interference received including
interference that may cause undesired operation.
28
ReallyEasyData com