1
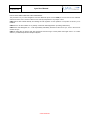
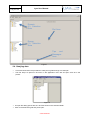
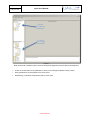
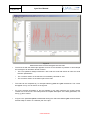
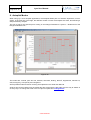
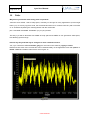
Lynx 2 The UAV Navigation Technical Debriefer User Manual PATH:\development\products\Lynx\doc\manuals WARNING: THIS DOCUMENT IS CONFIDENTIAL INFORMATION. IT IS RELEASED TO PARTIES AUTHORIZED BY UAV NAVIGATION ONLY, AND UNDER NON-DISCLOSURE AGREEMENT. VIEWING THIS DOCUMENT BY PARTIES OTHER THAN THOSE EXPLICITLY AUTHORIZED BY UAV NAVIGATION IS STRICTLY PROHIBITED. IF YOU HAVE RECEIVED THIS DOCUMENT IN ERROR, RETURN IT TO UAV NAVIGATION. UAV Navigation S.L. C/ La Granja, 74 28100 Alcobendas Madrid. ESPAÑA CIF B84025840 www.uavnavigation.com All rights reserved CONFIDENTIAL INDEX 1. INTRODUCTION....................................................................................................................................................................4 1.1. 2. INSTALLATION AND OPERATION ..................................................................................................................................4 2.1. 2.2. 2.3. 2.4. 2.5. 3. INSTALLATION OF LYNX .......................................................................................................................................................4 LYNX TRIAL VERSION ...........................................................................................................................................................4 START DEBRIEFING ...............................................................................................................................................................4 STUDYING DATA ...................................................................................................................................................................5 AUTOPILOT PROBES PLOT...................................................................................................................................................16 REAL TIME DATA...............................................................................................................................................................16 3.1. 3.2. 3.3. 3.4. 4. LYNX OVERVIEW ..................................................................................................................................................................4 CONNECTION ......................................................................................................................................................................16 CONFIGURATION.................................................................................................................................................................17 DATA VISUALIZATION EXAMPLE .........................................................................................................................................17 REAL TIME ATTITUDE AND HEADING REFERENCE SYSTEM (AHRS)...................................................................................19 SPECIAL PLOTS ..................................................................................................................................................................20 4.1. DOUBLE VARIABLES ...........................................................................................................................................................20 5. UTC, TOTAL, MISSION AND FLIGHT TIME SELECTION........................................................................................22 6. UNITS .....................................................................................................................................................................................24 7. ALARMS ................................................................................................................................................................................25 8. AUTOPILOT MODES ..........................................................................................................................................................27 9. EXPORT DATA TO GOOGLE EARTH ............................................................................................................................28 10. FAQS .......................................................................................................................................................................................29 CONFIDENTIAL Ed. 04 Pag 3 of 30 Lynx User Manual LEGAL DISCLAIMER AND END USER AGREEMENT The purchaser of Lynx UAV Navigation Technical Debriefer (from hereon USER) is the end user for this software and will not sell it, loan it, lend it or allow it to be used by third parties in any shape or form. USER will use this software lawfully and abiding all local regulation for the operation of computers on which Lynx is installed. USER will not use this software in any military or defense related application (including observation). USER clears UAV Navigation, S.L. of all responsibility and liability derived from the use of Lynx, even in the event of a failure of Lynx. USER is responsible for abiding with this agreement and enforcing it to third parties that might come in to contact with the Lynx Data Reproduction Graphical System. CONFIDENCIAL Ed. 04 Lynx User Manual Pag 4 of 30 1. INTRODUCTION Lynx 2.0 is UAV Navigation’s ultimate software for data visualization. Lynx 2.0 receives and plots data recorded on a .uav data log files. 1.1. Lynx overview Lynx provides graphs representing: All the variables recorded in a data log file. Multiple plots of the same flight with the same time axis and different vertical scale. Easy and intuitive mode of handling data plots. Lynx introduces flight-recorded data directly from .uav files. 2. INSTALLATION AND OPERATION 2.1. Installation of Lynx Lynx is already an executable file and it does not need any installation although Lynx uses the Java Virtual Machine that needs to be installed on the machine. 2.2. Lynx trial version Lynx can be downloaded for free in a trial version from the UAV Navigation Help Desk website to use without license dongle. IMPORTANT NOTES: • This version will only allow a limited type of parameter plots o For the X axis only time or samples related parameters are available. o For the Y axis almost all autopilot variables can be plot, except some gps, guidance and alarms parameters. • Also, every plot will have a UAV Navigation watermark on the background. • All the functionality remaining is similar to the licensed version. 2.3. Start debriefing First step is executing Lynx with the licensed dongle on the USB port. The initial interface is as simple as: CONFIDENCIAL Ed. 04 Lynx User Manual Pag 5 of 30 Domain (X) Selection Area Plot Area Range (Y) Selection Area Tips and Messages Area Figure 1 2.4. Studying data: • This manual will show the procedure to study the log files through one example. • The first step is to press on file menu on the application menu bar and open a file as in the picture: Figure 2 • An open file dialog opens with the .uav files shown on the selected folder. • Click on the desired log file and press open. CONFIDENCIAL Ed. 04 Pag 6 of 30 Lynx User Manual Figure 3 • We can press on the Range Parameters tree and start to look for the ones that could be interesting for our study. • The parameters tree is created to simplify the search for a particular parameter. Looking for the accelerometer in the z axis, we open the sensors folder, then IMU (stands for Inertial measurement unit). • Lynx will use samples as a default for the X axis if no domain parameter is selected before selecting a range parameter. If the intention is to use a different time or parameter for the X axis it has to be selected before than the Y axis parameter. • Looking at the Domain Parameters area not only time related parameters appear, Lynx can cross any parameter you may choose from the log file. CONFIDENCIAL Ed. 04 Pag 7 of 30 Lynx User Manual 1.-Select the domain parameter 2.-Select the range parameter Figure 4 NOTE: Once the file is loaded its name is shown on the top of the application and on the tips and messages area • Press on the checkbox of the parameter to study on the Range Parameters area (Y axis). • Many parameters can be plotted on the same chart. • Deselecting a checkbox will erase the plot from the chart. CONFIDENCIAL Ed. 04 Pag 8 of 30 Lynx User Manual Figure 5 NOTE: that the X axis cannot be changed for the same chart. • The first chart with the desired plot appears as soon as the checkbox is pressed. In this example the roll angle of an aerobatic aircraft is shown. • The curve plotted is always linked with a box under the chart that shows its name and units between parentheses. • The Y scale is shown on the left side not necessarily centered on zero. • The X scale is shown on the bottom part of the chart. • The chart can be completed by, for example selecting pitch and yaw checkboxes. The curves will appear one by one as shown on the figure 6. • For more accurate information a tool tip appears in the chart whenever the mouse pointer crosses one of the curves. This tooltip shows a complete description of the data (parameter, unit and (x,y) pair of values. • In figure 7 the parameter pitch is deselected leaving the chart with roll and yaw curves and also another tooltip is shown on a different part of the plot. CONFIDENCIAL Ed. 04 Pag 9 of 30 Lynx User Manual Tooltip information Figure 6 Figure 7 CONFIDENCIAL Ed. 04 Pag 10 of 30 • Lynx User Manual Suppose the chart in figure 7 is interesting and we want to compare against other flight parameters of the log file, the chart can be kept in the next three ways: • Double click with the mouse left button anywhere on the Plot Area and the chart will be unleashed from the application with identical properties to a new independent frame. Figure 8 • On the File menu select Export to PDF; this will open a file dialog permitting the folder exploring and name selection. Figure 9 CONFIDENCIAL Ed. 04 Pag 11 of 30 • • Lynx User Manual Right click on mouse anywhere on the chart except over curves will open a pop-up menu with a Save as… option. This will be a png file save (stands for Portable Network Graphics) very suitable for plots file saving in lightweight. For the next chart suppose your desire is to compare between acceleration on the Z-axis of the aircraft and velocity. As a result the chart on figure 10 appears: Figure 10 • The first thing to observe is the difference between scales, which makes it difficult to compare accurately. This issue can be solved right clicking on the curve you wish to change scale. A different pop-up menu than the one popping on the rest of the chart appears with one option with the text Change Scale, left clicking on that option will create the new scale and send that curve under it: Figure 11 CONFIDENCIAL Ed. 04 Pag 12 of 30 Lynx User Manual New velocity scale Figure 12 • Repeating the step to unleash the chart from the main frame both independent frames can be operated to make as easy as possible the study, side by side as in figure 13 or changing the size and position until reaching similar X axis scales as in figure 14: Figure 13 CONFIDENCIAL Ed. 04 Pag 13 of 30 Lynx User Manual Figure 14 • The chart operation is really intuitive: • Zoom-in sequence can be done at any moment by clicking the left button and dragging through the desired zone (which will be shadowed) from top to bottom and left to right: Zoom Out Zoom In Figure 15 CONFIDENCIAL Ed. 04 Pag 14 of 30 Lynx User Manual • Zoom-out sequence is the exact opposite in the mouse movement, from bottom to top and right to left of the chart. Actually this sequence will reset the plot to the starting point. • Mouse wheel can be used also for zooming in and out, being the focus of the zoom the position of the mouse pointer on the chart. • Pop-up menu has options to reset the chart to the start point (AutoRange) and to zoom-in (out) in the X axis, Y axis or both of them, as shown in figure 16: Figure 16 • Properties in the pop-up menu is used for the full customization of the chart: • As default the chart does not have a title, but for report generation is crucial to have one on each plot. On the properties dialog on the title tab we can select the Show Title tab. Figure 17 CONFIDENCIAL Ed. 04 Pag 15 of 30 • Lynx User Manual The font and the color of the title can be changed easily with three different types of dialogues in figure 18: Title dialogues Figure 18 CONFIDENCIAL Ed. 04 Pag 16 of 30 • Lynx User Manual To get the following chart with title: Figure 19 • There are a lot of oher customizations available in the properties menu, on the plot tab the properties of both Domain and Range Axis, such as colors, ticks, font and range: Figure 20 CONFIDENCIAL Ed. 04 Lynx User Manual Pag 17 of 30 • In the Appearance tab we can customize as seen in figure 21: • the outline stroke with some different kinds of lines, • the outline and background paint • and the orientation of the plot (vertical or horizontal) Figure 21 2.5. Autopilot Probes Plots Probes are software special variables used for exceptional applications or software debugging issues. Those values can be shown in Lynx 2 in Range Parameter tree on the PROBES leaf. The different probes in AP04s go from 0-255 but only three will be possible for selection for space reasons. To select the probe values from those 256, click on the main program menu bar-> options item -> General tab, on the lower part of the panel (as shown in figure 23 next page). 3. Real Time Data 3.1. Connection Lynx 2 can connect to any UAV Navigation data source (all autopilots, EFIS, Visionair, or User Tools via the application player) through serial port, UDP or TCP connections. Click on the main menu bar and click connect to… and a connection dialog will arise to select the connection method to the data source. Once the connection is made Lynx 2 behaves the same way as the offline file debriefer. Figure 22 CONFIDENCIAL Ed. 04 Pag 18 of 30 Lynx User Manual 3.2. Configuration Real-time data plot can be memory expensive, for this reason one of the application’s General options tab gives the possibility to select the máximum number of samples for each plot after which the array hosting the data will not get bigger and the plot will slide leftwards. Figure 23 3.3. Data visualization example A good visualization process can be achieved with some graphs showing related plots all synchronized and receiving data. For instance: • Once connected we click the Pitch checkbox on the State->Attitude leaf of the Range Parameters tree: Figure 24 CONFIDENCIAL Ed. 04 Pag 19 of 30 Lynx User Manual • Double-clicking on the pitch plot will move it out of Lynx 2, but it will keep on receiving data. • We can then do a plot of altitudes (HBAR, GPSALT) Figure 25 • And then other plots that could interest in the real-time analysis like Roll and all the accelerations Figure 26 CONFIDENCIAL Ed. 04 Pag 20 of 30 Lynx User Manual 3.4. Real time Attitude and Heading Reference System (AHRS) When any of the family of UAV Navigation systems is connected to Lynx 2, a menu called AHRS is enabled on the Options part of the main program menu bar. This item creates an independent from Lynx 2 frame, with an standard aviation attitude and heading reference system. This AHRS shows the Attitude, Heading, KIAS (IAS in knots), KGS (Ground Speed in Knots) and AZ (Acceleration in Z-axis in Gs), altitude (in feet), a typical aeronautic sideslip ball and mission time of the system connected to Lynx 2 as shown in figure 27. Figure 27 The “Options” menu in the AHRS frame, as seen in the figure 27 gives the possibiity to toggle the “always on top” property of this frame, making easier to handle its visibility. The other option gives the opportunity to toggle between a normal overlay AHRS like the one on figure 27 or a head up display type of AHRS as in figure 28. Figure 28 CONFIDENCIAL Ed. 04 Pag 21 of 30 Lynx User Manual 4. Special plots 4.1. Double Variables On the lower part of the Range Parameter tree the last folder is named Double Vars. This folder holds useful two dimensional plots to add afterwards a third parameter overlayed. • Let’s plot lat & lon from a oval air race track: Figure 29 As shown on previous points we zoom to the track and click right button over the curve plotted, this will show the pop-up menu with the option Add Var, this variable will be the third parameter to plot. Figure 30 CONFIDENCIAL Ed. 04 Pag 22 of 30 • Lynx User Manual The Z-axis values in G units is shown overlayed over the track, with a color coding that can be selected on the menu bar the options item -> preferences -> G plot Options. The dialogue shows 10 different color boxes with a select button and a spinner. The color on each box will be used on the overlay on those parts in which the acceleration on the Z-axis is above the level on its spinner and below the next one. Figure 31 • There is another spinner with the text G Step wich permits us to change the step between how many samples the overlays will be shown. In this way, the higher the number, the fewer the number of overlays. In the figure 31 stands that there will be one overlay each 25 samples of log file. Figure 23 has one overlay each 200 samples, and has been zoomed in to show the curves with more detail. Figure 32 CONFIDENCIAL Ed. 04 Pag 23 of 30 Lynx User Manual 5. UTC, Total, Mission and Flight Time selection Lynx 2 not only can plot against samples (default), it can plot against all the times used in the AP04 system and even between other crossed parameters. One of the singularities in plots against Mission Time, is that this time can be reset to zero, thus having the possibility to have back time jumps like in figure 33: Figure 33 To search for specific parts of the log file it does not make too much sense to use the usual Lynx 2 zooming property, the proper way to zoom in this case is opening the Preferences window inside the Options main application menubar item and clicking on the Mission Time Selection tab: Figure 34 CONFIDENCIAL Ed. 04 Pag 24 of 30 Lynx User Manual This tab shows a Mission Time against samples plot, and a couple of labels showing the under and upper limits selected. A selection can be made on this plot activating a change in the main plot which will show only the samples selected: Figure 35 As we can see, now only the part of the flight selected is shown. This way of zooming, can be used for all the other AP04 times and even with samples. CONFIDENCIAL Ed. 04 Pag 25 of 30 Lynx User Manual 6. Units Lynx has a complete set of unit tooling. All international and aeronautic units are supported, as well as other used in different communities. All the possibilities are together under the units dialog found under the menu bar -> options -> preferences -> Units tab and looks like figure 36: Figure 36 Int. System button: is a short-cut button to make the international unit system used on next plots. Aero. System button: is a short-cut button to make the Classic Units used in aeronautics used on next plots. Other than the short-cut buttons,units can be selected manually one by one, thus making possible to mix different unit systems if desired. CONFIDENCIAL Ed. 04 Pag 26 of 30 Lynx User Manual 7. Alarms Lynx alarm plots are different from the rest of the plots, as they can only show two values (thrown or not thrown) for visibility reasons those values are painted as ‘1s’ and a ‘-1s’ values respectively. In the figure 28, the GPS alarm has been painted and it is easy to determine that it has been thrown seven times Figure 37 Only one alarm can be shown at a time (for visibility reasons too) but other variables can be plotted to compare against the actual alarm as in figure 29 where the same GPS alarm has been compared to the ROLL angle of the aircraft: Figure 38 CONFIDENCIAL Ed. 04 Pag 27 of 30 • Lynx User Manual Alarms and meanings: att : lul : gnd: dgps: tsr: py0: py1: ax: eng: utc: gps: tmp: hgy: v1: v2: rst: acc: rg: imu: mag: ps: qd: agl: sul: rpm: g2d: bng: "attitude out limits" "long uplink loss" "on ground" "dgps" "temperature sensor failure" "payload on uart0 fail” "payload on uart0 fail" "forward acc. out limits" "engine failure" "utc out of sync" "gps no fix" "temperature out range" "high angular velocity" "system voltage out range" "servo voltage out range" "system reset" "accelerometers out range" "rate gyros out range" "imu out range" "magnetometer out range" "static pressure out range" "dynamic pressure out range" "agl limit exceeded" "short uplink loss" "rpm out range" "gps on 2d" “bingo time reached” CONFIDENCIAL Ed. 04 Pag 28 of 30 Lynx User Manual 8. Autopilot Modes When using Lynx 2 for autopilot applications, the Autopilot Modes plot is of extreme importance, since it shows, in the time line of the flight, the different modes in which the autopilot was used, thus allowing a deeper telemetry analysis. The way to ask for this special plot is clicling on the Range Parameters-> System -> Modes leaf of the Range Parameters tree. Figures 39 The modes are: manual, pitch and roll, directed, automatic, landing, take off, hippodrome, manual hot, safe, emergency, hold (hover) and navigate to. All the possible modes and their meaning are explained in the AP04 User Manual. Another plot can be overlaid over the modes plot but will change the left scale, then the way to analize in an easy way is to change the scale of the new plot as explained in Change Scale CONFIDENCIAL Ed. 04 Pag 29 of 30 Lynx User Manual 9. Export data to Google Earth Lynx 2 gives the opportunity to create ready-to-import files for the freeware application Google Earth, those files are extended with .kml word and with a double-click are automatically executed overlaying the trajectory of the flight studied, thus giving a much more realistic and easy to handle vision of the flight than the 2 dimensional lat-lon plots, as shown in figures 34. The kml file can be created once the UAV file has been loaded enabling the Export to Google Earth… menu item on the file tab of the main menu bar. The file will be named as the source UAV file, and it will be created under the same folder. Figures 40 CONFIDENCIAL Ed. 04 Pag 30 of 30 10. Lynx User Manual FAQs: Why does Lynx freezes when many plots are painted? JVM uses as a default 1 Mb of heap space, clearealy not enough for many applications (one amongst them Lynx). If a heavy log file is used, the recommended action is to create a batch file (.bat in windows or .sh in MacOS X) altering the JVM arguments with the commands: java -Xmn100M -Xms500M -Xmx500M -cp Lynx.jar lynx.Main This way Lynx will be launched with 500Mb of heap space and 100Mb os new generation class space, thus allowing space enough. Is there any easy and fast way to change to a more contrasted colors? Yes, Lynx 2 has three different themes, gray (the one used on this manual), legacy and dark. Dark theme has much more contrast and can be selected easily on the application menu bar options -> theme -> dark and creates charts as the one on figure 41: Figure 41 CONFIDENCIAL